Single cell transcriptional signatures of the human placenta in term and preterm parturition
- Wayne State University, United States
- Wayne State University School of Medicine, United States
- Eunice Kennedy Shriver National Institute of Child Health and Human Development, National Institutes of Health, U.S. Department of Health and Human Services, United States
- University of Michigan, United States
- Michigan State University, United States
- Detroit Medical Center, United States
Figures
Figure 1 with 8 supplements
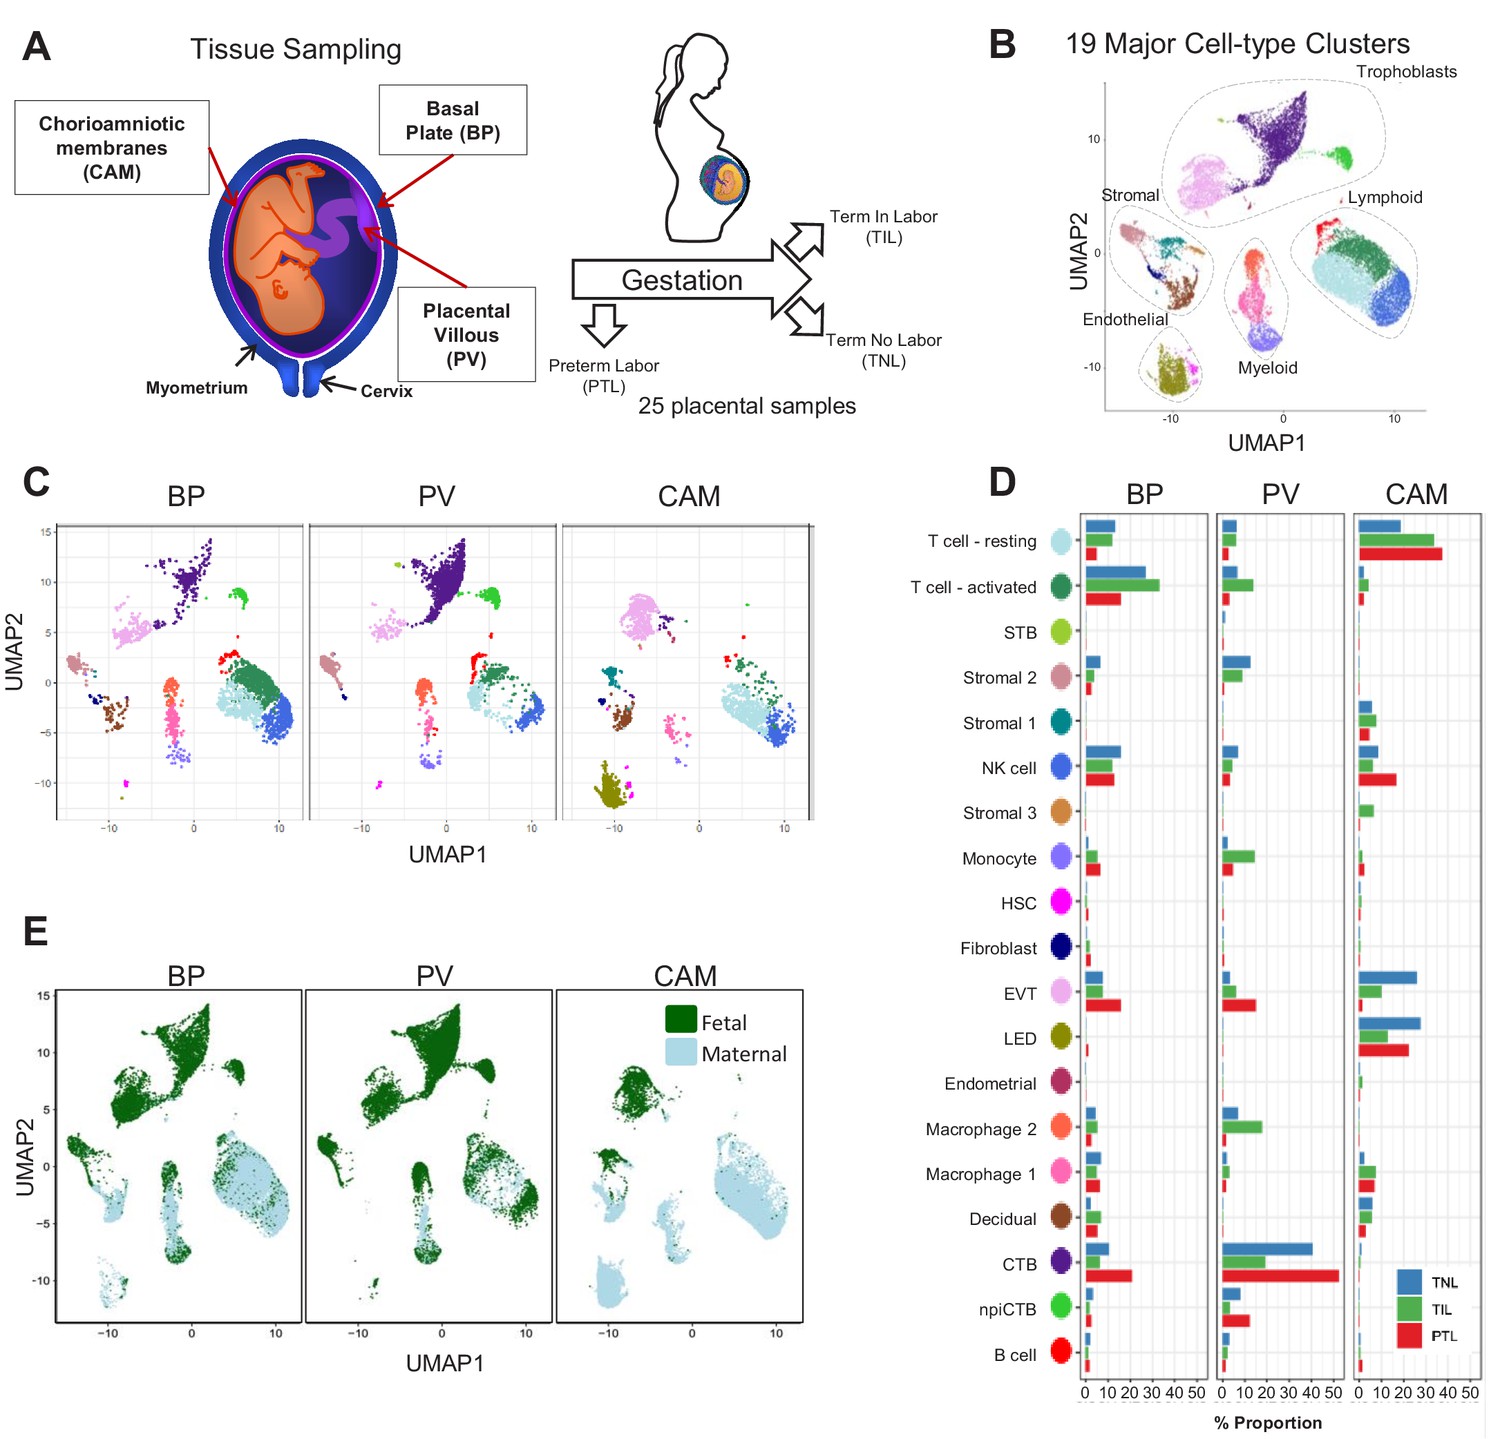
Transcriptional map of the placenta in human parturition.
(A) Study design illustrating the placental compartments and study groups. (B) Uniform Manifold Approximation Plot (UMAP), where dots represent single cells and are colored by cell type. (C) Distribution of single-cell clusters by placental compartments. (D) Average proportions of cell types by placental compartments and study groups. (E) Distribution of single cells by maternal or fetal origin. STB, Syncytiotrophoblast; EVT, Extravillous trophoblast; CTB, cytotrophoblast; HSC, hematopoietic stem cell; npiCTB, non proliferative interstitial cytotrophoblast; LED, lymphoid endothelial decidual cell.
Figure 1—figure supplement 1

Heatmap of the top gene expression markers defining each cell-type.
Each row represents a gene marker, and color represents normalized and scaled gene expression values derived from Seurat. Cell-type colors are consistent across all figures in this paper unless otherwise indicated.
Figure 1—figure supplement 2
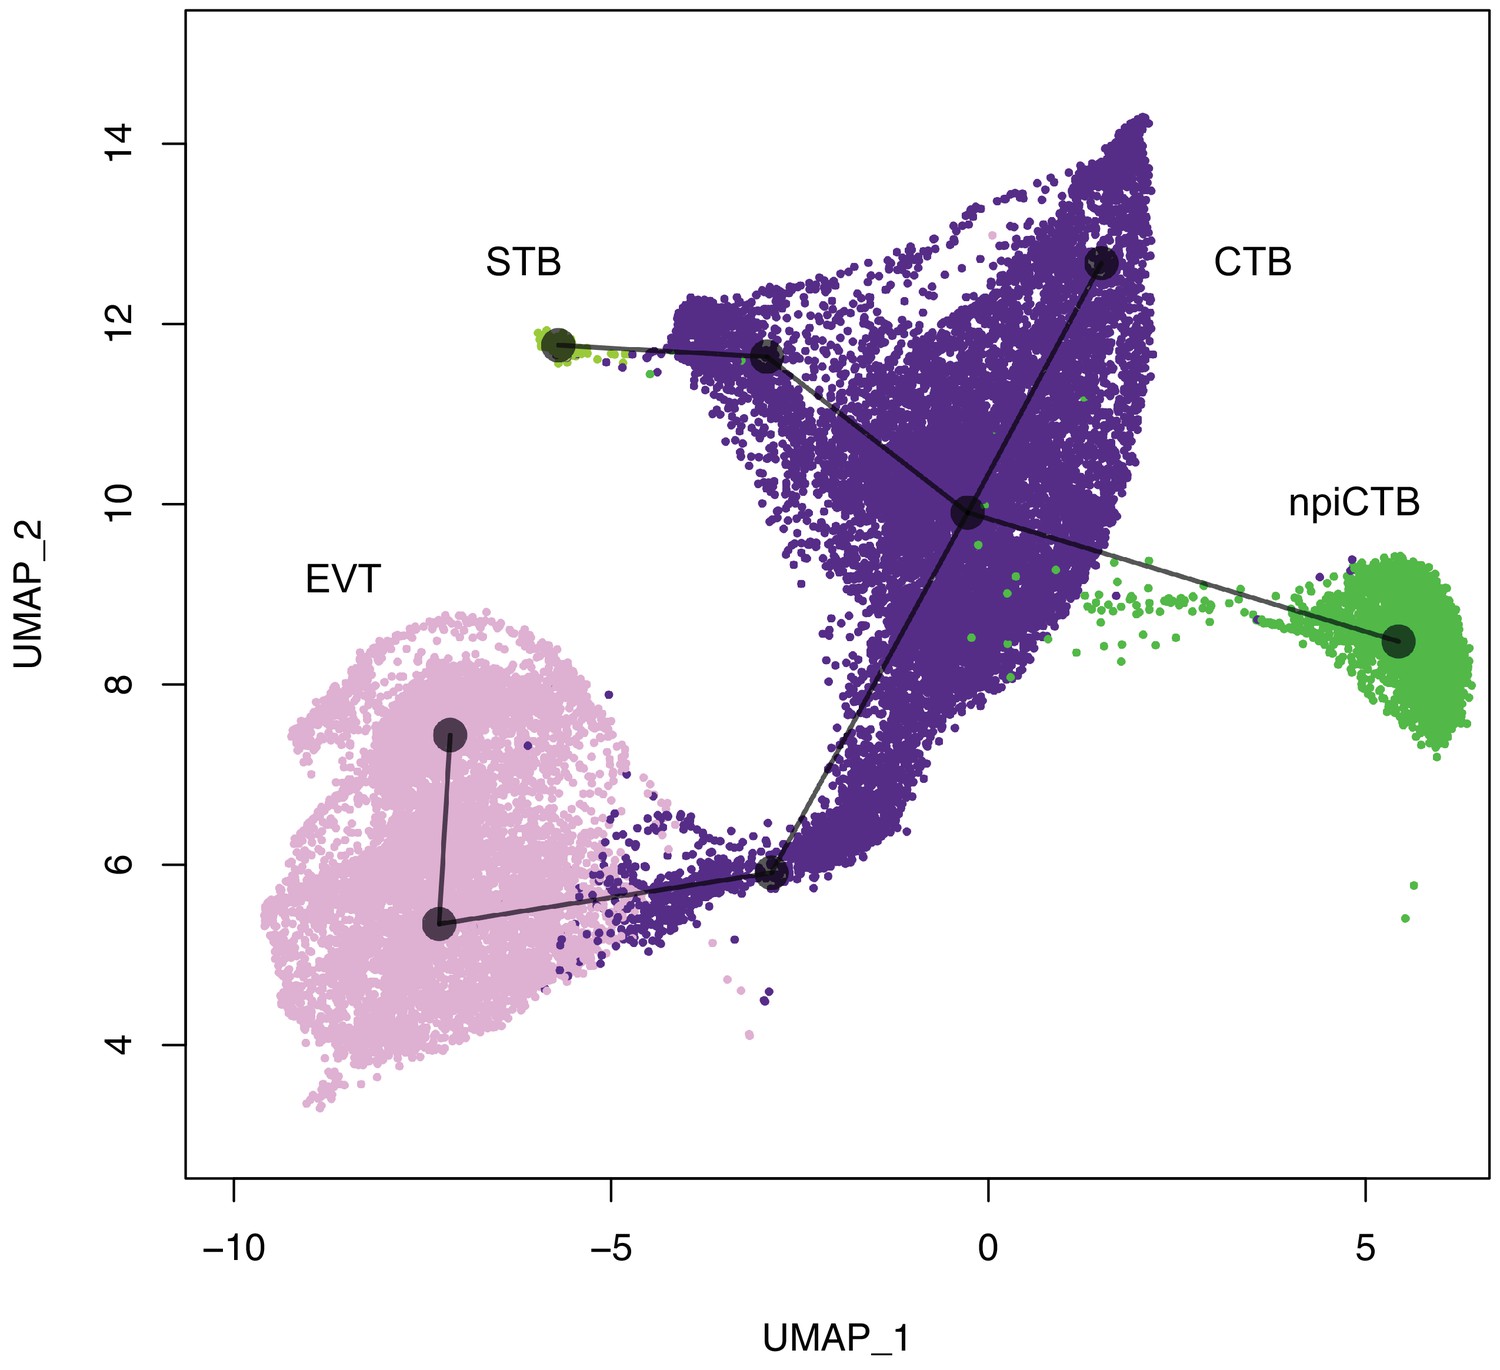
UMAP plot highlighting the trophoblast cell-types and their inferred differentiation path using slingshot R package.
Lines reconstruct the most likely differentiation path of the different cell-types starting for cells that may be in a trophoblast progenitor state. The first branch seems to separate EVT from CTB; then CTB splits in STB and npiCTB. STB, Syncytiotrophoblast; EVT, Extravillous trophoblast; CTB, cytotrophoblast; npiCTB, non proliferative interstitial cytotrophoblast.
Figure 1—figure supplement 3
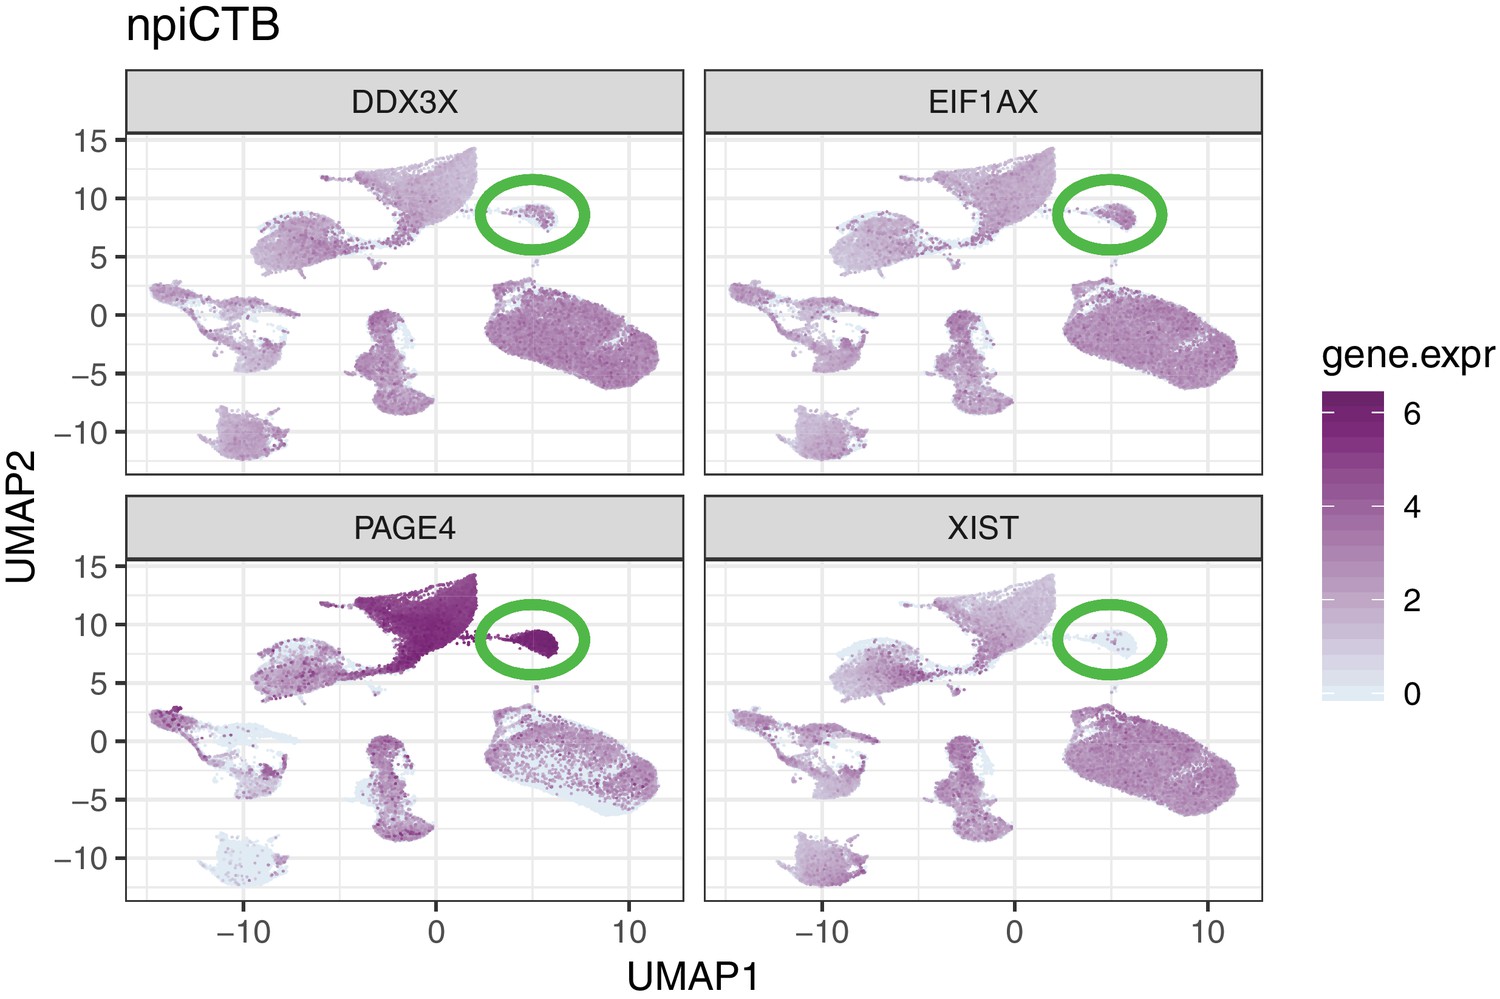
Single marker gene expression UMAP plot for genes differentially expressed between CTB and npiCTB.
npiCTB cell-type is highlighted inside the green circle. CTB, cytotrophoblast; npiCTB, non proliferative interstitial cytotrophoblast.
Figure 1—figure supplement 4

Analysis of the fetal/maternal origin of the cell-types based on data from three pregnancies with a male fetus.
For each cell, an index is derived that represents the total number of reads mapping to the Y chromosome genes divided by the total number of reads mapping to autosomal chromosomes. (A) Density plot across all cells of the Y index. (B) UMAP plot where each facet represents a different placental compartment and each cell color is scaled proportionally to the Y index.
Figure 1—figure supplement 5
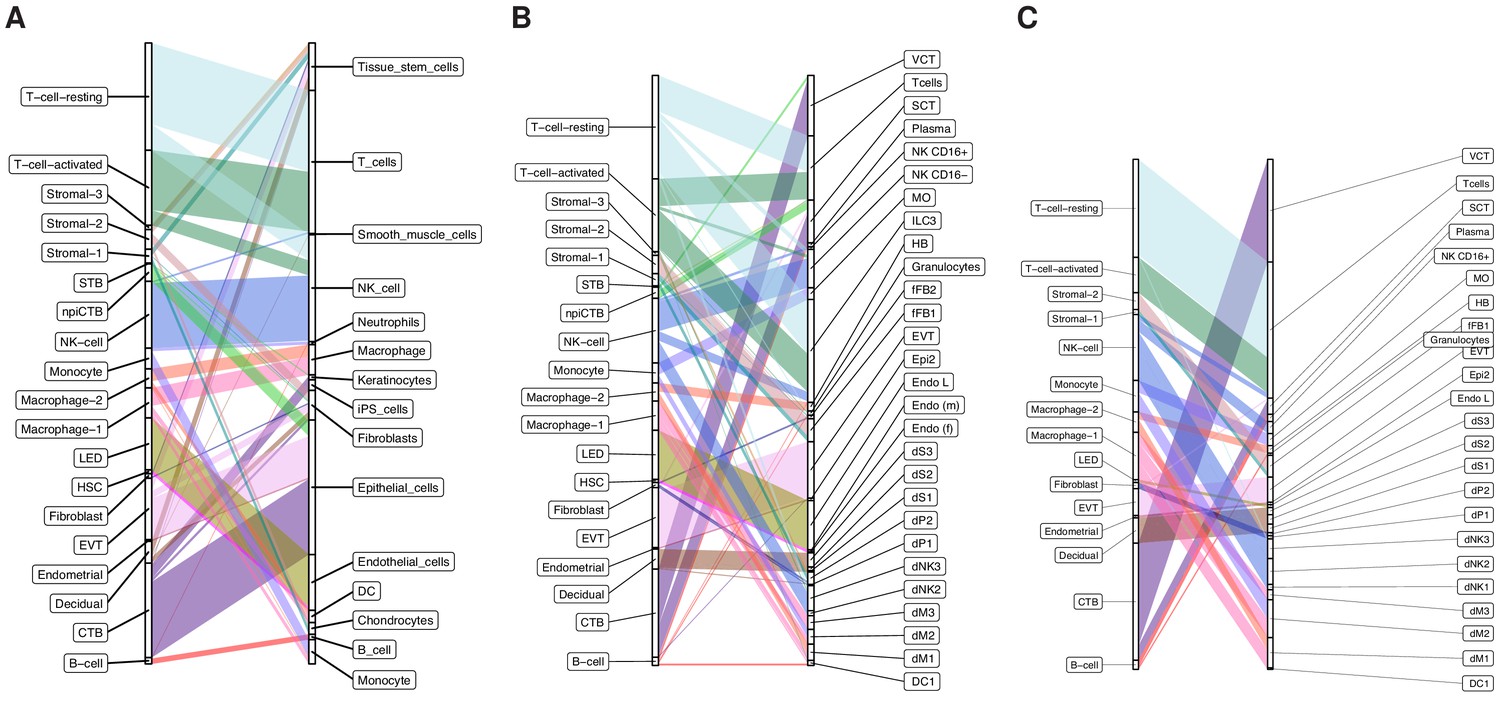
Alluvial diagram showing the correspondence between our final curated cluster labels and automated cell-labeling methods.
(A) SingleR method using the human primary cell atlas (HPCA) reference panel Aran et al. (2019), (B) SingleR method using the human placenta in the first trimester (HPFT) reference Vento-Tormo et al. (2018), (C) Seurat label transfer method using the HPFT reference Stuart et al. (2019).
Figure 1—figure supplement 6

Heatmap showing the correspondence between our final curated cluster labels and automated cell-labeling methods.
(A) SingleR method using the HPCA reference panel Aran et al. (2019), (B) SingleR method using the HPFT reference Vento-Tormo et al. (2018), (C) Seurat label transfer method using the HPFT reference Stuart et al. (2019).
Figure 1—figure supplement 7
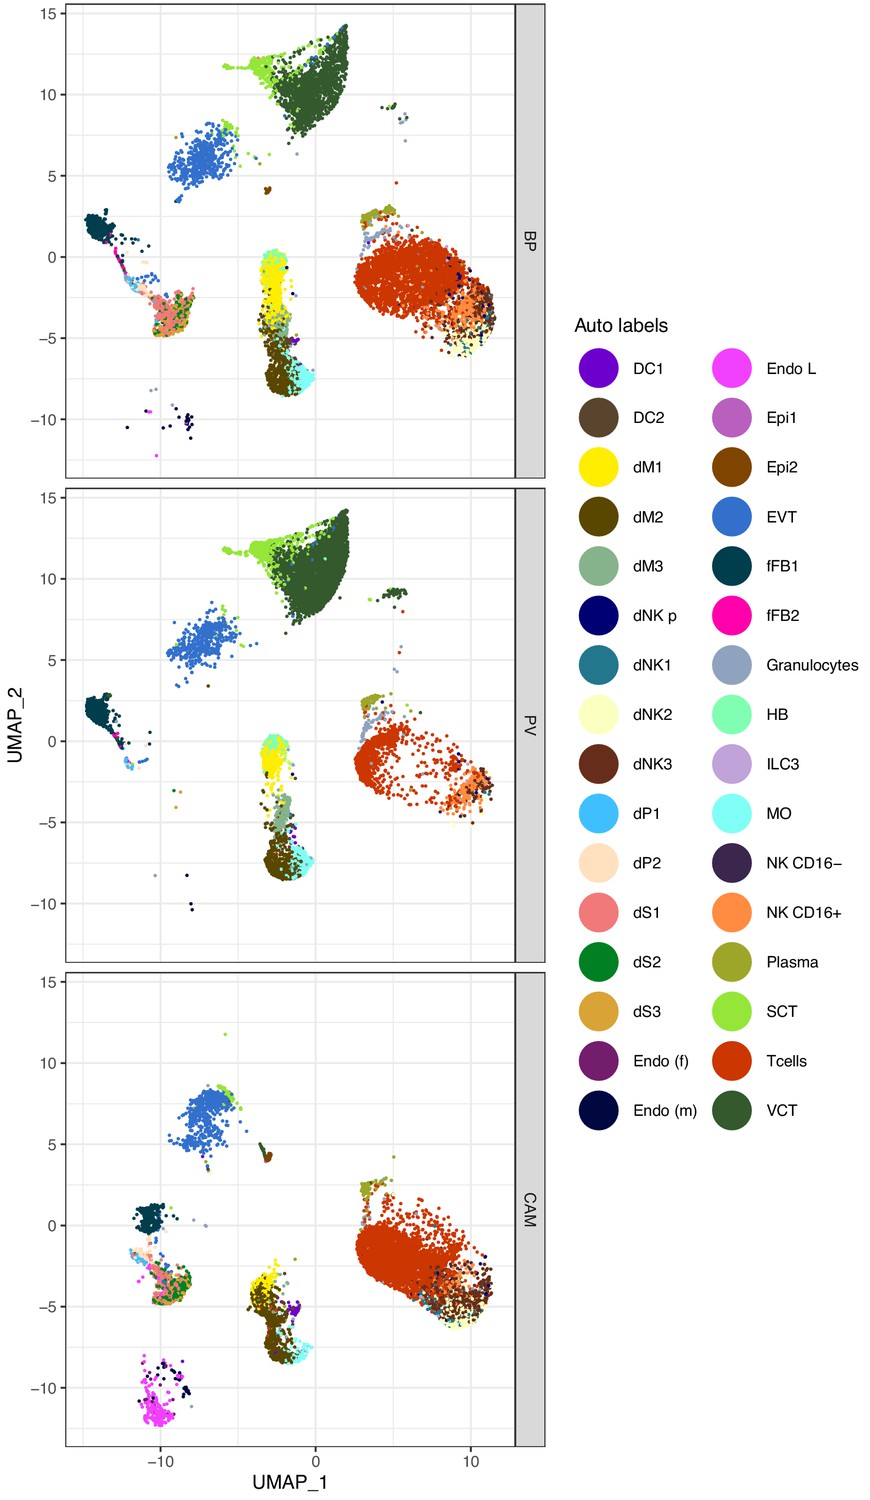
Uniform Manifold Approximation Plot (UMAP), where dots representing single cells and color represents Seurat predicted cell type labels.
To determine the cell-type we used Seurat label transfer function and the HPFT panel as a reference Vento-Tormo et al. (2018). Only cells with a label transfer score >0.001 are shown.
Figure 1—figure supplement 8

Doublet analysis by DoubletFinder.
(A) UMAP plot showing cells identified as potential doublets (shown on top to avoid occlusion by the more common singlets) by DoubletFinder McGinnis et al. (2019) (B) % of cells for each cell-type that are predicted as potential doublets (overall average = 0.898%).
Figure 2 with 4 supplements
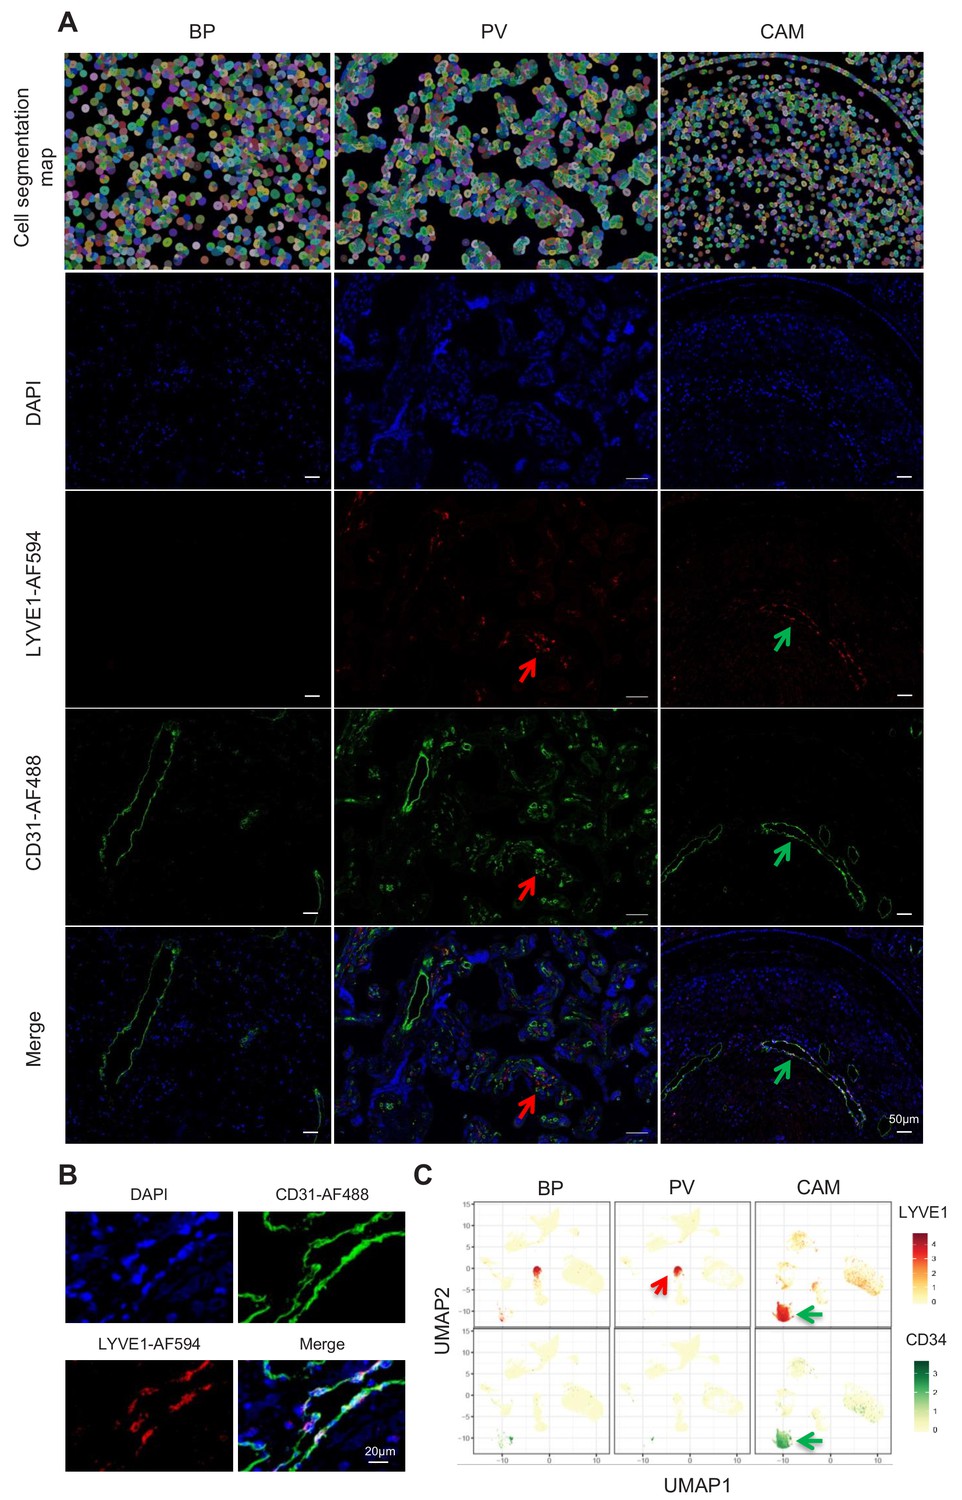
Identification of LED cells in the chorioamniotic membranes.
(A) Cell segmentation map (built using the DAPI nuclear staining) and immunofluorescence detection of LYVE-1 (red) and CD31 (green) in the basal plate (BP), placental villi (PV), and chorioamniotic membranes (CAM). Red arrows point to fetal macrophages expressing LYVE1 but not CD31, and green arrows indicate lymphatic endothelial decidual cells (LED cells) expressing both LYVE1 and CD31. (B) Co-expression of LYVE1 and CD31 (i.e. LED cells) in the chorioamniotic membranes. (C) Single-cell expression UMAP of LYVE-1 (red) and CD34 (green) in the placental compartments.
Figure 2—figure supplement 1
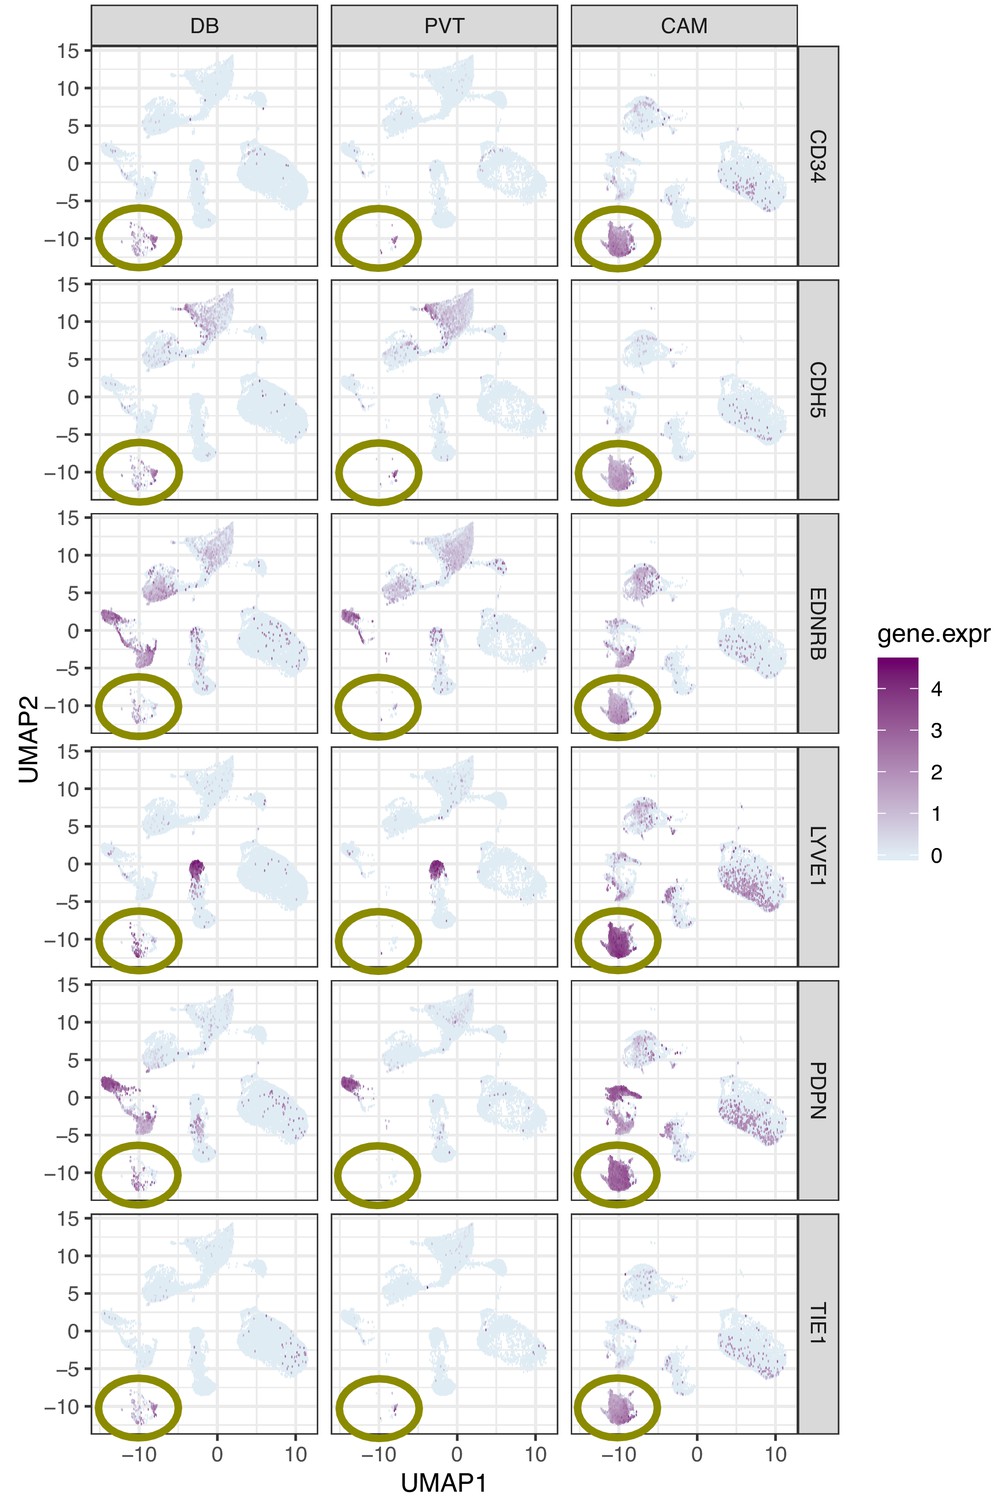
Single marker gene expression UMAP plot for genes that are more highly expressed in lymphatic endothelial decidual (LED) cells.
Each row of panels represents a gene that is highly expressed in LEDs and each column represents a compartment (Basal Plate = BP, Pacental Villi = PV, and chorioamniotic membranes = CAM). Note that LEDs highlighted inside the circle are almost only found in the CAM.
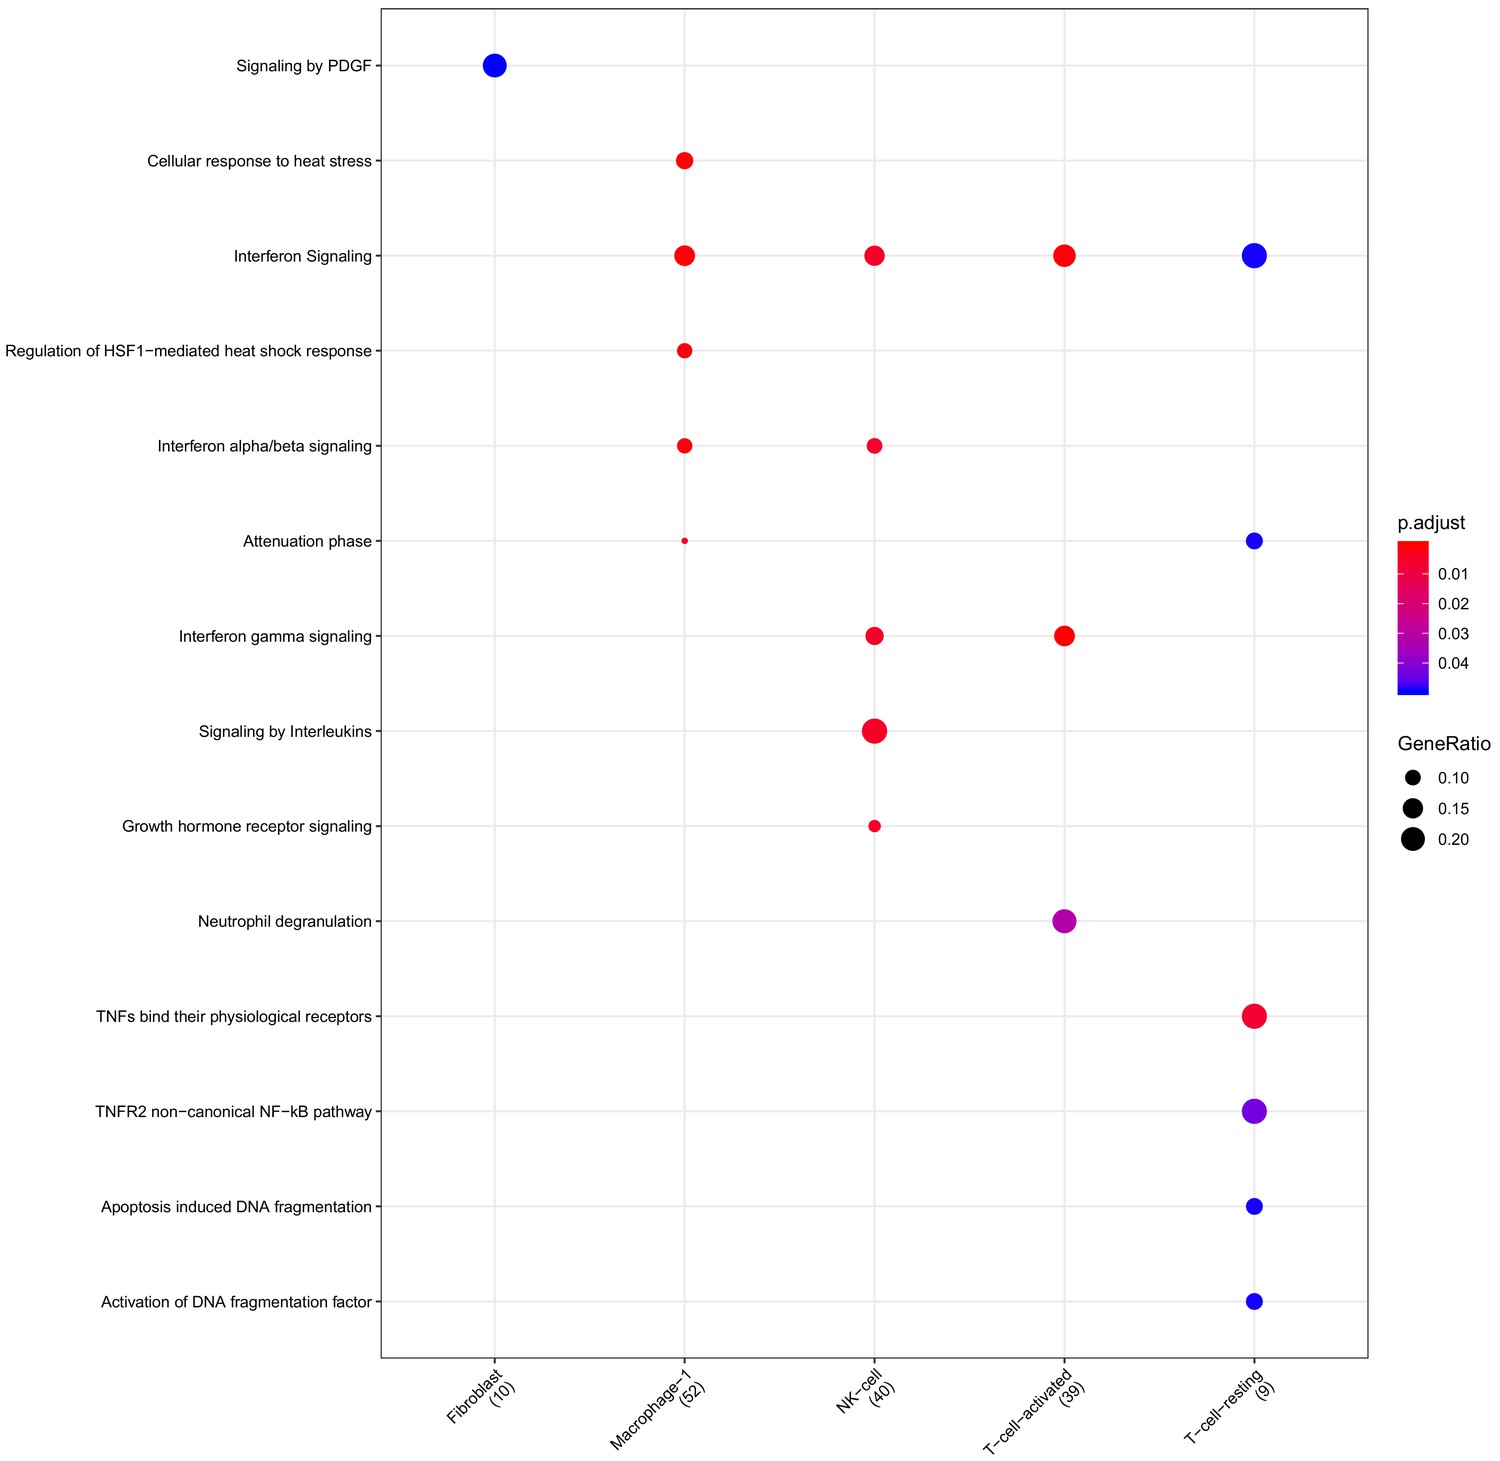
Figure 2—figure supplement 2
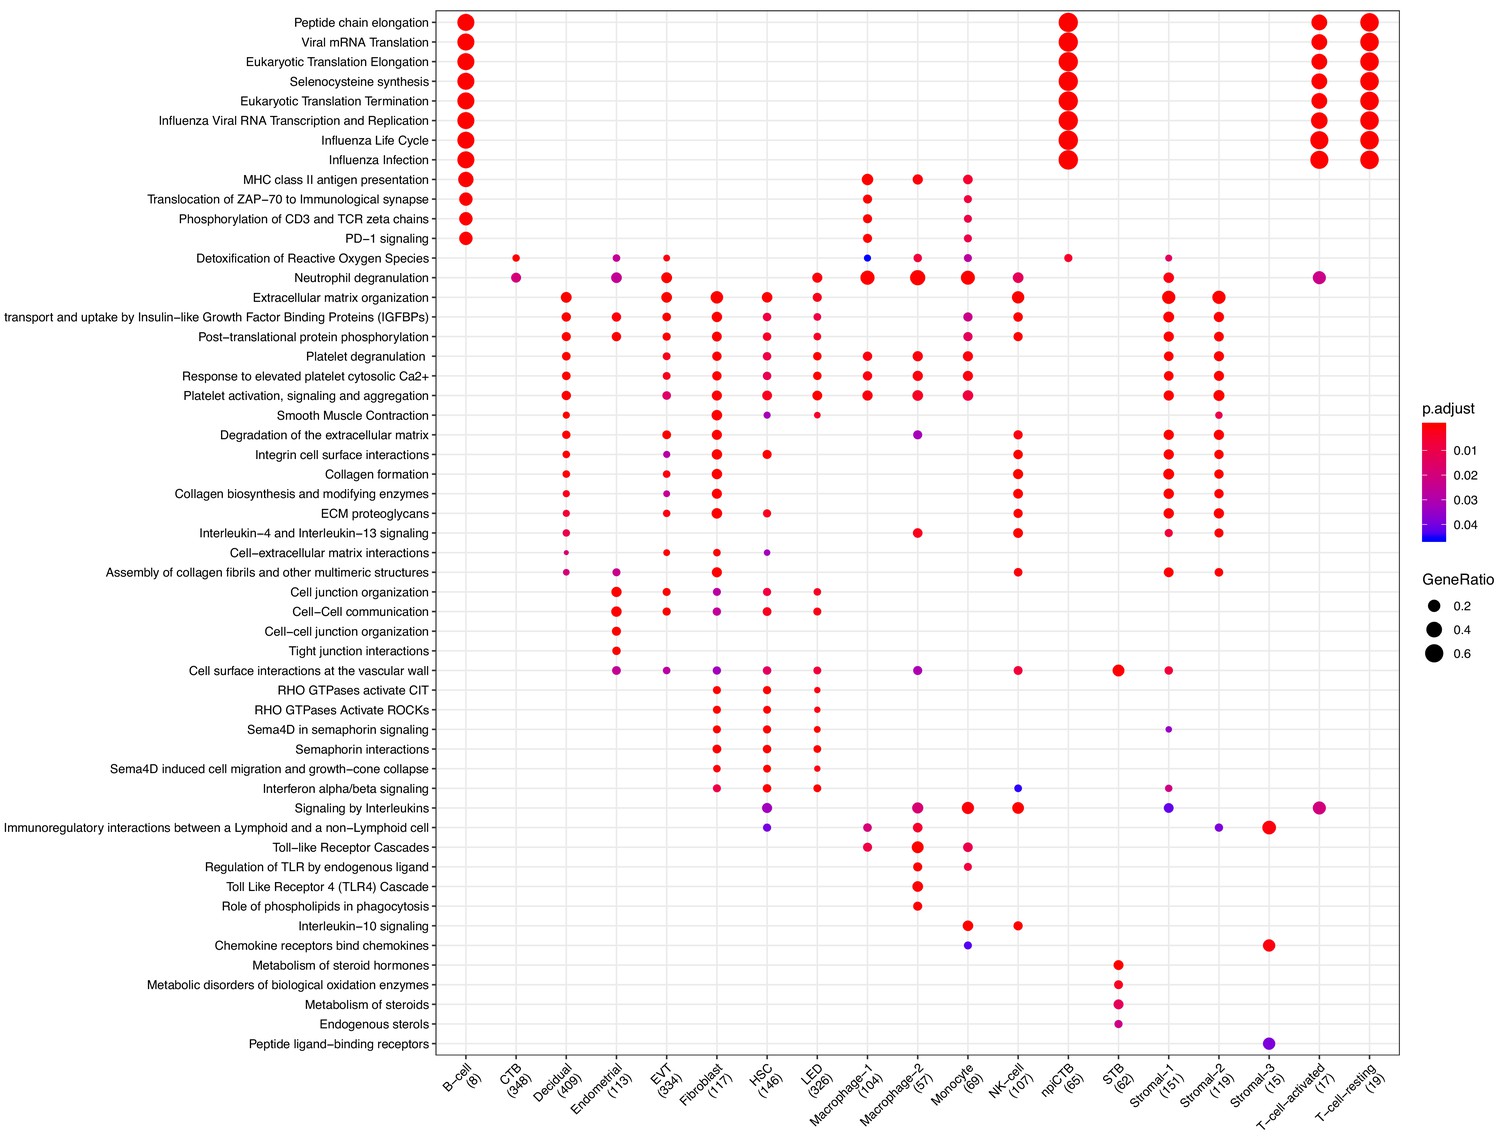
Clusterprofiler dot plot showing the ReactomeDB Pathways enriched for genes that define each cell-type.
Color is scaled to the Benjamini Hochberg adjusted p-value, and dot size is scaled to the fraction of cell-type (column name) specific genes (number in parentheses) that are found annotated in the category (row name).
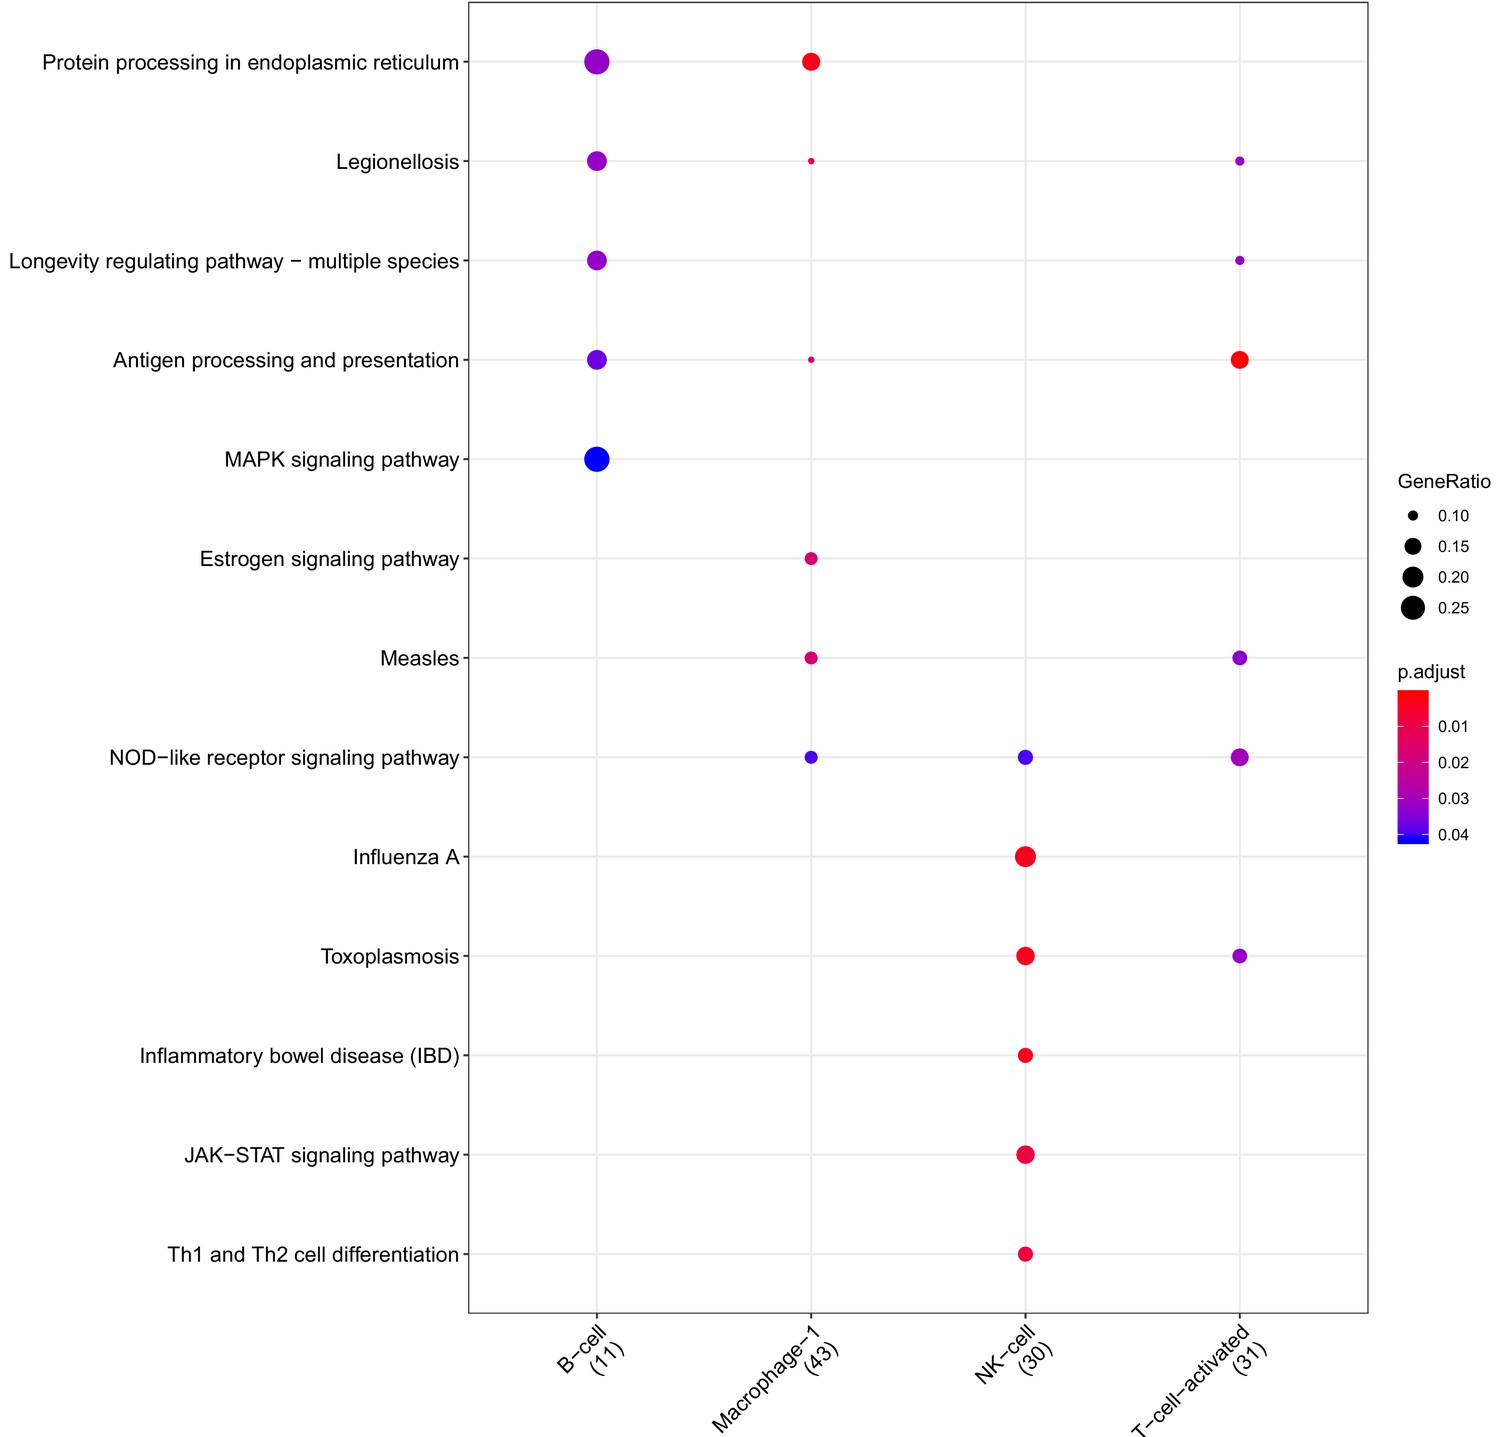
Figure 2—figure supplement 3
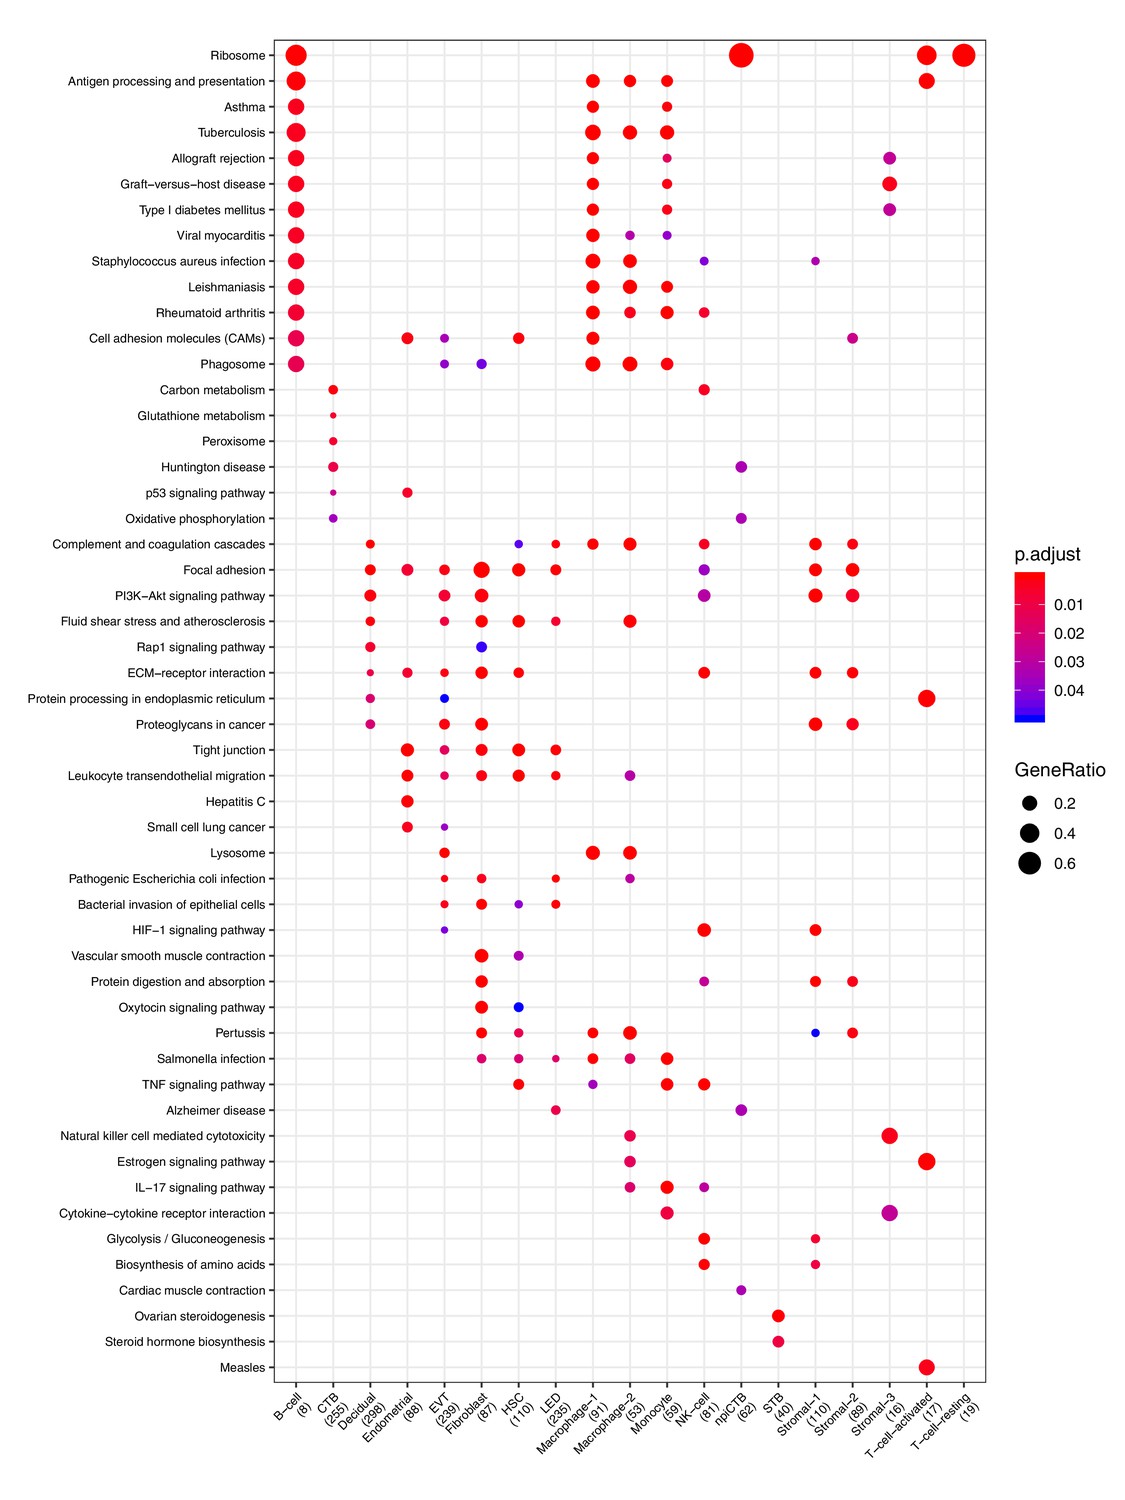
Clusterprofiler dot plot showing the Kegg Pathways enriched for genes that define each cell-type.
Color is scaled to the Benjamini Hochberg adjusted p-value, and dot size is scaled to the fraction of cell-type (column name) specific genes (number in parentheses) that are found annotated in the category (row name).
Figure 2—video 1
Video with the 3D reconstruction of the lymphatic endothelium in the decidua present in the CAM compartment.
Immunofluorescence co-expression of LYVE-1 (red) and CD31 (green) represents LED cells.
Figure 3 with 11 supplements
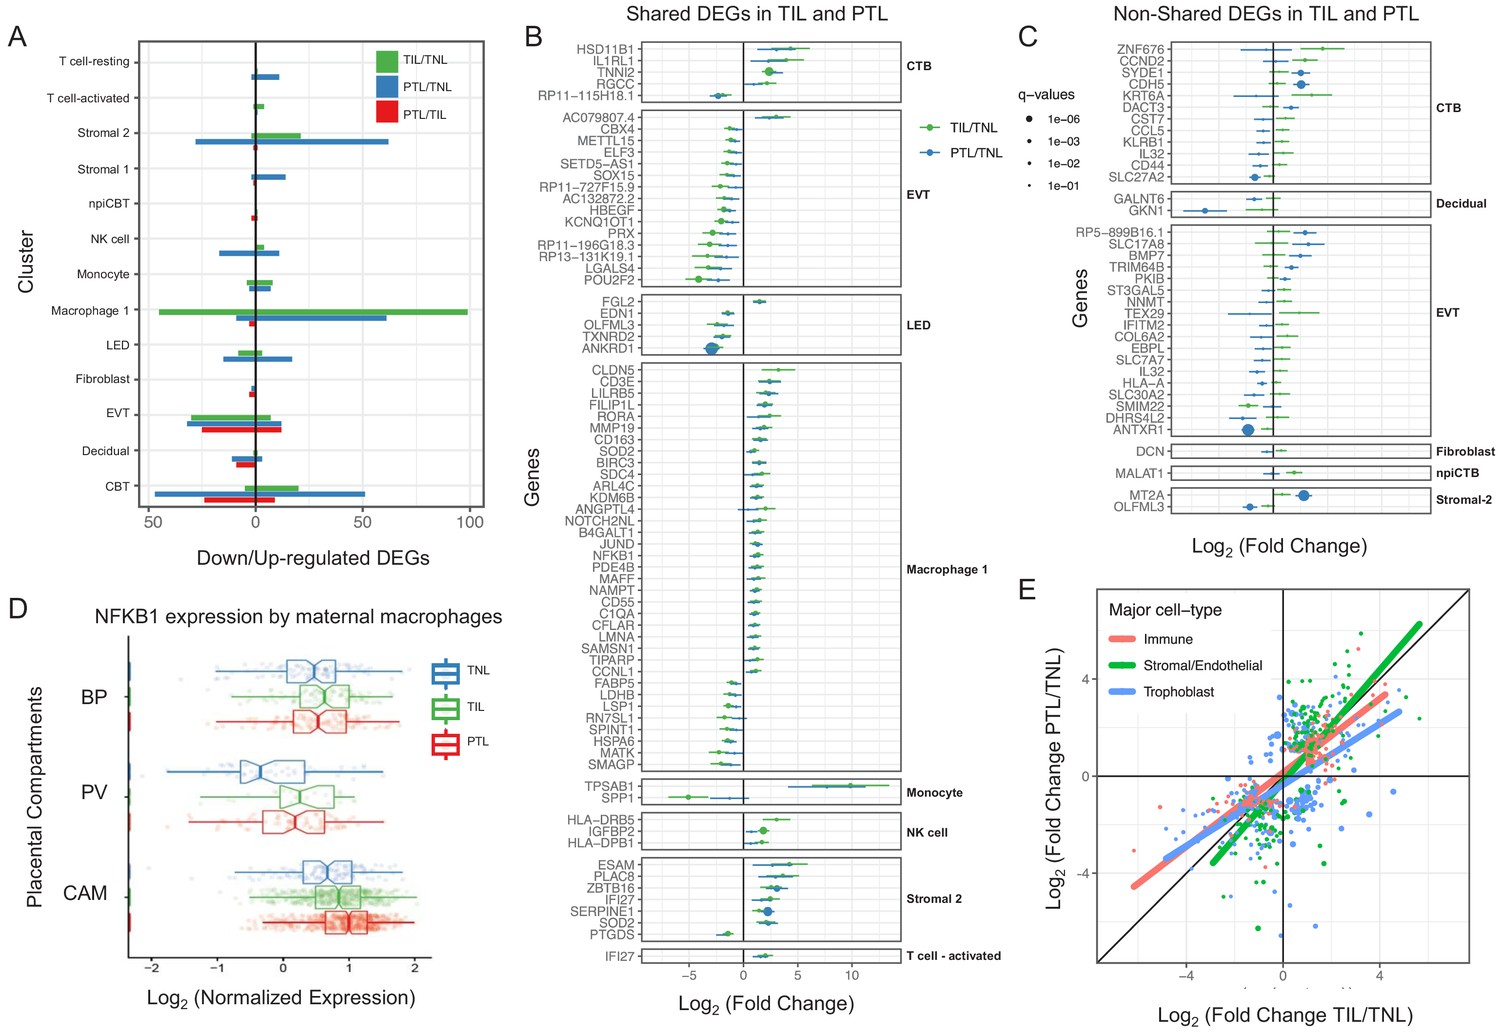
Cell type specific expression changes in term and preterm labor.
(A) Number of differentially expressed genes (DEGs) among study groups (TNL, term no labor; TIL, term in labor; PTL, preterm labor) by direction of change. Shared (B) and non-shared (C) expression changes in term labor and preterm labor relative to the term no labor group (q < 0.01). The length of each whisker represents the 95% confidence interval. (D) The expression of NFKB1 by maternal macrophages in the placental compartments (BP, basal plate; PV, placental villous; CAM, chorioamniotic membranes) and study groups. The notch represents the 95% confidence interval of the median. (E) Differences and similarities in expression changes with preterm labor and term labor by three major cell types (immune, stromal/endothelial, and trophoblast cells).
Figure 3—figure supplement 1
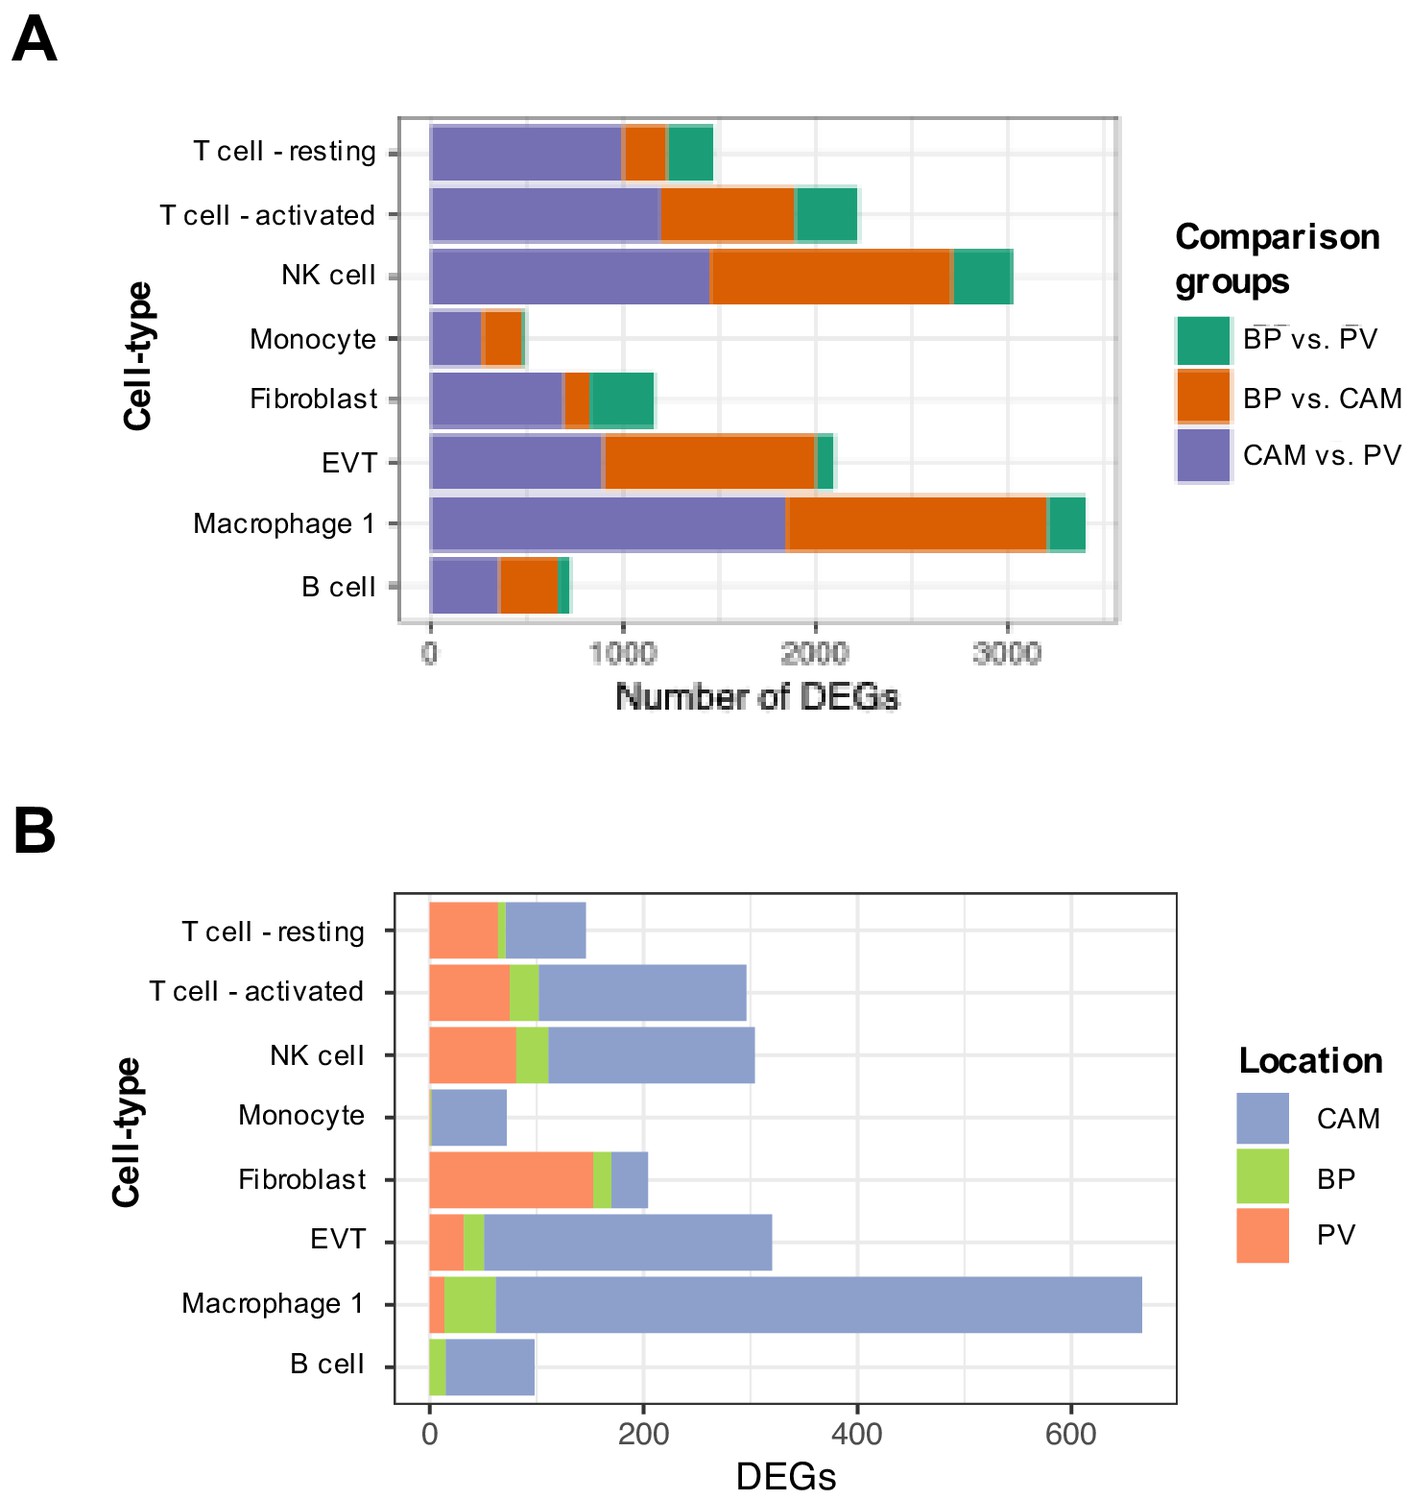
Stacked bar plot summarizing differentially expressed genes across compartments for a cell types that are present on all three of them.
Number of DEGs at a Benjamini Hochberg adjusted p-value<0.1 and fold change greater than 2: (A) between each pair of compartments, or (B) for each compartment (indicated in color) to the other two compartments.
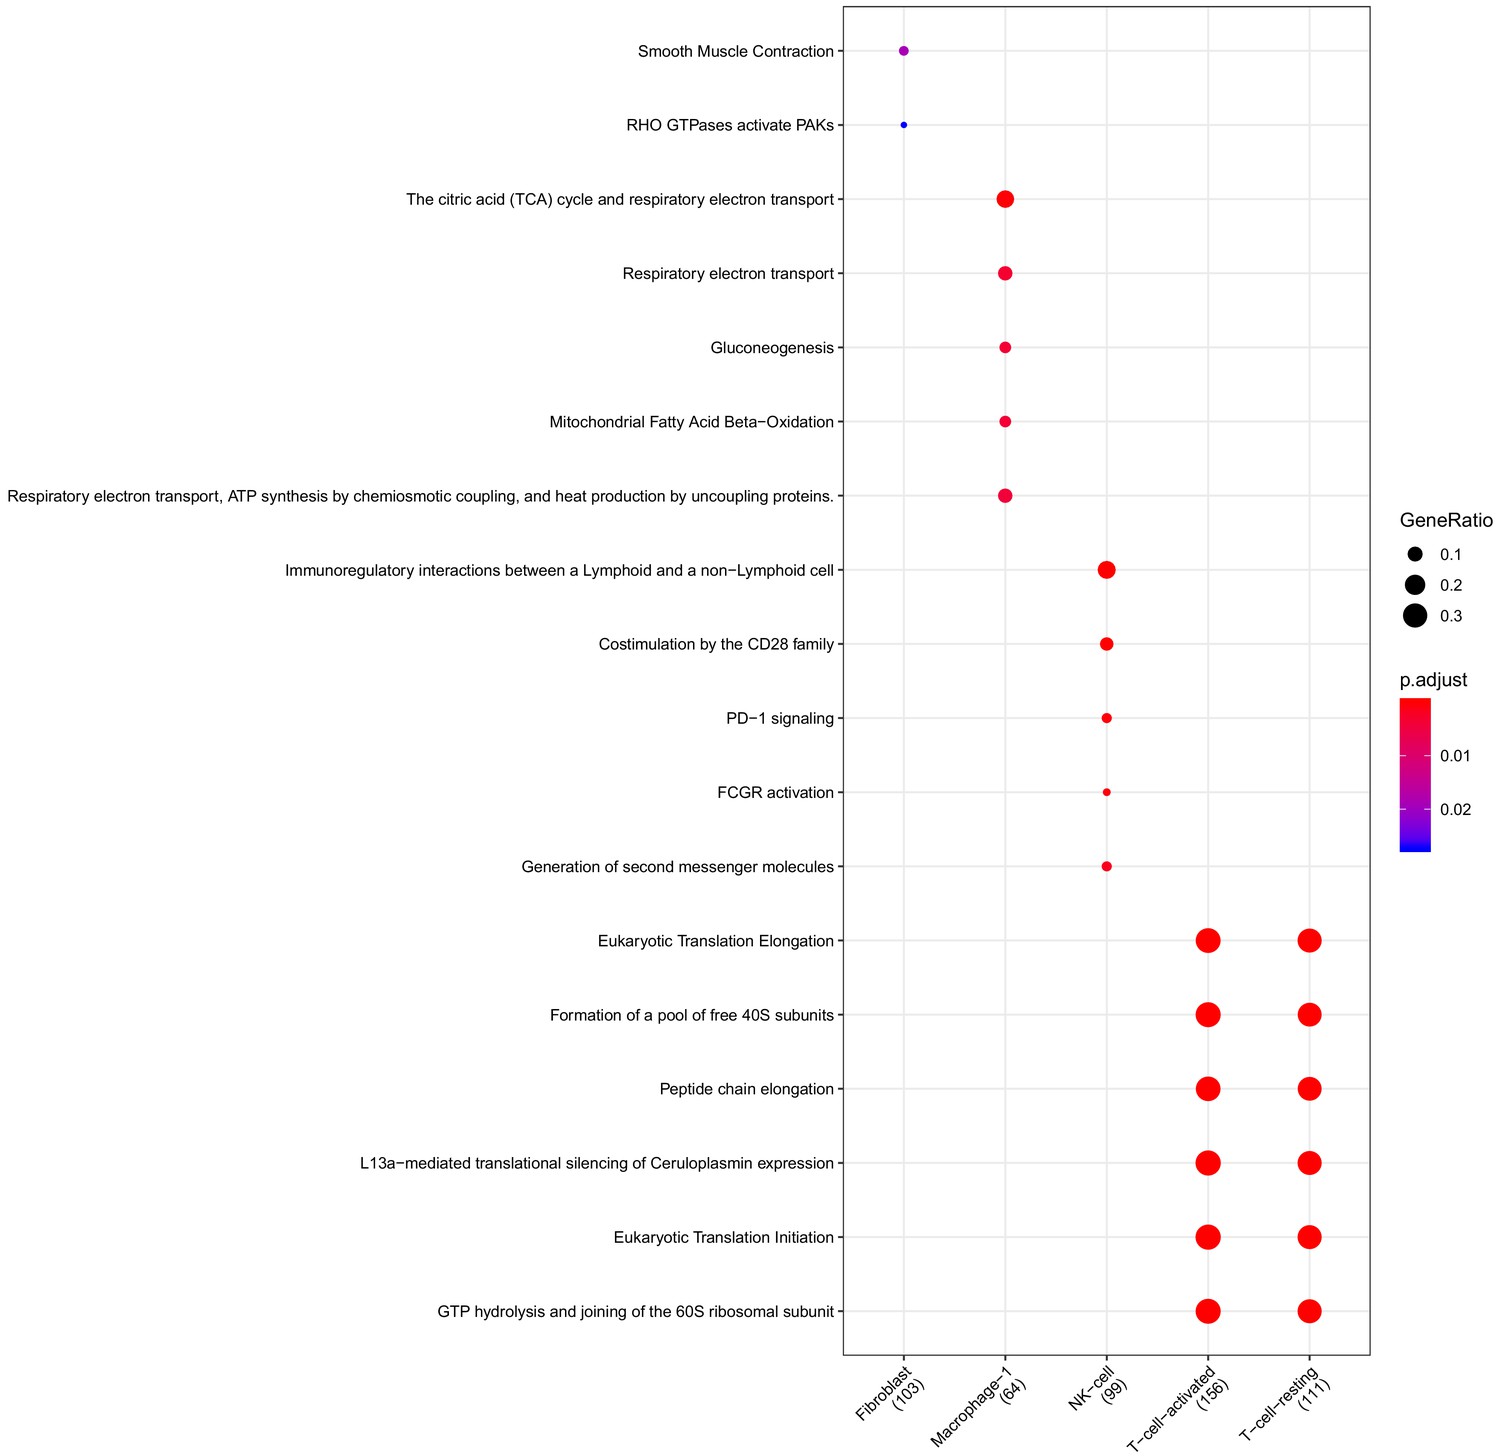
Figure 3—figure supplement 2
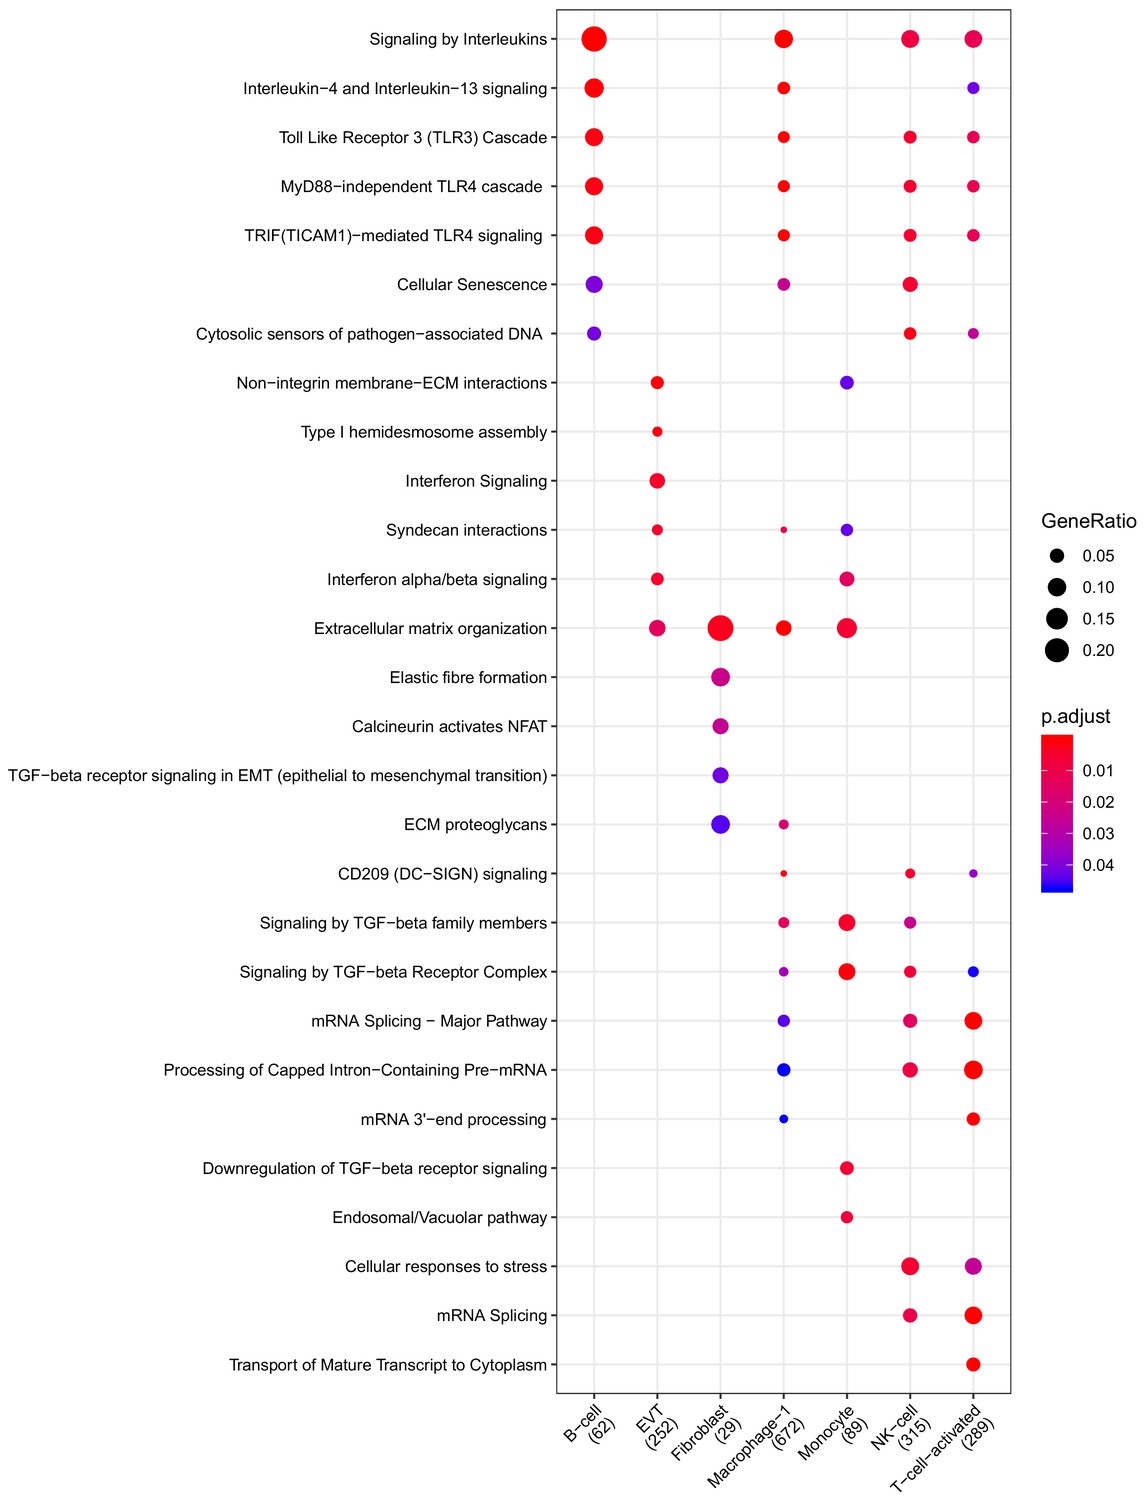
Clusterprofiler dot plot showing the ReactomeDB Pathways enriched for genes that are significantly more highly expressed in the CAM compartment relative to the other compartments for each cell-type.
Color is scaled to the Benjamini Hochberg adjusted p-value, and dot size is scaled to the fraction of cell-type (column name) specific genes (number in parentheses) for the CAM that are found annotated in the category (row name).
Figure 3—figure supplement 3

Clusterprofiler dot plot showing the Kegg Pathways enriched for genes that are significantly more highly expressed in the CAM compartment relative to the other compartments for each cell-type.
Color is scaled to the Benjamini Hochberg adjusted p-value, and dot size is scaled to the fraction of cell-type (column name) specific genes (number in parentheses) for the CAM that are found annotated in the category (row name).
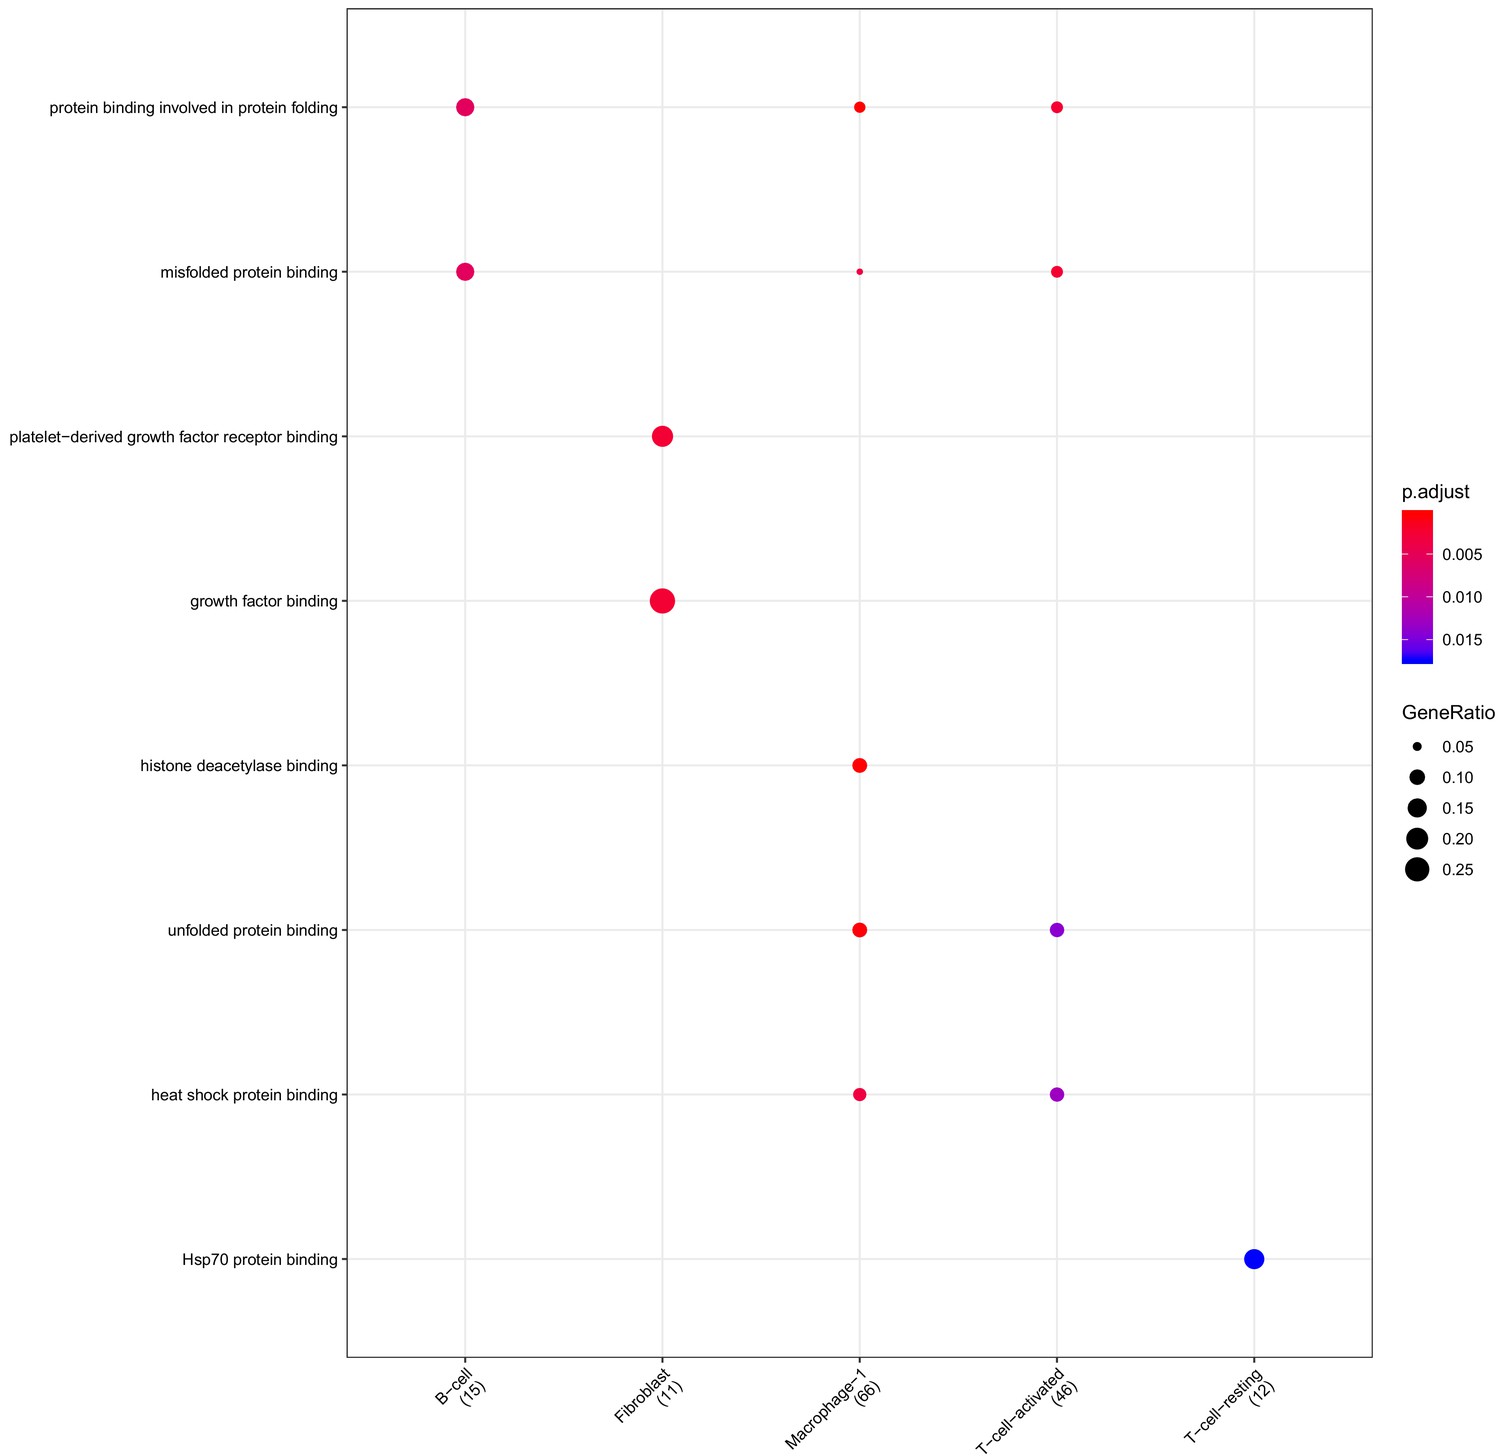
Figure 3—figure supplement 4

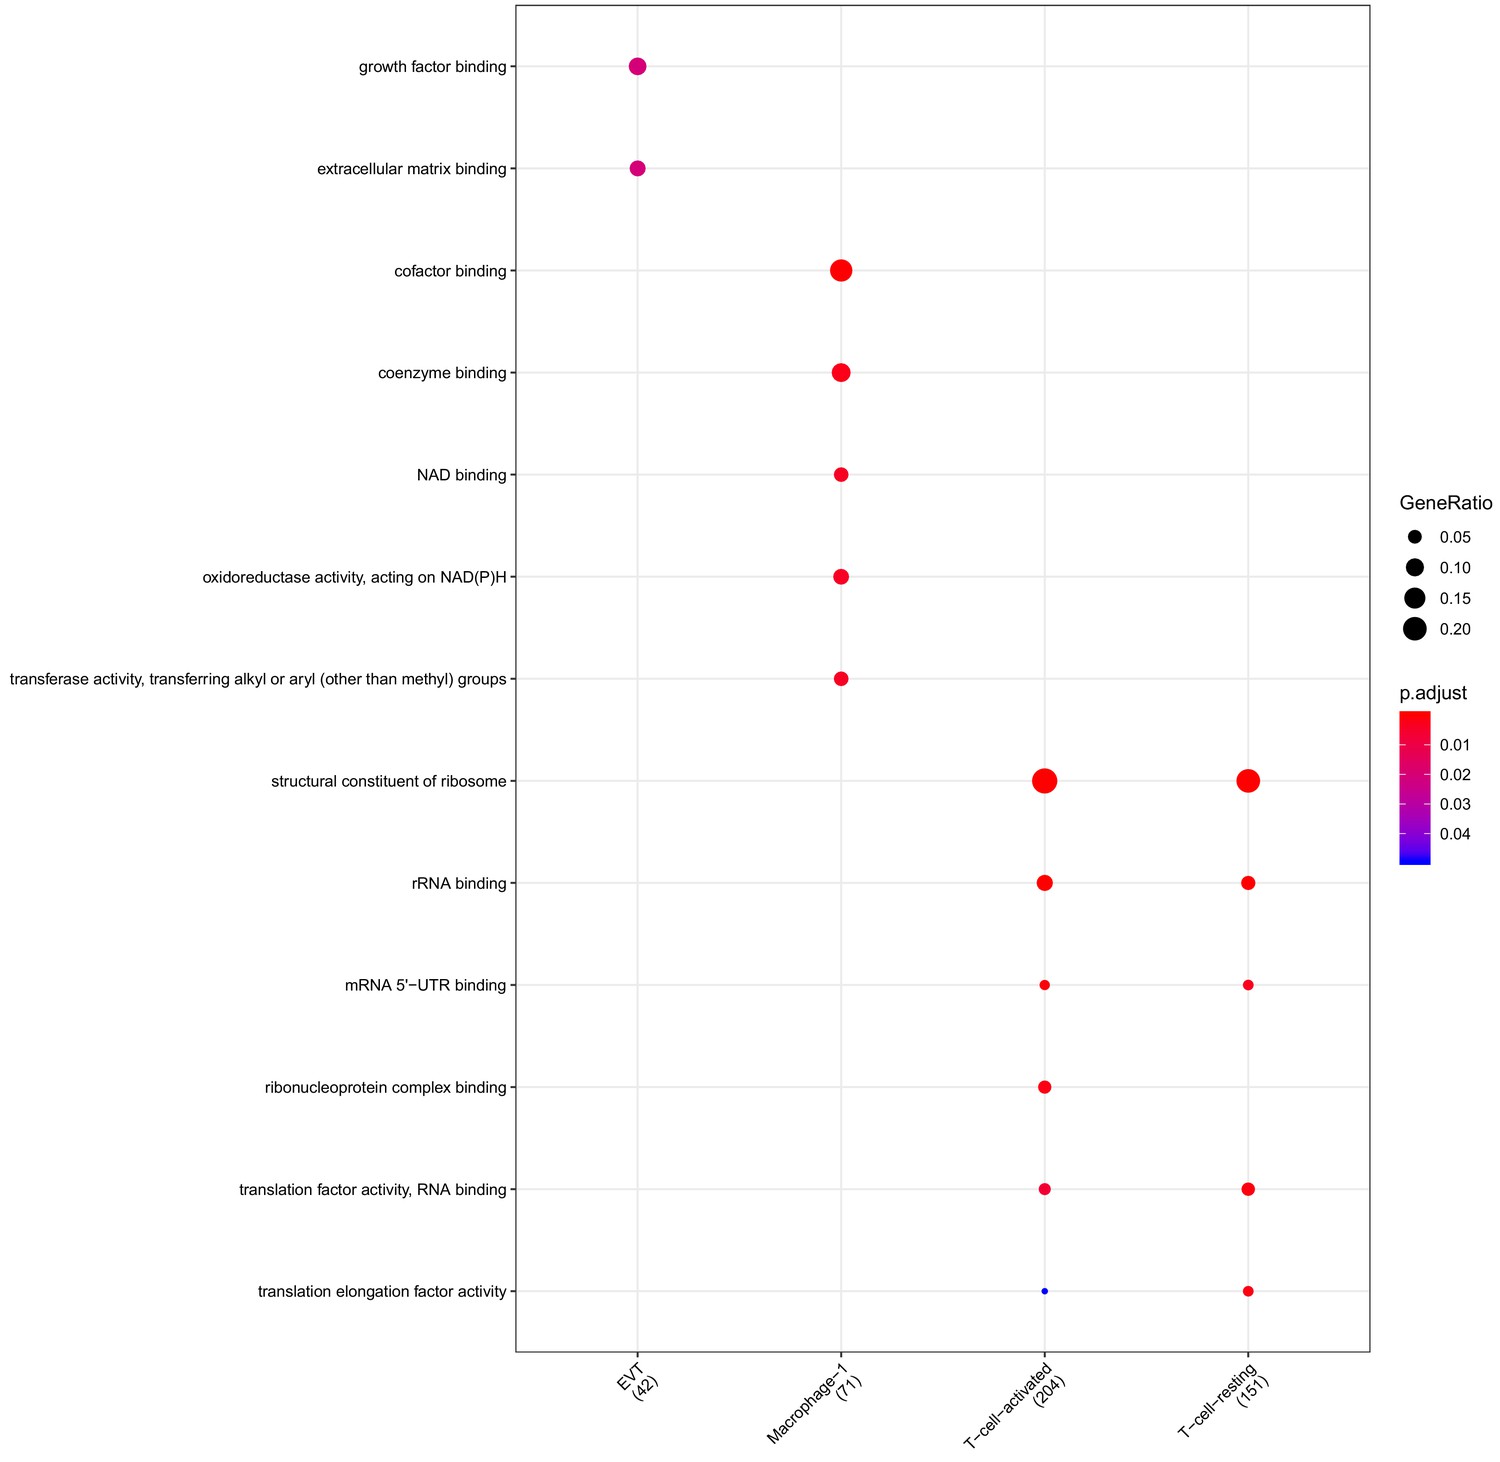
Clusterprofiler dot plot showing gene ontology (GO) terms enriched for genes that are significantly more highly expressed in the CAM compartment relative to the other compartments for each cell-type.
Color is scaled to the Benjamini Hochberg adjusted p-value, and dot size is scaled to the fraction of cell-type (column name) specific genes (number in parentheses) for the CAM that are found annotated in the category (row name).
Figure 3—figure supplement 5
Clusterprofiler dot plot showing the ReactomeDB Pathways enriched for genes that are significantly more highly expressed in the BP compartment relative to the other compartments for each cell-type.
Color is scaled to the Benjamini Hochberg adjusted p-value, and dot size is scaled to the fraction of cell-type (column name) specific genes (number in parentheses) for the BP that are found annotated in the category (row name).
Figure 3—figure supplement 6
Clusterprofiler dot plot showing the Kegg Pathways enriched for genes that are significantly more highly expressed in the BP compartment relative to the other compartments for each cell-type.
Color is scaled to the Benjamini Hochberg adjusted p-value, and dot size is scaled to the fraction of cell-type (column name) specific genes (number in parentheses) for the BP that are found annotated in the category (row name).
Figure 3—figure supplement 7
Clusterprofiler dot plot showing gene ontology (GO) terms enriched for genes that are significantly more highly expressed in the BP compartment relative to the other compartments for each cell-type.
Color is scaled to the Benjamini Hochberg adjusted p-value, and dot size is scaled to the fraction of cell-type (column name) specific genes (number in parentheses) for the BP that are found annotated in the category (row name).
Figure 3—figure supplement 8
Clusterprofiler dot plot showing the ReactomeDB Pathways enriched for genes that are significantly more highly expressed in the PV compartment relative to the other compartments for each cell-type.
Color is scaled to the Benjamini Hochberg adjusted p-value, and dot size is scaled to the fraction of cell-type (column name) specific genes (number in parentheses) for the PV that are found annotated in the category (row name).
Figure 3—figure supplement 9

Clusterprofiler dot plot showing the Kegg Pathways enriched for genes that are significantly more highly expressed in the PV compartment relative to the other compartments for each cell-type.
Color is scaled to the Benjamini Hochberg adjusted p-value, and dot size is scaled to the fraction of cell-type (column name) specific genes (number in parentheses) for the PV that are found annotated in the category (row name).
Figure 3—figure supplement 10
Clusterprofiler dot plot showing gene ontology (GO) terms enriched for genes that are significantly more highly expressed in the PV compartment relative to the other compartments for each cell-type.
Color is scaled to the Benjamini Hochberg adjusted p-value, and dot size is scaled to the fraction of cell-type (column name) specific genes (number in parentheses) for the PV that are found annotated in the category (row name).
Figure 3—figure supplement 11
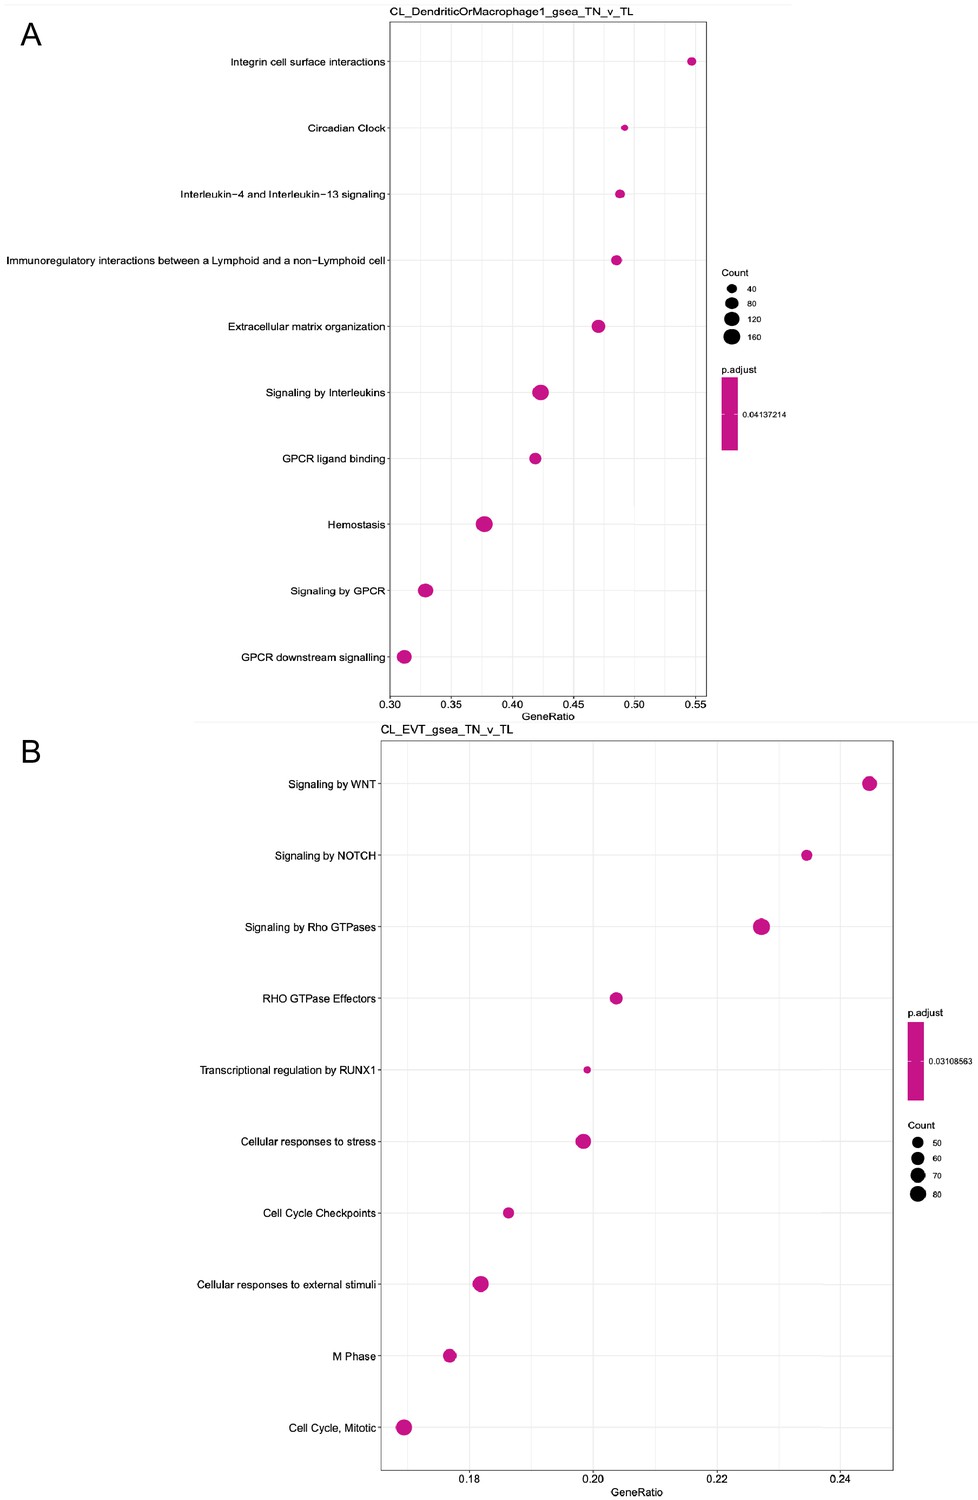
Clusterprofiler dot plot showing ReactomeDB pathways enriched using gene set enrichment analysis (GSEA) for genes differentially expressed in term labor compared to term no labor condition.
The two panels correspond to the following cell-types: (A) maternal macrophages, and (B) extra villous trophoblasts (EVT).
Figure 4 with 1 supplement
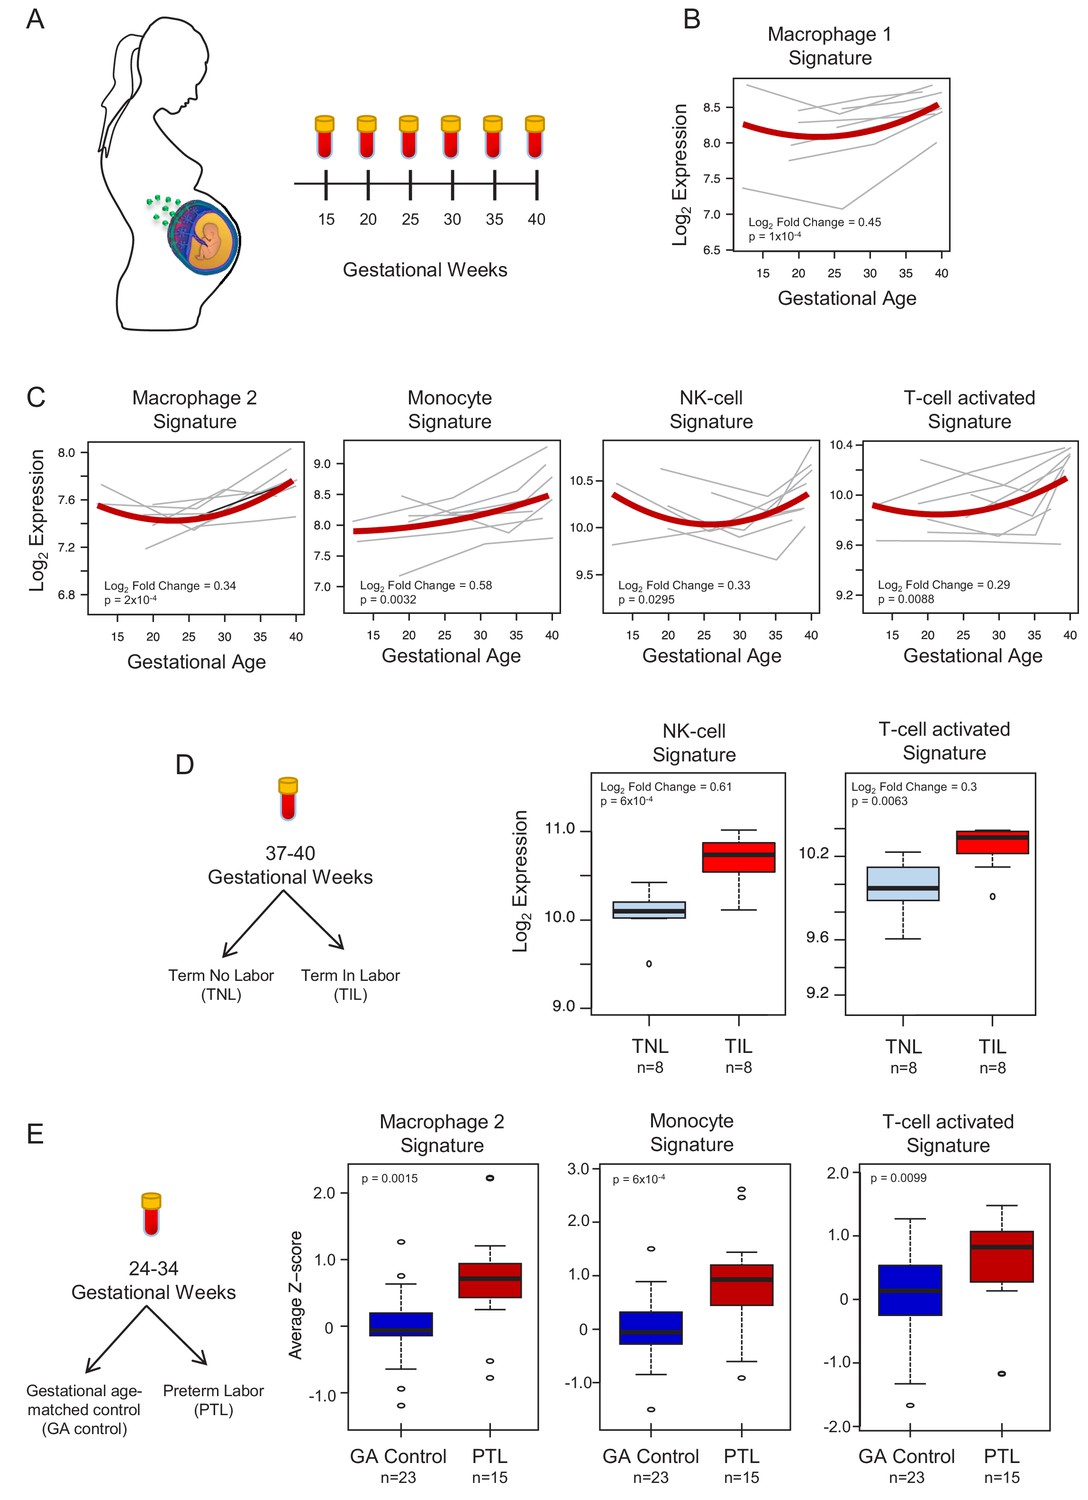
In silico analysis to quantify scRNA-seq signatures in the maternal circulation.
(A) Diagram of the longitudinal study used to generate bulk RNAseq data (GSE114037) (Tarca et al., 2019) to evaluate changes in scRNA-seq signatures with advancing gestation. Whole blood samples were collected throughout gestation from women who delivered at term. (B and C) Variation of scRNA-seq signature expression in the maternal circulation with advancing gestation. (D) Diagram of the cross-sectional study used to generate bulk RNAseq data (GSE114037) to evaluate changes in scRNA-seq signatures with labor at term (Tarca et al., 2019). Differences in the expression of scRNA-seq signatures between women with spontaneous labor at term (TIL) and term no labor controls (TNL). (E) Diagram of the cross-sectional study used to generate bulk RNAseq data (GSE96083) to evaluate changes in scRNA-seq signatures in preterm labor (Paquette et al., 2018). Differences in the expression of scRNA-seq signatures between women with spontaneous preterm labor (PTL) and gestational-age matched controls (GA control).
Figure 4—figure supplement 1
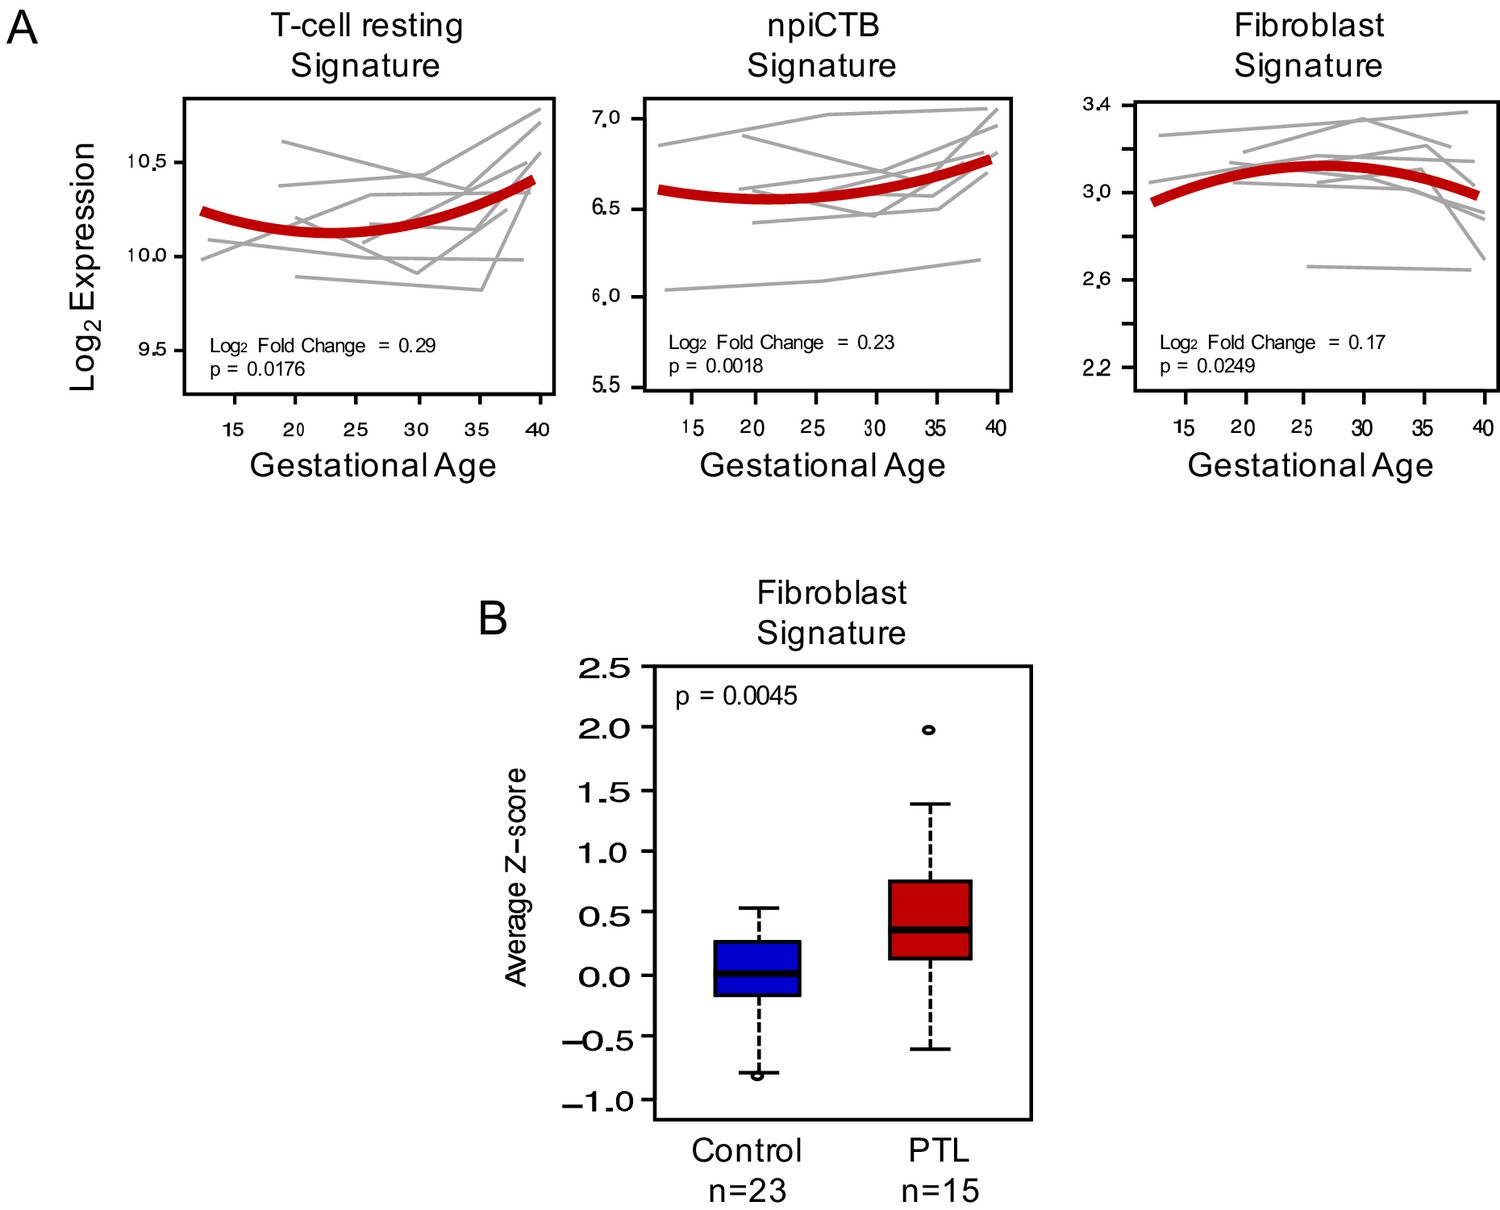
Quantification of scRNA-seq signatures in maternal circulation (continued from main Figure 4).
(A) Expression of scRNA-seq signatures in the maternal circulation changing with advancing gestation; (B) perturbations in scRNA-seq signatures with preterm labor.
Additional files
-
Supplementary file 1
Summary of the scRNA-seq libraries prepared.
Each row summarizes each 10X Genomics scRNA-seq library prepared and processed in this study: sample ID, number of cells detected after filtering, location of the tissue (BP = basal plate, PV = Placental Villi, CAM = chorioamniotic membranes), pregnancy condition (TNL = term no labor, TIL = term in labor, PTL = preterm labor), gender of the neonate, and total number of UMIs detected.
- https://cdn.elifesciences.org/articles/52004/elife-52004-supp1-v2.docx
-
Supplementary file 2
Summary of cell count by cell-type, location and condition.
Each row summarizes the total number of cells of each cell-type as determined by Seurat and split by pregnancy condition (TNL = term no labor, TIL = term in labor, PTL = preterm labor), or location of the tissue (BP = basal plate, PV = Placental Villi, CAM = chorioamniotic membranes).
- https://cdn.elifesciences.org/articles/52004/elife-52004-supp2-v2.xlsx
-
Supplementary file 3
Marker Genes identified for each cell-type.
The columns represent: 1) Cluster or cell-type name, 2) Ensembl gene identifier, 3) Gene symbol, 4) pct.1: percentage of cells in this cluster where the feature is detected, 5) pct.2: percentage of cells in other clusters where the feature is detected, 6) log fold-change of the average expression between this cluster and the rest, 7) Nominal p-value, 8) Adjusted p-value (Bonferroni).
- https://cdn.elifesciences.org/articles/52004/elife-52004-supp3-v2.xls
-
Supplementary file 4
Genes differentially expressed across compartments for each common cell-type.
The columns represent: 1) Cluster or cell-type name, 2) Comparison groups or contrast (i.e., BP vs PV, BP vs CAM, and CAM vs PV), 3) Ensembl gene identifier, 4) Gene symbol, 5) baseMean gene baseline expression as calculated by DESeq2, 6) log2 Fold Change of the first group in column two versus the second group, 7) Standard error estimated for the log2 Fold Change, 8) Nominal p-value, 9) q-value or adjusted p-value to control for FDR. Only rows with q < 0.2 are reported.
- https://cdn.elifesciences.org/articles/52004/elife-52004-supp4-v2.xls
-
Supplementary file 5
Genes differentially expressed across conditions for each cell-type.
The columns represent: 1) Cluster or cell-type name, 2) Comparison groups or contrast (i.e., TNL vs TIL, TIL vs PTL), 3) Ensembl gene identifier, 4) Gene symbol, 5) baseMean gene baseline expression as calculated by DESeq2, 6) log2 Fold Change of the first group in column two versus the second group, 7) Standard error estimated for the log2 Fold Change, 8) Nominal p-value, 9) q-value or adjusted p-value to control for FDR. Only rows with q < 0. two are reported.
- https://cdn.elifesciences.org/articles/52004/elife-52004-supp5-v2.xls
-
Supplementary file 6
Summary of the sample demographics included in this study.
Data are given as medians with interquartile ranges (IQR) or as percentages (n/N). aOne sample missing data.
- https://cdn.elifesciences.org/articles/52004/elife-52004-supp6-v2.docx
-
Supplementary file 7
Summary of the QC metrics for the scRNA-seq libraries prepared.
Each row represents a library, and each column a QC metric reported by the 10X Cellranger software.
- https://cdn.elifesciences.org/articles/52004/elife-52004-supp7-v2.xls
-
Transparent reporting form
- https://cdn.elifesciences.org/articles/52004/elife-52004-transrepform-v2.docx
Download links
A two-part list of links to download the article, or parts of the article, in various formats.
Downloads (link to download the article as PDF)
Open citations (links to open the citations from this article in various online reference manager services)
Cite this article (links to download the citations from this article in formats compatible with various reference manager tools)
Single cell transcriptional signatures of the human placenta in term and preterm parturition
eLife 8:e52004.
https://doi.org/10.7554/eLife.52004


