Gab1 mediates PDGF signaling and is essential to oligodendrocyte differentiation and CNS myelination
- Zhejiang University School of Medicine, China
- Guizhou Institution of Higher Education, Zunyi Medical University, China
- Zhejiang University City College, China
- Hangzhou Normal University, China
Figures
Figure 1
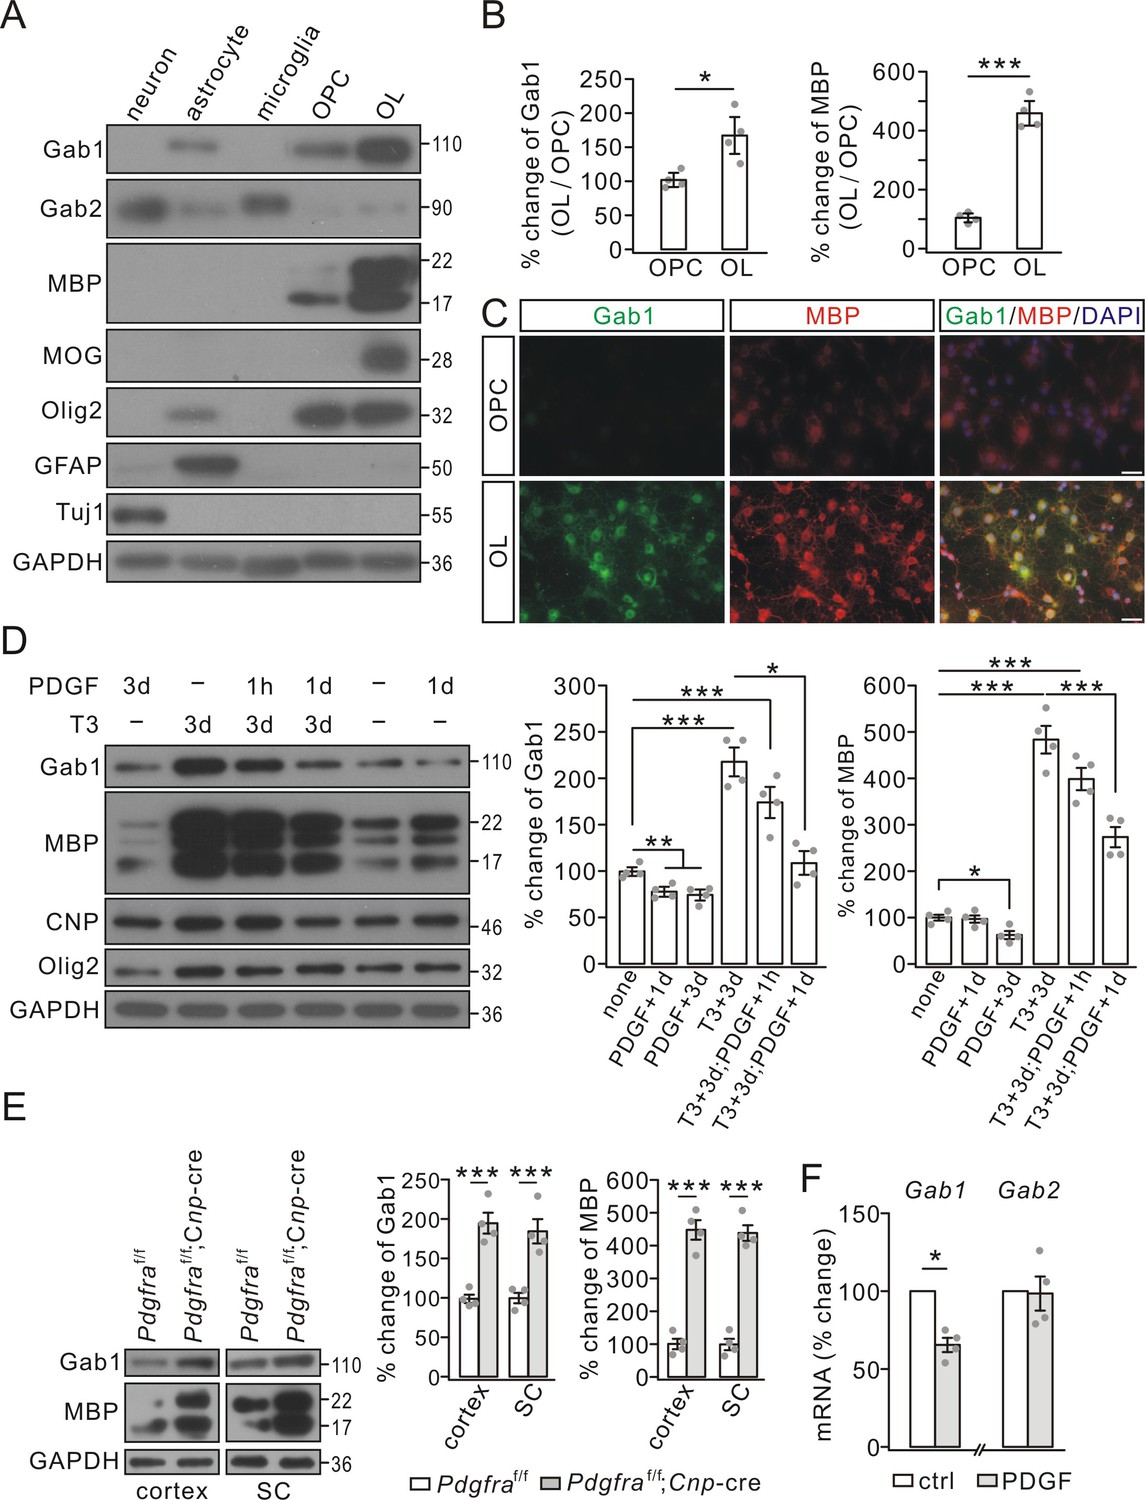
Gab1 expression increased during OPC differentiation but was reduced by PDGF in vitro.
(A) The expressions of Gab1, Gab2, myelin-related proteins, and cell-specific marker proteins in cultured neurons, astrocytes, microglia, OPCs, and OLs. (B) The blots of Gab1 and MBP were normalized to corresponding GAPDH and their ratios in OL vs. OPC (OL/OPC) were shown as the percentage changes of OPC group. Gab1: 100 ± 7% (OPC) and 169 ± 21% (OL), p=0.014. MBP: 100 ± 10% (OPC) and 459 ± 31% (OL), p=0.00002, n = 4/group, t-test, df = t(7). (C) The immunostaining of Gab1 and MBP in cultured OPCs and OLs. Scale bars: 20 μm. (D) PDGF and triiodothyronine (T3) were administered to OPC cultures as indicated. Gab1 and MBP were normalized to GAPDH and percentage changes are shown in bar graphs. Gab1: 100 ± 4% (none), 78 ± 4% (PDGF+1d), 74 ± 5% (PDGF+3d), 218 ± 15% (T3+3d), 174 ± 16% (T3+3d;PDGF+1 hr), and 108 ± 12% (T3+3d;PDGF+1d), p values: 0.0056 (none vs PDGF+1d), 0.0044 (none vs PDGF+3d), 0.00015 (none vs T3+3d), 0.0021 (none vs T3+3d;PDGF+1 hr), and 0.046 (T3+3d;PDGF+1 hr vs T3+3d;PDGF+1d). MBP: 100 ± 7% (none), 97 ± 9% (PDGF+1d), 63 ± 10% (PDGF+3d), 484 ± 34% (T3+3d), 399 ± 28% (T3+3d;PDGF+1 hr), and 274 ± 26% (T3+3d;PDGF+1d), p values: 0.012 (none vs PDGF+3d), 0.000015 (none vs T3+3d), 0.000019 (none vs T3+3d;PDGF+1 hr), and 0.0013 (T3+3d vs T3+3d;PDGF+1d). n = 4/group. ANOVA, df = F(4, 19). (E) The expressions of Gab1, MBP and GAPDH in the cerebral cortex and spinal cord (SC) from P21 Pdgfraf/f and Pdgfraf/f;Cnp-Cre mice. Gab1 and MBP were normalized to corresponding GAPDH and the percentage changes are shown. Gab1: 100 ± 6% (cortex; Pdgfraf/f) and 195 ± 15% (cortex; Pdgfraf/f;Cnp-Cre) (p=0.00053); 100 ± 8% (SC; Pdgfraf/f) and 185 ± 18% (SC; Pdgfraf/f;Cnp-Cre) (p=0.0023). MBP: 100 ± 22% (cortex; Pdgfraf/f) and 449 ± 34% (cortex; Pdgfraf/f;Cnp-Cre) (p=0.000049); 100 ± 20% (SC; Pdgfraf/f) and 439 ± 27% (SC; Pdgfraf/f;Cnp-Cre) (p=0.000024). n = 4/group. t-test, df = t(7). (F) The mRNA levels of Gab1 and Gab2 were quantified by comparative Ct method. The ratios of Gabs to Gapdh in control (ctrl) and PDGF (1d) groups were calculated and normalized to the control, and the percentage changes are shown in bar graphs. Gab1: 66 ± 5% (p=0.032 vs control), n = 4/group. Gab2: 99 ± 14% (p=0.75 vs control), n = 4/group, t-test, df = t(7). Gray dots indicate individual data points. *p<0.05. ***p<0.001.
Figure 2
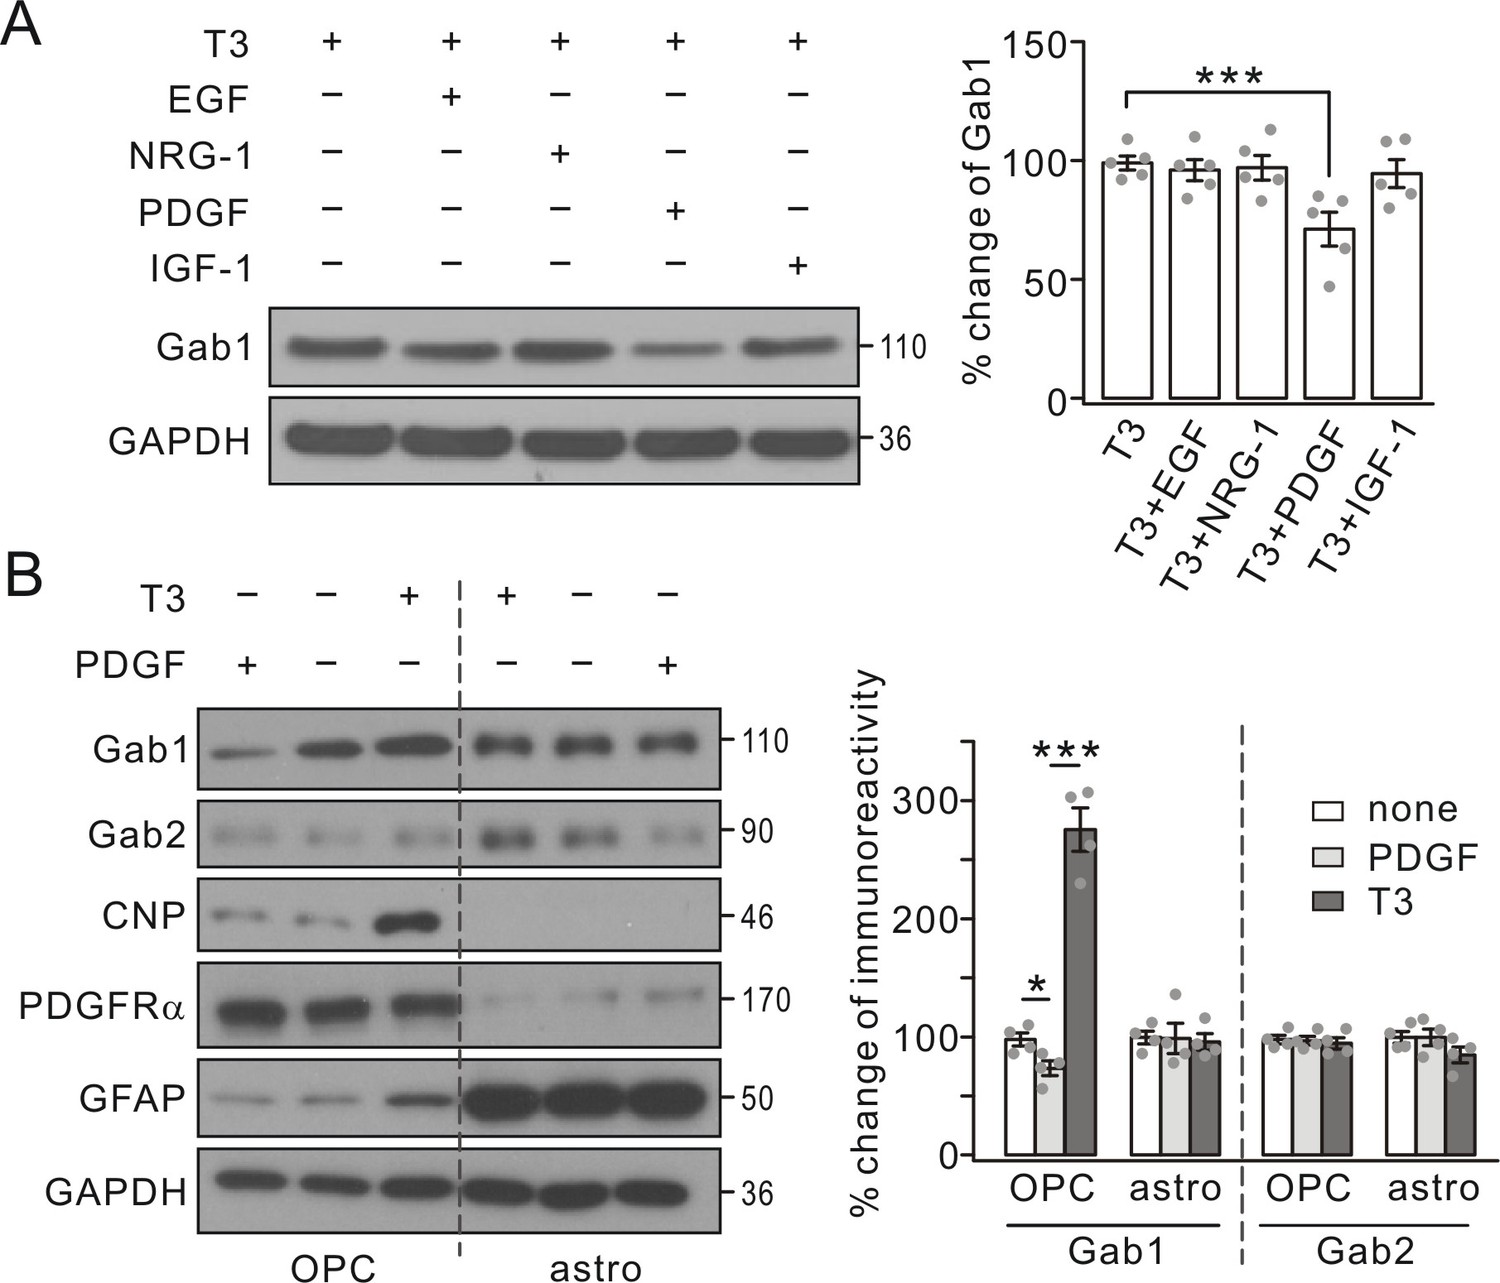
Gab1 expression was specifically suppressed by PDGF.
(A) Triiodothyronine (T3) was administered to OPC cultures along with EGF, NRG-1, PDGF or IGF-1, as indicated by ‘+’ and ‘-’. Gab1 expression was normalized to GAPDH and percentage changes are shown in bar graphs. T3: 100 ± 3%. T3+EGF: 97 ± 5%. T3+NRG-1: 98 ± 6%. T3+PDGF: 71 ± 8%. T3+IGF-1: 94 ± 7%. p values: 0.59 (T3 vs T3+EGF), 0.75 (T3 vs T3+NRG-1), 0.0072 (T3 vs T3+PDGF), and 0.52 (T3 vs T3+IGF-1). n = 5/group. ANOVA, df = F(4, 20). (B) T3 or PDGF was administered to OPC and astrocytic (astro) cultures, as indicated by ‘+’ and ‘-’. Lysates were probed with antibodies to proteins labeled in the left. The expression of Gab1 and Gab2 was normalized to corresponding GAPDH and the percentage changes are shown in bar graphs. Gab1-OPC: 100 ± 5% (none), 74 ± 7% (PDGF), 276 ± 21% (T3), and p values: 0.029 (none vs PDGF) and 0.000087 (none vs T3). Gab1-astro: 100 ± 6% (none), 100 ± 15% (PDGF), 96 ± 8% (T3), and p values: 0.96 (none vs PDGF) and 0.69 (none vs T3). Gab2-OPC: 100 ± 4% (none), 97 ± 4% (PDGF), 95 ± 5% (T3), and p values: 0.85 (none vs PDGF) and 0.61 (none vs T3). Gab2-astro: 100 ± 6% (none), 100 ± 8% (PDGF), 85 ± 8% (T3), and p values: 0.99 (none vs PDGF) and 0.13 (none vs T3). n = 4/group. ANOVA, df = F(2, 9). Gray dots indicate individual data points. ***p<0.001.
Figure 3
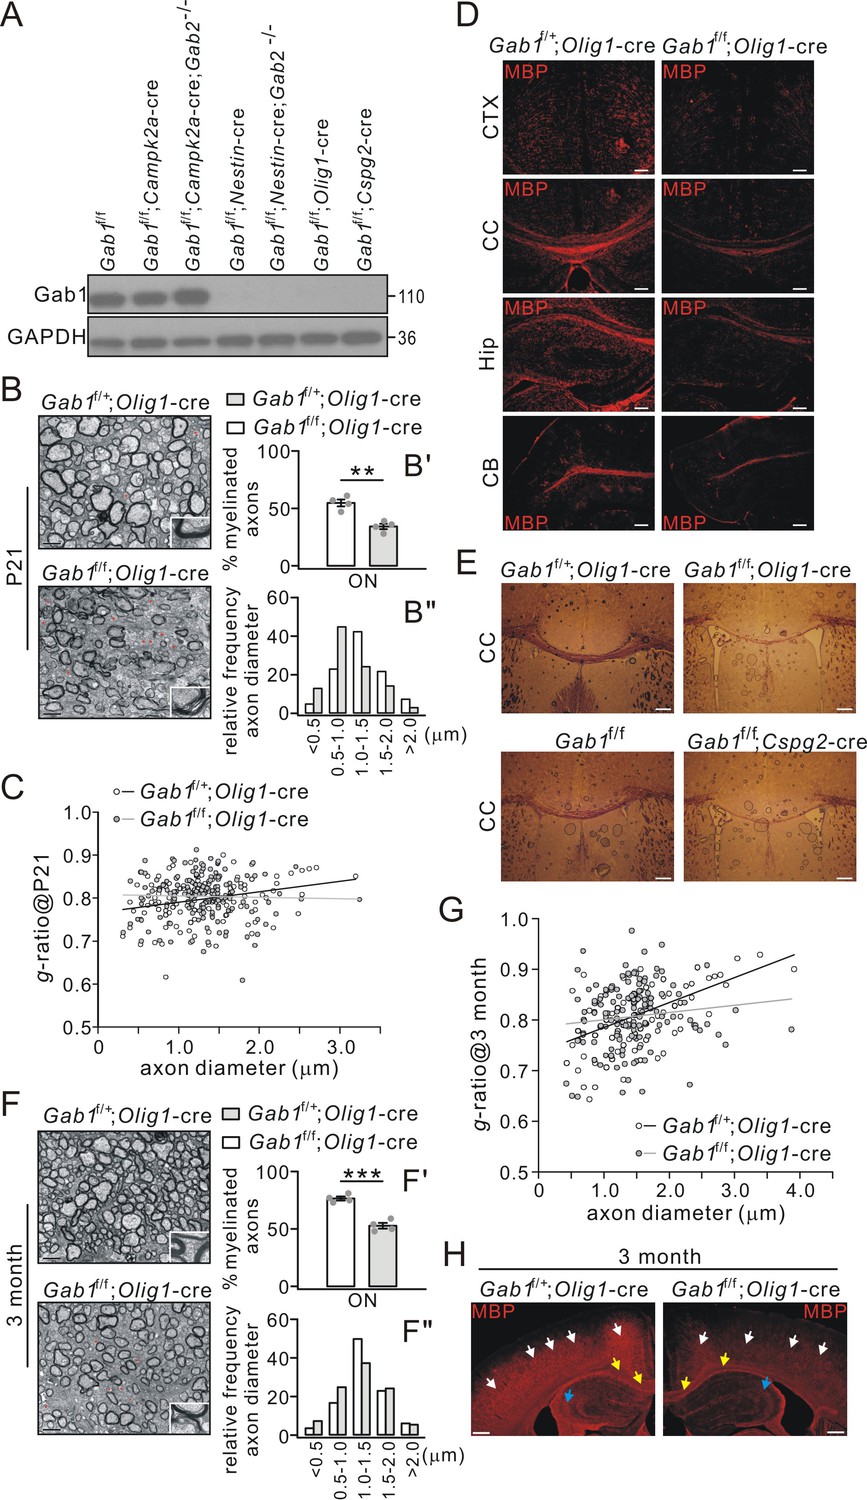
Impaired CNS myelination in conditional Gab1-knockout mice.
(A) Gab1 expression in Gab1f/f, Gab1 conditional knockout, and Gab1/Gab2 double mutant mice (P21). (B) TEM images of optic nerve (ON) from Gab1f/+;Olig1-cre and Gab1f/f;Olig1-cre mice (P21). Unmyelinated axons are indicated by red asterisks. Scale bars, 0.5 μm. The insets show typical axons from two groups. (B’) shows the percentages of myelinated axons: Gab1f/+;Olig1-cre: 55 ± 3% (4 animals); Gab1f/f;Olig1-cre: 34 ± 3% (4 animals), p=0.002, t-test, df = t(7). (B”) shows the distribution of axonal size in optic nerve (n = 160 axons in each group). (C) The relationship between diameters and g-ratios of axons from Gab1f/+;Olig1-cre and Gab1f/f;Olig1-cre mice (P21). Averaged g-ratios were 0.80 ± 0.04 (Gab1f/+;Olig1-cre, 154 axons from four animals) and 0.80 ± 0.05 (Gab1f/f;Olig1-cre, 148 axons from four animals), p=0.26, t-test, df = t(300). (D) MBP staining of cerebral cortex (CTX), corpus callosum (CC), hippocampus (Hip), and cerebellum (CB) from Gab1f/+;Olig1-cre and Gab1f/f;Olig1-cre mice (P21). Scale bars, 50 μm. (E) Black-gold staining of corpus callosum from Gab1f/+;Olig1-cre vs. Gab1f/f;Olig1-cre mice (P21) or from Gab1f/f vs. Gab1f/f;Cspg2-cre mice (P21). Scale bars, 200 μm. (F) TEM images of optic nerve (ON) from Gab1f/+;Olig1-cre and Gab1f/f;Olig1-cre mice at 3 month. Unmyelinated axons are indicated by red asterisks. Scale bars, 0.5 μm. The insets show typical axons from two groups. (F’) shows the percentages of myelinated axons: Gab1f/+;Olig1-cre: 77 ± 2% (4 animals); Gab1f/f;Olig1-cre: 53 ± 3% (4 animals), p=0.0002, t-test, df = t(7). (F”) shows the distribution of axonal size in optic nerve (n = 160 axons in each group). (G) The relationship between diameters and g-ratios of axons from mice at 3 months. Averaged g-ratios were 0.81 ± 0.06 (Gab1f/+;Olig1-cre, 141 axons from four animals) and 0.81 ± 0.06 (Gab1f/f;Olig1-cre, 141 axons from four animals), p=0.87, t-test, df = t(280). (H) MBP staining in the cerebral cortex (white arrows), the corpus callosum (yellow arrows) and the hippocampus (blue arrows) from Gab1f/+;Olig1-cre and Gab1f/f;Olig1-cre mice at 3 months. Note that MBP intensity was reduced in Gab1f/f;Olig1-cre compared to Gab1f/+;Olig1-cre mice. Scale bars, 200 μm. Gray dots indicate individual data points. **p<0.01. ***p<0.001.
Figure 4 with 1 supplement
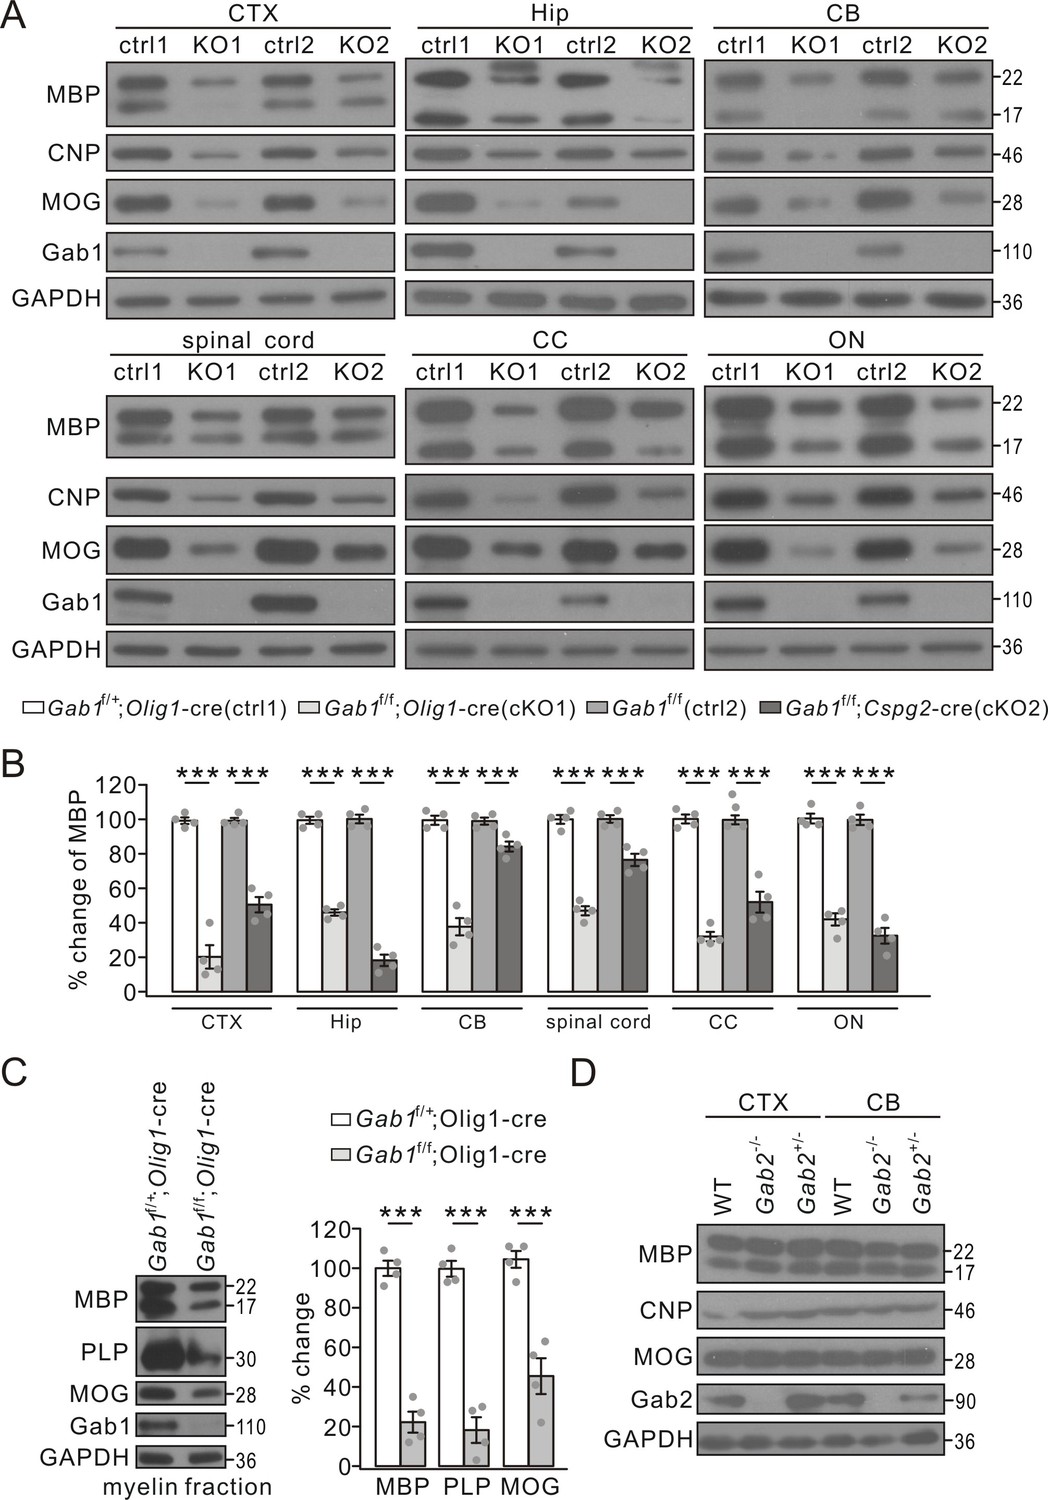
The reduced expression of myelin-related proteins in conditional Gab1 knockout mice.
(A) Western blots of myelin proteins in the cerebral cortex (CTX), the hippocampus (Hip), the cerebellum (CB), spinal cord, the corpus callosum (CC), and optic nerve (ON) from Gab1f/+;Olig1-cre (ctrl1) vs. Gab1f/f;Olig1-cre (KO1) mice or Gab1f/f (ctrl2) vs. Gab1f/f;Cspg2-cre (KO2) mice at P21. (B) MBP expression was normalized to GAPDH and percentage changes are shown. In the order of ctrl1, KO1, ctrl2, and KO2, changes are: CTX, 100 ± 2% and 20 ± 8% (p=0.000030), 100 ± 2% and 51 ± 5% (p=0.000051); Hip, 100 ± 2% and 46 ± 2% (p=0.000001), 100 ± 3% and 18 ± 4% (p=0.000001); CB, 100 ± 3% and 38 ± 6% (p=0.000034), 100 ± 2% and 84 ± 3%(p=0.0058); spinal cord, 100 ± 3% and 47 ± 3% (p=0.000007), 100 ± 3% and 76 ± 4% (p=0.0013); CC, 100 ± 3% and 32 ± 3% (p=0.000002), 100 ± 3% and 52 ± 7%(p=0.00036); ON, 100 ± 3% and 42 ± 4% (p=0.000014), 100 ± 3% and 33 ± 5% (p=0.000017). n = 4/group. t-test, df = t(7). (C) Myelin proteins in myelin fractions of corpus callosum from Gab1f/+;Olig1-cre and Gab1f/f;Olig1-cre mice at P60. GAPDH was internal control. Expressions of MBP, PLP and MOG were normalized to corresponding GAPDH and the percentage changes are shown. MBP: 100 ± 4% (Gab1f/+;Olig1-cre) and 23 ± 6% (Gab1f/f;Olig1-cre) (p=0.000023). PLP: 100 ± 4% (Gab1f/+;Olig1-cre) and 18 ± 7% (Gab1f/f;Olig1-cre) (p=0.000039). MOG: 100 ± 5% (Gab1f/+;Olig1-cre) and 45 ± 10% (Gab1f/f;Olig1-cre) (p=0.0011). n = 4/group, t-test, df = t(7). (D) Western blots of myelin proteins in the cerebral cortex (CTX) and the cerebellum (CB) from WT, Gab2-/- and Gab2+/- mice at P21. The experiment was repeated four times. Gray dots indicate individual data points. ***p<0.01.
Figure 4—figure supplement 1
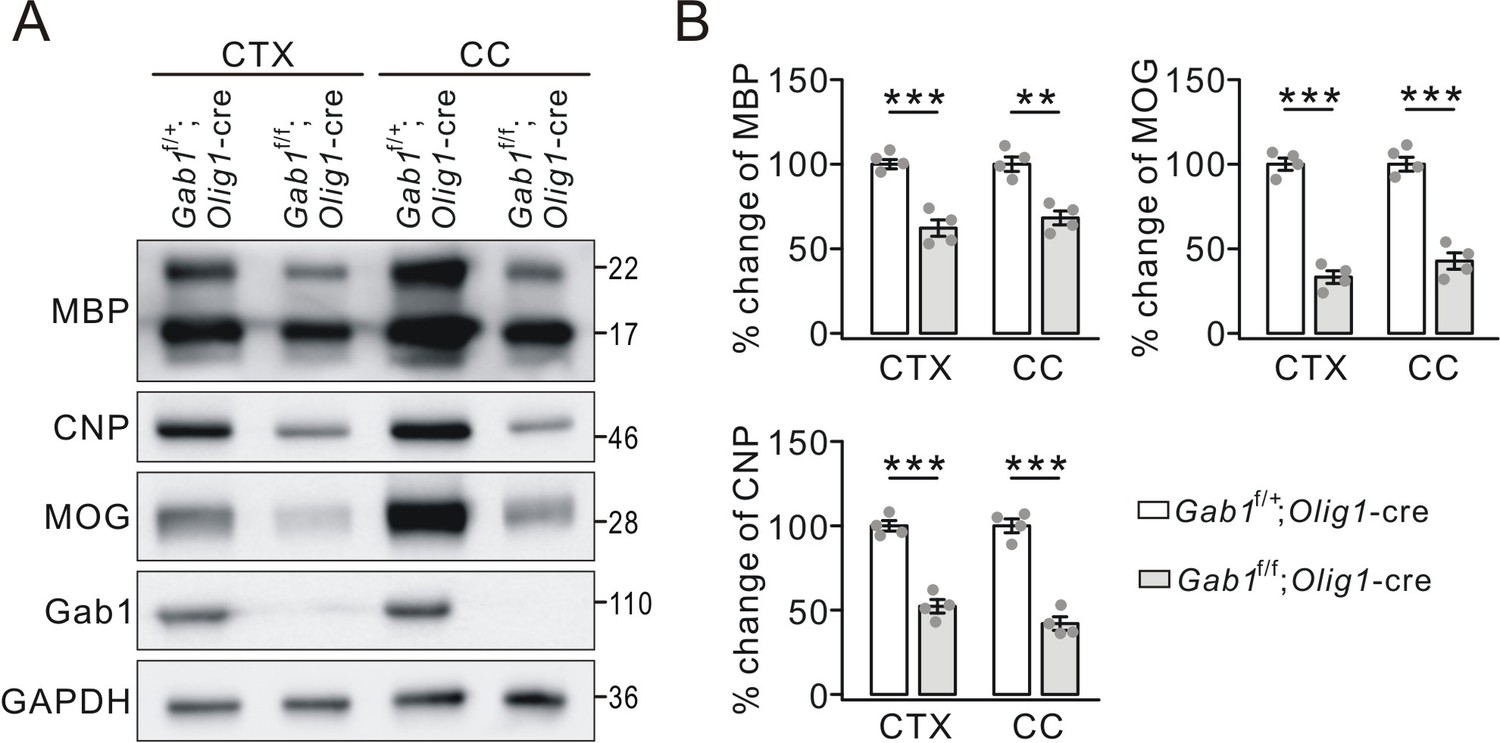
The reduced expression of myelin-related proteins in 3-month-old Gab1f/f;Olig1-cre mice.
(A) Western blots of myelin proteins in the cerebral cortex (CTX) and corpus callosum (CC) from Gab1f/+;Olig1-cre vs. Gab1f/f;Olig1-cre mice at the age of 3 months. (B) The expressions of MBP, CNP and MOG were normalized to corresponding GAPDH and the percentage changes are shown in bar graphs. MBP: CTX, 100 ± 3% (Gab1f/+;Olig1-cre) and 62 ± 6% (Gab1f/f;Olig1-cre), p=0.0003, n = 4/group, t-test, df = t(7); CC, 100 ± 5% (Gab1f/+;Olig1-cre) and 68 ± 5% (Gab1f/f;Olig1-cre), p=0.0011, n = 4/group, t-test, df = t(7). CNP: CTX, 100 ± 4% (Gab1f/+;Olig1-cre) and 52 ± 5% (Gab1f/f;Olig1-cre), p=0.00004, n = 4/group, t-test, df = t(7); CC, 100 ± 5% (Gab1f/+;Olig1-cre) and 42 ± 5% (Gab1f/f;Olig1-cre), p=0.00005, n = 4/group, t-test, df = t(7). MOG: CTX, 100 ± 4% (Gab1f/+;Olig1-cre) and 33 ± 4% (Gab1f/f;Olig1-cre), p=0.00001, n = 4/group, t-test, df = t(7); CC, 100 ± 5% (Gab1f/+;Olig1-cre) and 43 ± 6% (Gab1f/f;Olig1-cre), p=0.00001, n = 4/group, t-test, df = t(7). Gray dots indicate individual data points. **p<0.01. ***p<0.001.
Figure 5 with 1 supplement
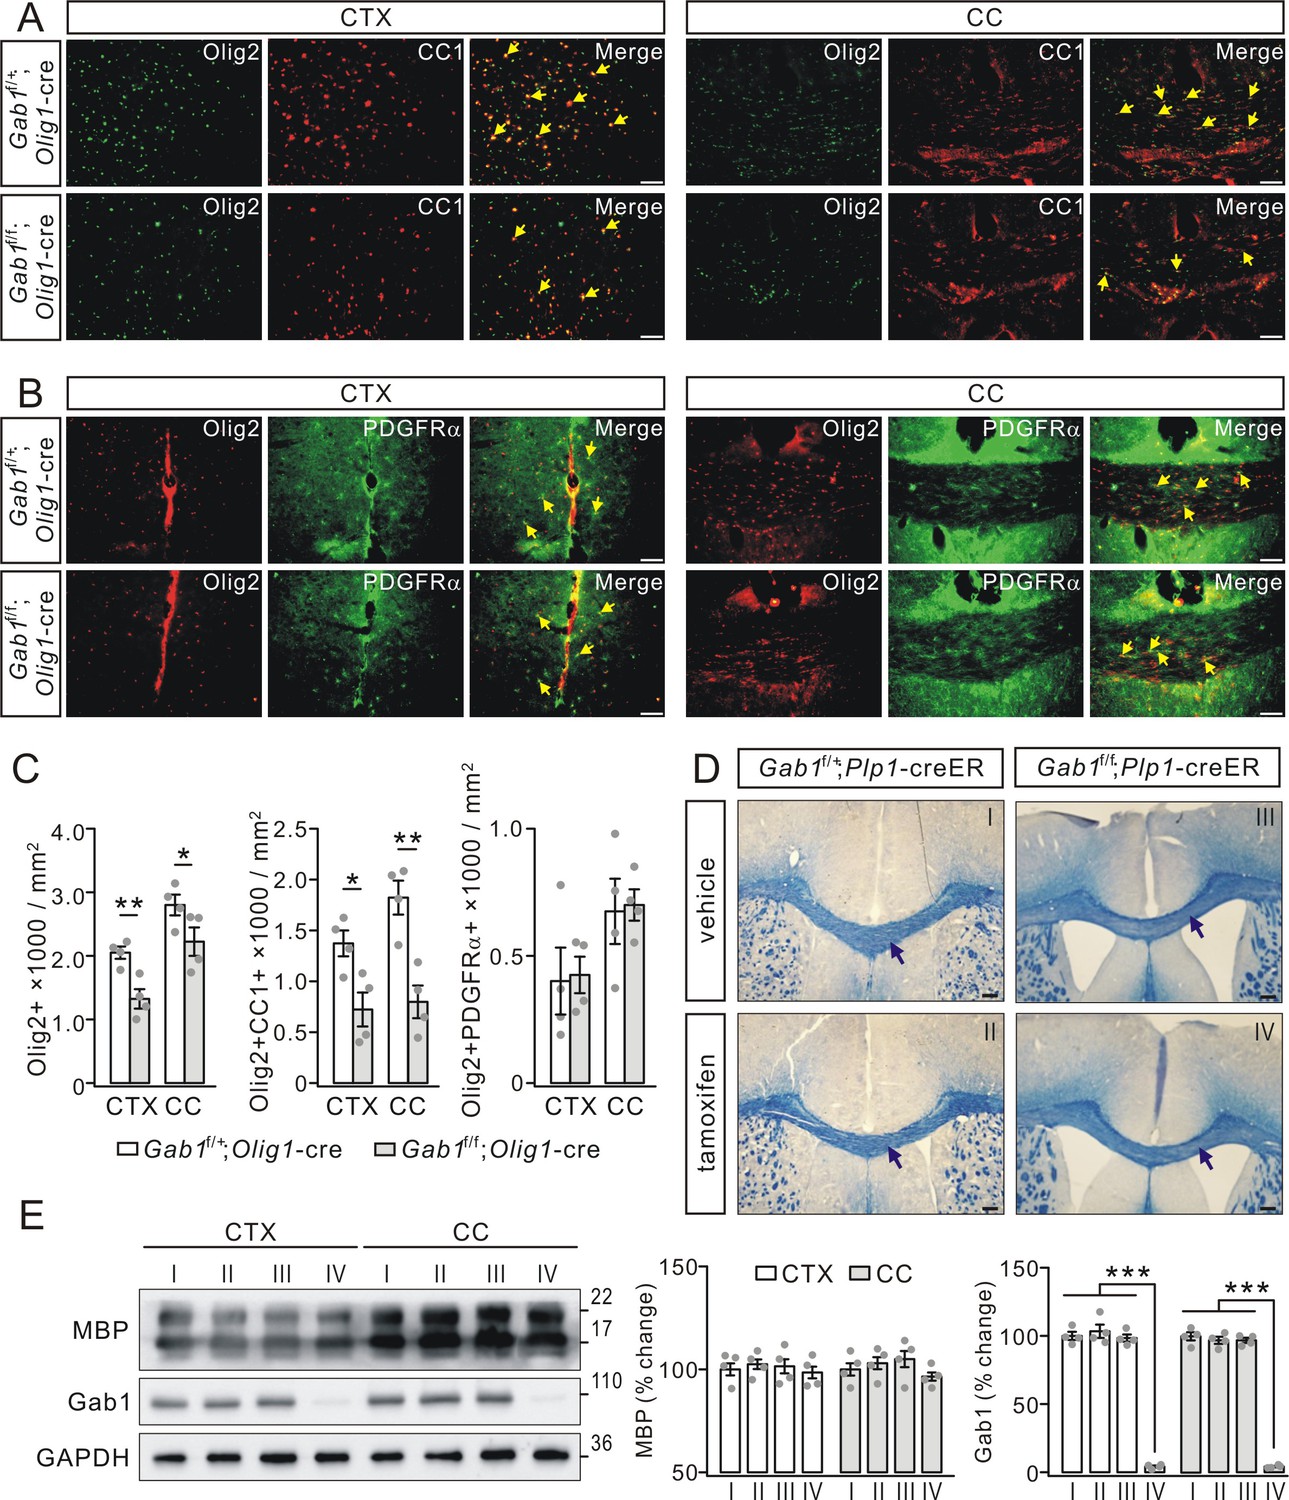
Gab1 deletion impairs OPCs differentiation.
(A) The double-immunostaining of Olig2 and CC1 in the cerebral cortex (CTX) and corpus callosum (CC) from Gab1f/+;Olig1-cre and Gab1f/f;Olig1-cre mice at P21. Cells positive to Olig2 and CC1 were recognized as myelinated OLs (yellow arrows). Scale bars, 50 μm. (B) The double-immunostaining of Olig2 and PDGFRα in the cerebral cortex and corpus callosum from Gab1f/+;Olig1-cre and Gab1f/f;Olig1-cre mice at P21. Cells positive to Olig2 and PDGFRα were recognized as OPCs (yellow arrows). Scale bars, 50 μm. (C) Bar graphs show the densities of Olig2+, Olig2+CC1+, and Olig2+PDGFRα+ cells in Gab1f/f;Olig1-cre and Gab1f/+;Olig1-cre mice at P21. The densities of Olig2+ cells were 2050 ± 111 (Gab1f/+;Olig1-cre) and 1325 ± 176 cells/mm2 (Gab1f/f;Olig1-cre) (CTX; p=0.007), and 2800 ± 188 (Gab1f/+;Olig1-cre) and 2225 ± 258 cells/mm2 (Gab1f/f;Olig1-cre) (CC; p=0.024). The densities of Olig2+CC1+ cells were 1375 ± 148 (Gab1f/+;Olig1-cre) and 724 ± 193 cells/mm2 (Gab1f/f;Olig1-cre) (CTX; p=0.02), and 1824 ± 193 (Gab1f/+;Olig1-cre) and 800 ± 186 cells/mm2 (Gab1f/f;Olig1-cre) (CC; p=0.005). The densities of Olig2+PDGFRα+ cells were 401 ± 152 (Gab1f/+;Olig1-cre) and 425 ± 83 cells/mm2 (Gab1f/f;Olig1-cre) (CTX; p=0.87), and 675 ± 148 (Gab1f/+;Olig1-cre) and 700 ± 71 cells/mm2 (Gab1f/f;Olig1-cre) (CC; p=0.87). n = 4/group, t-test, df = t(7). (D) Gab1f/+;Plp1-creER and Gab1f/f;Plp1-creER mice were (P180) treated with either vehicle or tamoxifen, and the corpus callosum of mice were collected at day 28 p.i. and stained with cyanine. No difference in the density of white matter tracts between vehicle and tamoxifen groups, as indicated by black arrows. Scale bars, 100 μm. (E) Western blots show that Gab1 was deleted in the cerebral cortex and the corpus callosum of Gab1f/f;Plp1-creER mice treated with tamoxifen. The Roman numbers I, II, III and IV that are also marked in (D) represent individual condition, Gab1f/+;Plp1-creER+vehicle, Gab1f/+;Plp1-creER+tamoxifen, Gab1f/f;Plp1-creER+vehicle, and Gab1f/f;Plp1-creER+tamoxifen, The percentage changes of MBP expression normalized to condition I were: cortex, 100 ± 4% (I), 102 ± 3%(II), 102 ± 5% (III), 99 ± 4% (IV); corpus callosum: 100 ± 4% (I), 103 ± 4%(II), 105 ± 6% (III), 97 ± 3% (IV). The percentage changes of Gab1 expression normalized to condition I were: cortex, 100 ± 3% (I), 103 ± 6% (II), 98 ± 3% (III), 4 ± 1% (IV); corpus callosum, 100 ± 4% (I), 97 ± 3% (II), 97 ± 2% (III), 4 ± 1% (IV). For all statistics, n = 4/group, t-test, df = t(7). Gray dots indicate individual data points. *p<0.05. **p<0.01. ***p<0.001.
Figure 5—figure supplement 1
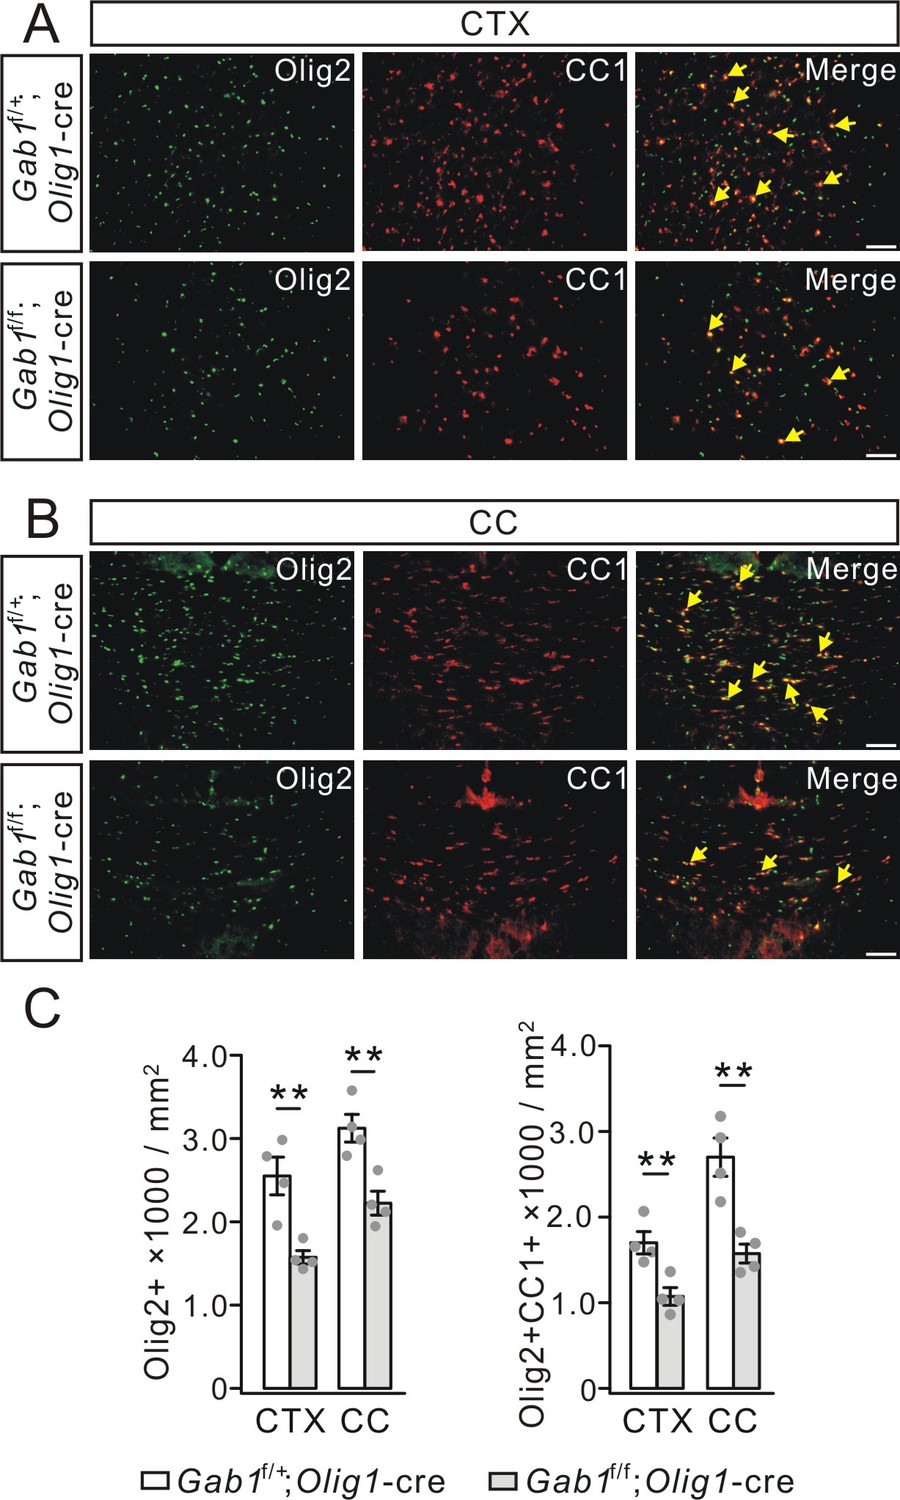
Mature OLs decreased in Gab1f/f;Olig1-cre mice at 3 months.
(A) Double-immunostaining of Olig2 and CC1 in the cerebral cortex (CTX) from Gab1f/+;Olig1-cre and Gab1f/f;Olig1-cre mice. Cells positive to Olig2 and CC1 were recognized as myelinated OLs (yellow arrows). Scale bars, 50 μm. (B) Double-immunostaining of Olig2 and CC1 in the corpus callosum (CC) from Gab1f/+;Olig1-cre and Gab1f/f;Olig1-cre mice. Scale bars, 50 μm. (C) Bar graphs show the densities of Olig2+ and Olig2+CC1+ cells. The densities of Olig2+ cells were 2550 ± 259 (Gab1f/+;Olig1-cre) and 1575 ± 92 cells/mm2 (Gab1f/f;Olig1-cre) (CTX; p=0.006), and 3125 ± 192 (Gab1f/+;Olig1-cre) and 2225 ± 165 cells/mm2 (Gab1f/f;Olig1-cre) (CC; p=0.006). The densities of Olig2+CC1+ cells were 1700 ± 148 (Gab1f/+;Olig1-cre) and 1076 ± 121 cells/mm2 (Gab1f/f;Olig1-cre) (CTX; p=0.009), and 2700 ± 255 (Gab1f/+;Olig1-cre) and 1575 ± 128 cells/mm2 (Gab1f/f;Olig1-cre) (CC; p=0.0038). For all statistics, n = 4/group, t-test, df = t(7). Gray dots indicate individual data points. **p<0.01.
Figure 6

Effects of Gab1 knockdown on OPC differentiation in vitro.
(A) OPC cultures were transfected with lentiviral vector-encoding with GFP (NC) or GFP-tagged Gab1 shRNA (shRNA), stimulated with T3 for 3 days, and immunostained with anti-MBP (red) and anti-Olig2 (blue) antibodies. Scale bar, 40 μm. (B) Expressions of Gab1, MBP, GFP, and GAPDH in OPCs treated with NC or shRNA following triiodothyronine treatment. Gab1 and MBP were normalized to corresponding GAPDH and percent changes are summarized. Gab1: 100 ± 4% (NC) and 20 ± 5% (shRNA) (p=0.00005). MBP: 100 ± 3% (NC) and 37 ± 7% (shRNA) (p=0.000075). n = 4/group. t-test, df = t(7). Gray dots indicate individual data points. ***p<0.001.
Figure 7
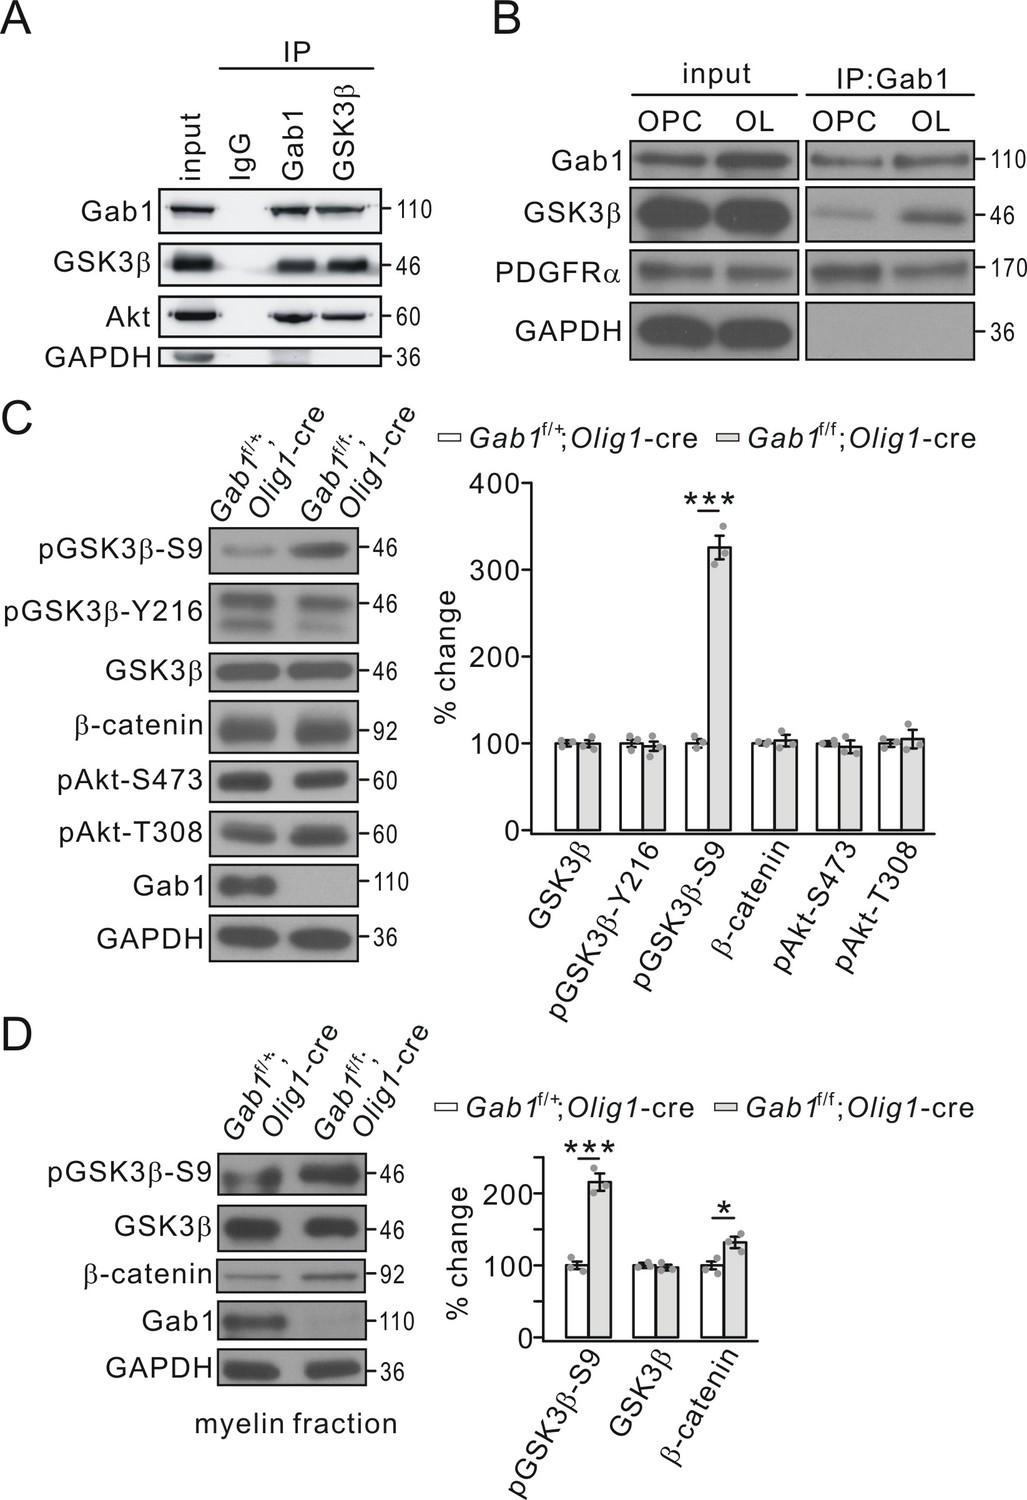
Gab1 binds to GSK3β and modulates its activity.
(A) Precleared cortical lysates from wild-type mice (P21-23) were immunoprecipitated with mouse anti-Gab1 and anti-GSK3β antibodies. Immunoprecipitates were probed with antibodies to Gab1 (rabbit polyclonal antibody), GSK3β, Akt and GAPDH. The experiment was repeated three times. Rabbit IgG was used as the negative control. (B) The lysates of cultured OPCs and OLs were immunoprecipitated with mouse anti-Gab1 antibody. Immunoprecipitates were probed with antibodies to Gab1 (rabbit polyclonal antibody), GSK3β, PDGFRα, and GAPDH. The experiment was repeated three times. (C) The expression and phosphorylation of GSK3β, β-catenin and Akt in cerebral cortex from Gab1f/+;Olig1-cre and Gab1f/f;Olig1-cre mice at P21. GAPDH was the internal control. The increase of pGSK3β-S9 was 325 ± 16% (p=0.000077 vs control) in Gab1f/f;Olig1-cre mice. n = 3/group. t-test, df = t(5). (D) Expression and phosphorylation of GSK3β and β-catenin in myelin fractions from Gab1f/+;Olig1-cre and Gab1f/f;Olig1-cre mice at P60. GAPDH was the internal control. Percentage changes of pGSK3β-S9 and β-catenin were 216 ± 12% (p=0.00036 vs control) and 133 ± 8% (p=0.013 vs control) in Gab1f/f;Olig1-cre mice. n = 3/group. t-test, df = t(5). Gray dots indicate individual data points. *p<0.05. ***p<0.001.
Figure 8
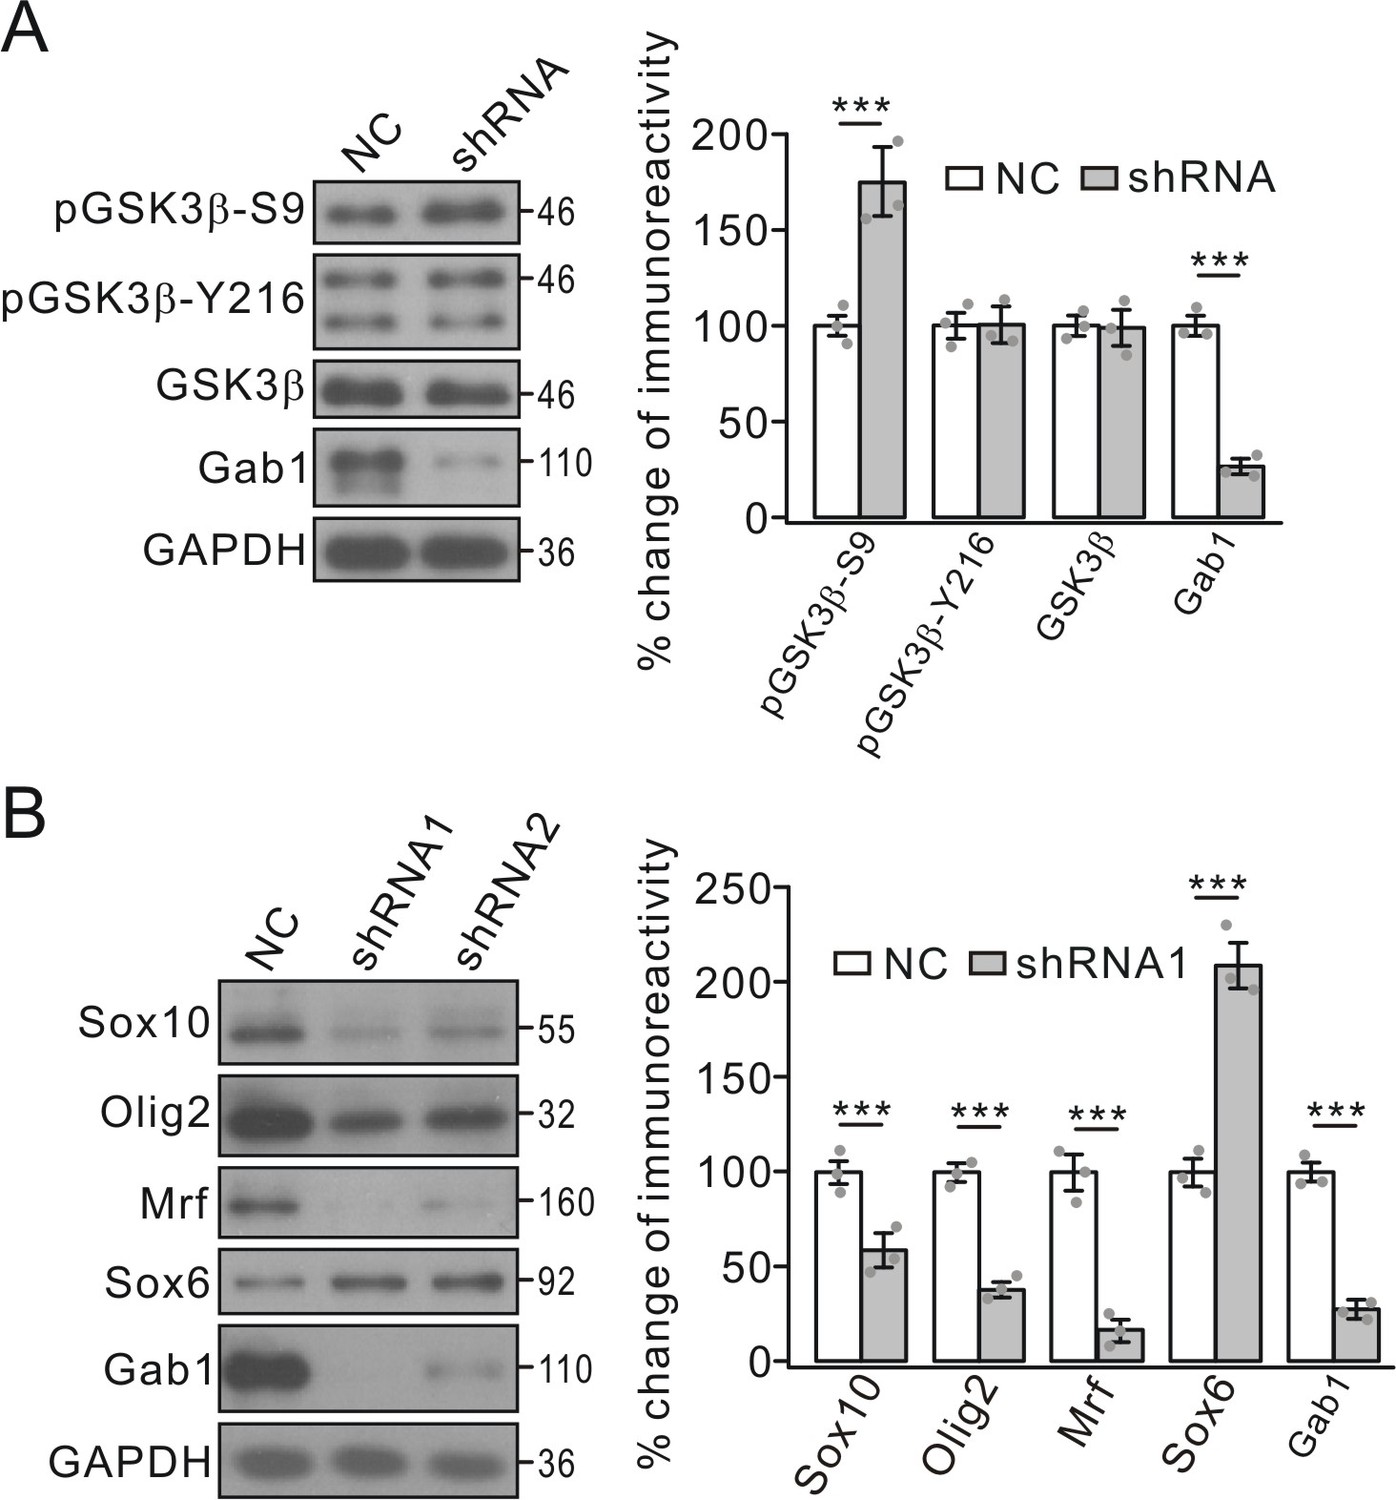
Effects of Gab1-knockdown on GSK3β and transcription factors.
(A) OPC cultures were transfected with lentiviral vector-encoding with NC or shRNA, and the phosphorylation and expression of GSK3β were examined. GAPDH was the internal control. pGSK3β-S9p and Gab1 were 175 ± 16% (p=0.0063 vs control) and 27 ± 4% (p=0.00022 vs control) in shRNA compared to NC, respectively. n = 3/group. t-test, df = t(5). (B) Expressions of transcription factors in OPCs transfected with NC or shRNAs. Lysates were immunoblotted with antibodies against Sox10, Olig2, Mrf, Sox6 and Gab1. GAPDH was the control. Percentage changes in shRNA1 group are 58 ± 9% (Sox10) (p=0.0083 vs control), 38 ± 4% (Olig2) (p=0.0006 vs control), 16 ± 6% (Mrf) (p=0.00031 vs control), 209 ± 12% (Sox6) (p=0.00074 vs control), and 27 ± 3% (Gab1) (p=0.00022 vs control). n = 3/group. t-test, df = t(5). Gray dots indicate individual data points. ***p<0.001.
Figure 9
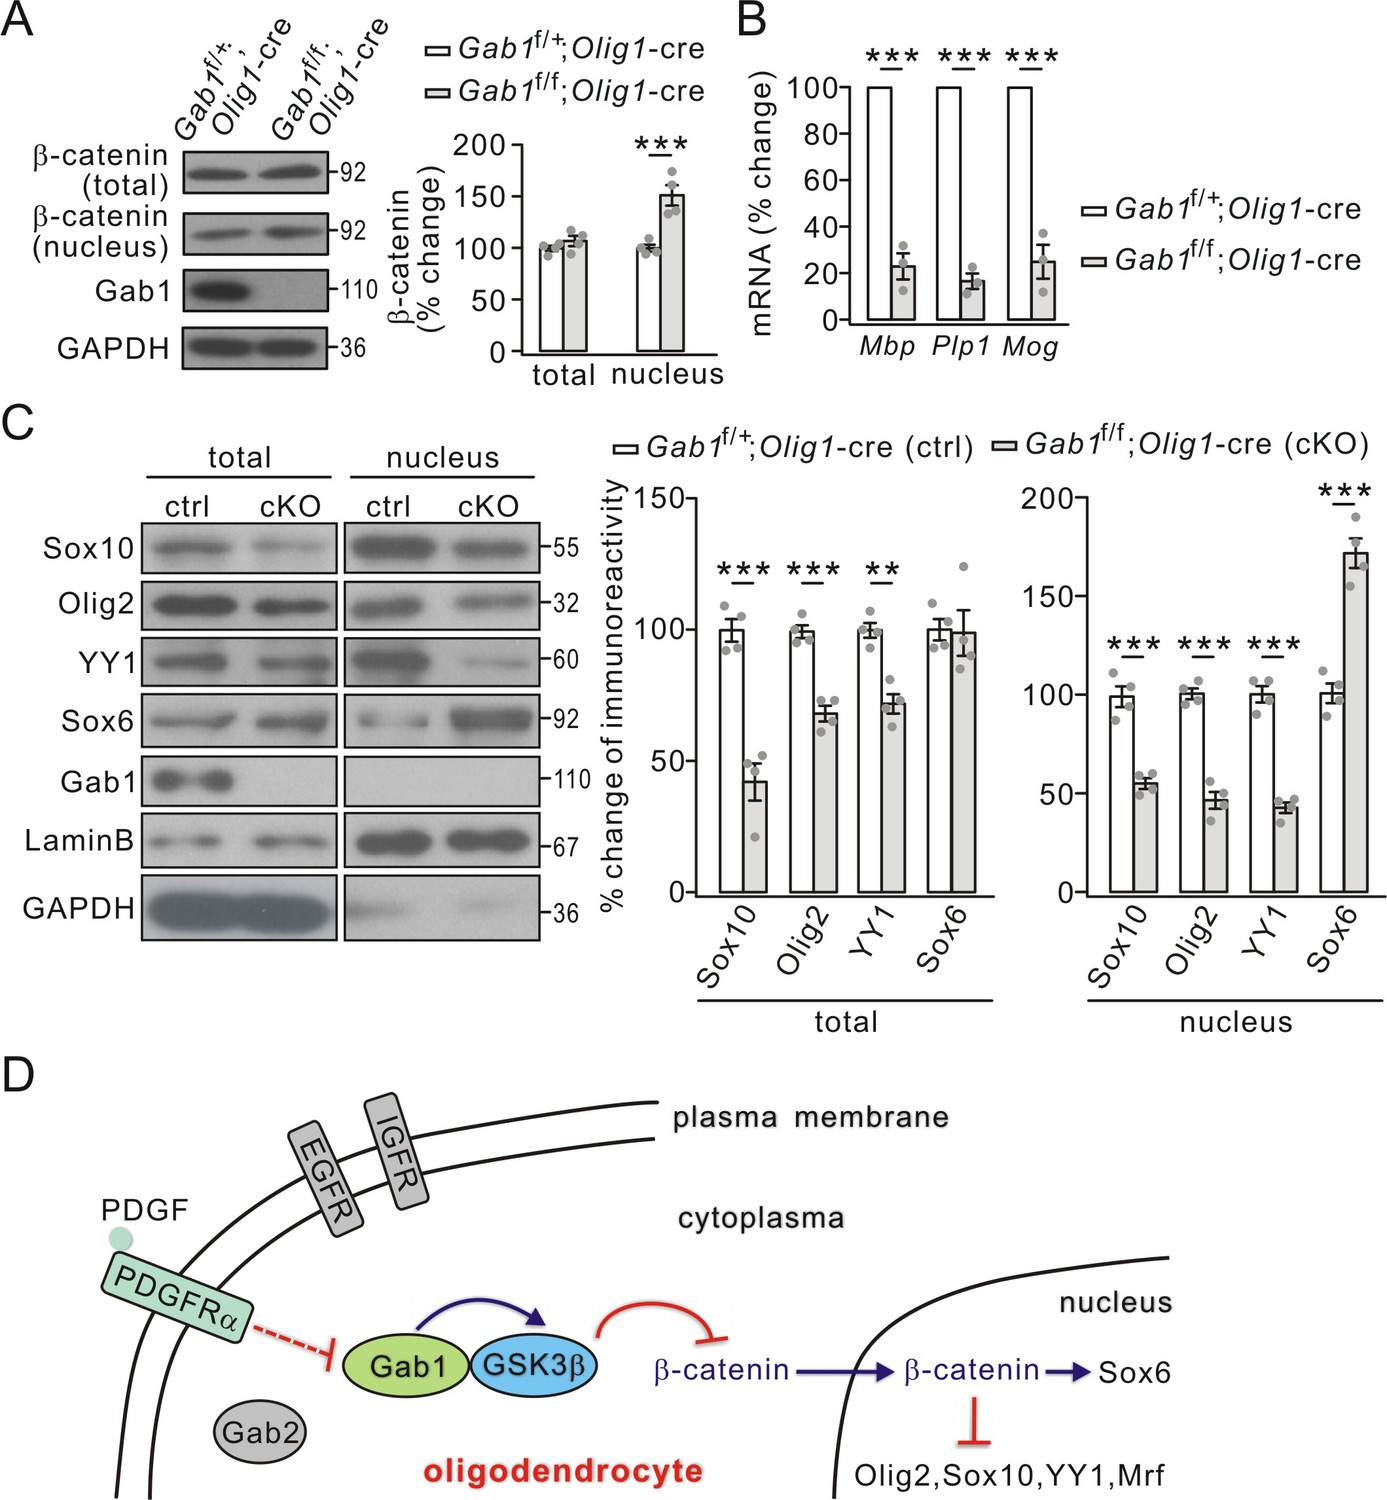
Effects of conditional Gab1 deletion on β-catenin and transcription factors.
(A) β-catenin expression in total and nuclear fractions from Gab1f/+;Olig1-cre and Gab1f/f;Olig1-cre mice at P21. GAPDH was the internal control. Percentage changes were 108 ± 6% (total; p=0.25) and 151 ± 11% (nuclear; p=0.0027) in Gab1f/f;Olig1-cre mice. n = 4/group. t-test, df = t(7). (B) mRNA levels of myelin genes in Gab1f/+;Olig1-cre and Gab1f/f;Olig1-cre mice. Gapdh was the internal control. Percentage changes in Gab1f/f;Olig1-cre group were 23 ± 7% (Mbp; p=0.00015 vs control), 34 ± 4% (Plp1; p=0.000013 vs control) and 25 ± 9% (Mog; p=0.00054 vs control). n = 3/group. t-test, df = t(5). (C) Total and nuclear transcription factors in Gab1f/+;Olig1-cre (ctrl) and Gab1f/f;Olig1-cre (cKO) mice at P21. Lysates were immunoblotted with antibodies against Sox10, Olig2, YY1, Sox6, Gab1, LaminB, and GAPDH. All proteins were normalized to GAPDH (total) or LaminB (nucleus) and percent changes are shown. For total, percentage changes were: 42 ± 8% (Sox10; p=0.00044 vs control), 68 ± 4% (Olig2; p=0.0002 vs control), 72 ± 4% (YY1; p=0.0011 vs control), and 99 ± 10% (Sox6; p=0.9 vs control); p=vs control. For nucleus, percentage changes were 55 ± 3% (Sox10; p=0.00031 vs control), 47 ± 5% (Olig2; p=0.000041 vs control), 43 ± 3% (YY1; p=0.000025 vs control), and 172 ± 9% (Sox6; p=0.00023 vs control). n = 4/group. t-test, df = t(7). Gray dots indicate individual data points. (D) A working model illustrates the functions of Gab1 in OLs. Gab1 is specifically down-regulated by PDGF but not EGF or IGF. In WT condition, Gab1 binds to GSK3β and increases its activity, thereby inhibits nuclear accumulation of β-catenin and changes the expression of nuclear factors. As the result, Gab1 ablation leads to impaired OPC differentiation. Gray dots indicate individual data points. **p<0.01. ***p<0.001.
Author response image 1

The expression of β-catenin in the cytoplasma and nucleus.
Additional files
Download links
A two-part list of links to download the article, or parts of the article, in various formats.
Downloads (link to download the article as PDF)
Open citations (links to open the citations from this article in various online reference manager services)
Cite this article (links to download the citations from this article in formats compatible with various reference manager tools)
Gab1 mediates PDGF signaling and is essential to oligodendrocyte differentiation and CNS myelination
eLife 9:e52056.
https://doi.org/10.7554/eLife.52056


