Homeostatic control of cell wall hydrolysis by the WalRK two-component signaling pathway in Bacillus subtilis
- Harvard Medical School, United States
Figures
Figure 1 with 2 supplements

B. subtilis increases lytE expression in the absence of CwlO activity to maintain cell envelope integrity.
(A) Immunoblot analysis of LytE produced under the control of its native promoter or under IPTG control. The indicated strains (∆lytE, wild-type (wt), ∆cwlO, and ∆cwlO ∆lytE P(IPTG)-lytE (LytE = wt)) were grown in CH medium with or without 500 µM IPTG and harvested at an OD600 ~0.4. SigA protein levels were analyzed to control for loading. (B) Bar graph showing β-galactosidase activity from a lytE promoter (PlytE) fusion to lacZ in wild-type (wt), ∆cwlO, ∆ftsEX, and ∆lytE strains. Activity was assayed in exponentially growing cultures in LB. Error bars represent standard deviation from three biological replicates. Asterisks indicate p-values calculated using Welch’s unequal variances t-test compared to wildtype (*<0.02, **<0.005). (C) Representative fluorescent images of strains from (A) harboring cytoplasmic mCherry grown under identical conditions as in (A). Membranes were visualized with TMA-DPH (top), and merged images of cytoplasmic mCherry and phase-contrast are shown (bottom). Scale bar indicates 2 μm. (D) Bar graph showing the percentage of cells with envelope integrity defects in wild-type (wt), ∆cwlO, and a ∆cwlO mutant in which LytE levels are held at levels equivalent to wild-type (LytE = wt). Cells without cytoplasmic fluorescence and/or that stained with propidium iodide were scored as lysed or PI positive. >500 cells were scored per strain. The images and immunoblots in this figure were representatives from three independent experiments.
-
Figure 1—source data 1
Figure 1 B-galactosidase assay Miller Units.
- https://cdn.elifesciences.org/articles/52088/elife-52088-fig1-data1-v2.xlsx
Figure 1—figure supplement 1

Cells harboring an ftsE Walker A mutation increases lytE transcription.
Bar graph showing β-galactosidase activity from a lytE promoter (PlytE) fused to lacZ in wild-type (wt), ∆cwlO, and ftsE(D162A) strains. Activity was assayed in exponentially growing cultures in LB. Error bars represent standard deviation from three biological replicates.
-
Figure 1—figure supplement 1—source data 1
Figure 1—figure supplement 1 B-galactosidase assay Miller Units.
- https://cdn.elifesciences.org/articles/52088/elife-52088-fig1-figsupp1-data1-v2.xlsx
Figure 1—figure supplement 2

B. subtilis increases LytE levels to maintain cell envelope integrity in the absence of CwlO.
Representative image of ∆cwlO ∆lytE P(IPTG)-lytE cells harboring cytoplasmic GFP and expressing lytE at wt levels (LytE levels = wt). Cells were grown to exponential phase in CH medium supplemented with 500 μM IPTG and were analyzed by fluorescence microscopy. Membranes were visualized with TMA-DPH (membrane) and propidium iodide (PI) was used as a proxy for cell envelope integrity. Overlays of cytoplasmic GFP and phase-contrast or cytoplasmic GFP and PI are shown. Red carets highlight PI-positive cells that have lysed based on loss of cytoplasmic GFP signal. White carets highlight PI-negative cells that have lysed. Yellow carets highlight PI-positive cells that have not undergone lysis based on retention of cytoplasmic GFP signal. Scale bar indicates 2 μm.
Figure 2 with 1 supplement
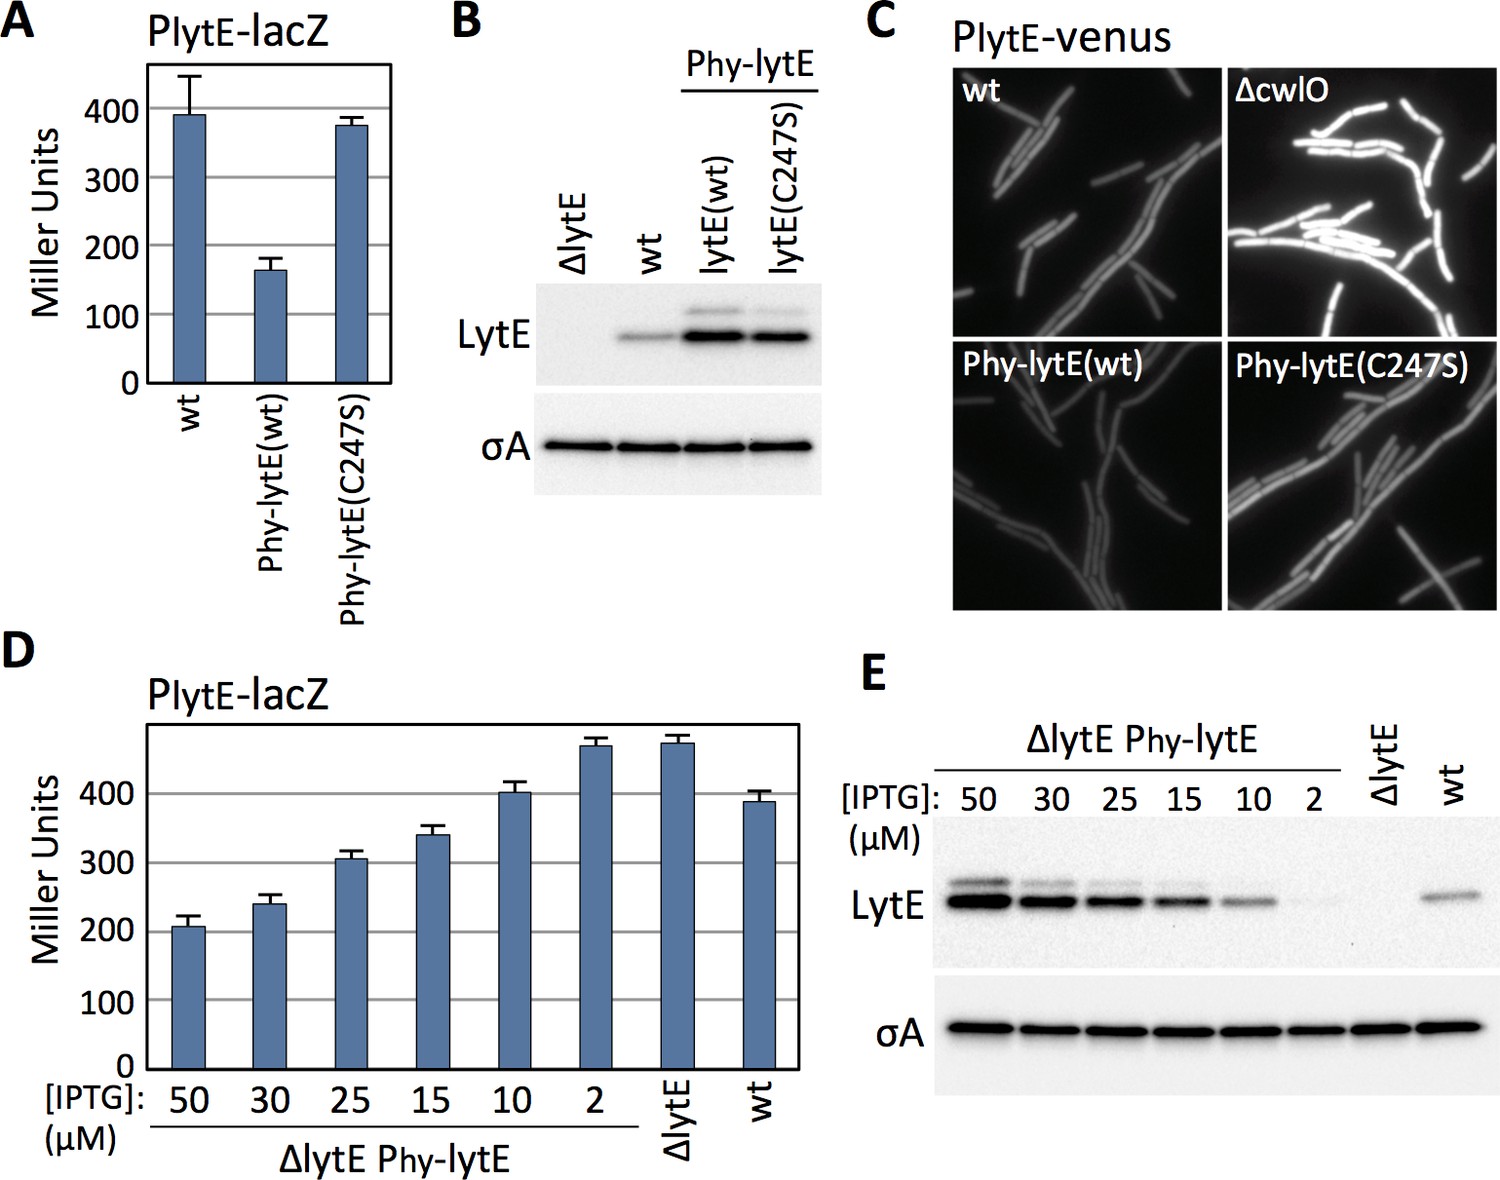
B. subtilis modulates lytE transcription in response to changes in D,L-endopeptidase activity.
(A) Bar graph showing β-galactosidase activity from the PlytE-lacZ reporter in wild-type (wt), and strains harboring the lytE gene or a catalytic mutant (C247S) under the control of the strong IPTG-inducible promoter Phyperspank (Phy) and with an optimized ribosome binding site. Activity was assayed in exponentially growing cultures 60 min after the addition of 50 µM IPTG. Error bars represent standard deviation from three biological replicates. (B) Immunoblot analysis of LytE in the same strains as in (A), 60 min after induction with 50 µM IPTG. SigA protein levels were analyzed to control for loading. (C) Representative images of cytoplasmic Venus fluorescence from the PlytE-venus reporter in the indicated strains visualized 30 min after addition of 50 μM IPTG. (D) Bar graph showing β-galactosidase activity from PlytE-lacZ in the indicated strains. Cells were grown in LB medium or LB medium supplemented with the indicated concentrations of IPTG. β-galactosidase activity was assayed 60 min after induction of lytE. Error bars represent standard deviation from three biological replicates. (E) Immunoblot analysis of LytE and SigA in the strains used in (D). All representative images and immunoblots in this figure are from one of three independent experiments.
-
Figure 2—source data 1
Figure 2A B-galactosidase assay Miller Units.
- https://cdn.elifesciences.org/articles/52088/elife-52088-fig2-data1-v2.xlsx
-
Figure 2—source data 2
Figure 2D B-galactosidase assay Miller Units.
- https://cdn.elifesciences.org/articles/52088/elife-52088-fig2-data2-v2.xlsx
Figure 2—figure supplement 1
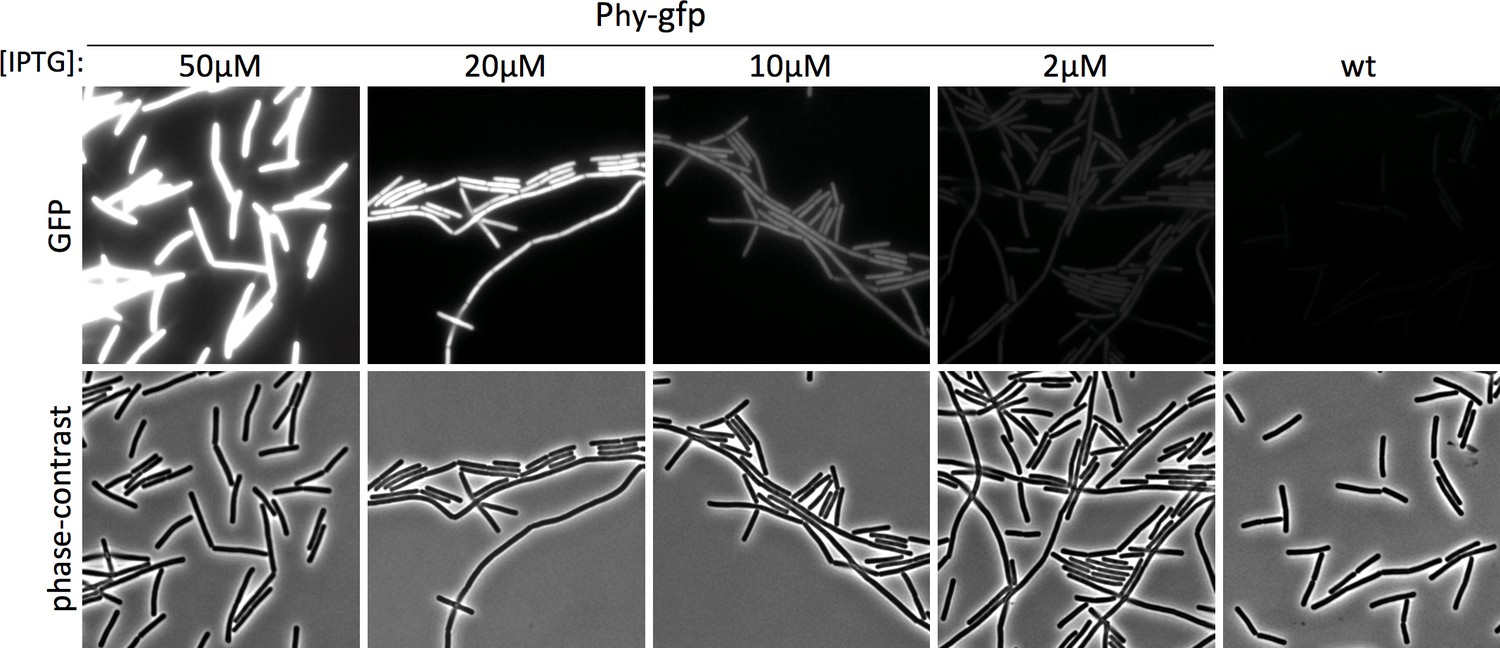
Expression from the IPTG-regulated promoter (Phyperspank) is homogenous across all cells in the population.
Representative images of cells expressing cytoplasmic GFP from the Phyperspank (Phy) promoter. Cells were grown in LB medium and induced with the indicated concentrations of IPTG and imaged 60 min later. Wild-type cells (wt) that lack the GFP were used as a negative control.
Figure 3

Modulation of lytE transcription in response to changes in D,L-endopeptidase activity requires WalR.
(A) Schematic diagram of the lytE gene with its two promoters recognized by SigI and SigA. Phosphorylated WalR binds to two sites (box 1 and 2) flanking the SigA promoter. (B) Bar graph showing β-galactosidase activity from the PlytE-lacZ reporter in the indicated strains. Activity was assayed in exponentially growing cultures in LB medium. Error bars represent standard deviation from three biological replicates. (C) Immunoblot analysis of LytE protein levels in the strains used in (B). SigA levels were analyzed to control for loading. Immunoblots from one of two biological replicates are shown. (D) Spot dilutions of the indicated strains in the presence and absence of cwlO expression. Strains were grown in the presence of IPTG (500 µM) to OD600 ~2.0. The cultures were washed twice without inducer, normalized to an OD600 = 1.5, 10-fold serially diluted, and spotted (5 µL) onto LB agar plates with or without 500 µM IPTG. Representative plates from one of two biological replicates are shown. (E) Bar graph showing β-galactosidase activity from the PlytE-lacZ reporter in indicated strains. Strains harboring the strong IPTG-inducible promoter fusion to lytE (Phy-lytE) were induced for 60 min with 50 µM IPTG. Error bars represent standard deviation from three biological replicates.
-
Figure 3—source data 1
Figure 3B B-galactosidase assay Miller Units.
- https://cdn.elifesciences.org/articles/52088/elife-52088-fig3-data1-v2.xlsx
-
Figure 3—source data 2
Figure 3E B-galactosidase assay Miller Units.
- https://cdn.elifesciences.org/articles/52088/elife-52088-fig3-data2-v2.xlsx
Figure 4 with 5 supplements
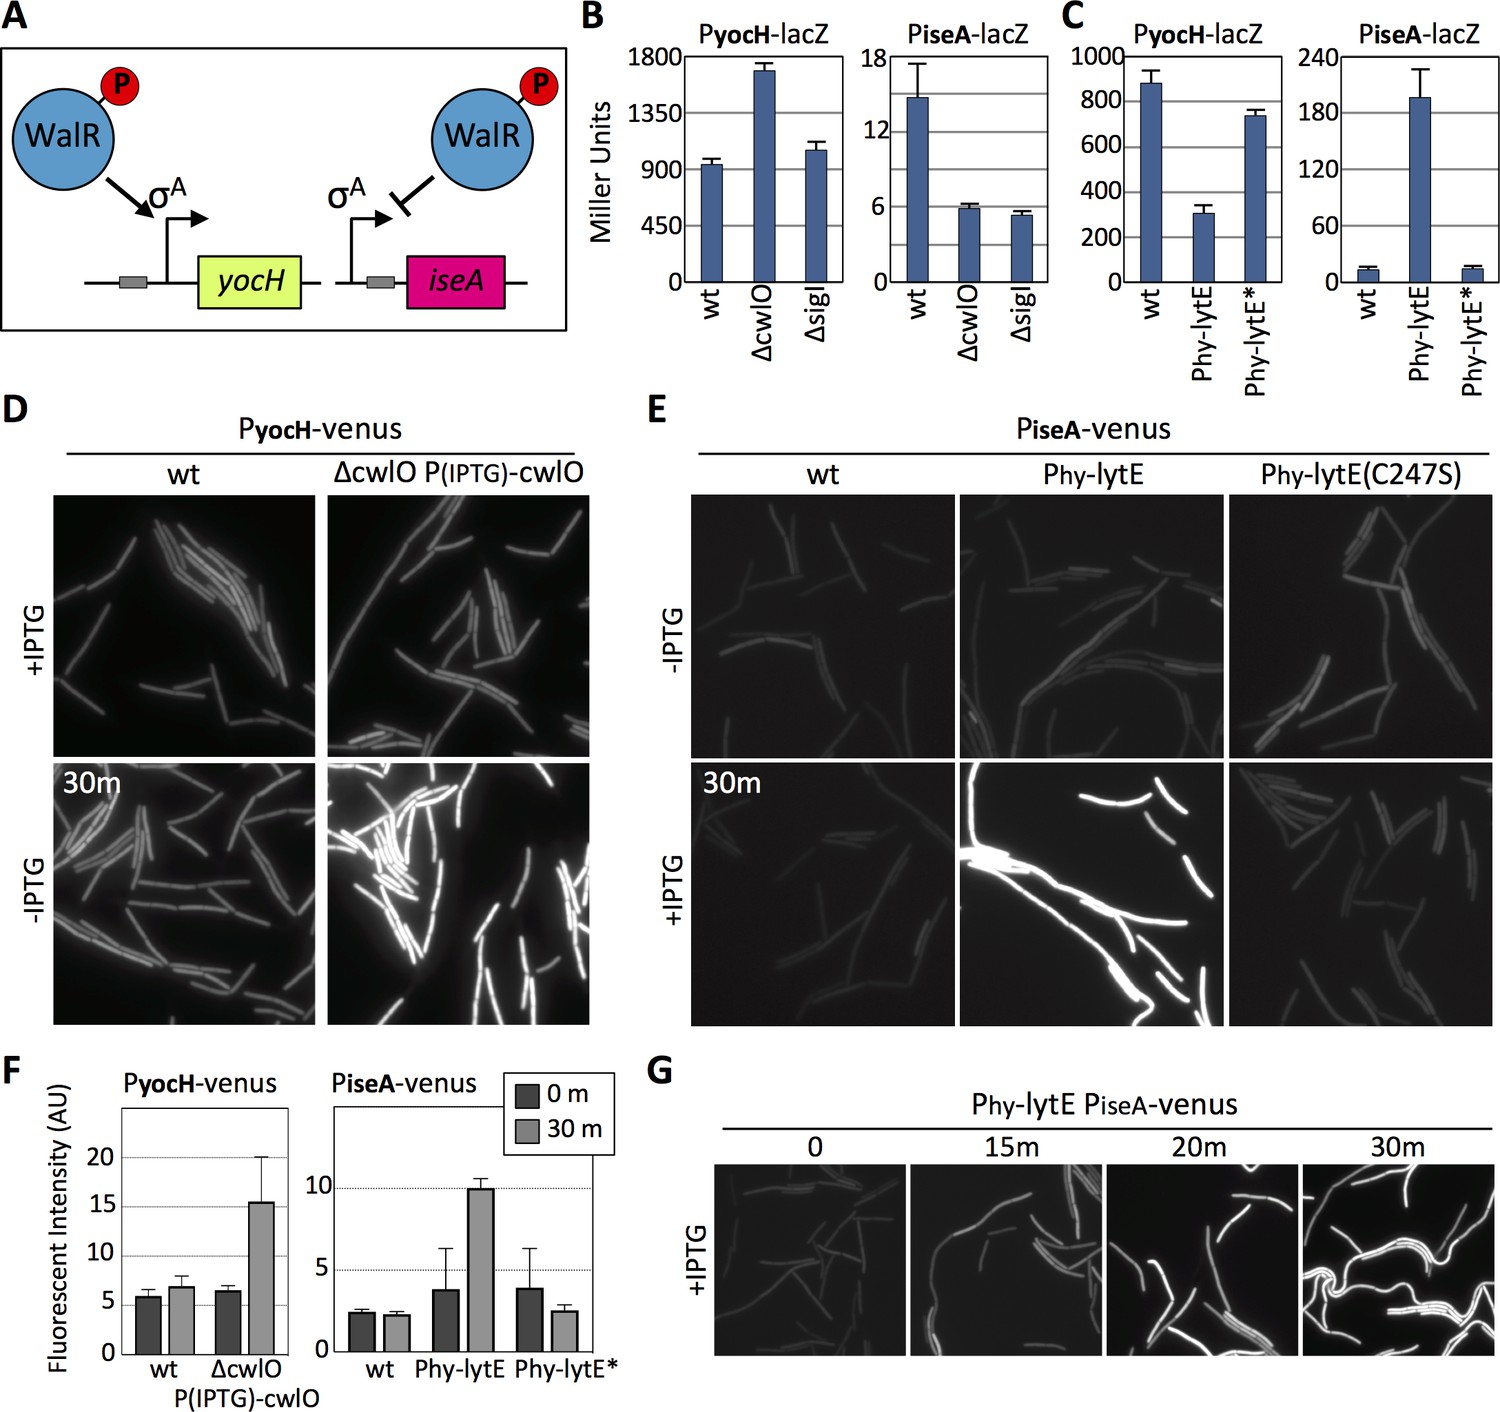
The WalRK signaling pathway responds to changes in D,L-endopeptidase activity.
(A) Schematic diagrams of the yocH and iseA genes. Phosphorylated WalR activates transcription of yocH and represses transcription of iseA. The positions of the WalR binding sites (gray boxes) are shown. (B and C) Bar graph showing β-galactosidase activity from PyocH-lacZ and PiseA-lacZ reporters in the indicated strains. Activity was assayed in exponentially growing cultures in LB medium. Strains harboring strong IPTG-inducible promoter fusion to lytE (Phy-lytE) and the LytE catalytic mutant (C247S) (Phy-lytE*) were induced for 60 min with 50 µM IPTG. Error bars represent standard deviation from three biological replicates. (D) Representative fluorescent images of the indicated strains harboring PyocH-venus. Cells were grown to OD600 ~0.3 in LB medium supplemented with 1 mM IPTG, washed in medium lacking inducer and imaged before and 30 min after growth in LB medium lacking inducer. (E) Representative fluorescent images of the indicated strains harboring PiseA-venus. Strains were grown to OD600 ~0.3 in LB medium and imaged before and 30 min after addition of IPTG (50 µM). Representative images are from one of three independent experiments. (F) Quantification of the average fluorescence intensity, normalized to cell area, of strains shown in (D) and (E).>1000 cells were analyzed from three independent experiments. Dark gray bars (0 m) are from cells prior to IPTG removal for the CwlO depletion experiment monitoring PyocH-venus and prior to IPTG addition for the lytE over-expression experiment monitoring PiseA-venus. Light gray bars (30 m) are from cells 30 min after IPTG removal (left graph) and 30 after IPTG addition (right graph). (G) Representative fluorescent images of PiseA-venus at the indicated times after addition of IPTG (50 µM). PiseA-venus is de-repressed within 15 min after induction of lytE..
-
Figure 4—source data 1
Figure 4B B-galactosidase assay Miller Units.
- https://cdn.elifesciences.org/articles/52088/elife-52088-fig4-data1-v2.xlsx
-
Figure 4—source data 2
Figure 4C B-galactosidase assay Miller Units.
- https://cdn.elifesciences.org/articles/52088/elife-52088-fig4-data2-v2.xlsx
-
Figure 4—source data 3
Figure 4F cwlO depletion, cellular fluorescence intensity.
- https://cdn.elifesciences.org/articles/52088/elife-52088-fig4-data3-v2.xlsx
-
Figure 4—source data 4
Figure 4F lytE over-expression, cellular fluorescence intensity.
- https://cdn.elifesciences.org/articles/52088/elife-52088-fig4-data4-v2.xlsx
Figure 4—figure supplement 1

Validation of PiseA-venus and PyocH-venus reporters.
(A) Representative fluorescence and phase-contrast images of cells harboring the PiseA-venus reporter in wild-type (wt) and strains lacking WalH (∆walH) or WalI (∆walI) that negatively regulate WalK. Cells were grown in LB medium and imaged at an OD600 of ~0.3. PiseA is strongly repressed in the absence of WalH and WalI due to high WalR ~P levels. (B) Representative fluorescence and phase-contrast images of cells harboring the PyocH-venus reporter in the same strains as in (A). PyocH-venus transcription increases in the absence of WalH and WalI due to high WalR ~P levels. (C) Representative images of cells harboring the PiseA-venus reporter and an IPTG-regulated promoter fused to the walRK genes. Cells were grown in LB medium supplemented with 50 µM IPTG to OD600 of ~0.3, washed with LB to remove inducer, back-diluted to OD600 = 0.05, and imaged at the indicated times. PiseA is strongly depressed upon depletion of WalR.
Figure 4—figure supplement 2
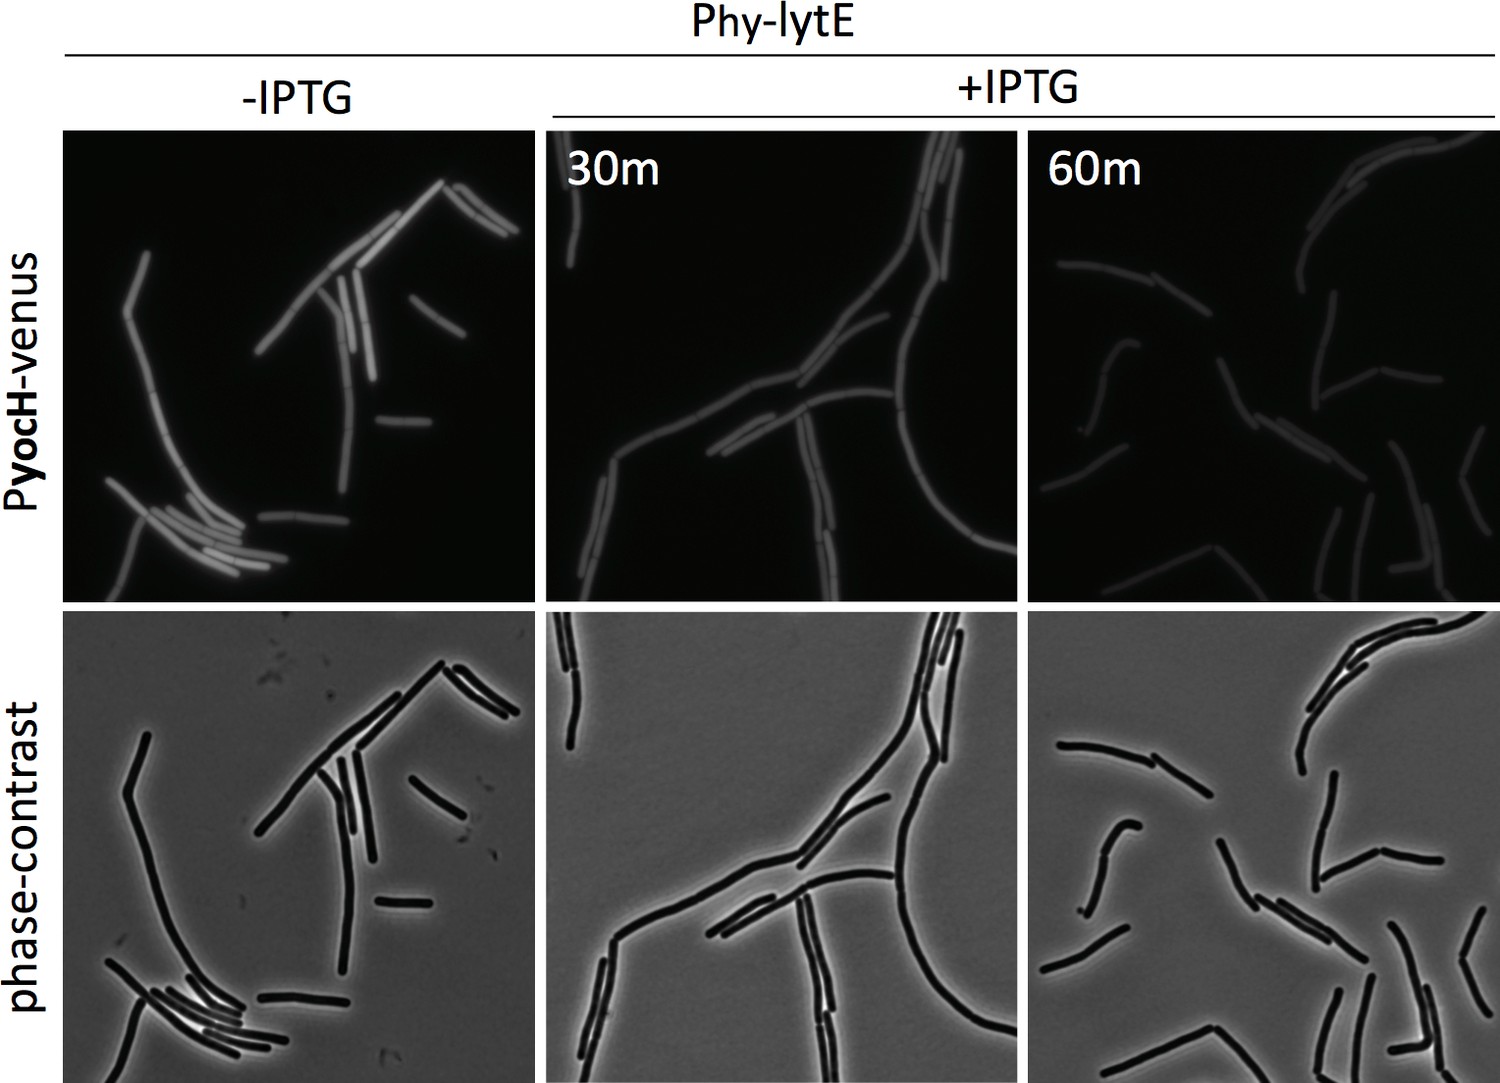
PyocH-venus transcription decreases in response to LytE over-expression.
Representative fluorescence and phase-contrast images of cells harboring the PyocH-venus reporter and the strong IPTG-inducible promoter fusion to lytE (Phy-lytE). Cells were grown in LB medium to an OD600 of ~0.3 and were visualized before and at indicated times after the addition of 50 µM IPTG.
Figure 4—figure supplement 3
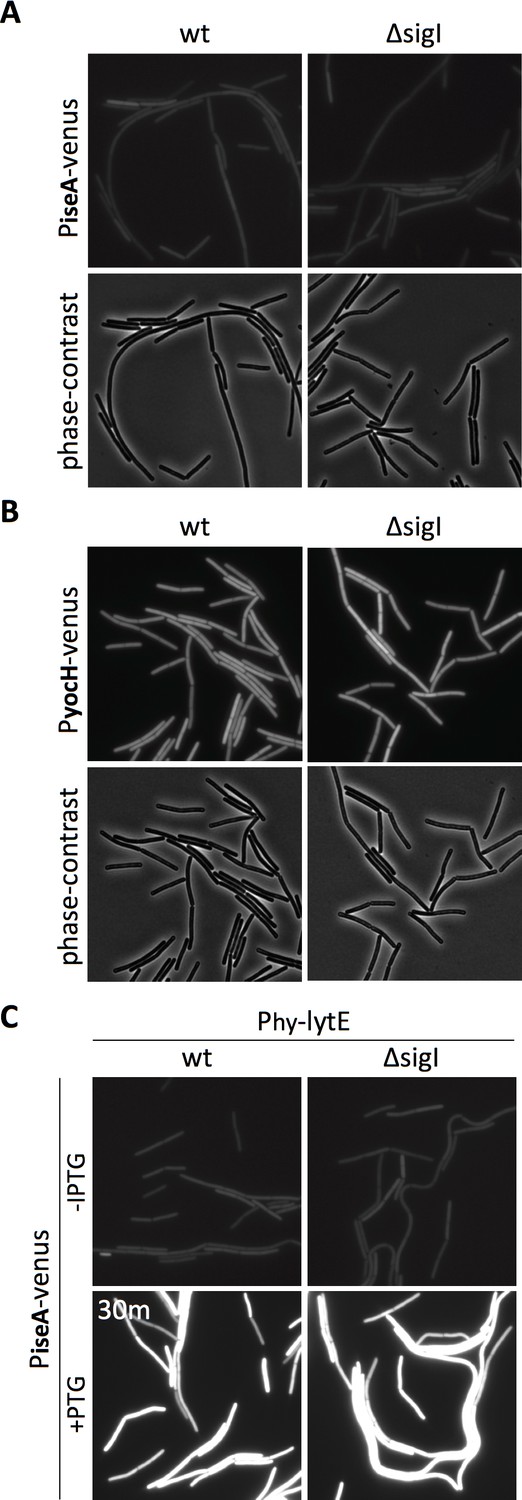
The PiseA-venus and PyocH-venus reporters are not influenced by SigI.
(A) Representative fluorescence and phase-contrast images of cells harboring the PiseA-venus reporter in wild-type (wt) and a strain lacking SigI (∆sigI). (B) Representative images of cells harboring the PyocH-venus reporter in wild-type (wt) and a strain lacking SigI (∆sigI). (C) Representative images of cells harboring the PiseA-venus reporter and Phy-lytE in wild-type (wt) and the ∆sigI mutant. Cells were grown in LB medium to an OD600 of ~0.3 and were visualized before and 30 min after the addition of 50 µM IPTG.
Figure 4—figure supplement 4
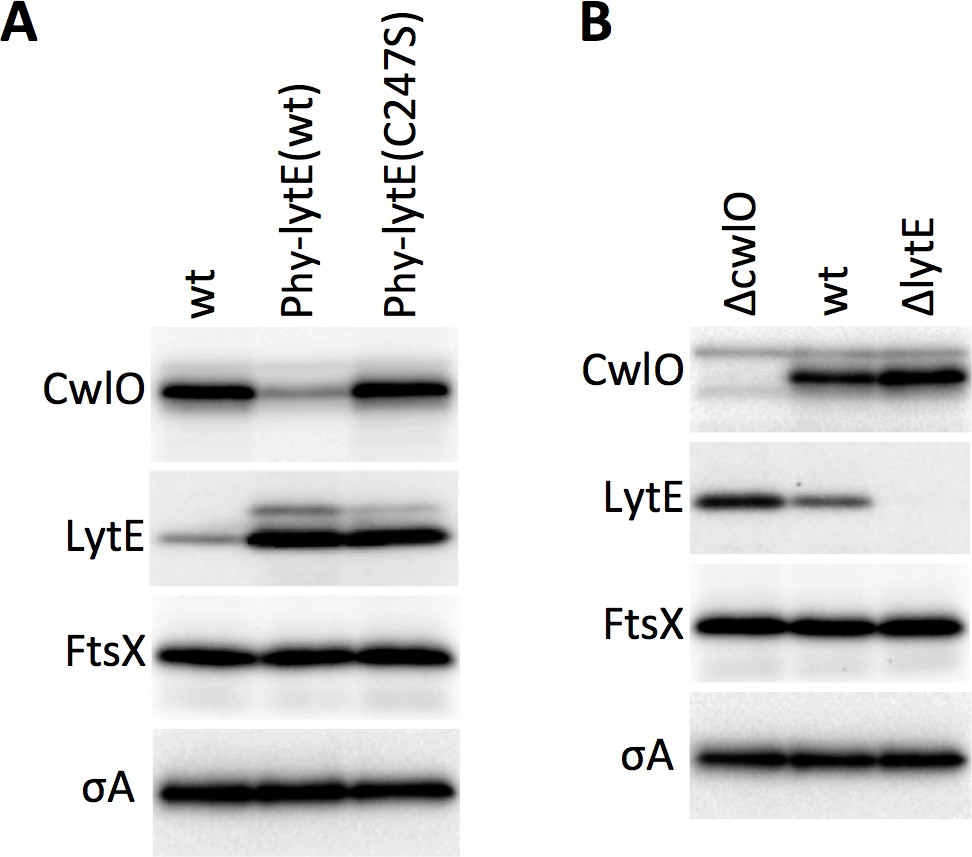
CwlO levels are modulated in response to changes in D,L-endopeptidase activity.
(A) Immunoblot analysis of CwlO, LytE, and FtsX protein levels in wild-type (wt) and strains harboring a strong IPTG-inducible promoter fusion to lytE (Phy-lytE) or the LytE catalytic mutant C247S. Cells with high levels of LytE (but not the catalytic mutant) have low levels of CwlO. FtsX levels remain unchanged under all conditions. (B) Immunoblot analysis of CwlO, LytE, and FtsX protein levels in wild-type (wt) and in strains lacking CwlO (∆cwlO) or LytE (∆lytE). Cells lacking LytE have a modest increase in CwlO levels. Cells lacking CwlO have ~2 fold higher levels of LytE. FtsX levels remain unchanged under all conditions. For both (A) and (B), strains were grown in LB medium and harvested at an OD600 ~0.4. Strains harboring Phy-lytE or Phy-lytE(C247S) were induced with 50 µM IPTG for 60 min. SigA levels were analyzed to control for loading. Immunoblots from one of two biological replicates are shown.
Figure 4—figure supplement 5
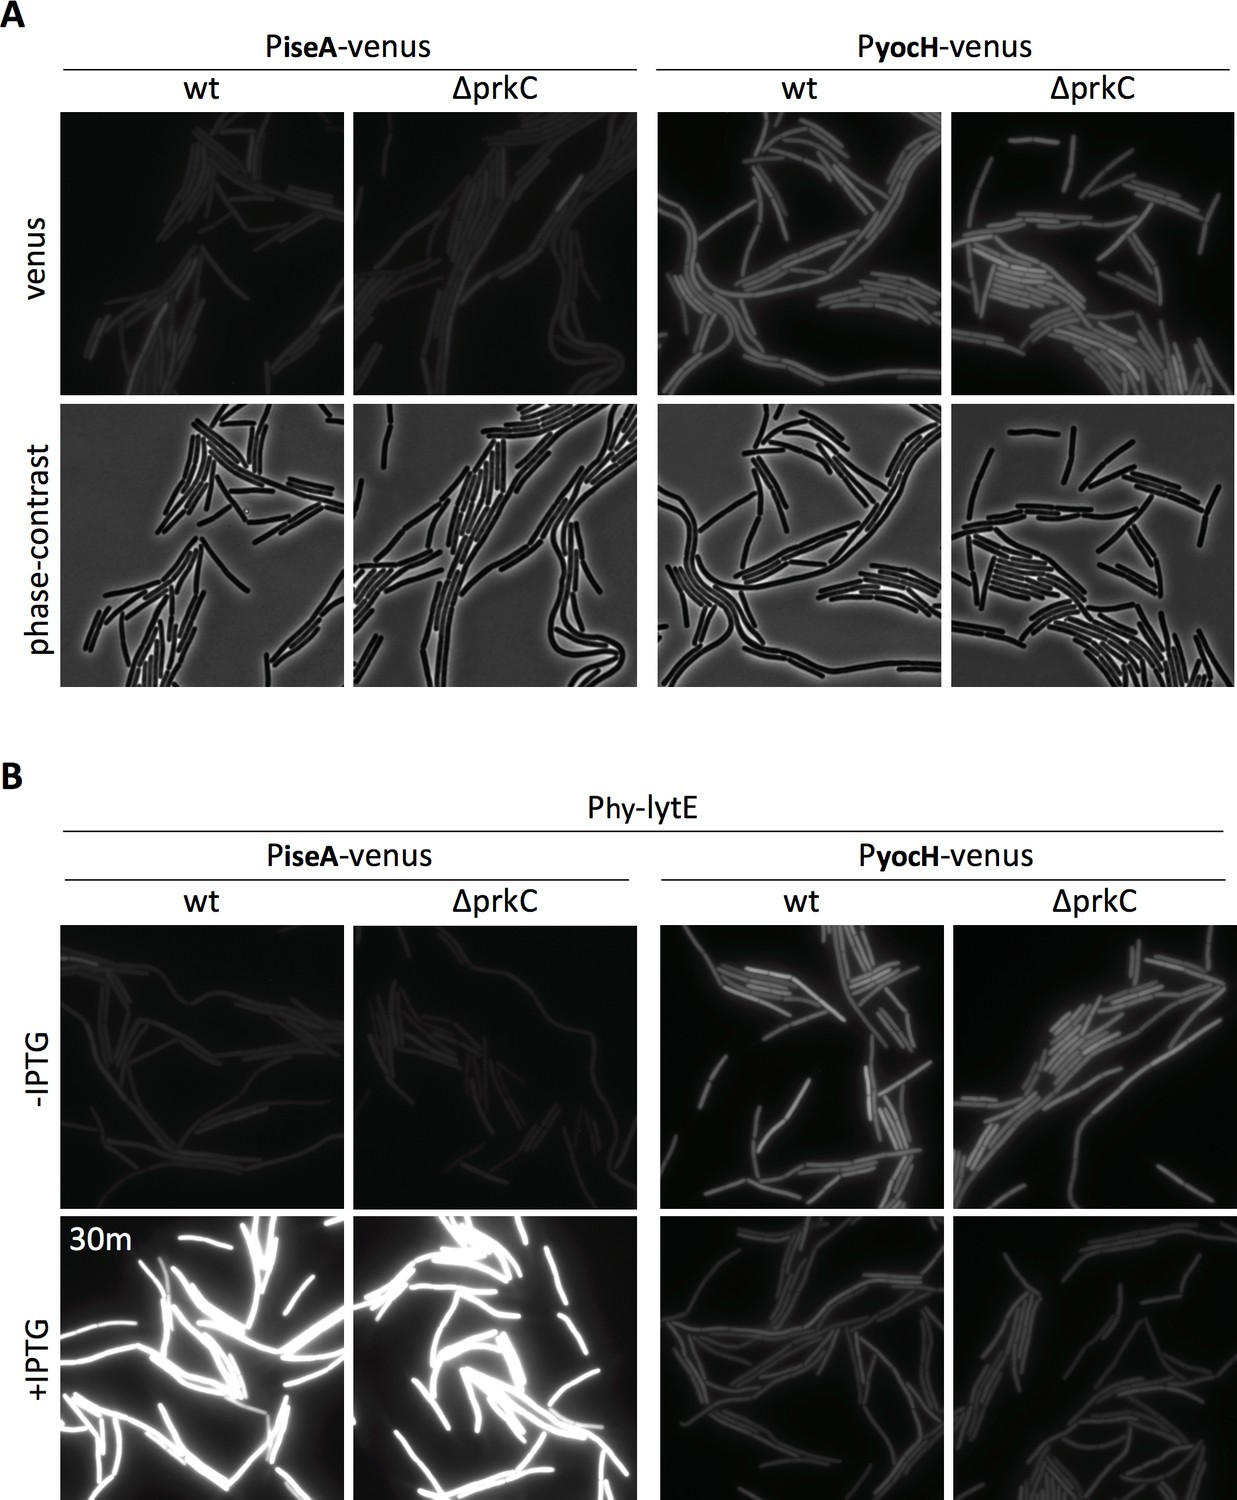
PrkC is not involved in the response to changes in D,L-endopeptidase activity.
(A) Representative fluorescence and phase-contrast images of cells harboring the PiseA-venus or PyocH-venus report in wild-type (wt) and the ∆prkC mutant. Cells were grown in LB medium and visualized at an OD600 of ~0.3. (B) Representative images of cells harboring the PiseA-venus or PyocH-venus reporters and Phy-lytE in wild-type (wt) and the ∆prkC mutant. Cells were grown in LB medium to an OD600 of ~0.3 and visualized before and 30 min after addition of 50 µM IPTG.
Figure 5 with 3 supplements
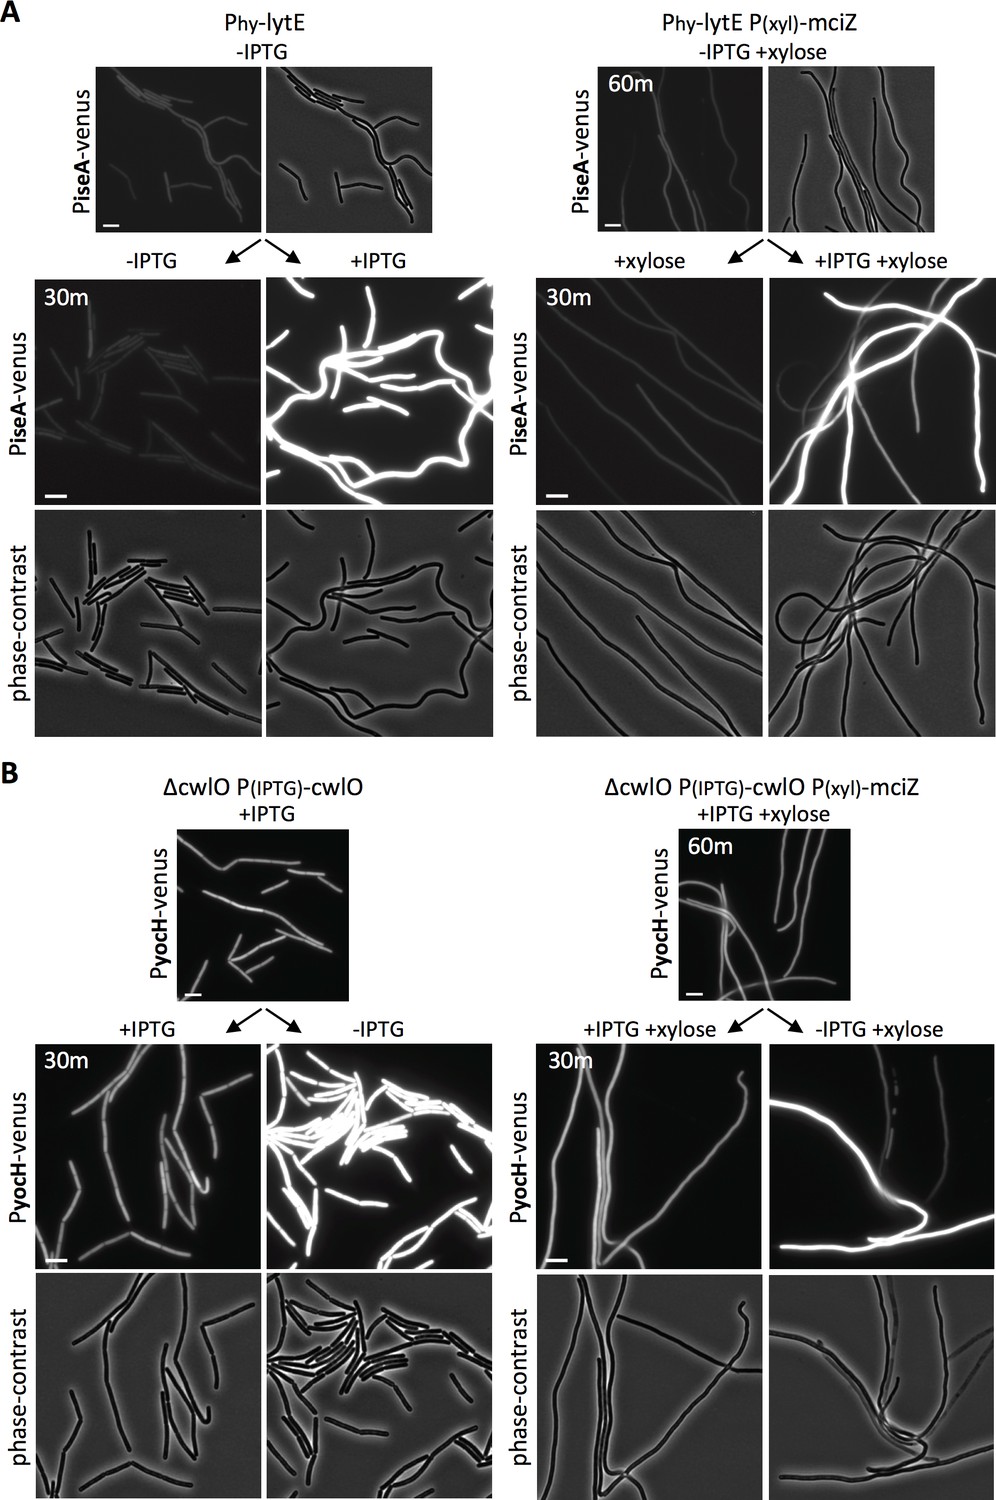
WalRK responds to changes in D,L endopeptidase activity in cells inhibited for divisome assembly.
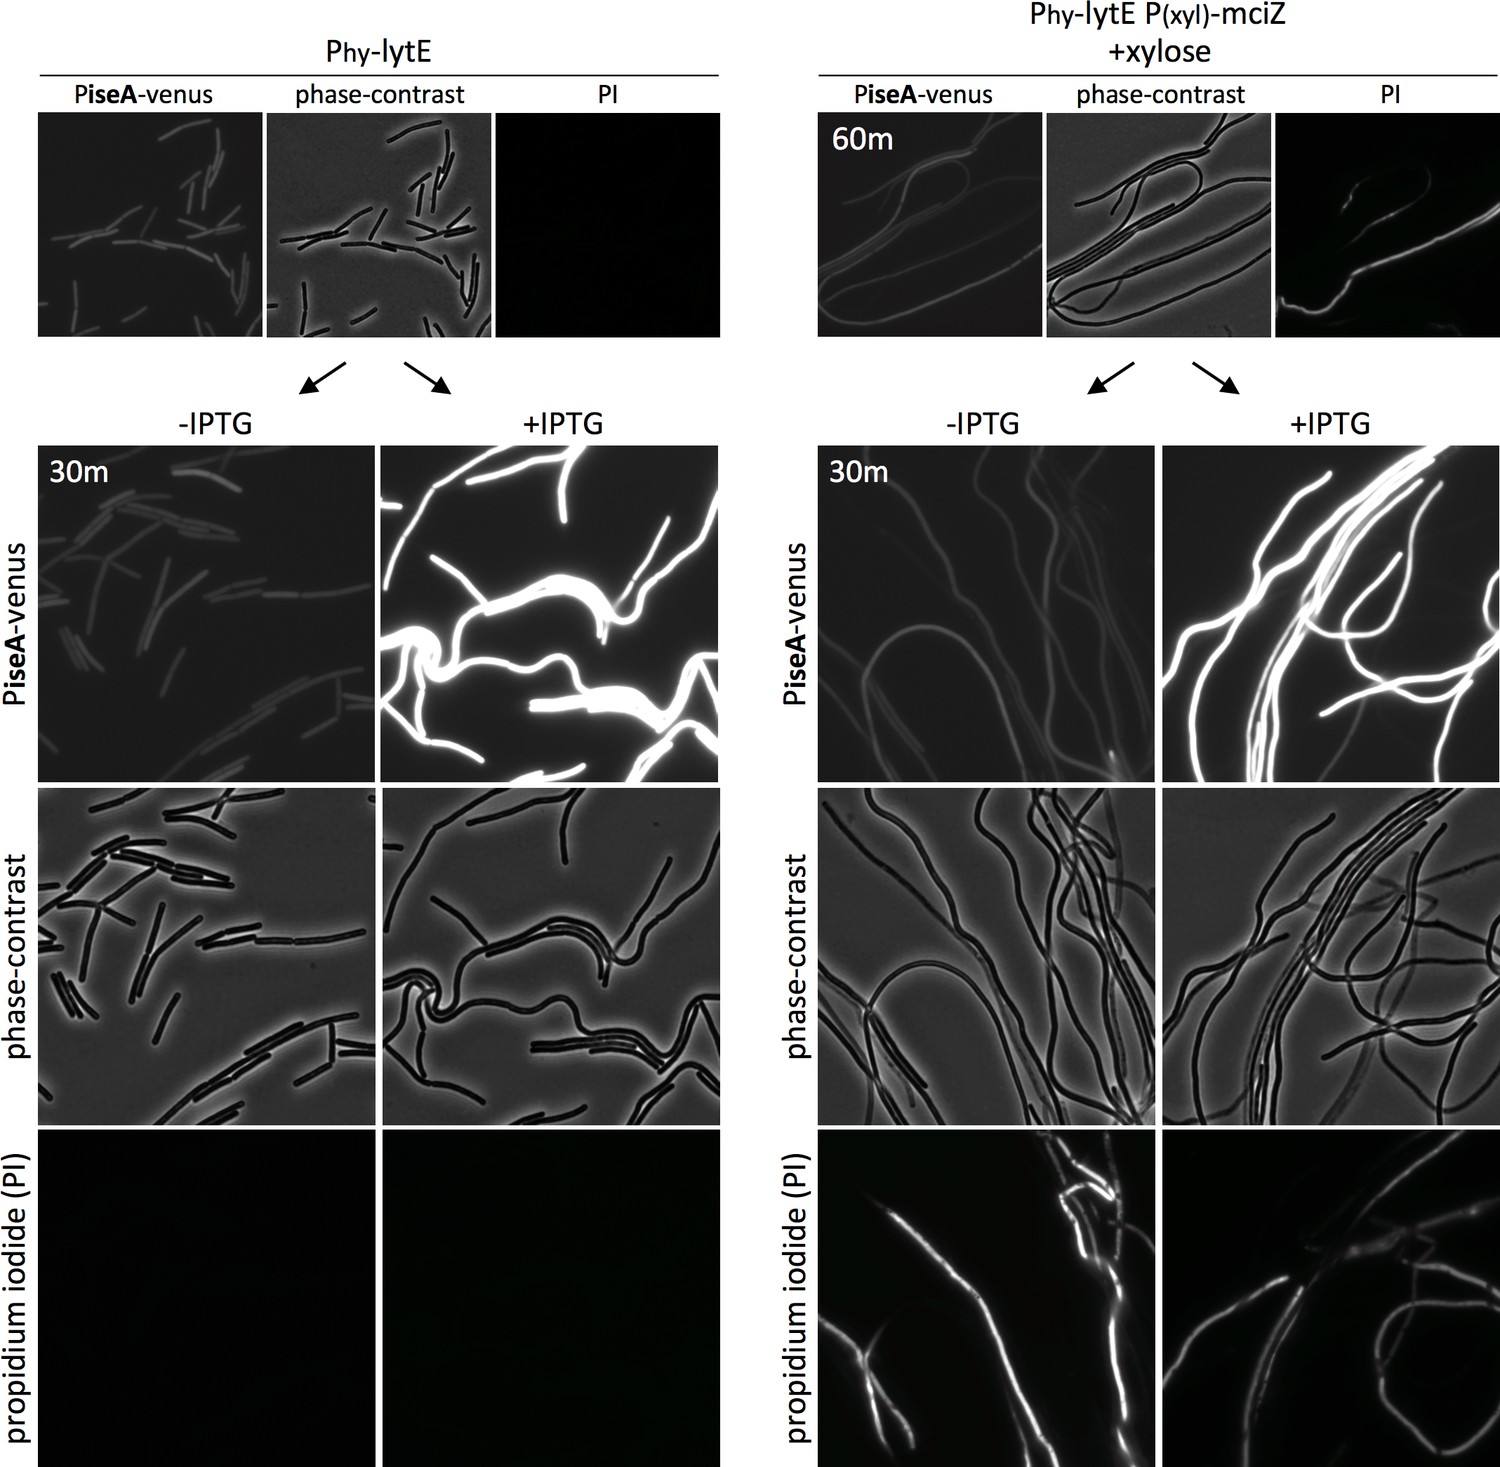
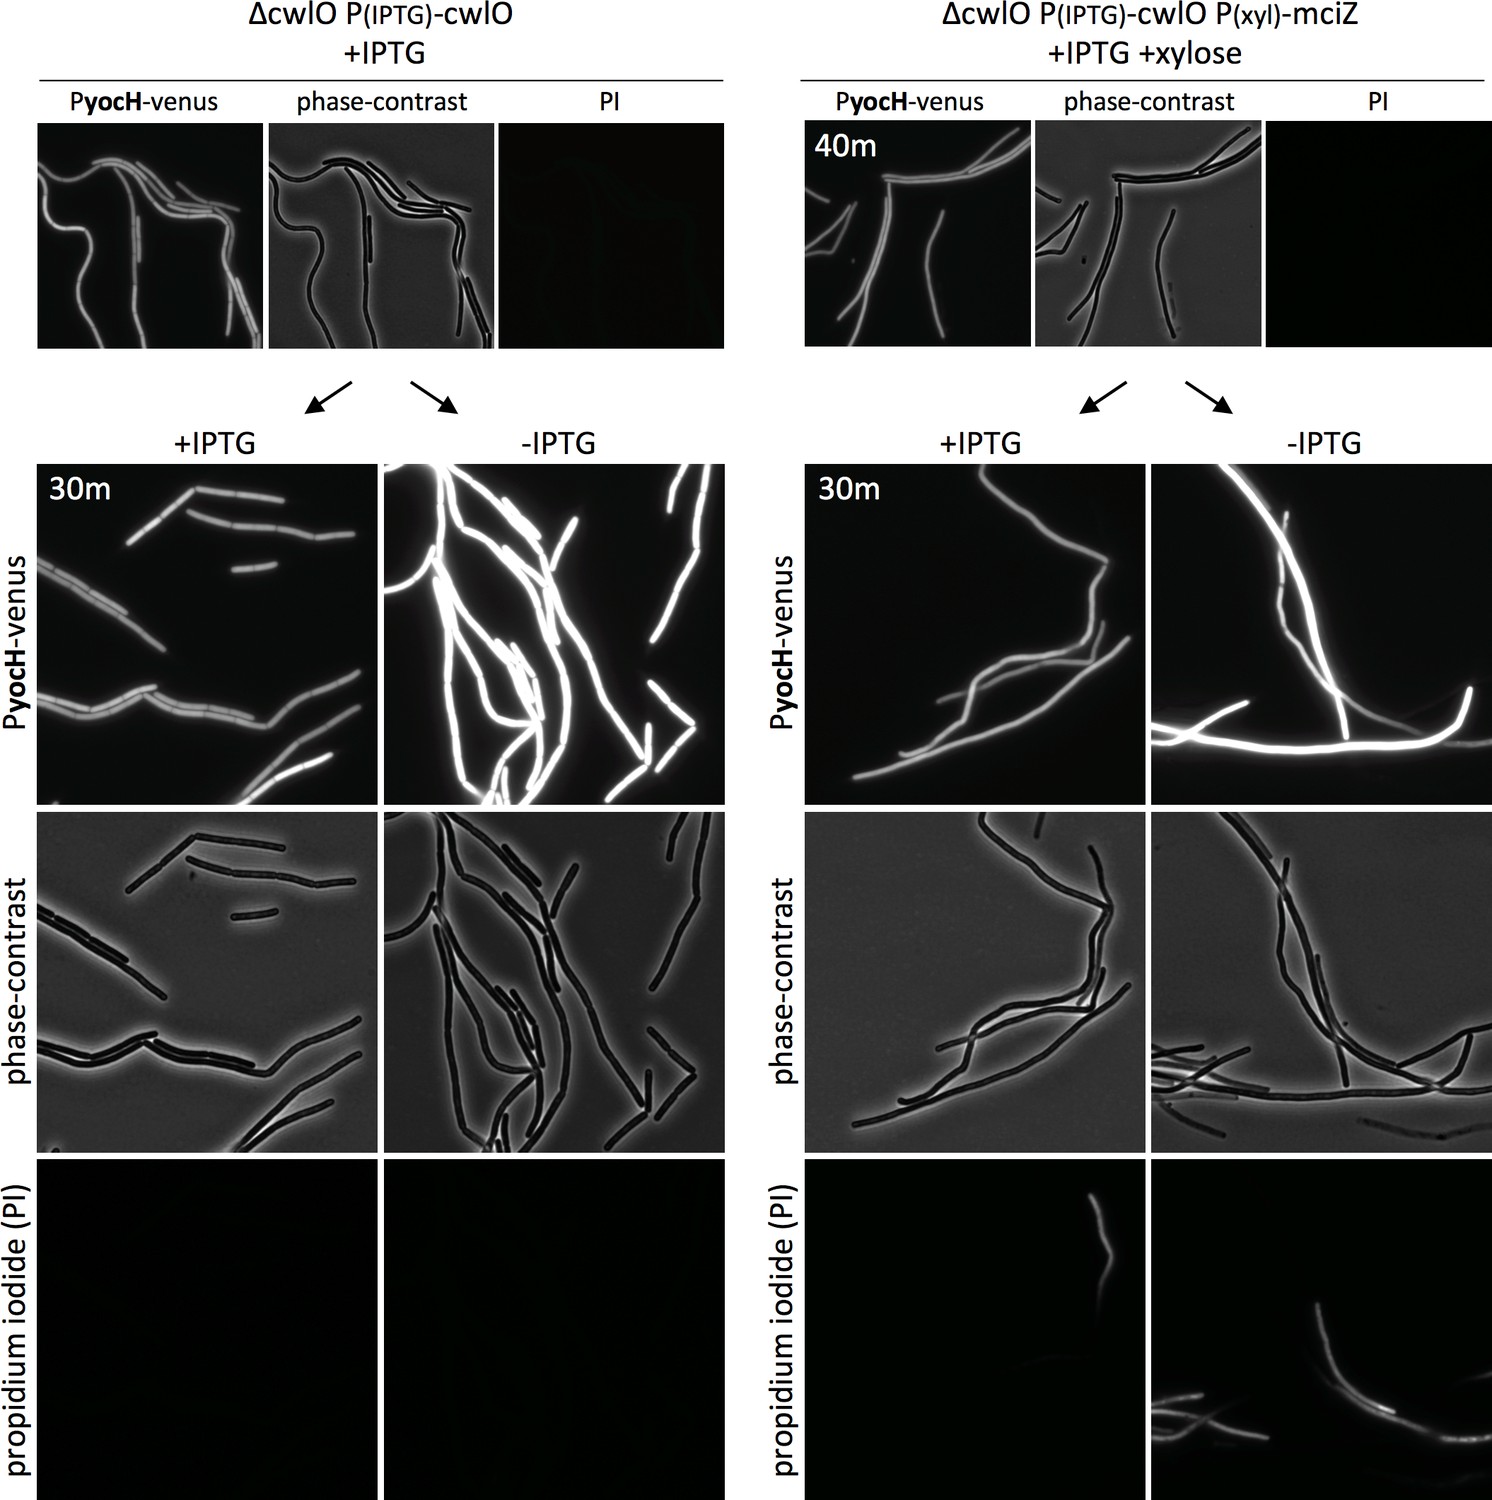
(A) Representative fluorescence and phase-contrast images of cells harboring PiseA-venus before and 30 min after induction of lytE with 50 µM IPTG. Images on the right are from a strain that also contained the FtsZ inhibitor MciZ under xylose control (P(xyl)-mciZ) and were grown in the presence of 10 mM xylose for 60 min prior to IPTG addition. (B) Representative fluorescence and phase-contrast images of cells harboring PyocH-venus before and 30 min after removal of IPTG to shut off cwlO transcription. Images on the right are from a strain that also contained P(xyl)-mciZ and was grown in the presence of 10 mM xylose for 40 min, prior to IPTG removal. A subset of the division-inhibited cells did not de-repress PiseA-venus (A) or induce PyocH-venus (B); this could be due to loss of viability (see Figure 5—figure supplements 2 and 3). Representative images are from one of three independent experiments. Scale bar indicates 5 µm.
Figure 5—figure supplement 1

MciZ expression disrupts divisome assembly.
Representative fluorescence and phase-contrast images of cells harboring a functional fluorescent fusion to EzrA (EzrA-GFP) in wild-type (wt) and a strain containing a xylose-regulated allele of mciZ (P(xyl)-mciZ) EzrA requires FtsZ for divisome localization and is used as a surrogate marker for divisome assembly. After 40 min of mciZ expression using 10 mM xylose, EzrA-GFP localization is lost.
Figure 5—figure supplement 2
Loss of membrane integrity in cells inhibited for divisome assembly.
Representative fluorescence and phase-contrast images of cells harboring PiseA-venus before and 30 min after induction of lytE with 50 µM IPTG. The images on right are from a strain that also contained the FtsZ inhibitor MciZ under xylose control (P(xyl)-mciZ) and were grown in the presence of 10 mM xylose for 60 min to inhibit FtsZ assembly, prior to IPTG addition. Prior to imaging, cells were incubated with 5 mM propidium iodide (PI) to assess membrane integrity as an indicator of viability. Some of the filaments expressing mciZ were PI positive and these did not de-repress the reporter.
Figure 5—figure supplement 3
Loss of membrane integrity in cells inhibited for divisome assembly.
Representative fluorescence and phase-contrast images of strains harboring PyocH-venus before and 30 min after removal of IPTG to shut off cwlO transcription. The images on right are from a strain that also contained the FtsZ inhibitor MciZ under xylose control (P(xyl)-mciZ) and was grown in the presence of 10 mM xylose for 40 min, prior to IPTG removal. Prior to imaging, cells were incubated with 5 mM propidium iodide (PI) to assess membrane integrity as an indicator of viability. Some of the filaments expressing mciZ were PI positive and these did not increase transcription of PyocH-venus when CwlO was depleted.
Figure 6 with 1 supplement
The extracellular domains of WalH and WalI are not required for WalK to respond to changes in D,L-endopeptidase activity.
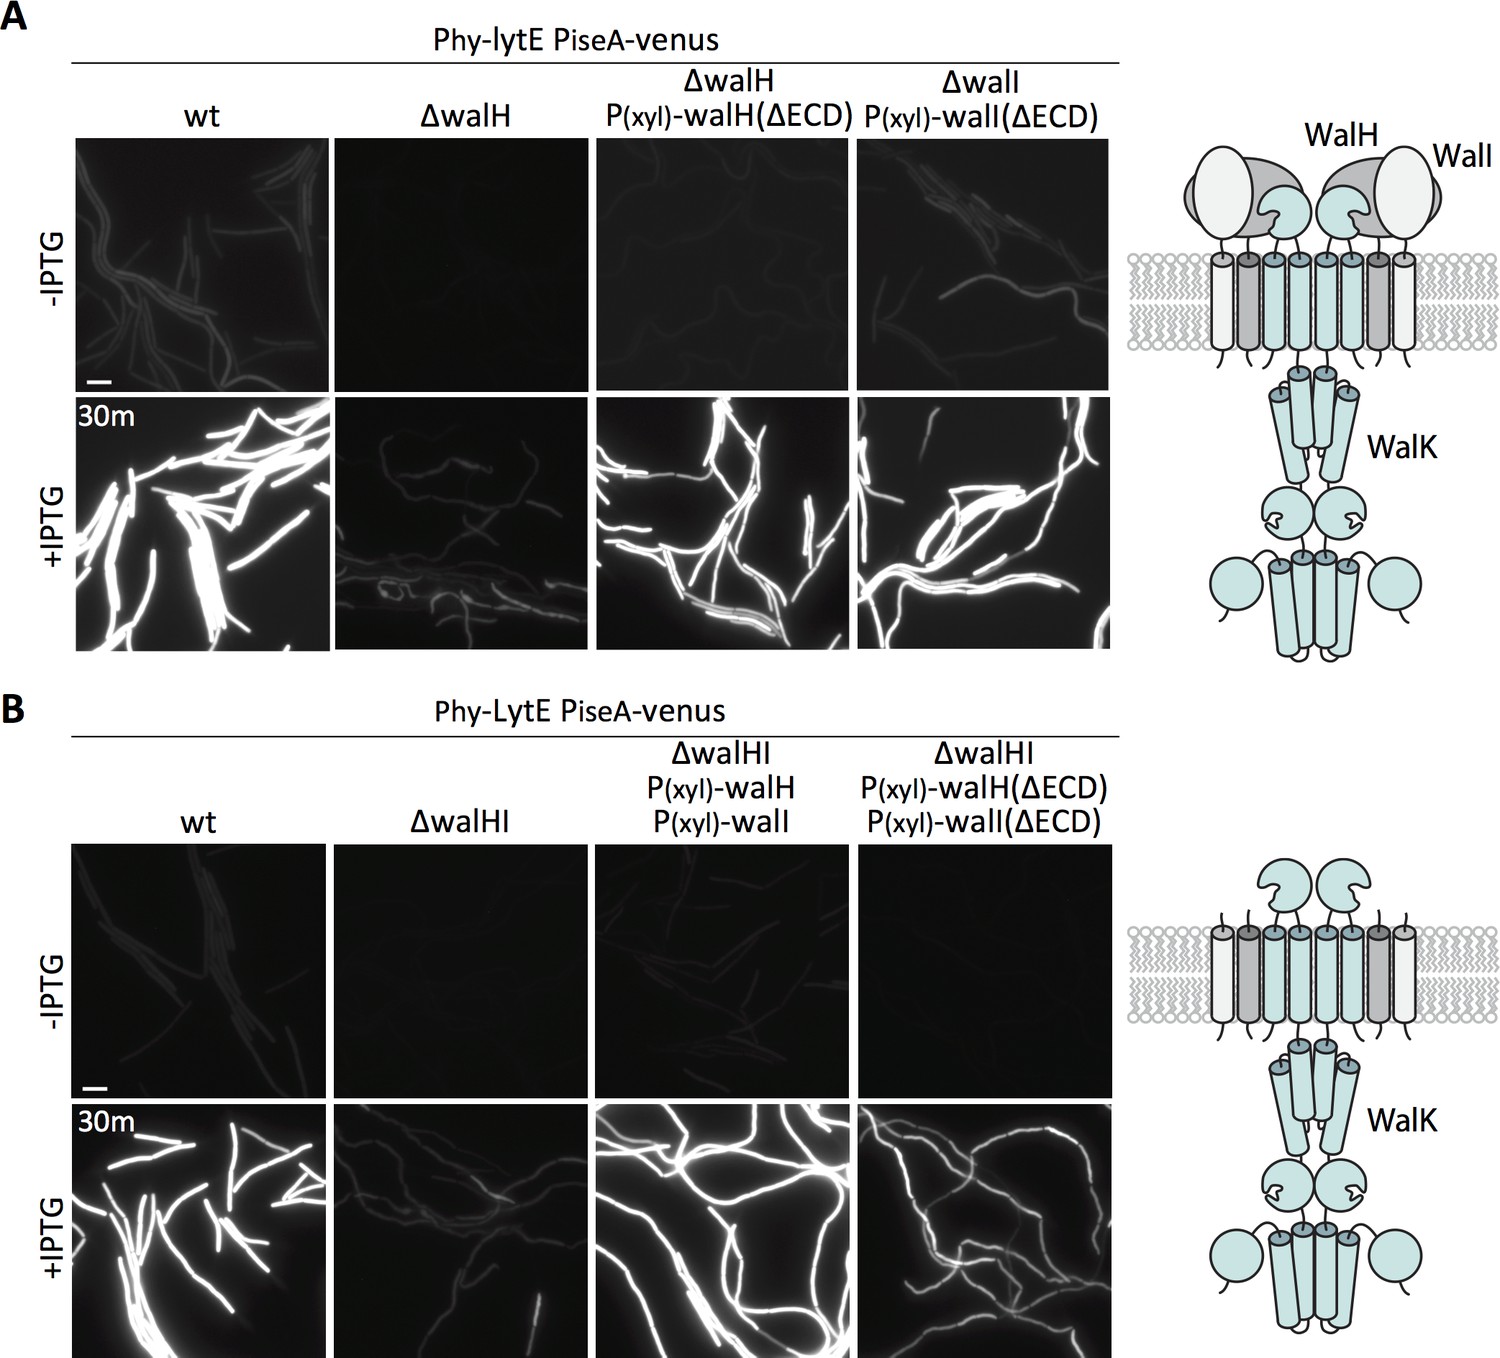
(A) Representative fluorescence images of the indicated strains harboring PiseA-venus and a strong IPTG-inducible promoter fused to lytE (Phy-lytE). Strains were grown to OD600 ~0.3 in LB medium and imaged before and 30 min after addition of 50 µM IPTG. The medium was supplemented with 10 mM xylose for the strains harboring xylose-regulated alleles of walH or walI with deletions of their extracellular domains (ΔECD). Schematic diagram of the putative WalK/WalH/WalI membrane complex is shown to the right. (B) Representative images of PiseA-venus expression before and 30 min after lytE over-expression in strain lacking both walH and walI and complemented by xylose-induced full-length genes or ΔECD deletion variants. Schematic diagram of the putative membrane complex with WalH and WalI lacking their ECDs is shown on the right. Representative images are from one of three independent experiments. Scale bar indicates 5 µm.
Figure 6—figure supplement 1
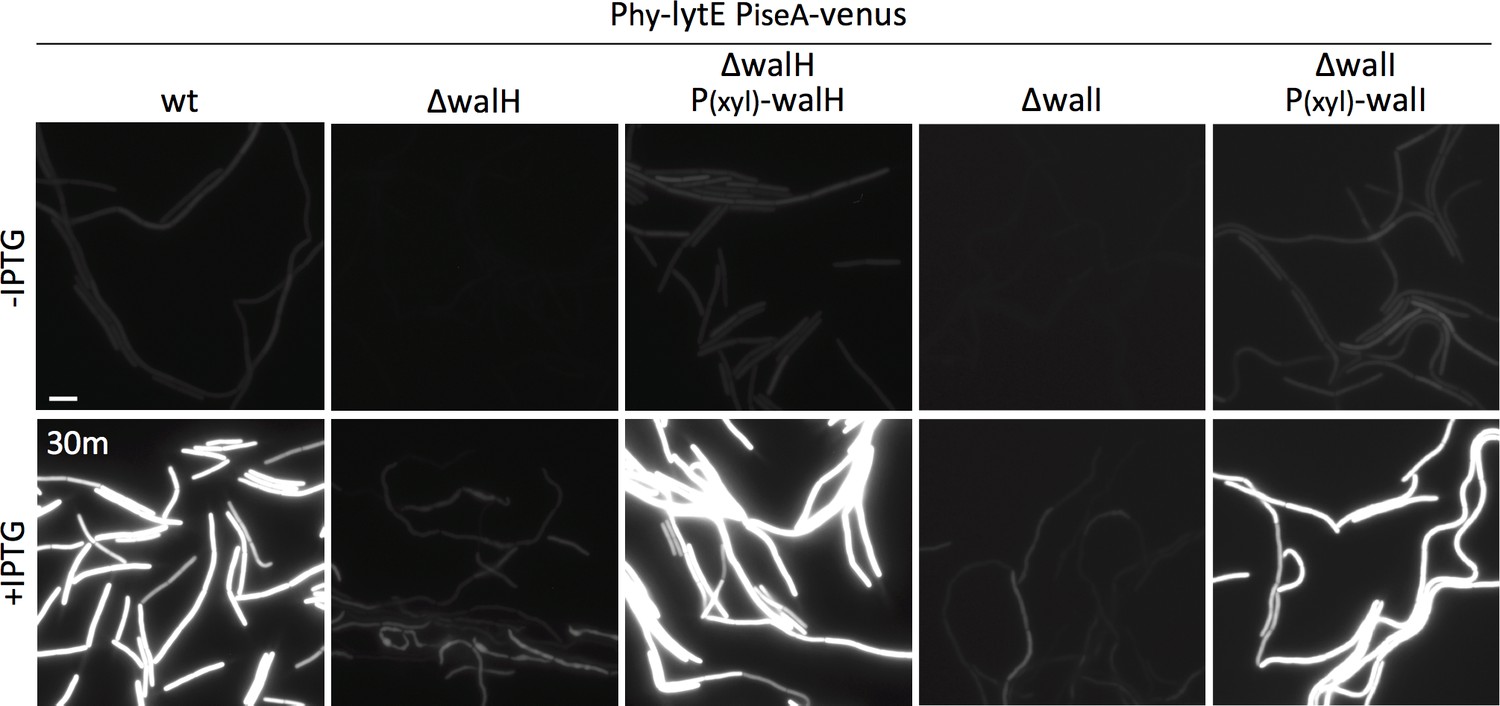
Complementation of ∆walH and ∆walI with xylose-regulated alleles.
Representative fluorescent images of cells harboring the PiseA-venus reporter in wild-type (wt) or strains lacking either walH or walI, and complemented by either walH or walI under xylose-inducible control. Strains were grown in LB supplemented with 10 mM xylose to induce expression of walH and walI constructs and imaged before and 30 min after addition of 50 µM IPTG. Representative images are from one of three independent experiments. Scale bar indicates 5 µm.
Figure 7 with 1 supplement
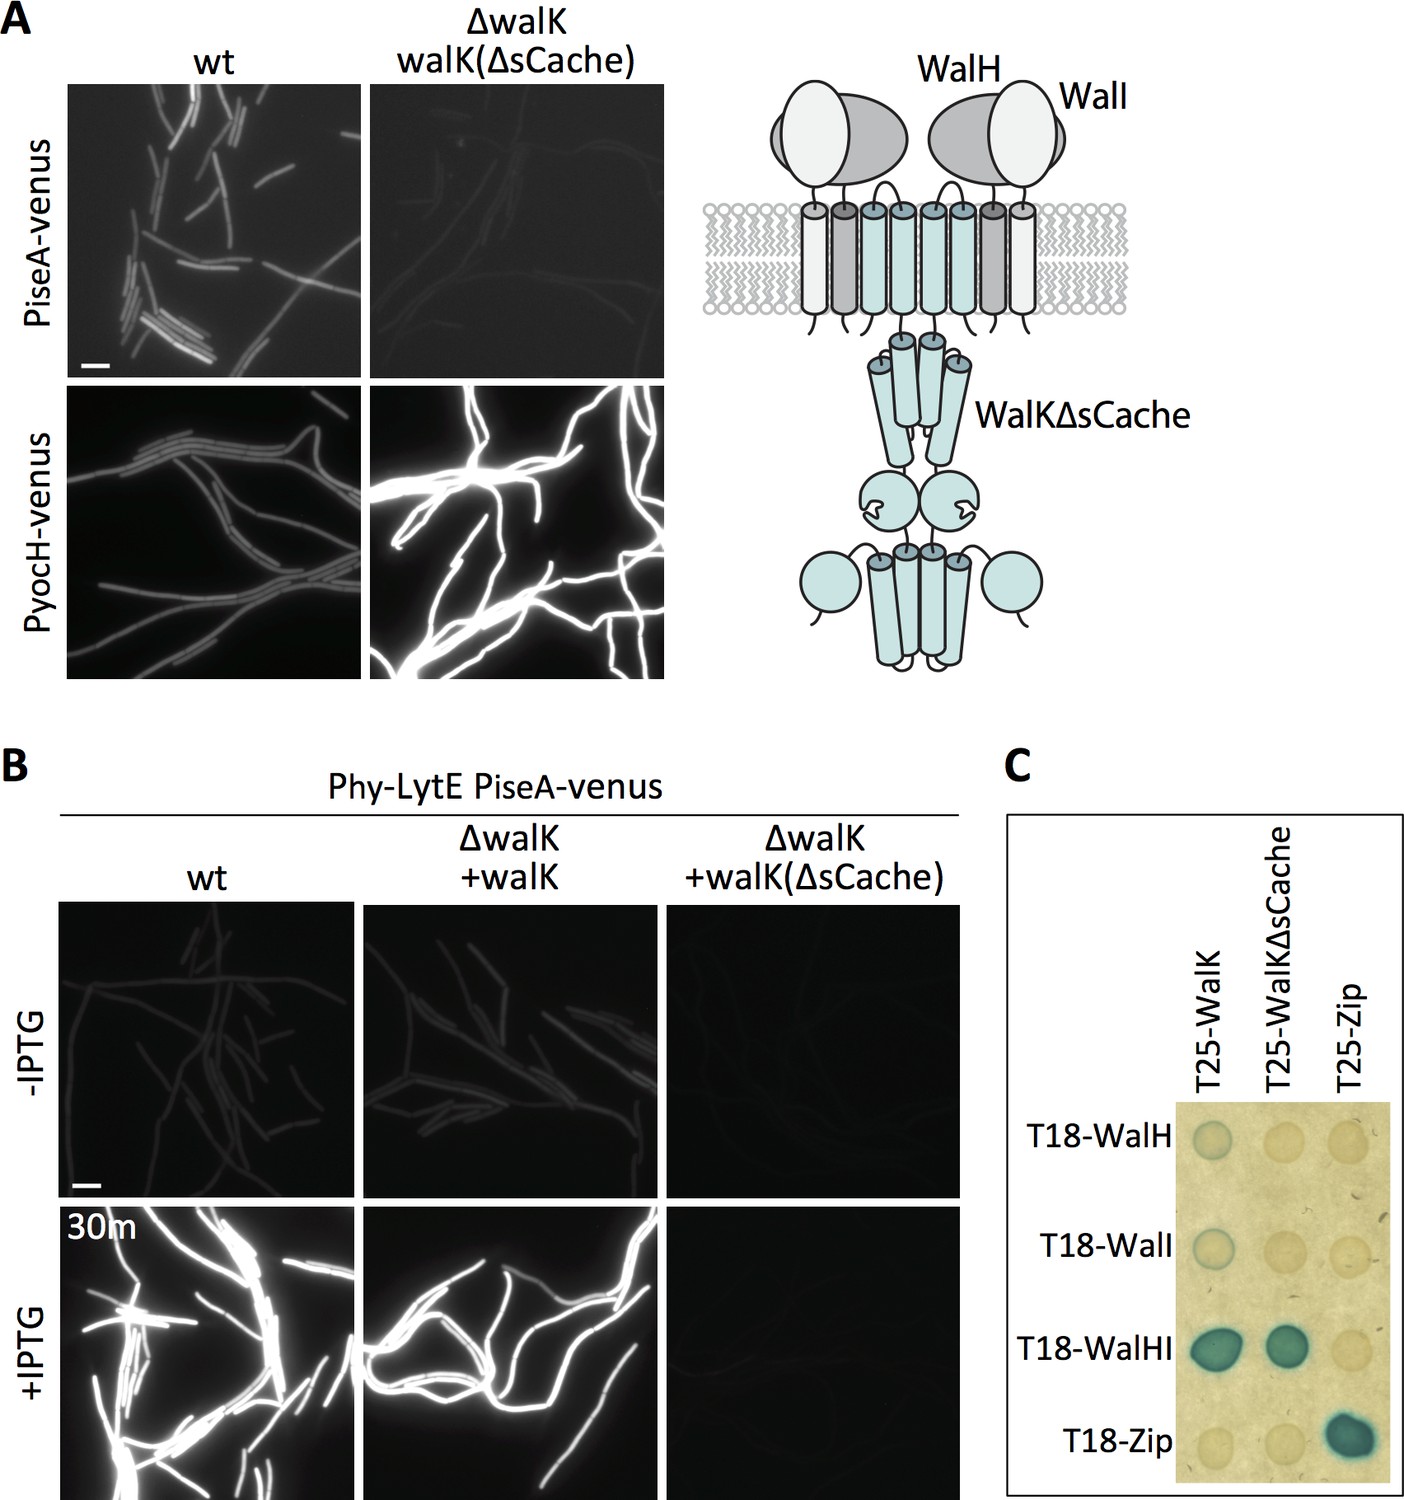
Deletion of the extracellular sCache domain of WalK renders the sensor kinase unresponsive to changes in D,L-endopeptidase activity.
(A) Representative fluorescence images of the indicated strains harboring PiseA-venus or PyocH-venus reporters. Cells were grown to OD600 ~0.4 in LB medium. Strains in which WalK lacks its extracellular sensory domain (∆sCache) have high WalRK activity, leading to strong repression of PiseA-venus and elevated transcription of PyocH-venus. Schematic model of the signaling complex with WalK lacking its extracellular domain is shown on the right. (B) Representative fluorescence images of the indicated strains harboring PiseA-venus and Phy-lytE. Strains were grown to OD600 ~0.3 in LB medium and imaged before and 30 min after addition of 50 µM IPTG. Representative images are from one of three independent experiments. Scale bar indicates 5 µm. (C) WalK and WalK∆sCache interact with WalH and WalI in the bacterial adenylate cyclase two-hybrid (BACTH) assay. The BTH101 E. coli reporter strain containing plasmids expressing the indicated protein fusions to the complementing (T18 and T25) domains of the Bordetella adenylate cyclase. The T18-WalHI plasmid contains a T18-WalH fusion and untagged WalI. Cells were grown to early stationary phase in LB at 37°C, normalized to OD600 = 0.2, and 3 µL of each was spotted on LB agar plates supplemented with X-Gal and IPTG. Plates were incubated overnight at 30°C. The ‘Zip’ fusions, composed of the leucine zipper domain of GCN4, served as positive and negative controls.
Figure 7—figure supplement 1
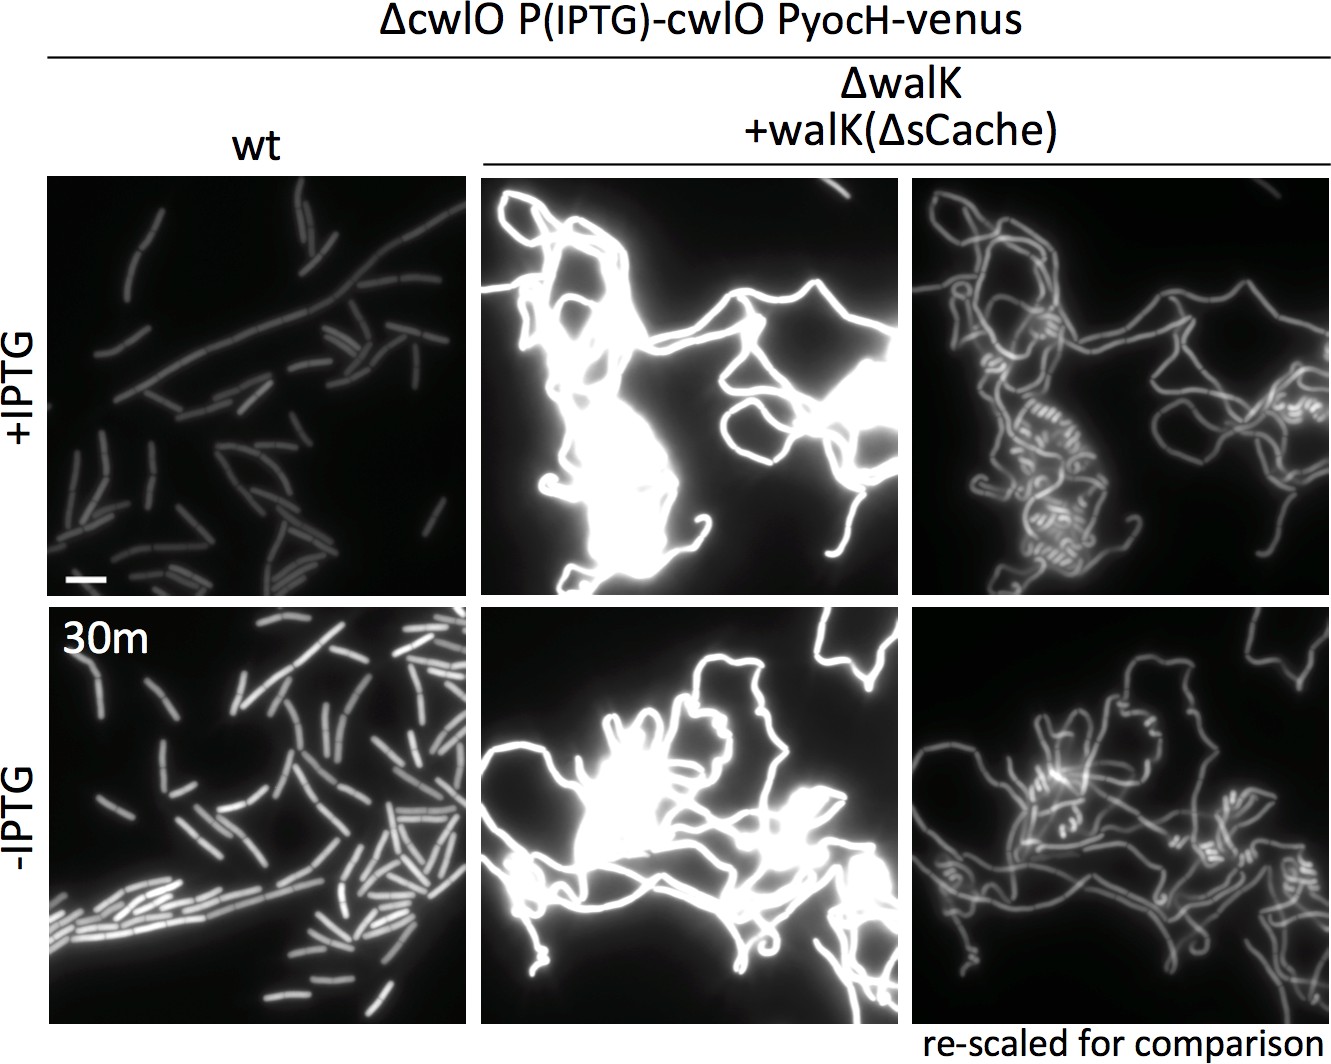
Deletion of the extracellular sCache domain of WalK renders the sensor kinase unresponsive to depletion of CwlO.
Representative fluorescence images of strains harboring the PyocH-venus reporter and a ∆cwlO mutation complemented by an IPTG-regulated allele of cwlO. A strain with an intact walRK locus (wt) was compared to one lacking native walK and expressing a WalK variant deleted for its extracellular sensory domain (WalKΔsCache). Cells were grown to OD600 ~0.3 in LB medium supplemented with 1 mM IPTG, washed in medium lacking inducer, and imaged before (+IPTG) and 30 min after inoculation in LB medium lacking inducer (-IPTG). The fluorescent signals in the WalK∆sCache strain before and after CwlO depletion were re-scaled to allow direct comparison on the right. Scale bar indicates 5 µm.
Figure 8 with 2 supplements
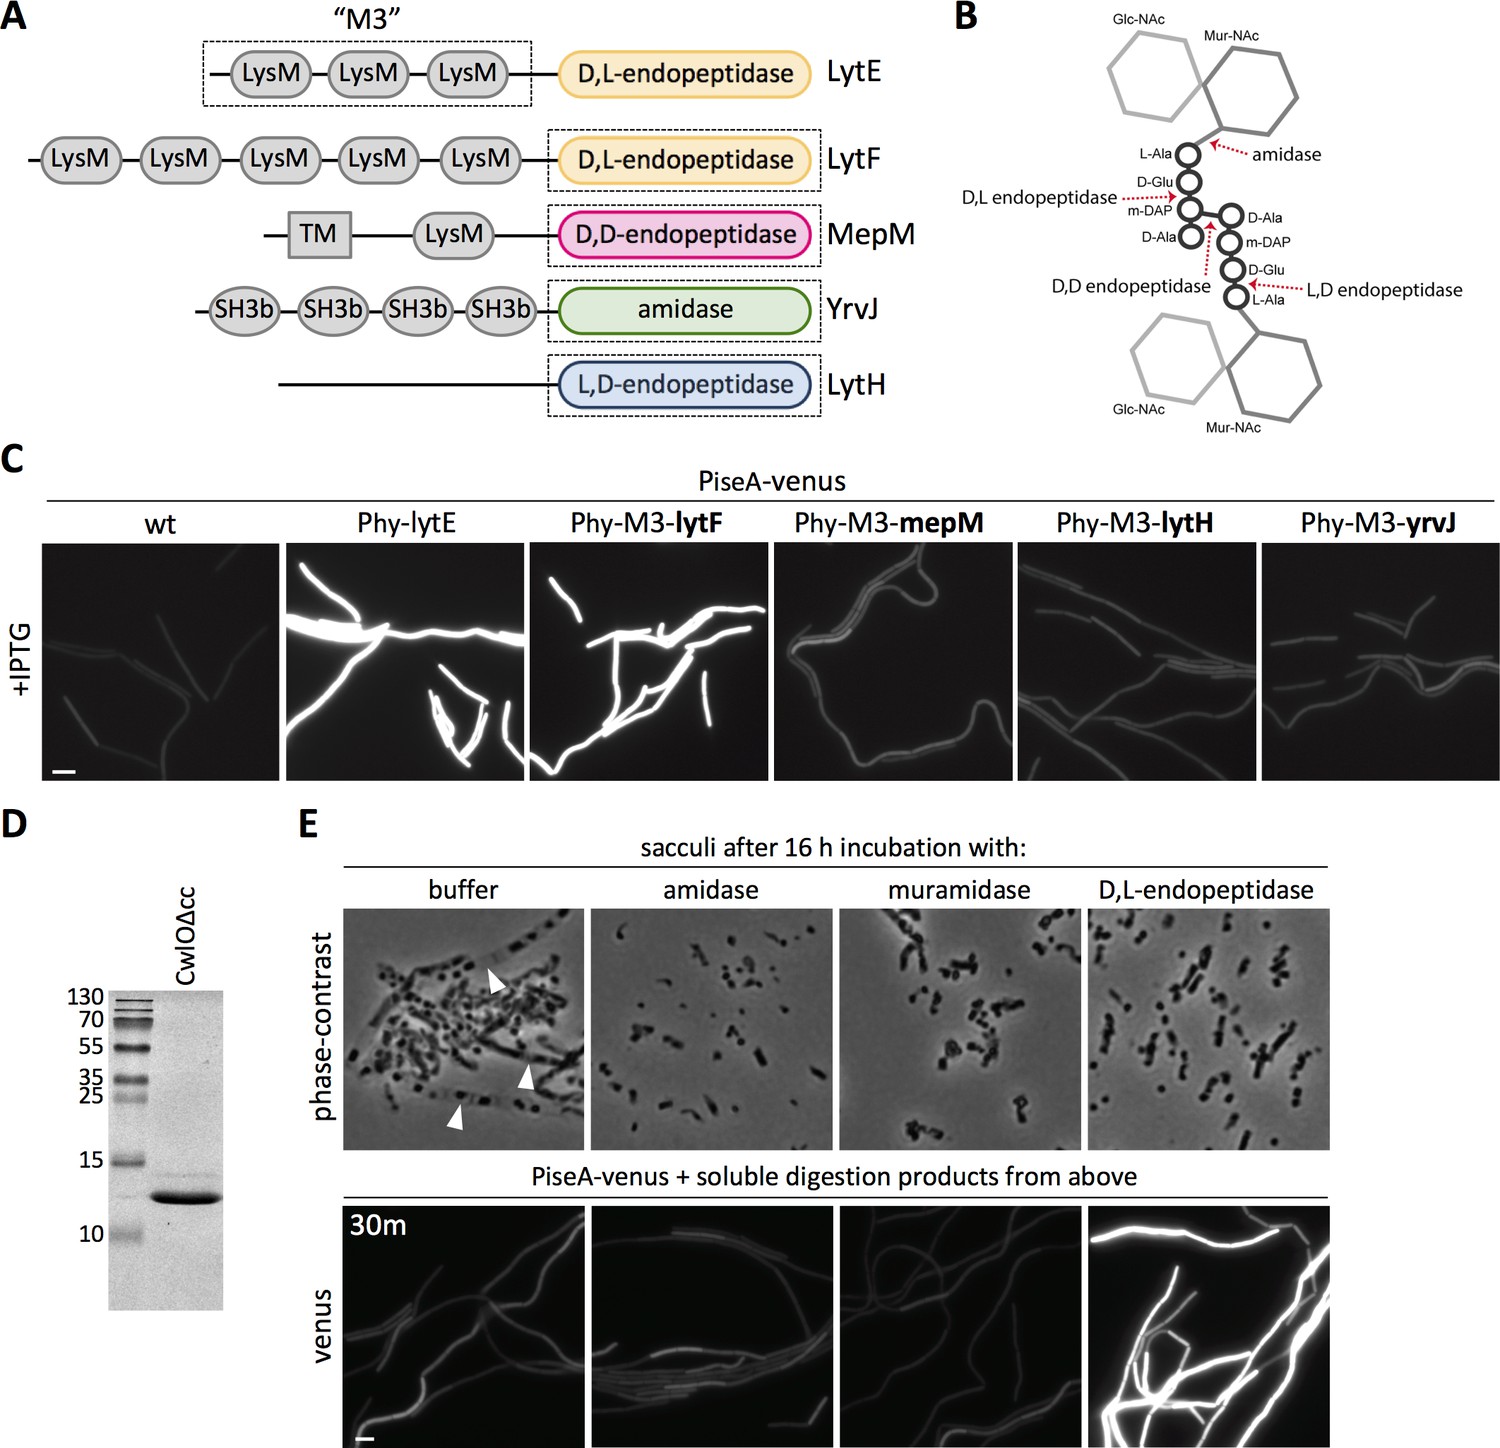
The WalRK pathway specifically responds to D,L-endopeptidase-cleaved peptidoglycan.
(A) Schematic diagram of the cell wall hydrolases used to make LytE chimeras. The three amino-terminal LysM domains of LytE (M3) were fused to the carboxyl-terminal catalytic domains of LytF, MepM, LytH, and YrvJ. (B) Schematic of a single PG crosslink and the cleavage sites of the cell wall hydrolase domains used in (A); the amino acids in the crossbridge are represented by black circles and the di-saccharide with gray hexagons. (C) Representative fluorescence images of the indicated strains harboring PiseA-venus reporter and a strong IPTG-inducible promoter (Phy) fused to lytE or the chimeras. Cells were grown to OD600 ~0.3 in LB medium and imaged 30 min after addition of IPTG. 50 µM IPTG was used to induce LytE and the D,L-endopeptidase chimera and 500 µM IPTG was used for all the other chimeras. (D) Coomassie-stained gel of purified CwlO lacking its coiled-coil domain (CwlOΔcc). (E) Phase-contrast images of purified B. subtilis sacculi incubated overnight at 37°C with buffer or purified CwlO∆cc, the amidase LytA, or the muramidase mutanolysin (top panels). Translucent sacculi (carets) surrounding phase-dark insoluble aggregates are only visible after incubation with buffer. Representative fluorescence images of B. subtilis cells harboring PiseA-venus after 30 min incubation with the soluble material generated from overnight incubation of sacculi under the indicated conditions (bottom panels). Representative images are from one of three independent experiments. Scale bar indicates 5 µm.
Figure 8—figure supplement 1
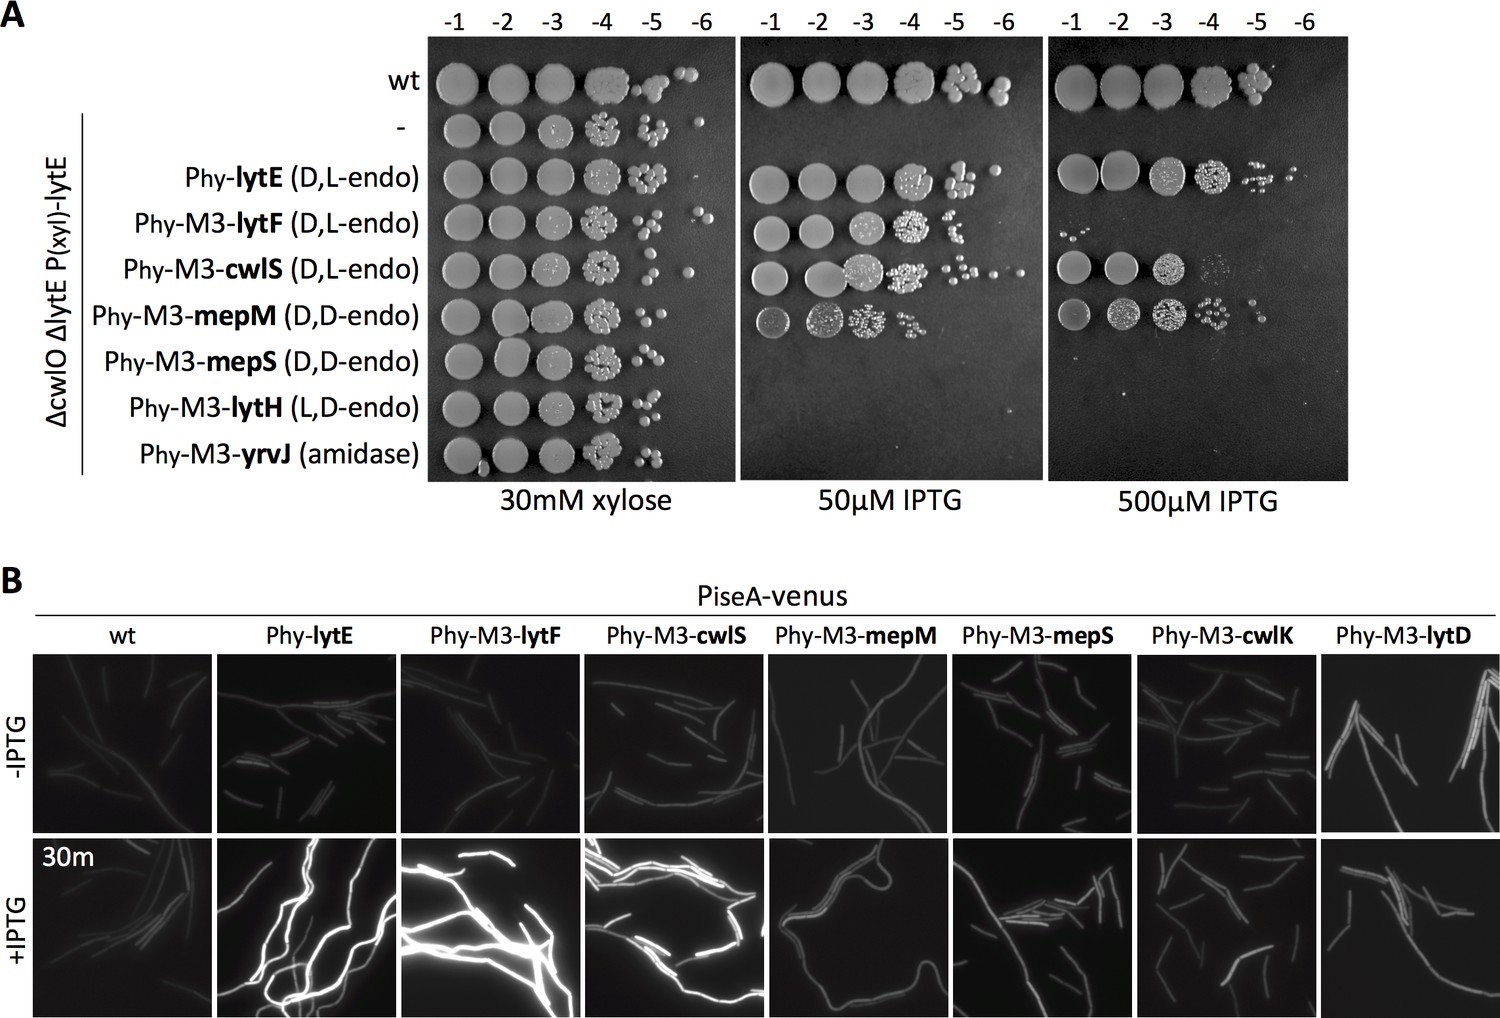
D,L-endopeptidase chimeras and the MepM D,D-endopeptidase chimera complement a ΔlytE ∆cwlO double mutant but only D,L-endopeptidase activity lowers WalRK activity.
(A) Spot dilutions of strains lacking cwlO and lytE (∆cwlO ∆lytE), a xylose-regulated allele of lytE (P(xyl)-lytE) and the indicated chimera under IPTG control (Phy). Cells were grown in the presence of 30 mM xylose to OD600 ~2.0. The cultures were washed twice without inducer, normalized to an OD600 = 1.5, 10-fold serially diluted, and spotted (5 µL) onto LB agar plates with 30 mM xylose, 50 µM IPTG, or 500 µM IPTG. Representative plates from one of two biological replicates are shown. (B) Representative fluorescence images of strains harboring PiseA-venus and the indicated chimera under IPTG control (Phy). Cells were imaged before or 30 min after addition of IPTG. 50 µM IPTG was used to induce LytE and the D,L-endopeptidase chimera and 500 µM IPTG was used for all the other chimeras.
Figure 8—figure supplement 2
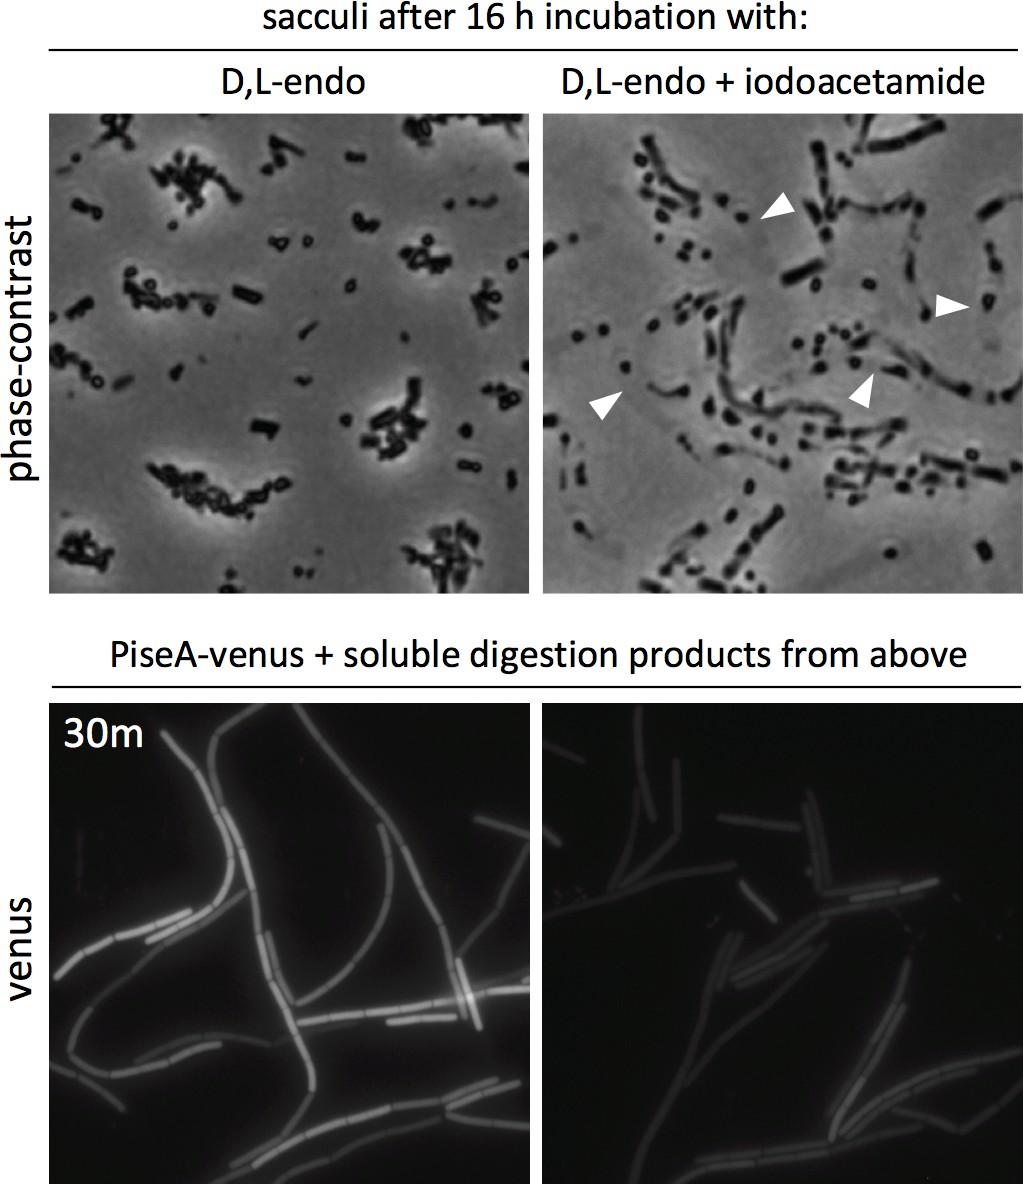
The soluble material after incubating PG sacculi with iodoacetamide-treated CwlO does not lower WalRK activity.
Phase-contrast images of purified B. subtilis sacculi incubated overnight at 37°C with purified CwlO∆cc (D,L-endo) or iodoacetamide-inactivated CwlO∆cc (top panels). Translucent sacculi (carets) surrounding phase-dark insoluble aggregates are only visible after incubation with the iodoacetamide-inactivated CwlO∆cc protein. Representative fluorescence images of B. subtilis cells harboring PiseA-venus after 30 min incubation with the soluble material generated from overnight incubation of sacculi under the indicated conditions (bottom panels).
Figure 9 with 2 supplements
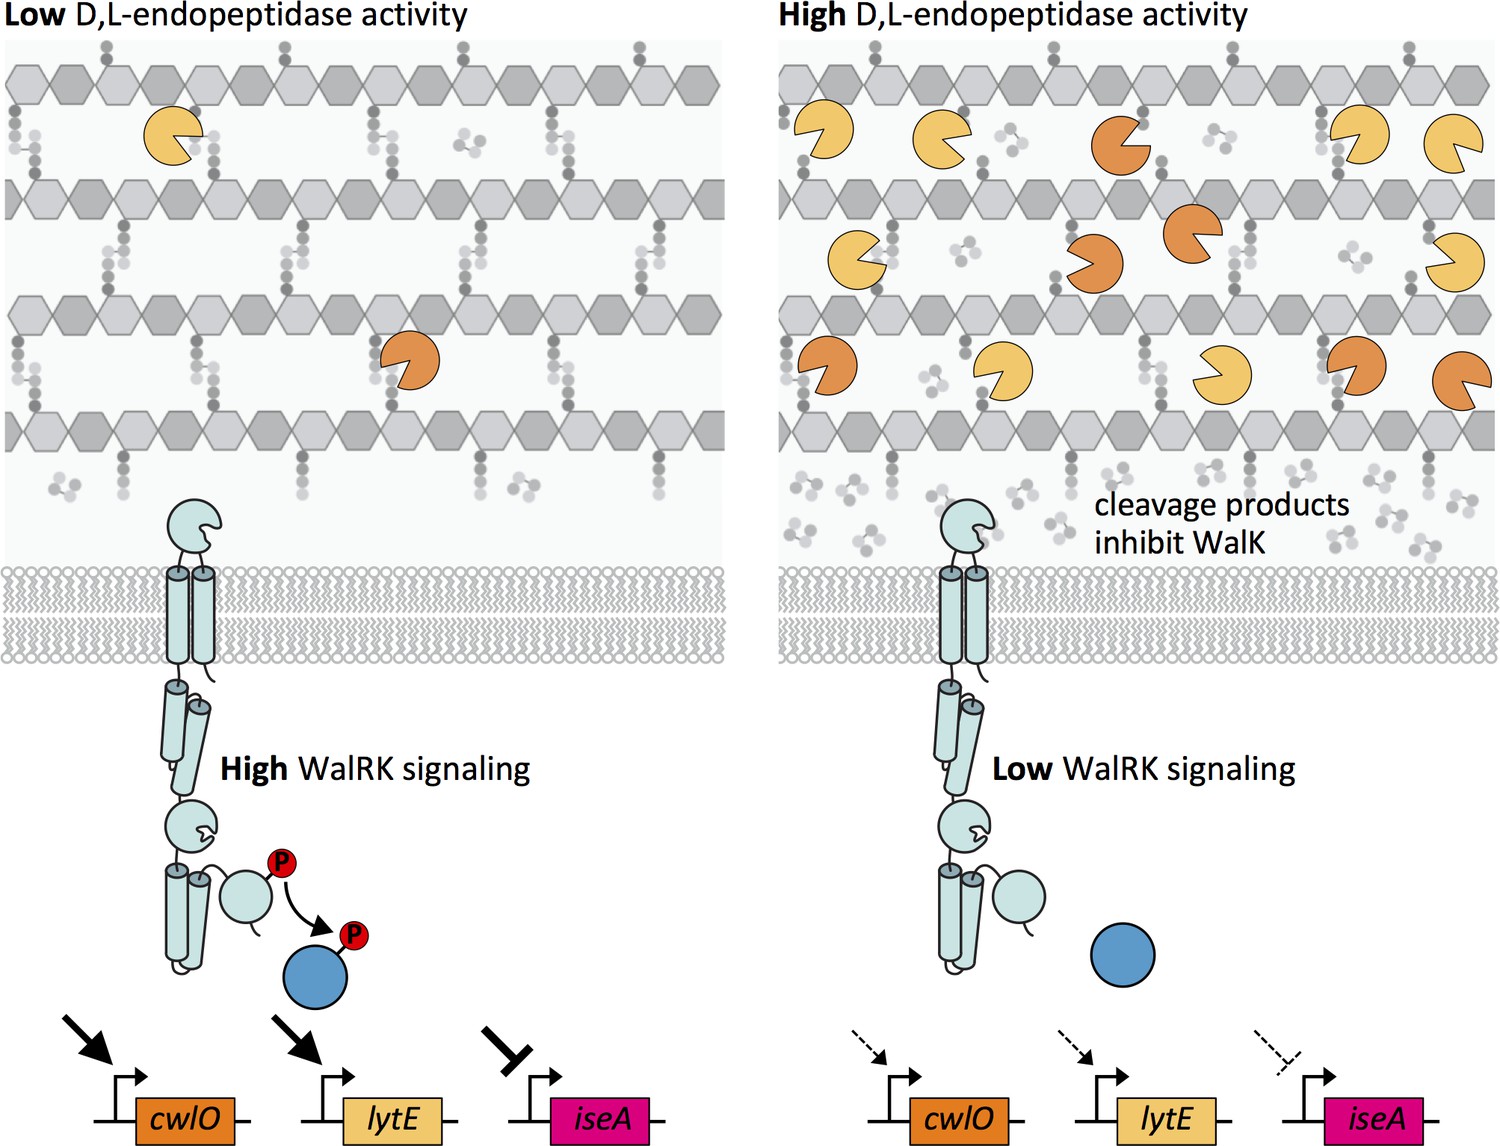
Model depicting the homeostatic control of cell wall elongation hydrolases by the WalRK two-component system.
The WalK sensor kinase and its two regulators WalH and WalI (not shown) sense and respond to the extent of D,L-endopeptidase cleavage. (Left panel) When the CwlO and LytE activities (orange and yellow scissors) are low, the concentration of their cleavage products is low and WalK kinase activity is high generating high levels of phosphorylated WalR. WalR ~P activates transcription of lytE and cwlO and represses transcription of iseA, encoding a secreted inhibitor of LytE. Thus, increased WalRK signaling returns D,L-endopeptidase activity to its homeostatic set point (not shown). (Right panel) When D,L-endopeptidase activity is high, the concentration of cleavage products generated by these enzymes increases and inhibits WalK signaling leading to a reduction in WalR ~P. Low WalR ~P reduces transcription of lytE and cwlO and de-represses iseA expression. CwlO levels are rapidly reduced due to its short half-life (Figure 9—figure supplement 1) and LytE activity is rapidly inhibited by IseA (Figure 9—figure supplement 2A). Thus, inhibition of WalK signaling by high concentrations of cleavage products efficiently restores homeostatic levels of the elongation D,L-endopeptidases.
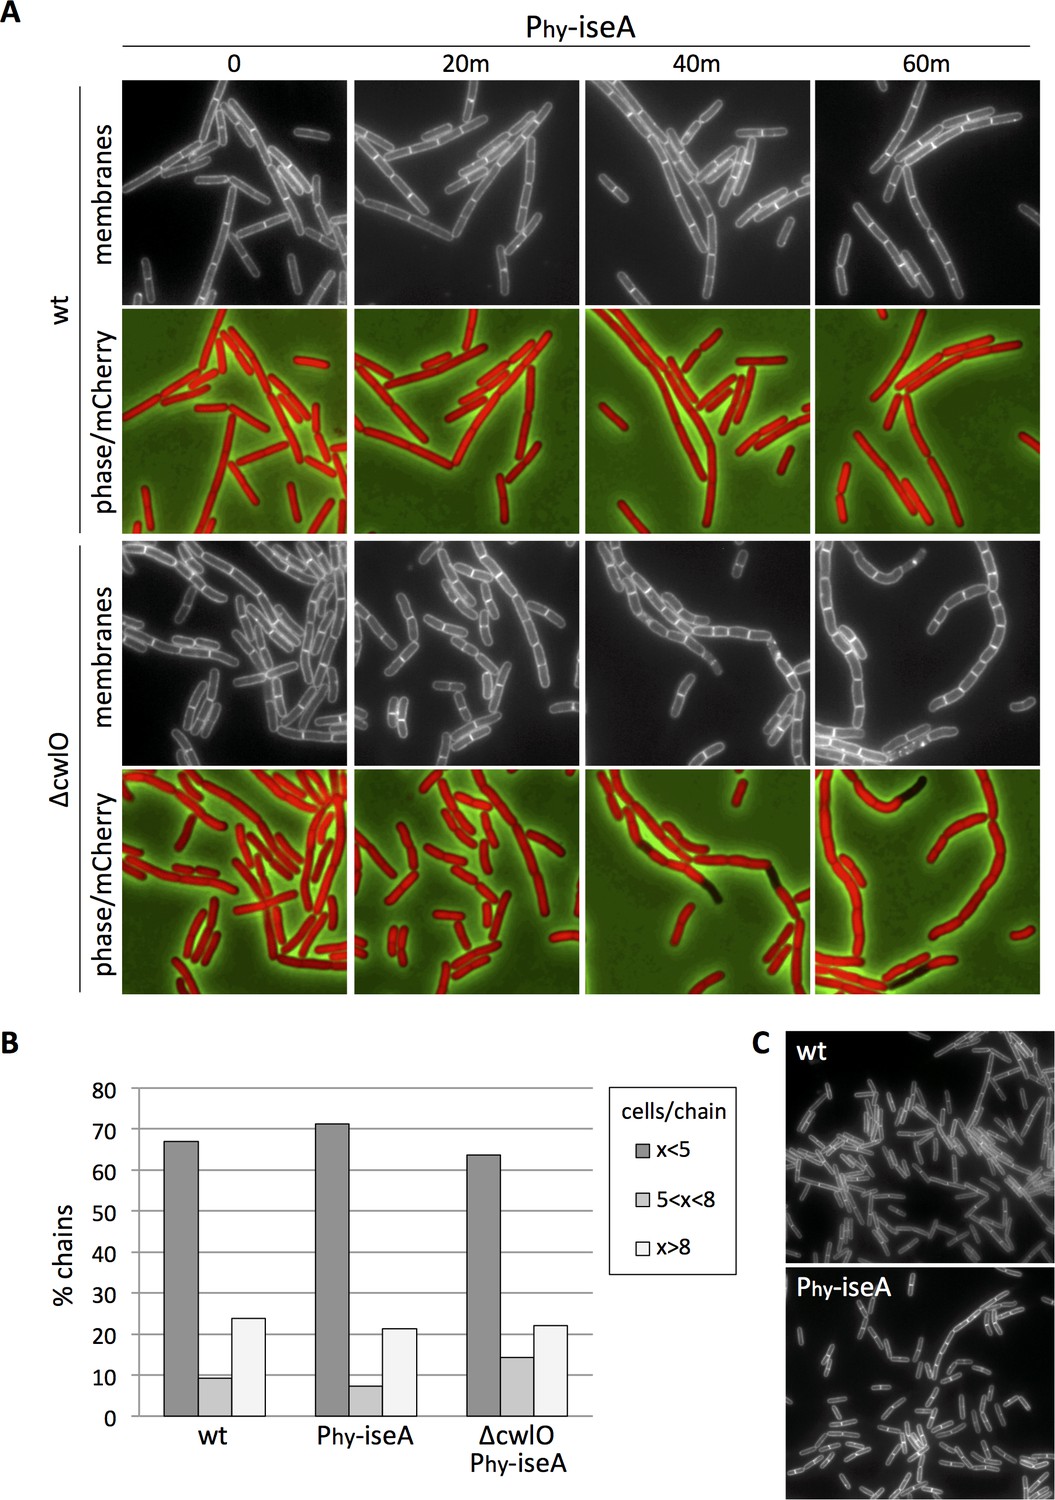
Figure 9—figure supplement 1
IseA inhibits LytE more potently than the cell separation hydrolases.
(A) Representative images of wild-type (wt) and the ∆cwlO mutant harboring a strong IPTG-inducible promoter fused to iseA with an optimized RBS (Phy-iseA). The indicated strains also contained cytoplasmic mCherry and the membrane reporter P(xyl)-spoIVFB(E44Q)-gfp. The cells were grown to exponential phase in CH medium supplemented with 10 mM xylose and imaged before and at the indicated times after addition of 500 µM IPTG. Membranes (top) and an overlay of cytoplasmic mCherry and phase contrast (bottom) are shown. Within 20–40 min after induction of iseA, cells lacking cwlO begin to shorten and fatten indicative of a reduction in cell elongation. Scale bar indicates 2 μm. (B) Over-expression of iseA under the same conditions as in (A) has no discernable impact on cell separation. The indicated strains harboring P(xyl)-spoIVFB(E44Q)-gfp were grown in CH medium supplemented with 10 mM xylose. iseA was induced for 60 min with 500 μM IPTG and the cells were analyzed by fluorescence microscopy. Using the SpoIVFB(E44Q)-GFP membrane reporter,>1500 cells from each strain were manually classified into three groups: i) chains with fewer than 5 cells; ii) chains with 5–8 cells; iii) chains with more than 8 cells. (C) Representative images of strains imaged in (B), at the time of classification.
Figure 9—figure supplement 2
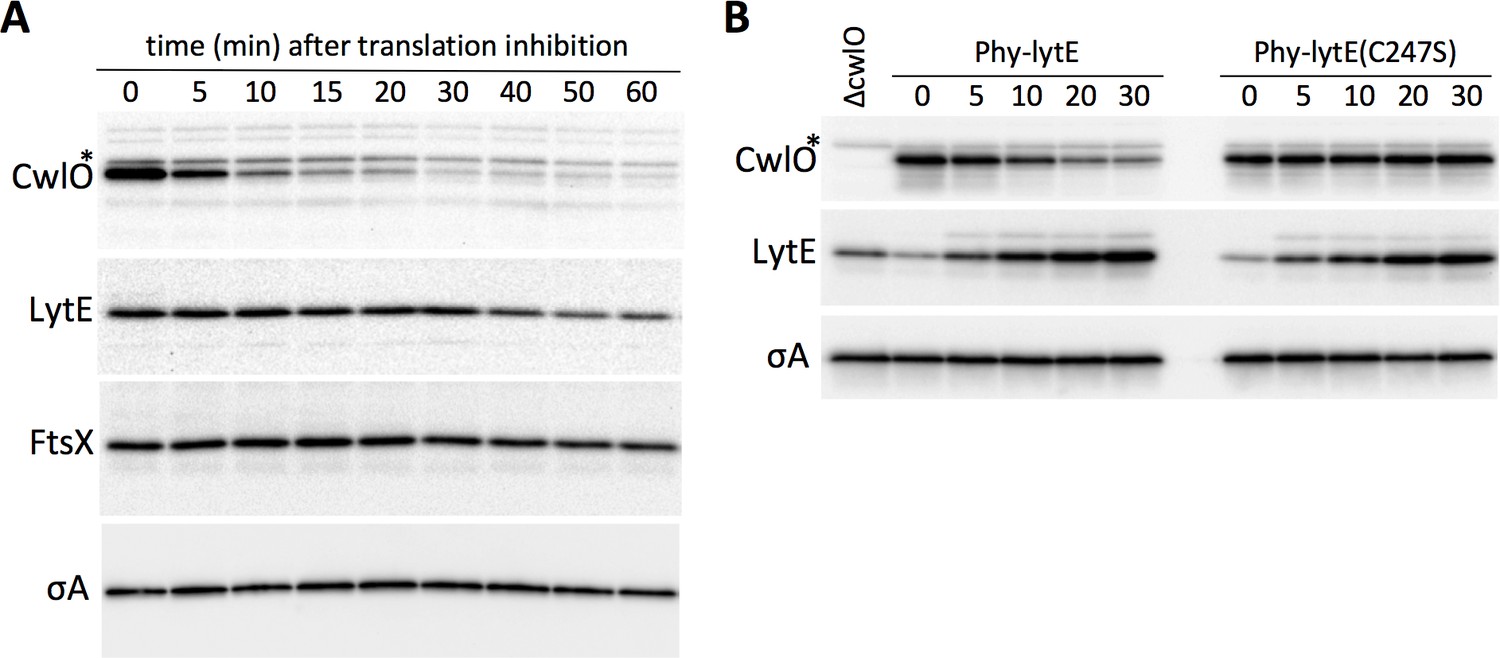
CwlO has a short half-life during exponential growth.
(A) In vivo protein stability assays were performed in wild-type B. subtilis grown in LB medium at 37°C. CwlO, LytE, FtsX and SigA protein levels were assessed by immunoblot at the indicated times after translation was inhibited by addition of spectinomycin and chloramphenicol. An asterisk (*) highlights a stable cross-reacting protein that migrates slightly slower than CwlO. (B) CwlO levels are rapidly reduced upon over-expression of lytE. Immunoblot analysis of CwlO, LytE, and SigA levels after induction of lytE or the LytE catalytic mutant (C247S). Cells were grown in LB medium at 37°C. CwlO, LytE, and SigA levels were assessed before and at the indicated times after the addition of 50 µM IPTG. As LytE levels increase in response to IPTG induction, CwlO levels decrease due to a reduction in WalR-dependent transcription and the short half-life of the protein. The representative immunoblots in this figure are from one of three independent experiments.
Additional files
-
Supplementary file 1
Table of oligonucleotides used in this study.
- https://cdn.elifesciences.org/articles/52088/elife-52088-supp1-v2.docx
-
Supplementary file 2
Key resources table.
- https://cdn.elifesciences.org/articles/52088/elife-52088-supp2-v2.xlsx
-
Transparent reporting form
- https://cdn.elifesciences.org/articles/52088/elife-52088-transrepform-v2.pdf
Download links
A two-part list of links to download the article, or parts of the article, in various formats.
Downloads (link to download the article as PDF)
Open citations (links to open the citations from this article in various online reference manager services)
Cite this article (links to download the citations from this article in formats compatible with various reference manager tools)
Homeostatic control of cell wall hydrolysis by the WalRK two-component signaling pathway in Bacillus subtilis
eLife 8:e52088.
https://doi.org/10.7554/eLife.52088


