ESCO1 and CTCF enable formation of long chromatin loops by protecting cohesinSTAG1 from WAPL
- Research Institute of Molecular Pathology (IMP), Vienna Biocenter (VBC), Austria
- The Center for Genome Architecture, Baylor College of Medicine, United States
- Department of Molecular and Human Genetics, Baylor College of Medicine, United States
- Center for Theoretical Biological Physics, Rice University, United States
- Department of Computer Science, Stanford University, United States
- Nuclear Dynamics Programme, The Babraham Institute, Babraham Research Campus, United Kingdom
- Centre for Computational Biology, University of Birmingham, United Kingdom
- Departments of Computer Science and Computational and Applied Mathematics, Rice University, United States
- Departments of Computer Science and Genome Sciences, University of Washington, United States
- Institute of Molecular Biotechnology, Vienna Biocenter (VBC), Austria
- Department of Biological Science, Florida State University, United States
- Broad Institute of MIT and Harvard, United States
- Shanghai Institute for Advanced Immunochemical Studies, Shanghai Tech University, China
Figures
Figure 1 with 1 supplement

ESCO1 preferentially acetylates cohesinSTAG1 during G1 phase.
(A) Immunoblot analysis of SMC3, STAG1 and STAG2 immunoprecipitates obtained from chromatin extracts of cells synchronized in G1 and G2. Immunoprecipitated material was normalized to SMC3 levels and immunoblotting was performed using the indicated antibodies. Flow cytometry profiles are shown on the left. (B) Flow cytometry and chromatin extract immunoblot analysis of cells synchronized in G1 and depleted of the proteins indicated. Chromatin extracts were normalized relative to SMC3. Note that SMC3ac levels are decreased after ESCO1 and STAG1 depletion and increased after STAG2 depletion. (C) SDS-PAGE analysis of EGFP-STAG1 and STAG2-EGFP immunoprecipitates obtained from chromatin extracts of cells synchronized in G1 and G2. Immunoprecipitations were performed using anti-GFP antibodies and were analyzed with silver staining. Flow cytometry profiles are shown on the left. (D) Relative abundance of non-acetylated peptides (no acetylation), peptides acetylated at position K105 (K105ac) and peptides acetylated peptide at positions K105 and K106 (K105ac/106ac) in cells synchronized in G1 and G2 was determined by quantitative mass spectrometry from material immunoprecipitated using anti-GFP antibodies from EGFP-STAG1 and STAG2-EGFP cells. Peptide percentage was calculated relative to the total number of SMC3 peptides. Note that part of this experiment has been previously published (Ivanov et al., 2018; Figure S4).
Figure 1—figure supplement 1
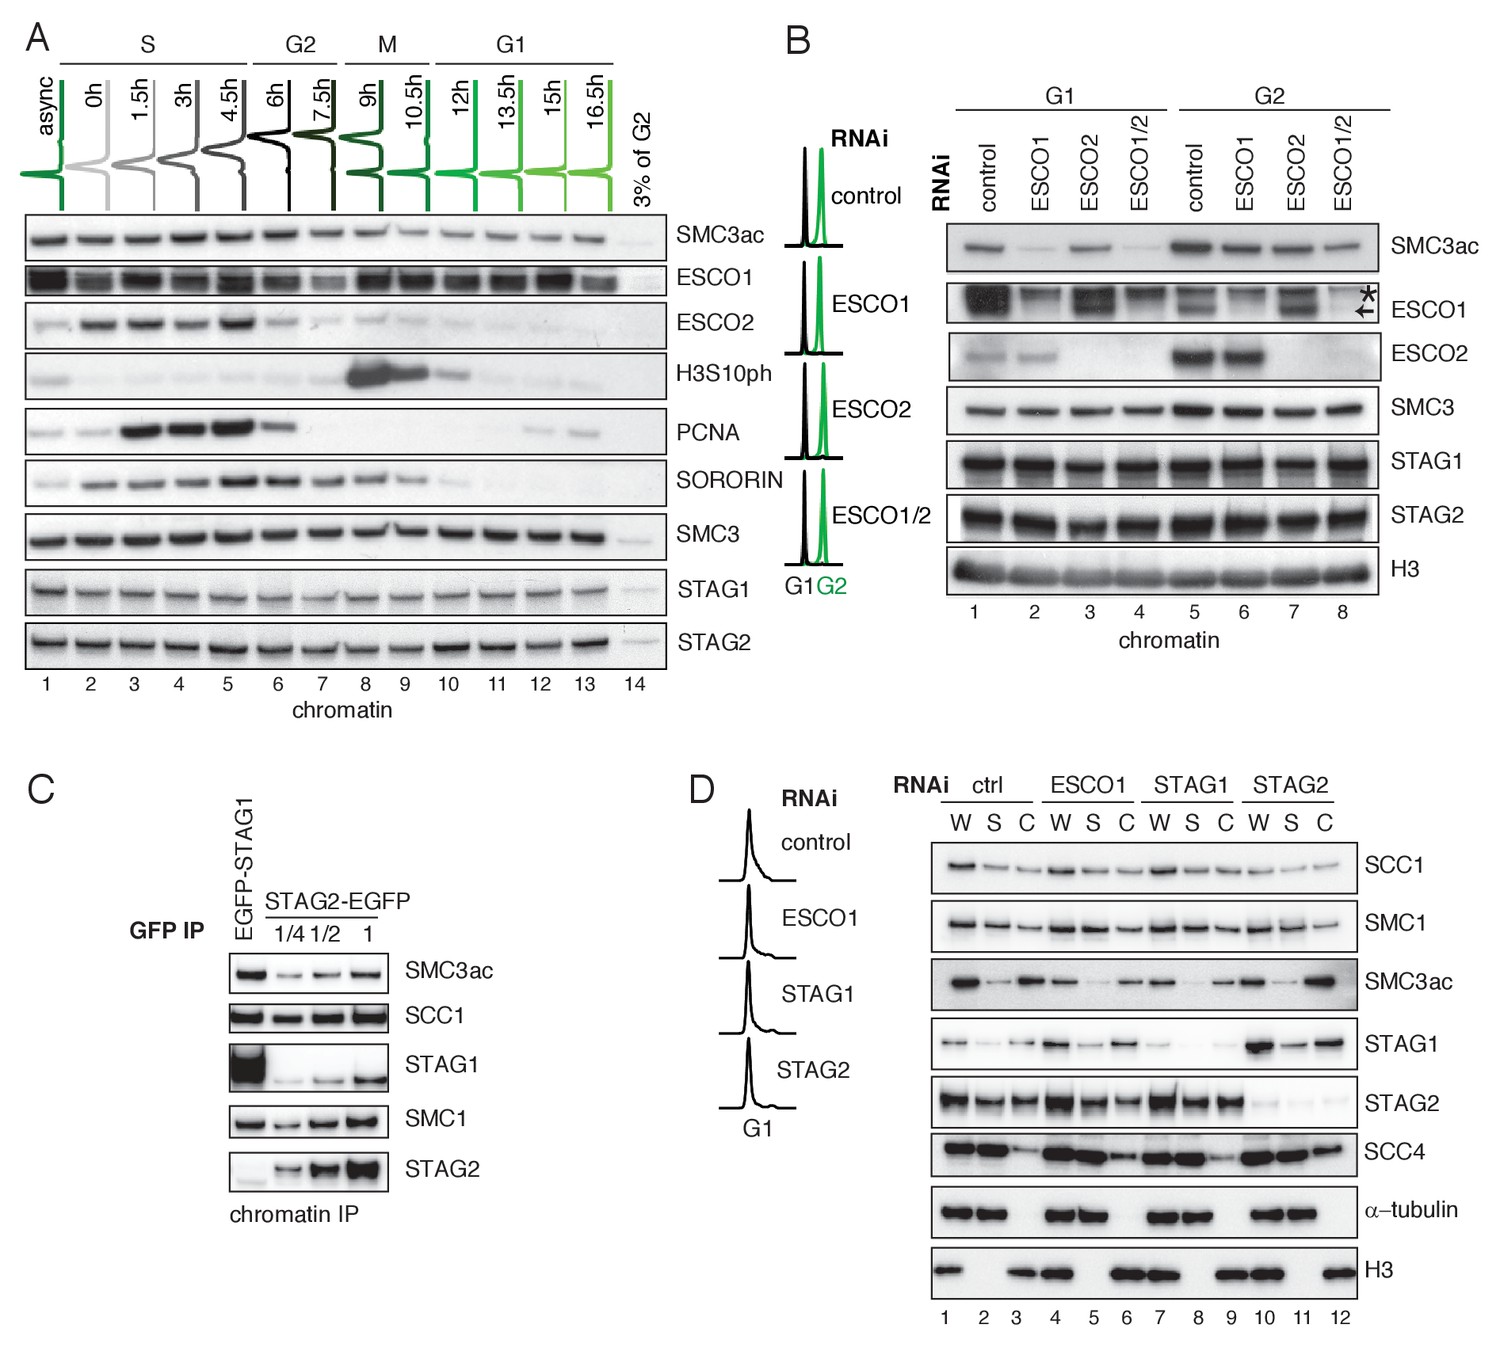
ESCO1 preferentially acetylates cohesinSTAG1 during G1 phase.
(A) Flow cytometry and chromatin extract immunoblot analysis of cells at different times after double thymidine arrest/release. At the indicated time points, the chromatin pellet fraction was analyzed by immunoblotting using the indicated antibodies. Flow-cytometry profiles of different time points are shown on top. (B) Flow cytometry and chromatin extract immunoblot analysis of control, ESCO1, ESCO2 and ESCO1/2-depleted cells synchronized in G1 and G2. Immunoblotting was performed using the indicated antibodies. Histone H3 was used as a loading control. The asterix denotes an unspecific bend recognized by ESCO1 antybody (C) Immunoblot analysis of STAG1 and STAG2 immunoprecipitates obtained from chromatin extracts from equal numbers of EGFP-STAG1 and STAG2-EGFP HeLa cells. Immunoprecipitations were performed using anti-GFP antibodie. (D) Flow cytometry and immunoblot analysis of control, ESCO1, STAG1 and STAG2-depleted cells synchronized in G1. Immunoblotting of whole cell (W), supernatant (S) and chromatin (C) extracts was performed using the indicated antibodies. α-tubulin and histone H3 were used as loading controls.
Figure 2 with 3 supplements
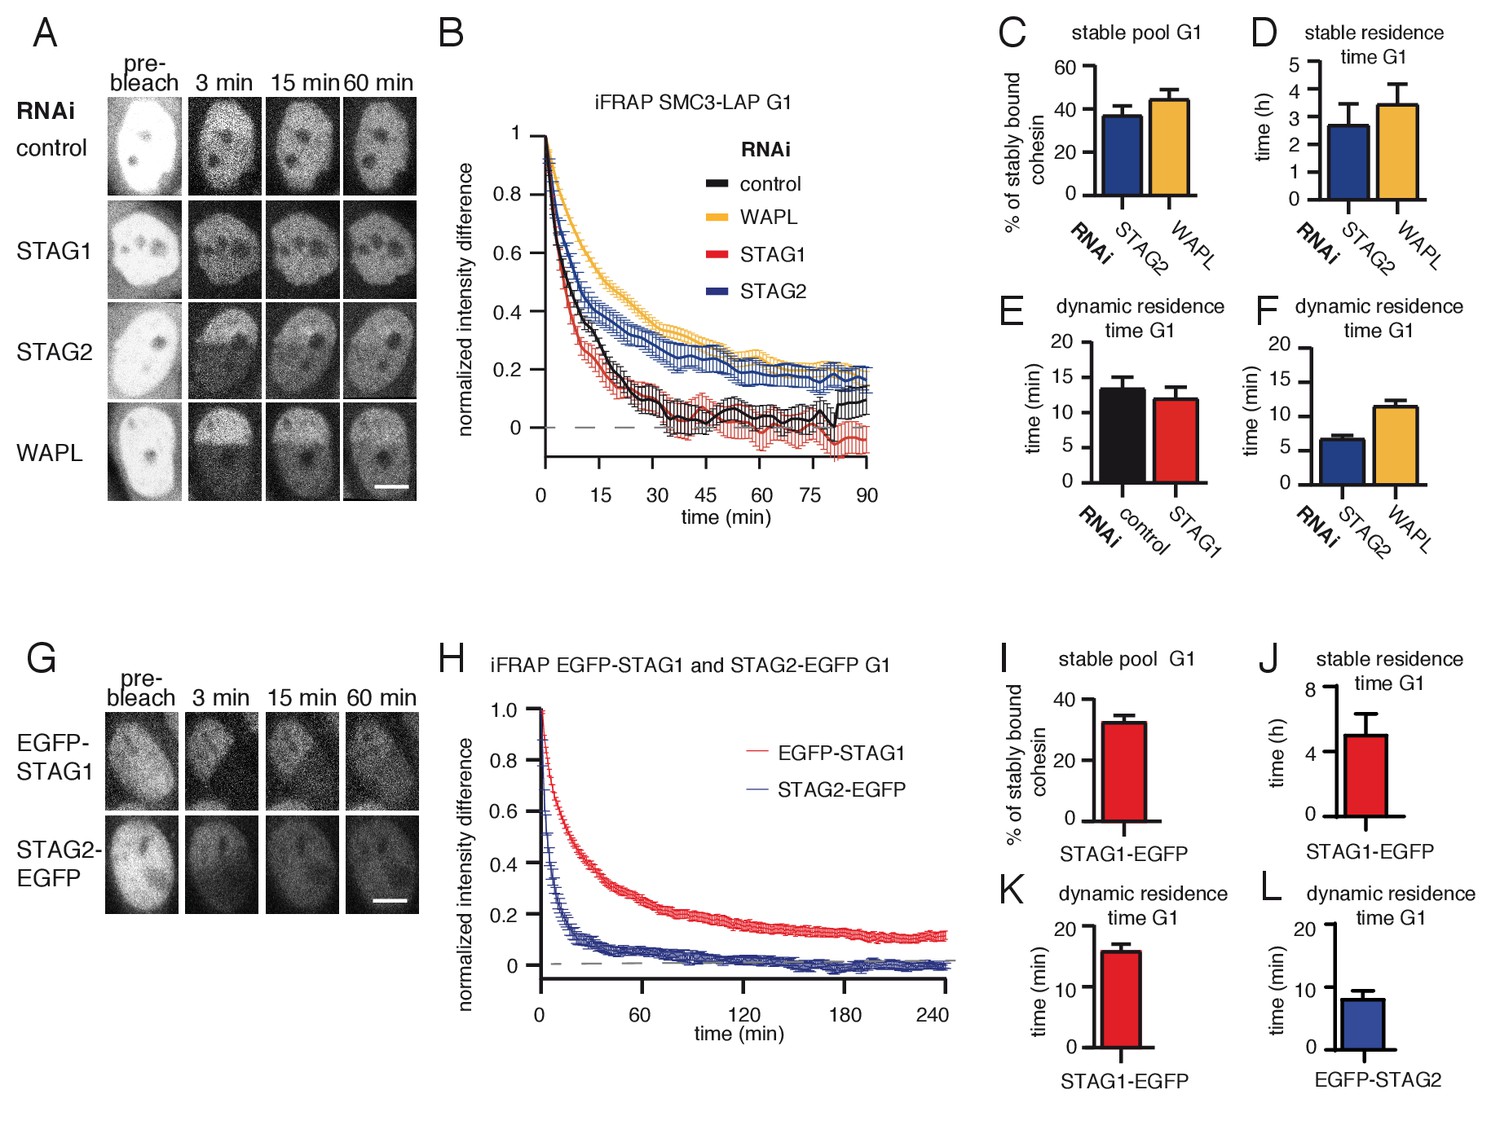
A subpopulation of cohesinSTAG1 associates stably with chromatin during G1 phase.
(A) Images of inverse fluorescence recovery after photobleaching (iFRAP) experiments in SMC3-LAP cells synchronized in G1 and depleted of the indicated proteins by RNAi. Scale bar, 10 µm. Half of the nuclear SMC3-LAP fluorescent signal was photobleached and the mean fluorescence in the unbleached and bleached regions was monitored by time-lapse microscopy. (B) Graph depicting the mean normalized difference in fluorescence intensity between the bleached and unbleached regions from cells treated as described in A. Error bars denote standard error of the mean (s.e.m.), n > = 15 cells per condition. (C) Quantification of the fraction of nuclear SMC3-LAP that was stably chromatin bound in cells synchronized in G1 and depleted of the indicated proteins by RNAi. (D) Quantification of the residence time of stably chromatin bound SMC3-LAP in cells synchronized in G1 and depleted of the indicated proteins by RNAi. (E) Quantification of residence time of dynamically chromatin bound SMC3-LAP in cells synchronized in G1 and depleted of STAG1 by RNAi. The numbers are derived from the single exponential fit. (F) Quantification of the residence time of dynamically chromatin bound SMC3-LAP in cells synchronized in G1 and depleted of STAG2 and WAPL by RNAi. The numbers are derived from the bi-exponential fit. (G) iFRAP images in EGFP-STAG1 and STAG2-EGFP cells synchronized in G1. Scale bar, 10 µm. (H) Graph depicting the mean normalized difference in fluorescence intensity between the bleached and unbleached regions from cells treated as in G. Error bars denote s.e.m., n = 10 cells per condition. (I) Quantification of the fractions of nuclear EGFP-STAG1 that was stably chromatin bound in G1 cells. (J) Quantification of the residence time of stably chromatin bound EGFP-STAG1 in G1 cells. (K) Quantification of the residence time of dynamically chromatin bound EGFP-STAG1 in G1 cells. The numbers are derived from the biexponential fit. (L) Quantification of the residence time of dynamically chromatin bound STAG2-EGFP in G1 cells. The numbers are derived from the single exponential fit.
-
Figure 2—source data 1
The Microsoft Excel file lists iFRAP measurements used to generate data in Figure 2B–F.
- https://cdn.elifesciences.org/articles/52091/elife-52091-fig2-data1-v2.xlsx
-
Figure 2—source data 2
The Microsoft Excel file lists iFRAP measurements used to generate data in Figure 2H–L.
- https://cdn.elifesciences.org/articles/52091/elife-52091-fig2-data2-v2.xlsx
Figure 2—figure supplement 1
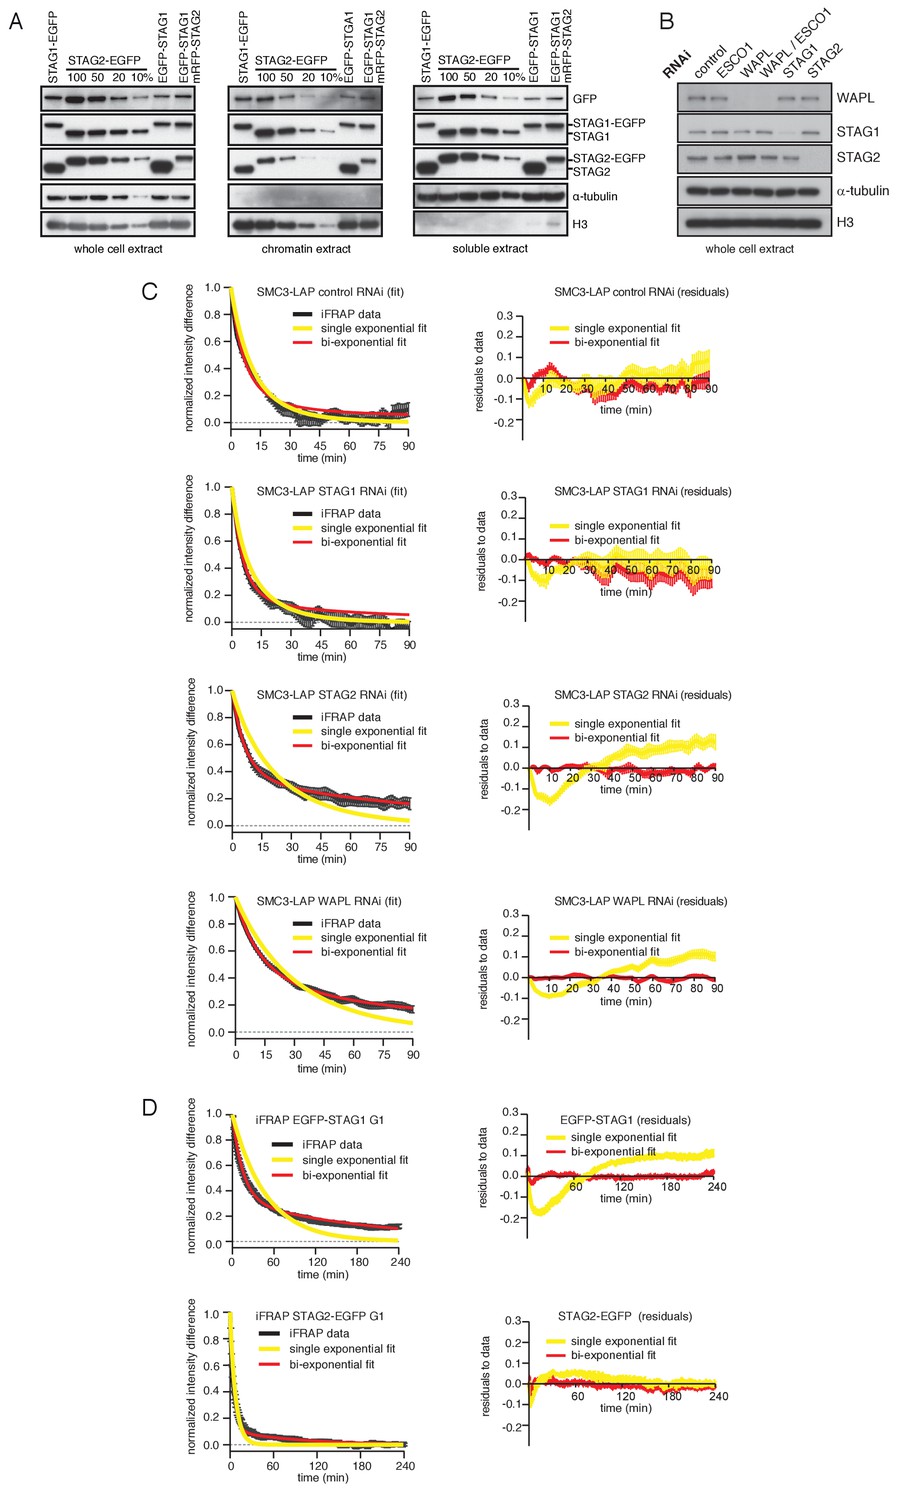
Characterization of cell lines expressing tagged versions of STAG1 and STAG2 used in iFRAP curve fitting analyses.
(A) Immunoblot analysis of HeLa cell lines. Immunoblotting of whole cell, chromatin and soluble extracts was performed using the indicated antibodies. α-tubulin and histone H3 were used as loading controls. (B) Immunoblot analysis of whole cell extract from cells depleted of the proteins listed. Immunoblotting was performed using the indicated antibodies. α-tubulin and histone H3 were used as loading controls. (C) Curve fitting to experimental iFRAP curves obtained from SMC3-LAP in G1 phase by a single exponential and bi-exponential functions is shown on the left. Residuals representing the difference between the experimental- and simulated-value of the fits from the left panel are plotted on the right. (D) Curve fitting to experimental iFRAP curves obtained from EGFP-STAG1 and STAG2-EGFP in G1 phase by a single exponential and bi-exponential functions is shown on the left. Residuals representing the difference between the experimental- and simulated-value of the fits from the left panel are plotted on the right and bi-exponential functions is shown on the left. Residuals representing the difference between the experimental- and simulated-value of the fits from the left panel are plotted on the right.
Figure 2—figure supplement 2
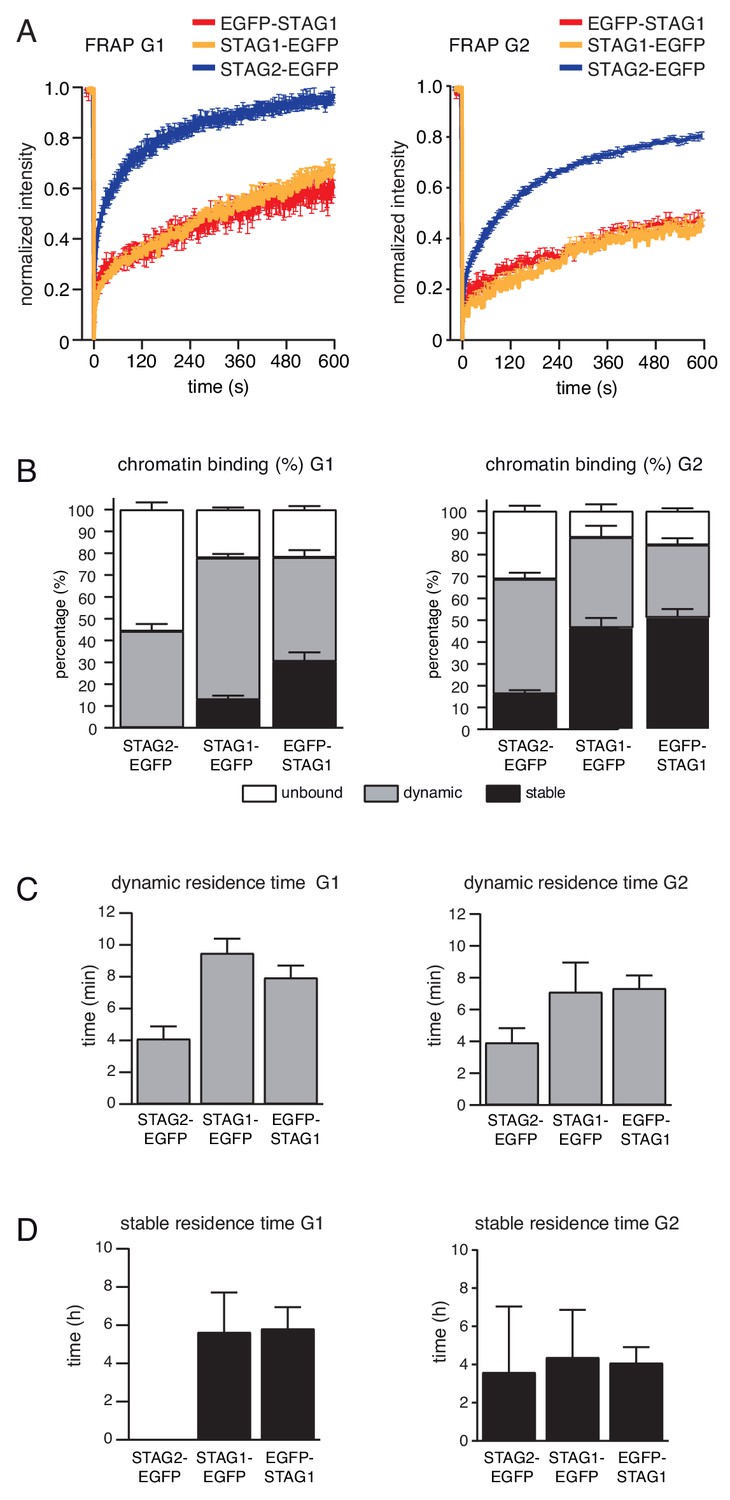
FRAP experiment confirms that subpopulation of cohesinSTAG1 associates stably with chromatin during G1 phase.
(A) Graph depicting the mean normalized fluorescence intensity after photobleaching in EGFP-STAG1, STAG1-EGFP and STAG2-EGFP cells synchronized in G1 (left) and G2 (right). Error bars denote s.e.m., n > = 6 cells per condition. (B) EGFP-STAG1, STAG1-EGFP and STAG2-EGFP distribution within the nucleus as measured by FRAP. (C) Quantification of the residence time of dynamically chromatin bound STAG2-EGFP, STAG1-EGFP and EGFP-STAG1 in cells synchronized in G1 (left) and G2 (right). (D) Quantification of the residence time of stably chromatin bound STAG2-EGFP, STAG1-EGFP and EGFP-STAG1 in cells synchronized in G1 (left) and G2 (right).
-
Figure 2—figure supplement 2—source data 1
The Microsoft Excel file lists FRAP measurements used to generate data in Figure 2—figure supplement 2.
- https://cdn.elifesciences.org/articles/52091/elife-52091-fig2-figsupp2-data1-v2.xlsx
Figure 2—figure supplement 3
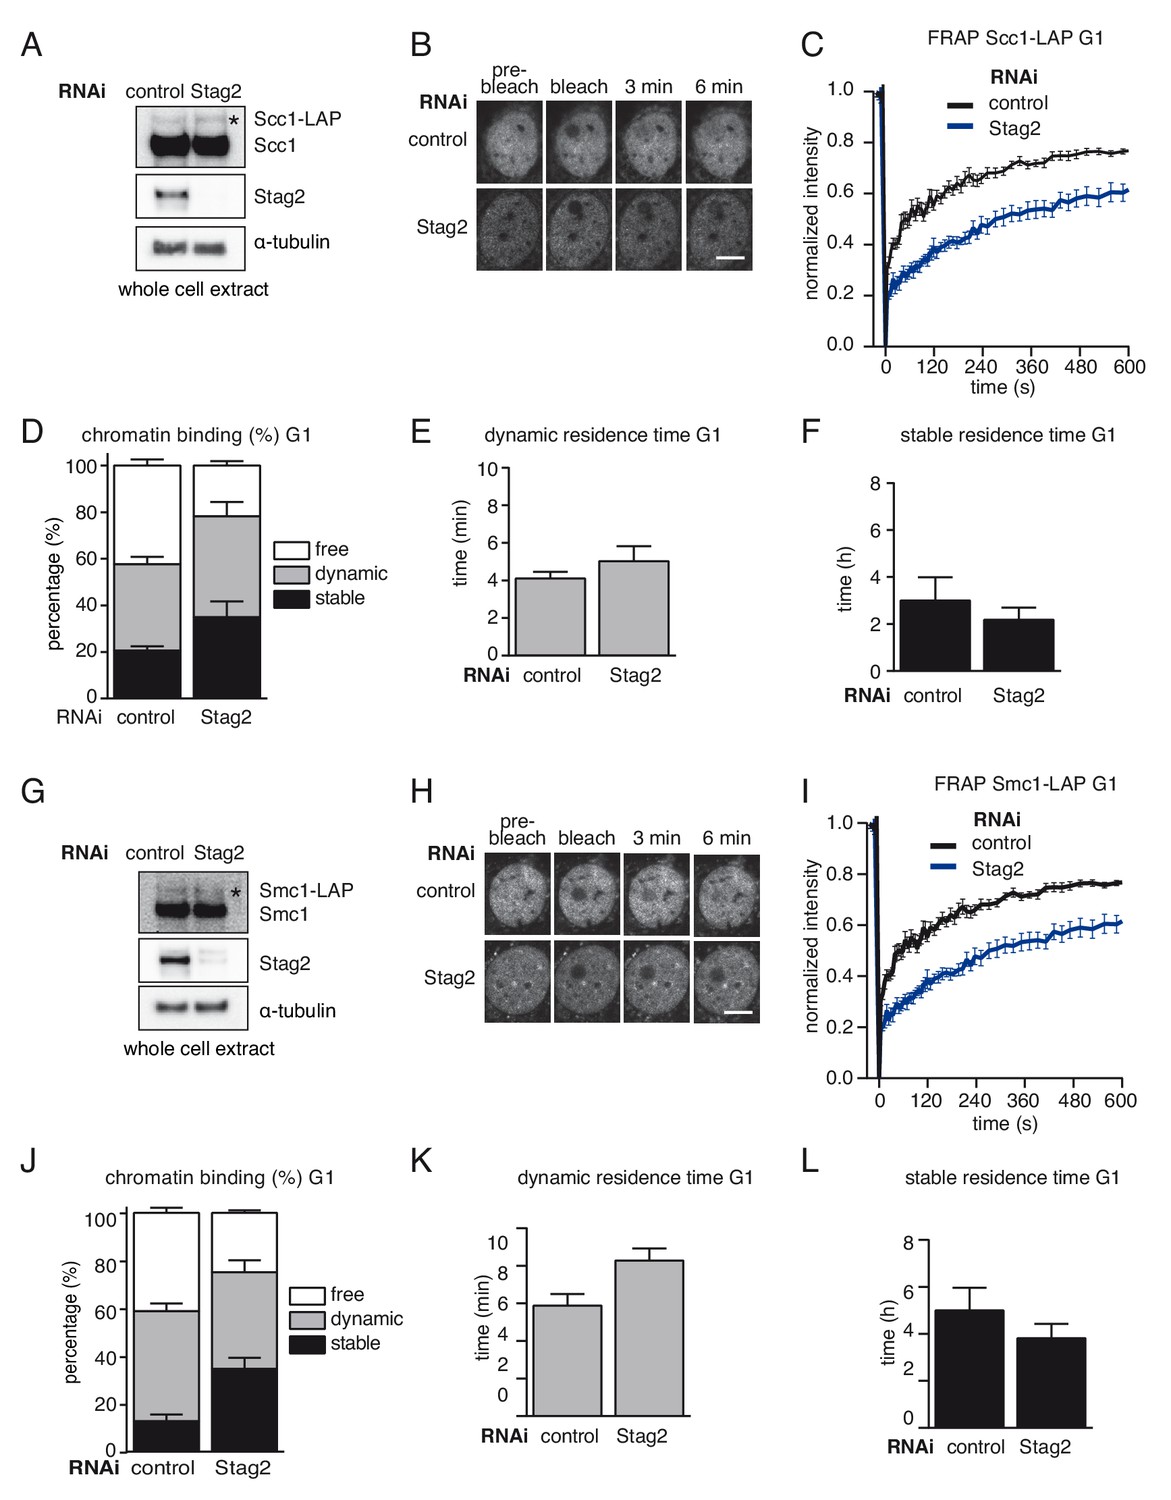
A subpopulation of cohesinSTAG1 associates stably with chromatin in quiescent MEFs.
(A) Immunoblot analysis of whole cell extracts from control- and Stag2-depleted Scc1-LAP iMEFs cells synchronized in G0/1. Immunoblotting was performed using the indicated antibodies. The asterisk denotes the Scc1-LAP band. α-tubulin was used as a loading control. (B) Images of fluorescence recovery after photobleaching (FRAP) in Scc1-LAP cells synchronized in G0/G1 and depleted of Stag2 by RNAi. Scale bar, 10 µm. (C) Graph depicting the mean normalized fluorescence intensity after photobleaching in control- and Stag2-depleted Scc1-LAP cells synchronized in G1. Error bars denote s.e.m., n = 10 cells per condition. (D) Scc1-LAP distribution within the nucleus of control- and Stag2-depleted G0/G1 cells, as measured by FRAP. (E) Quantification of the dynamically chromatin bound residence time of Scc1-LAP in control- and Stag2-depleted cells synchronized in G1. (F) Quantification of the stably chromatin bound residence time of Scc1-LAP in control- and Stag2-depleted cells synchronized in G1. (G) Immunoblot analysis of whole cell extracts from control- and Stag2-depleted Smc1-LAP iMEFs cells synchronized in G0/1. Immunoblotting was performed using the indicated antibodies. The asterisk denotes the Smc1-LAP band. α-tubulin was used as a loading control. (H) Images of fluorescence recovery after photobleaching (FRAP) in Smc1-LAP cells synchronized in G0/G1 and depleted of Stag2 by RNAi. Scale bar, 10 µm. (I) Graph depicting the mean normalized fluorescence intensity after photobleaching in control- and Stag2-depleted Smc1-LAP cells synchronized in G1. Error bars denote s.e.m., n = 10 cells per condition. (J) Smc1-LAP distribution within the nucleus of control- and Stag2-depleted G0/G1 cells, as measured by FRAP. (K) Quantification of the dynamically chromatin bound residence time of Smc1-LAP in control- and Stag2-depleted cells synchronized in G1. (L) Quantification of the stably chromatin bound residence time of Smc1-LAP in control- and Stag2-depleted cells synchronized in G1.
-
Figure 2—figure supplement 3—source data 1
The Microsoft Excel file lists FRAP measurements used to generate data in Figure 2—figure supplement 3C–F.
- https://cdn.elifesciences.org/articles/52091/elife-52091-fig2-figsupp3-data1-v2.xlsx
-
Figure 2—figure supplement 3—source data 2
The Microsoft Excel file lists FRAP measurements used to generate data in Figure 2—figure supplement 3H–L.
- https://cdn.elifesciences.org/articles/52091/elife-52091-fig2-figsupp3-data2-v2.xlsx
Figure 3 with 3 supplements
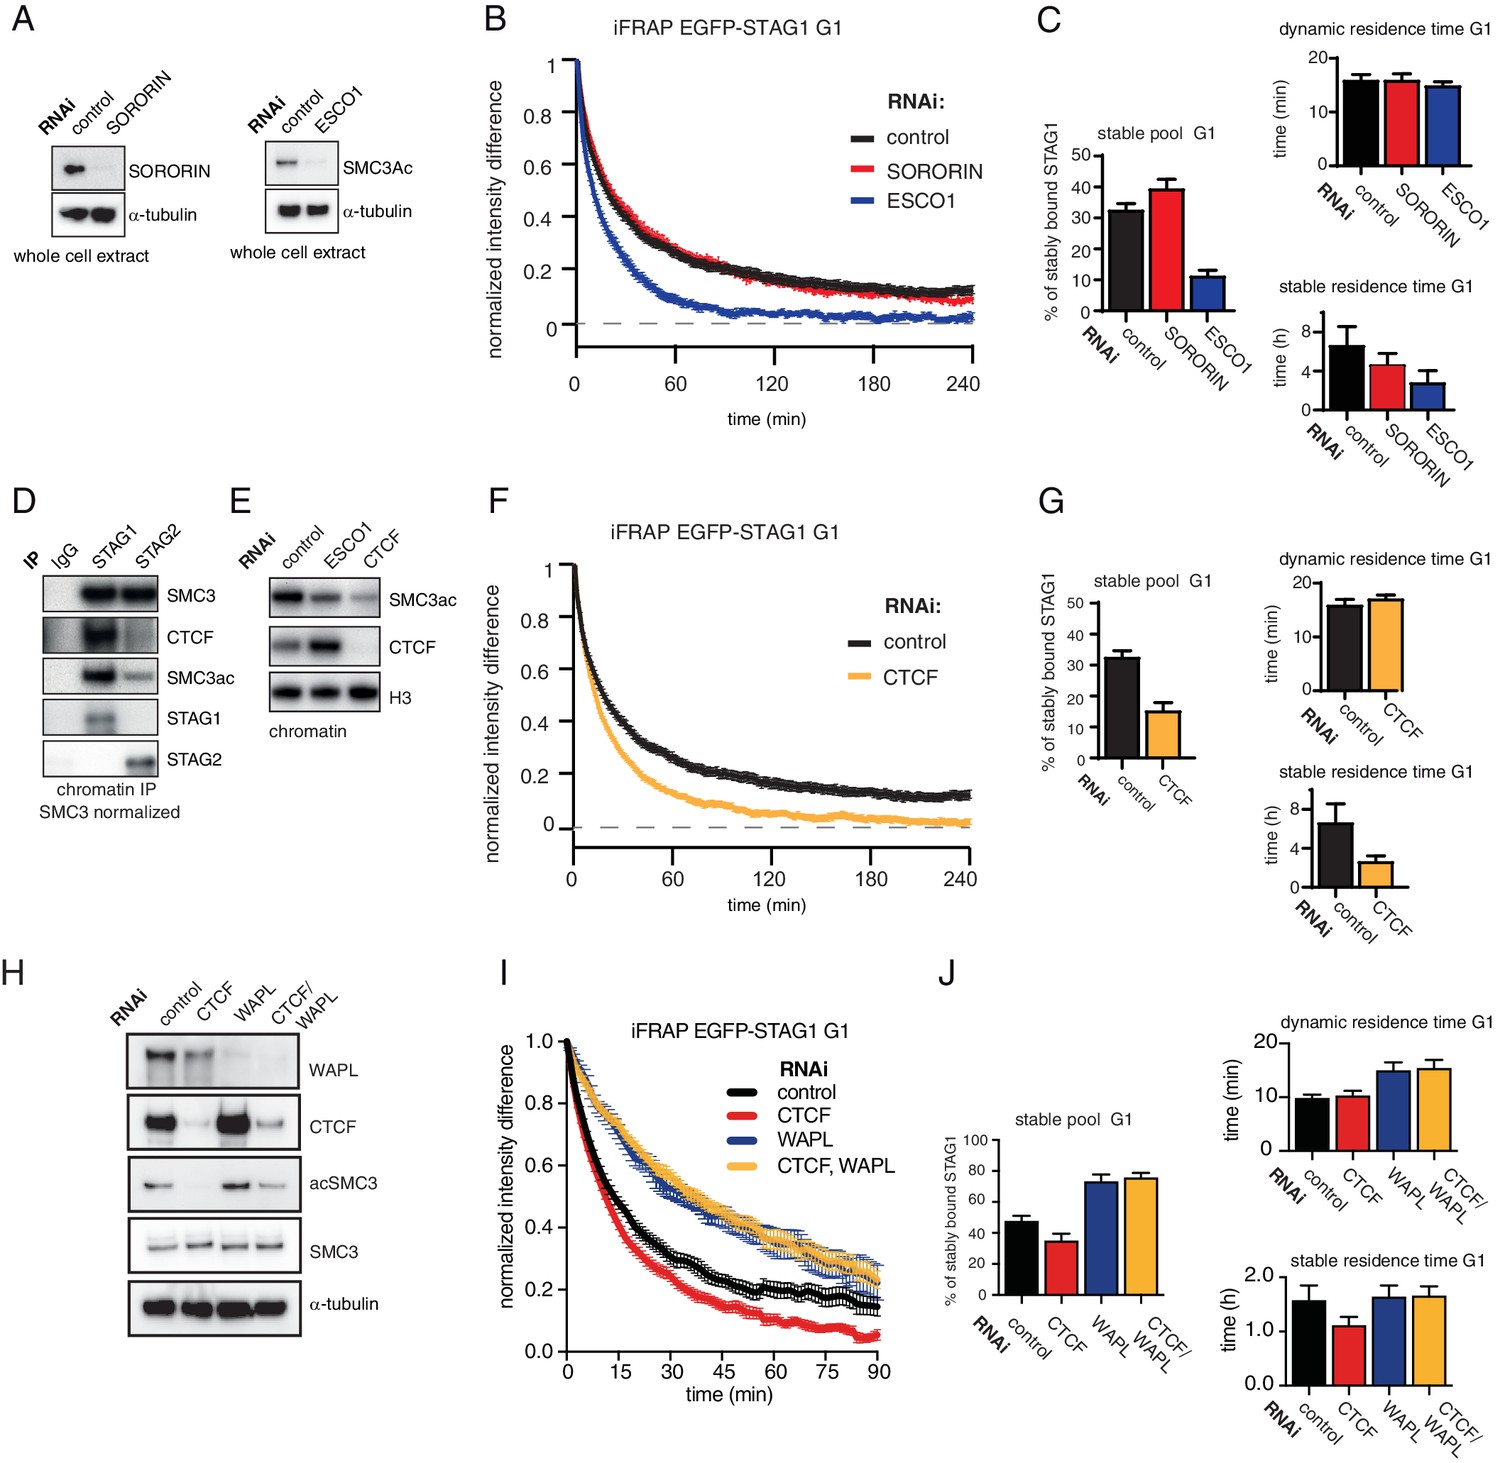
The long chromatin residence time of cohesinSTAG1 depends on ESCO1 and CTCF, as does SMC3 acetylation.
(A) Immunoblot analysis of whole cell extract from cells depleted of sororin or ESCO1. α-tubulin was used as a loading control. (B) Graph depicting the mean normalized difference in EGFP-STAG1 fluorescence intensity between the unbleached and bleached regions following iFRAP in G1 cells and deplettion of the indicated proteins by RNAi. Error bars denote s.e.m., n = 10 cells per condition. (C) Quantification of the fraction of nuclear EGFP-STAG1 that was stably chromatin bound in cells synchronized in G1 and depleted of the indicated proteins by RNAi. Quantification of dynamic and stable residence time of EGFP-STAG1 upon RNAi treatment for indicated proteins is shown on the right. (D) Immunoblot analysis of STAG1 and STAG2 chromatin immunoprecipitates obtained from cells synchronized in G1. Immunoprecipitations were performed using control-IgG, anti-STAG1 and anti-STAG2 antibodies. Immunoprecipitated material was normalized to SMC3 levels and immunoblotting was performed using the indicated antibodies. (E) Immunoblot analysis of chromatin extracts from control-, ESCO1- and CTCF-depleted HeLa cells synchronized in G1. Immunoblotting was performed using the indicated antibodies. Note that acetylation levels were decreased following depletion of CTCF. Histone H3 was used as a loading control. (F) Graph depicting the mean normalized difference in EGFP-STAG1 fluorescence intensity between the bleached and unbleached regions following iFRAP in cells synchronized in G1 and depleted of the indicated proteins by RNAi. Error bars denote s.e.m., n = 10 cells per condition. (G) Quantification of the fraction of nuclear EGFP-STAG1 that was stably chromatin bound in cells synchronized in G1 and depleted of the indicated proteins by RNAi. Quantification of dynamic and stable residence time of EGFP-STAG1 is shown on the right. (H) Immunoblot analysis of whole cell extract from cells depleted of CTCF, WAPL or CTCF/WAPL double depletion. α-tubulin was used as a loading control. (I) Graph depicting the mean normalized difference in EGFP-STAG1 fluorescence intensity between the unbleached and bleached regions following iFRAP in G1 cells and depleted of the indicated proteins by RNAi. Error bars denote s.e.m., n = 10 cells per condition. (J) Quantification of the fraction of nuclear EGFP-STAG1 that was stably chromatin bound in cells synchronized in G1 and depleted of the indicated proteins by RNAi. Quantification of dynamic and stable residence time of EGFP-STAG1 upon RNAi treatment for indicated proteins is shown on the right. Note that analyses of the data in I yielded lower values for stable residence times than those in C and G, presumably as a result of the shorter iFRAP imaging time used in this experiment.
-
Figure 3—source data 1
The Microsoft Excel file lists iFRAP measurements used to generate data in Figure 3B,C,F,G.
- https://cdn.elifesciences.org/articles/52091/elife-52091-fig3-data1-v2.xlsx
-
Figure 3—source data 2
The Microsoft Excel file lists iFRAP measurements used to generate data in Figure 3I–J.
- https://cdn.elifesciences.org/articles/52091/elife-52091-fig3-data2-v2.xlsx
Figure 3—figure supplement 1
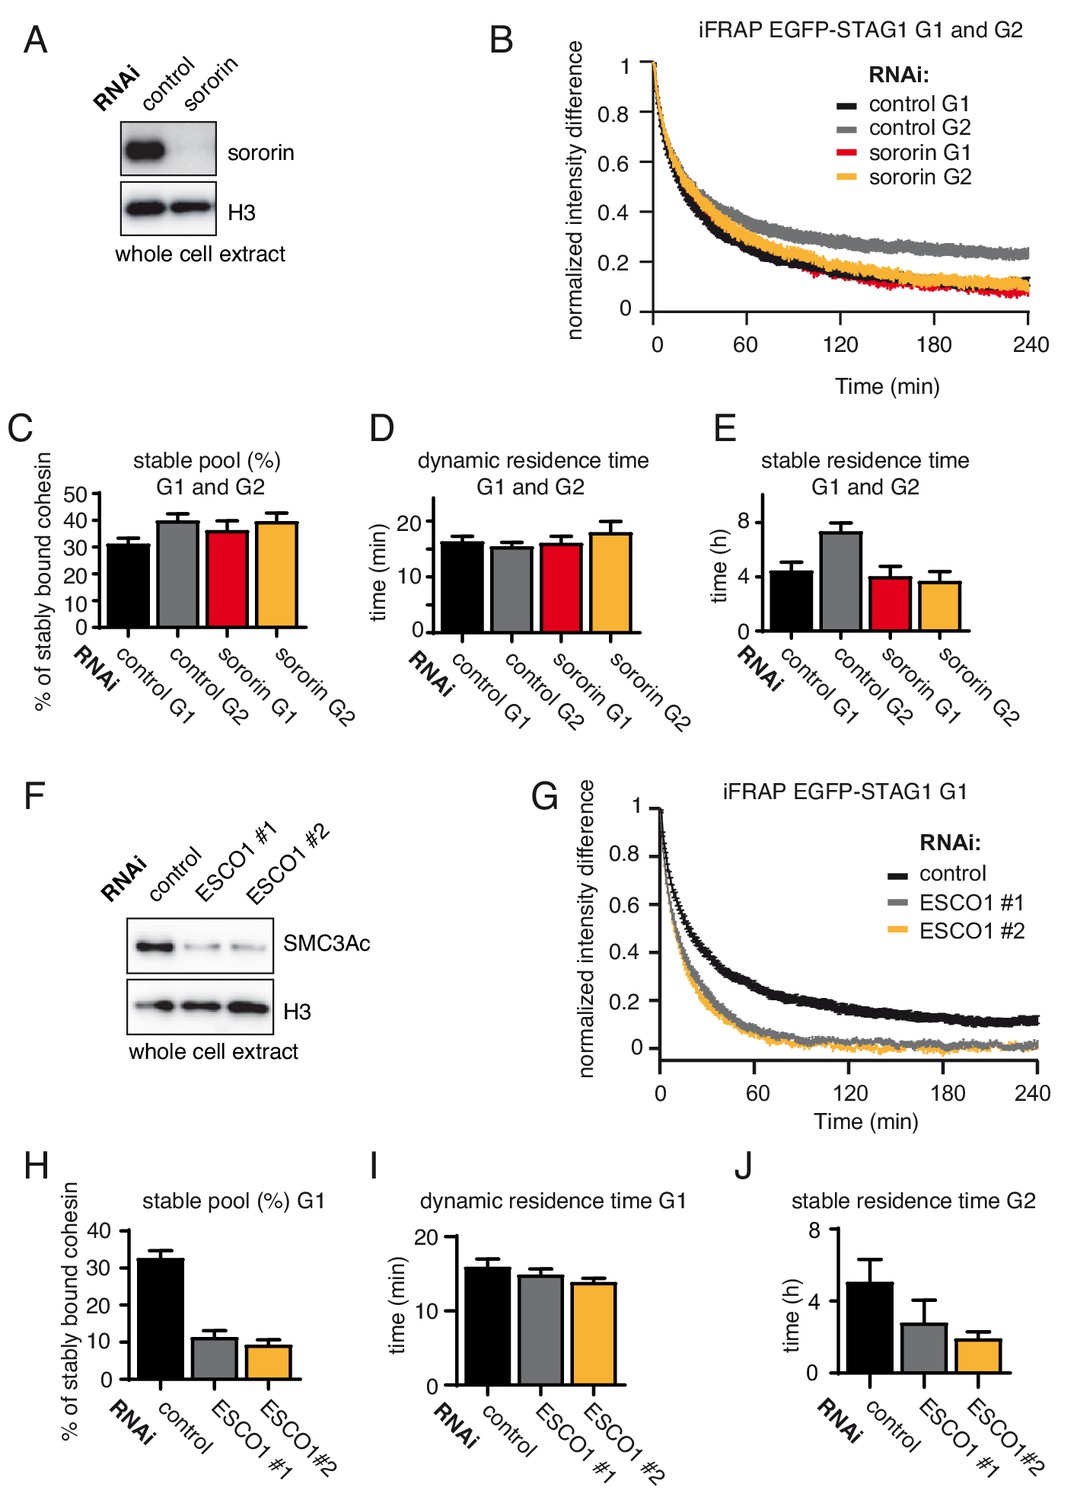
The long chromatin residence time of cohesinSTAG1 in G1 depends on ESCO1.
(A) Immunoblot analysis of whole cell extracts from control- and sororin-depleted HeLa cells. Immunoblotting was performed using the indicated antibodies. Histone H3 was used as a loading control. (B) Graph depicting the mean normalized difference in EGFP-STAG1 fluorescence intensity between the bleached and unbleached regions following iFRAP in cells synchronized in G1 or G2 and depleted for sororin by RNAi. Error bars denote s.e.m., n = 10 cells per condition. (C) Quantification of the fraction of nuclear STAG1-EGFP that was stably chromatin bound in G1 or G2 cells depleted for sororin by RNAi. (D) Quantification of the dynamically chromatin bound residence time of STAG1-EGFP in G1 or G2 cells depleted for sororin by RNAi. (E) Quantification of the stably chromatin bound residence time of STAG1-EGFP in G1 or G2 cells depleted for sororin by RNAi. (F) Immunoblot analysis of whole cell extracts from control- and ESCO1-depleted HeLa cells synchronized in G1. Two different ESCO1-specific siRNA oligos were used. Immunoblotting was performed using the indicated antibodies. Histone H3 was used as a loading control. (G) Graph depicting the mean normalized difference in EGFP-STAG1 fluorescence intensity between the bleached and unbleached regions following iFRAP in cells depleted of ESCO1 protein by two different siRNAs. Error bars denote s.e.m., n = 10 cells per condition. (H) Quantification of the fraction of nuclear STAG1-EGFP that was stably chromatin bound in cells depleted for ESCO1 by RNAi. (I) Quantification of the dynamically chromatin bound residence time of EGFP-STAG1 in cells depleted for ESCO1 protein by RNAi. (J) Quantification of the stably chromatin bound residence time of EGFP-STAG1 in cells depleted for ESCO1 protein by RNAi.
-
Figure 3—figure supplement 1—source data 1
The Microsoft Excel file lists iFRAP measurements used to generate data in Figure 3—figure supplement 1B-E.
- https://cdn.elifesciences.org/articles/52091/elife-52091-fig3-figsupp1-data1-v2.xlsx
-
Figure 3—figure supplement 1—source data 2
The Microsoft Excel file lists iFRAP measurements used to generate data in Figure 3—figure supplement 1G-J.
- https://cdn.elifesciences.org/articles/52091/elife-52091-fig3-figsupp1-data2-v2.xlsx
Figure 3—figure supplement 2
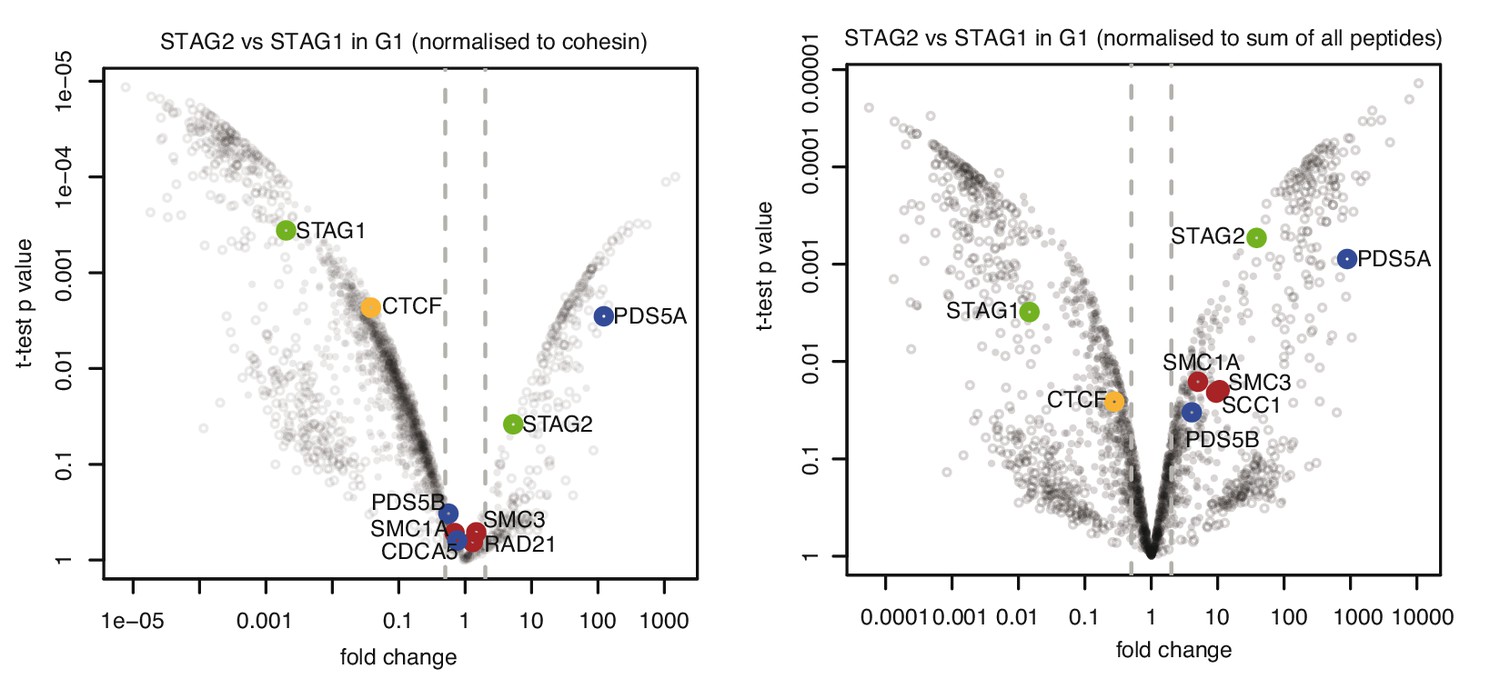
CTCF is enriched in cohesinSTAG1 immunoprecipitation Volcano plots of label‐free qMS data, representing protein abundance in STAG2 immunoprecipitates relative to protein abundance in STAG1 immunoprecipitates.
Area to the left of the grey dashed line denotes proteins significantly over‐represented in STAG1 immunoprecipitates relative to STAG2 immunoprecipitates; vice versa is shown on the right. Left panel shows normalization relative to cohesin peptides and right panel shows normalization relative to the sum of all peptides.
Figure 3—figure supplement 3
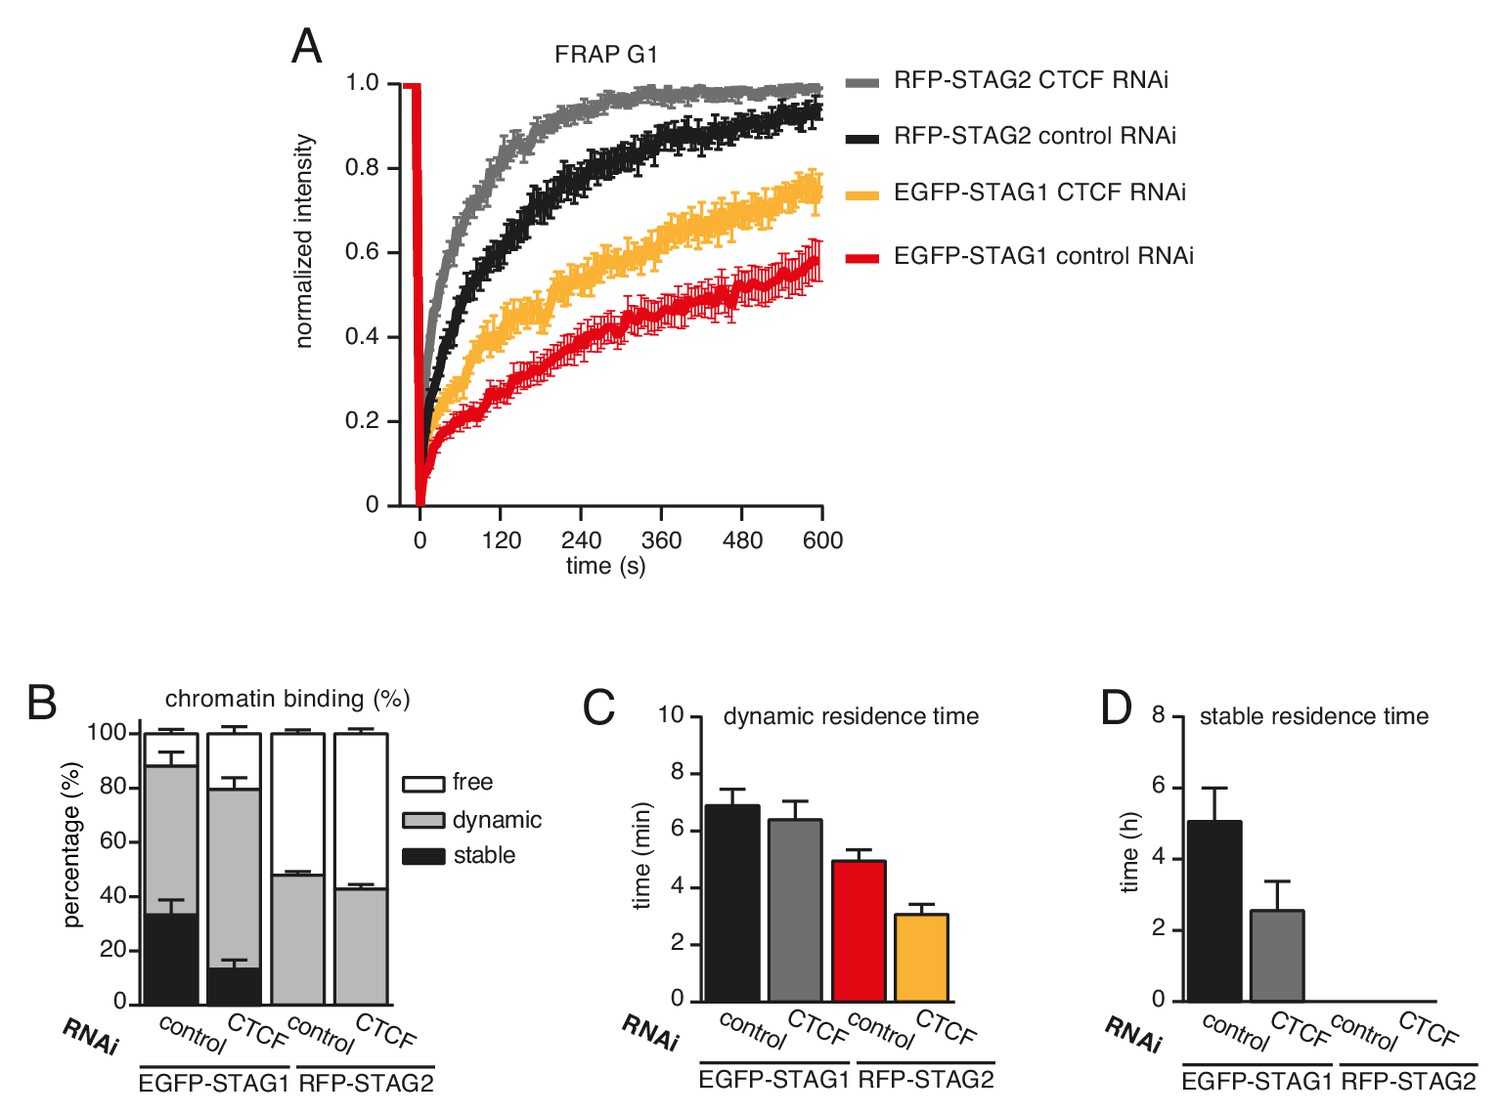
CTCF prolongs the residence time of cohesin on chromatin.
(A) Graph depicting the mean normalized RFP-STAG2 and EGFP-STAG1 fluorescence intensity after photobleaching in a clonal cell line that expressed both proteins tagged homozygously at their endogenous loci. Control- and CTCF-depleted cells were synchronized in G1. Error bars denote s.e.m., n = 17 cells per condition. (B) Quantification of the fraction of nuclear RFP-STAG2 and EGFP-STAG1 that was stably chromatin bound in cells synchronized in G1 and depleted of CTCF by RNAi. (C) Quantification of the residence time of dynamically chromatin bound RFP-STAG2 and EGFP-STAG1 in cells synchronized in G1 and depleted of CTCF by RNAi. (D) Quantification of the residence time of stably chromatin bound RFP-STAG2 and EGFP-STAG1 in cells synchronized in G1 and depleted of CTCF by RNAi.
-
Figure 3—figure supplement 3—source data 1
The Microsoft Excel file lists FRAP measurements used to generate data in Figure 3—figure supplement 3.
- https://cdn.elifesciences.org/articles/52091/elife-52091-fig3-figsupp3-data1-v2.xlsx
Figure 4

ChIP-seq analysis of the genomic distribution of STAG1, STAG2 and SMC3ac.
(A) Coverage-corrected Hi-C contact matrix of the 95.2–95.7 Mb region of HeLa chromosome 1. ChIP-seq signals for EGFP-STAG1, STAG2-EGFP, SMC3, SMC3ac and CTCF are shown below the Hi-C contact matrix. STAG1 and STAG2 immunoprecipitation was performed using anti-GFP antibodies. Note that the SMC3ac signal is decreased following ESCO1 depletion, confirming the specificity of the anti-SMC3ac antibody. (B) Venn diagram illustrating the genome-wide co-localization between STAG1 and STAG2 ChIP-seq signals. STAG1/2 immunoprecipitations from EGFP-STAG1 and STAG2-EGFP cells were performed using anti-GFP antibodies. Average read density plots for EGFP-STAG1 and STAG2-EGFP at SMC3ac and SMC3 sites is shown on the right. (C) Pie charts showing the distribution of STAG1-only (left), STAG2-only (middle) and STAG1/2 common ChIP-seq sites (right) in G1 relative to TSS and active enhancers. (D) Venn diagrams showing the distribution of STAG1-only (left), STAG2-only (middle) and STAG1/2 common ChIP-seq sites (right) relative to CTCF ChIP-seq sites. (E) Venn diagrams illustrating the genome-wide overlap between SMC3ac and STAG1/2 common sites, SMC3 and CTCF ChIP-seq sites respectively. (F) Venn diagrams showing the distribution of STAG1-only (left), STAG2-only (middle) and STAG1/2 common ChIP-seq sites (right) relative to SMC3ac ChIP-seq sites. (G) Venn diagrams illustrating the genome-wide overlap between the loop anchors determined using the Hi-C map shown in (A) and SMC3 (left panel) and SMC3Ac (right panel) ChIP-seq binding sites.
Figure 5 with 2 supplements
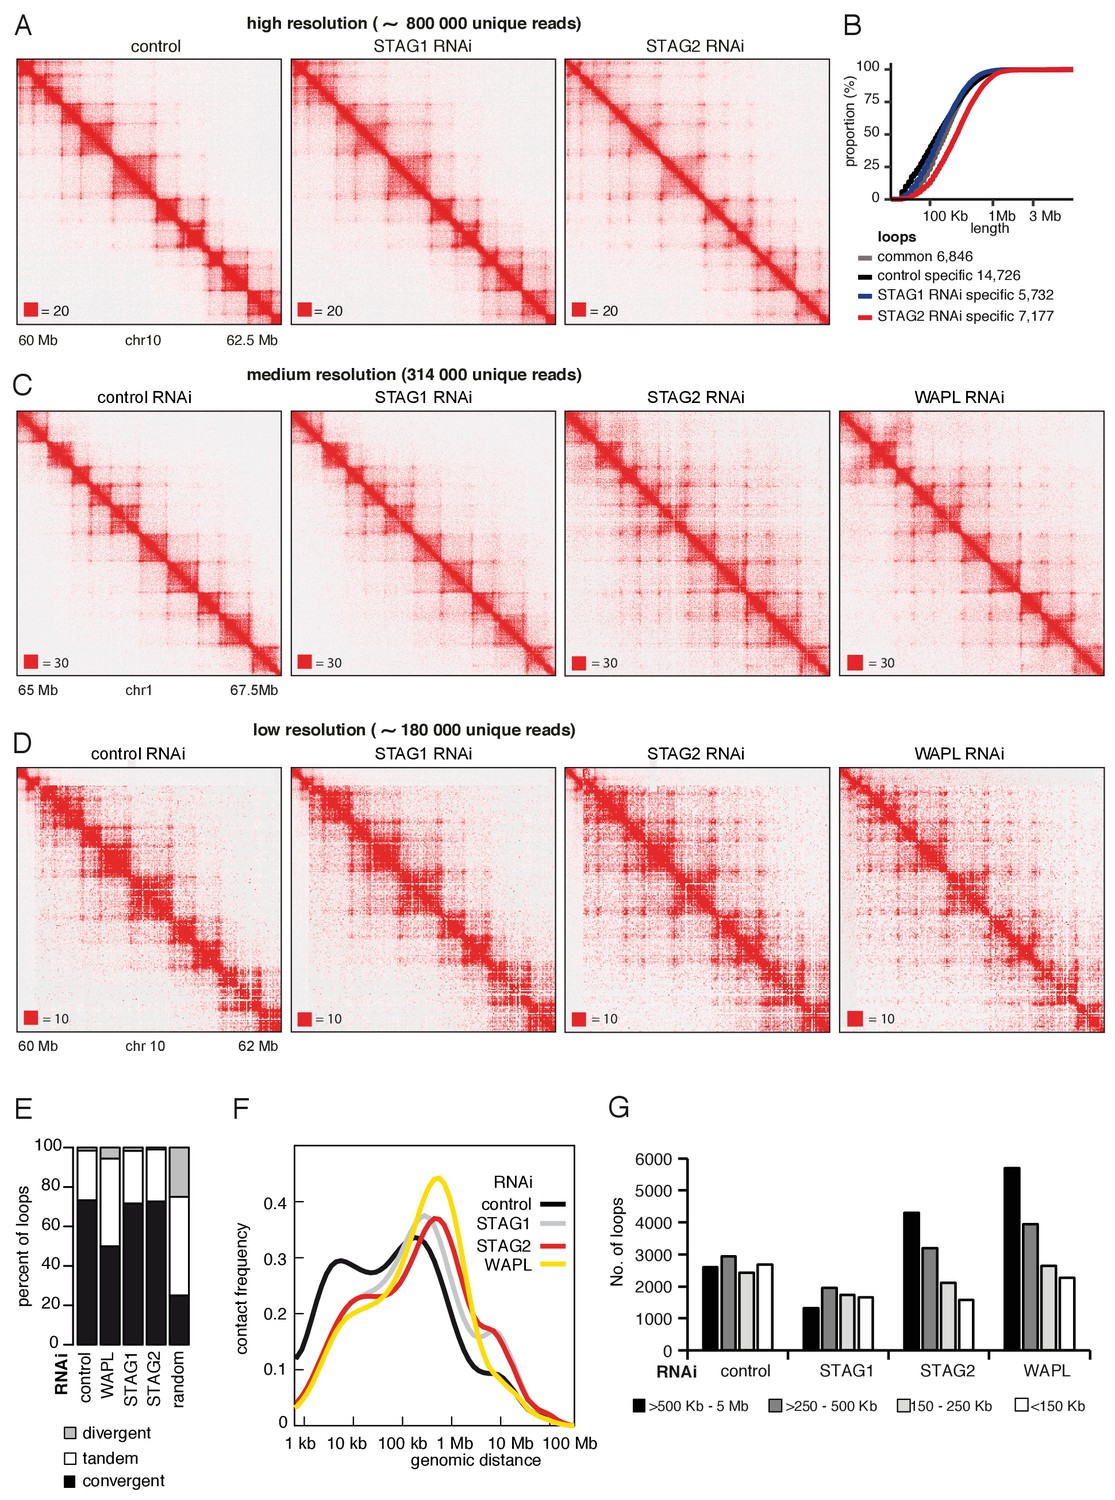
CohesinSTAG1 generates long chromatin interactions.
(A) Coverage-corrected Hi-C matrices of chromosome 10 (60–62.5 Mb) from control, STAG1 and STAG2-depleted cells (libraries with numbers 1,2 and 3 in Supplementary file 1). Matrices were plotted using Juicebox. (B) Cumulative distribution of loop length determined by hiccups in control, STAG1 and STAG2-depleted cells. (C) Coverage-corrected Hi-C contact matrices of chromosome 1 (65–67.5 Mb), in control-, STAG1-, STAG2- and WAPL-depleted HeLa cells (libraries with numbers 1, 2, 3 and 4 in Supplementary file 1 were down-sampled to 314 million reads). Matrices were plotted using Juicebox. (D) Coverage-corrected Hi-C contact matrices of chromosome 10 (60–62 Mb), in control-, STAG1-, STAG2- and WAPL-depleted HeLa cells (libraries with numbers 7, 10, 11 in Supplementary file 1; library from the WAPL RNAi was previously published in Wutz et al., 2017). (E) The proportion of convergent, tandem and divergent CTCF binding orientation for loops with both anchors overlapping SMC3 and CTCF ChIP-seq peaks as well as unambiguous CTCF binding directions, for loops identified in control-depleted cells in G1-phase (ctrl, 2799 loops), in WAPL depleted but not in control-depleted cells in G1-phase (WAPL, 2295 loops), in STAG1 depleted but not in control-depleted cells in G1-phase (STAG1, 367 loops) and STAG2 depleted but not in control-depleted cells in G1-phase (STAG2, 1471 loops). The theoretically expected random proportions assuming no directionality bias are shown as comparison (7,10 and 11 in Supplementary file 1; library for the WAPL RNAi was previously published in Wutz et al., 2017). (F) Intra-chromosomal contact frequency distribution as a function of genomic distance using logarithmically increasing genomic distance bins for control-, STAG1-, STAG2- and WAPL-depleted HeLa cells. (G) Distribution of loop length in control-, STAG1-, STAG2- and WAPL-depleted HeLa cells. Loops identified by hiccups- (Hi-C libraries 7,10 and 11 in Supplementary file 1; library for the WAPL RNAi was previously published in Wutz et al., 2017).
Figure 5—figure supplement 1
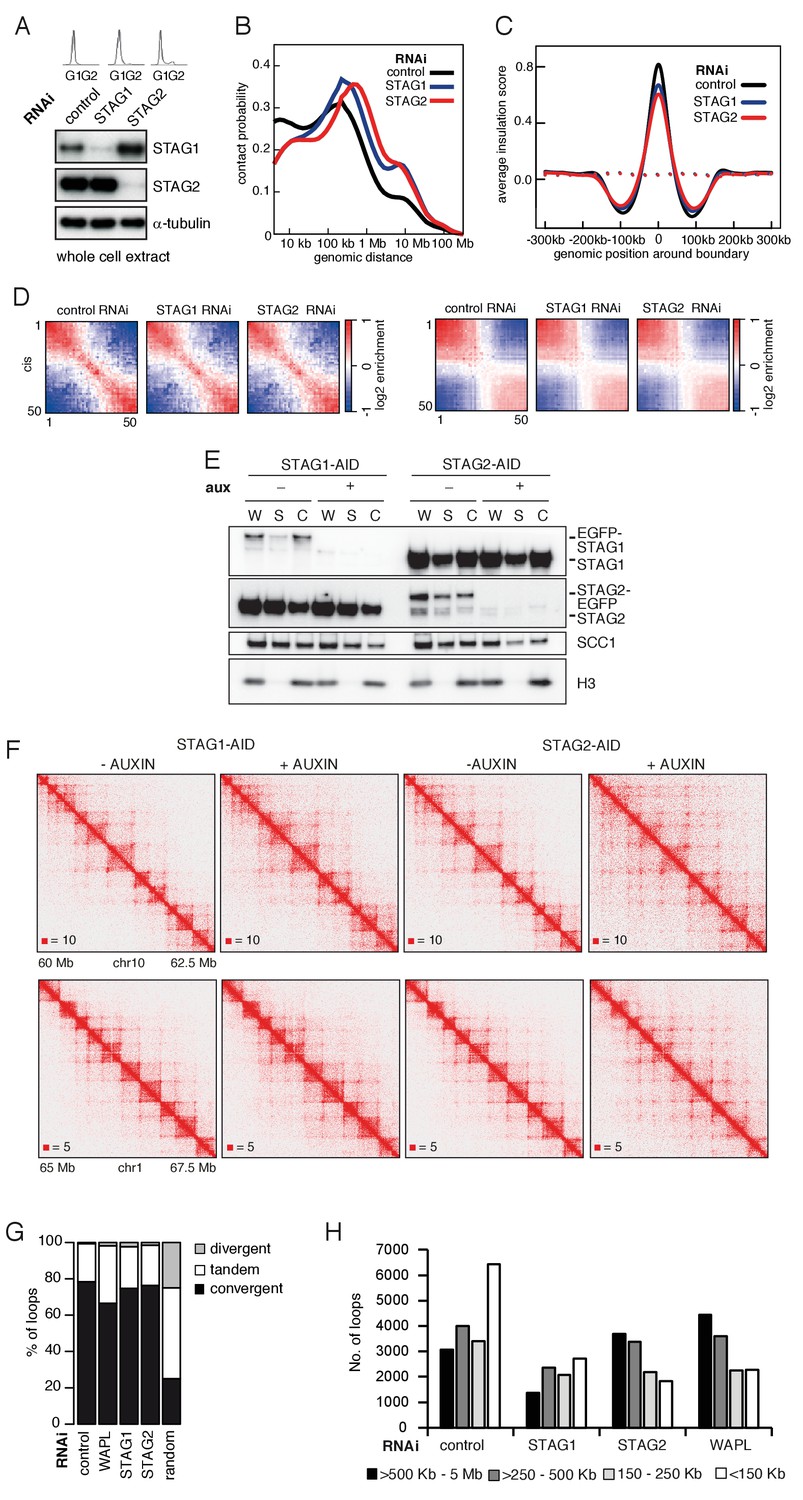
CohesinSTAG1 generates long chromatin interactions.
(A) Flow cytometry and whole cell extract immunoblot analysis of cells synchronized in G1 and depleted of the proteins indicated. α-tubulin was used as a loading control. (B) Intra-chromosomal contact frequency distribution as a function of genomic distance using logarithmically increasing genomic distance bins, for control-, STAG1- and STAG2-depleted HeLa cells. (C) Average insulation score around TAD boundaries in control-, STAG1- and STAG2-depleted HeLa cells synchronized in G1. Dashed lines indicate the average insulation score between random positions. (D) Long range (>2 Mb) intra-chromosomal (cis) and inter-chromosomal (trans) contact enrichment between bins with varying compartment signal strength from most B-like (1) to most A-like (50). (E) Immunoblot analysis of STAG1- and STAG2-AID cell lines. Immunoblotting of whole cell (W), soluble (S) and chromatin (C) extracts was performed using the STAG1, STAG2 and SCC1 antibodies. Histone H3 was used as a loading control. (F) Coverage-corrected Hi-C matrices of chromosome 10 (60–62.5 Mb) and chromosome 1 (65–67.5 Mb) from STAG1- and STAG2-AID cell lines with and without auxin treatment Matrices were plotted using Juicebox. (G) The proportion of convergent, tandem and divergent CTCF binding orientation for loops with both anchors overlapping SMC3 and CTCF ChIP-seq peaks as well as unambiguous CTCF binding directions, for loops identified in control-depleted cells in G1-phase (ctrl, 4933 loops), in WAPL depleted but not in control-depleted cells in G1-phase (WAPL, 1898 loops), in STAG1 depleted but not in control-depleted cells in G1-phase (STAG1, 428 loops) and STAG2 depleted but not in control-depleted cells in G1-phase (STAG2, 1229 loops) (Hi-C maps 1,2,3 and 4 in Supplementary file 1 were down-sampled to 314 million reads). The theoretically expected random proportions assuming no directionality bias are shown as comparison. (H) Distribution of loop length in control-, STAG1-, STAG2- and WAPL-depleted HeLa cells (1,2,3 and 4 in Supplementary file 1 were down-sampled to 314 million reads). Loops were identified by hiccups.
Figure 5—figure supplement 2
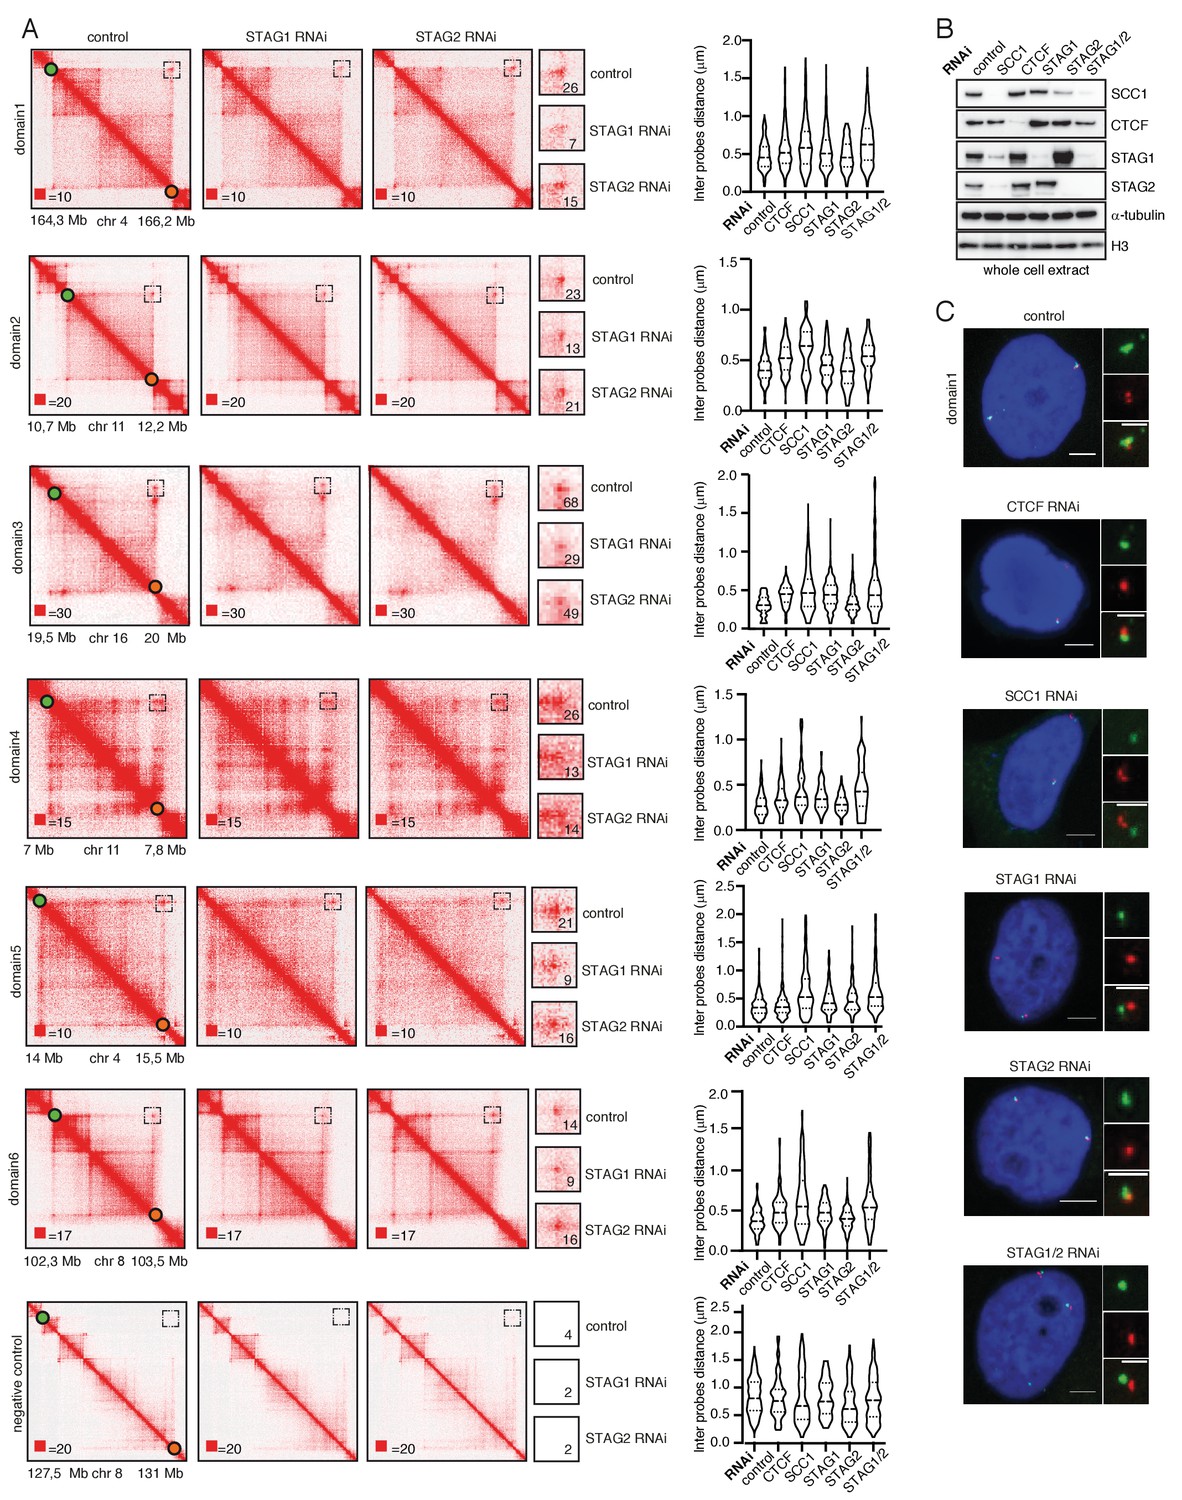
STAG1 depletion reduces loop signal more than STAG2 depletion.
(A) Coverage-corrected Hi-C contact matrices of loci used in FISH analysis from control-, STAG1- and STAG2-depleted HeLa cells are shown on the left. The matrices were plotted using Juicebox. Boxed regions (also shown at higher magnification in the middle panels) represent the loop loci used in the FISH analysis. The numbers denote the most densely populated square at highest resolution within the range of the loop coordinates targeted by FISH probes. The right panel shows violin plots of the FISH 3D distance measurements between the loci boxed on the Hi-C matrices. The dashed lines show the median and interquartile range of between 100 and 500 cells for each condition. (B) Immunoblot analysis of whole cell extracts from HeLa cells depleted for proteins as indicated using RNAi. Immunoblotting was performed using the indicated antibodies. α-tubulin and histone H3 were used as loading controls. (C) Representative FISH images from HeLa cells depleted of the indicated proteins. Scale bar, 10 µm.
Figure 6
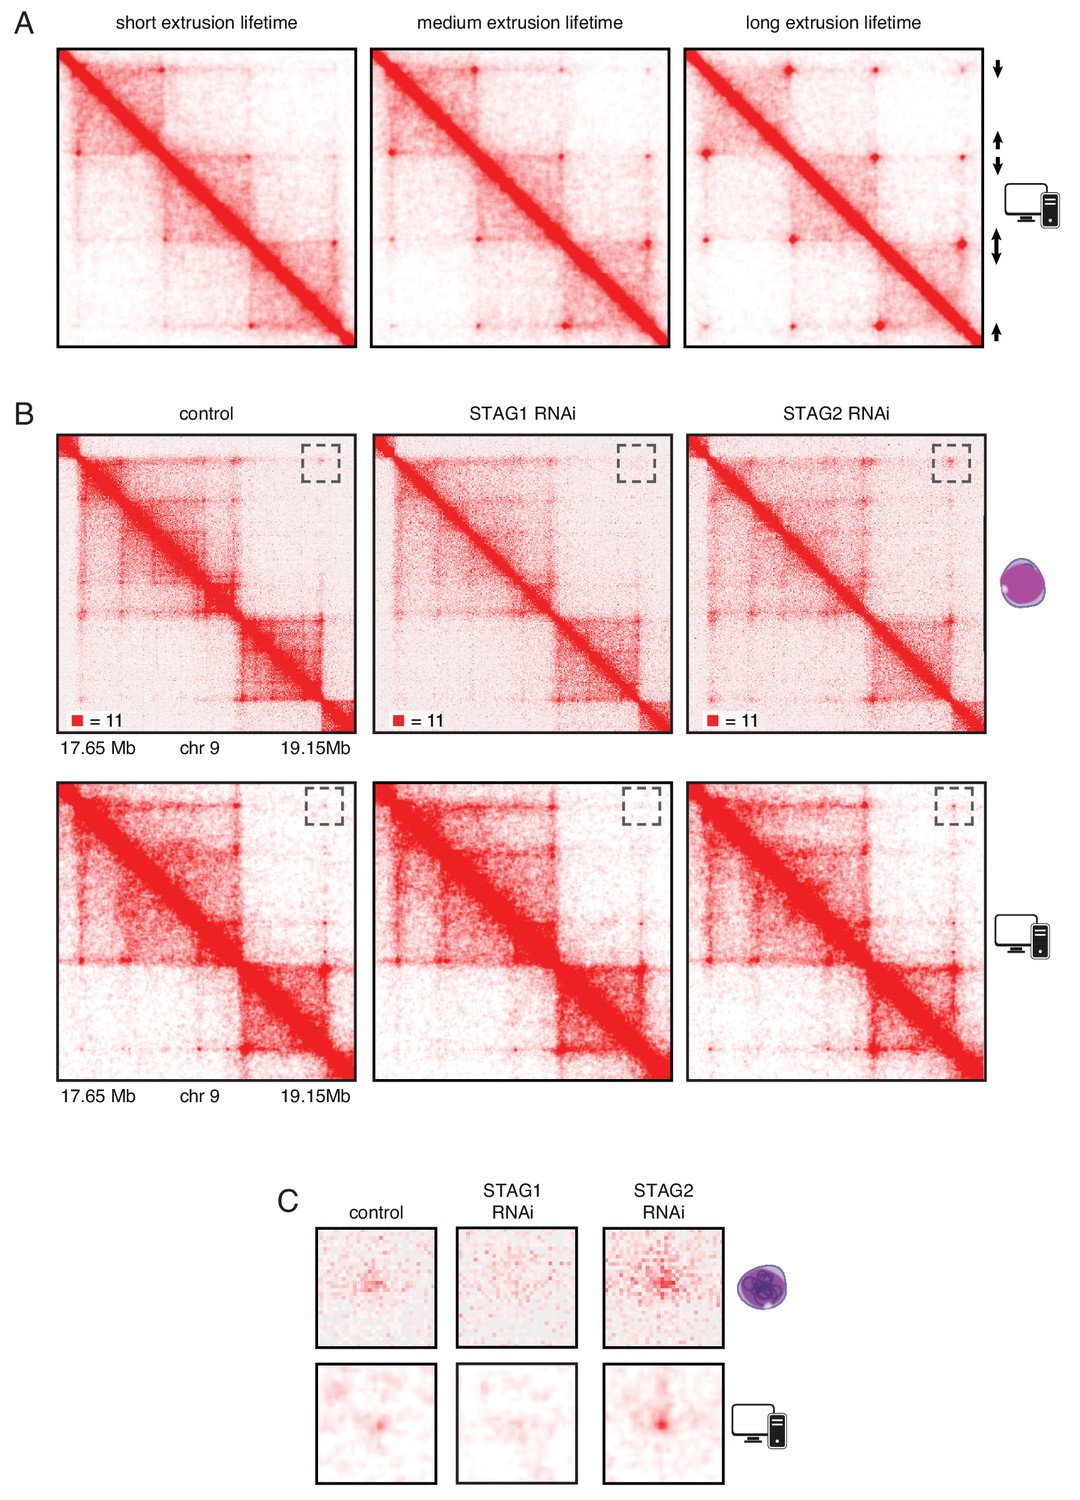
In silico modeling confirms that stably bound cohesin forms longer loops.
(A) Simplified simulation with three pairs of convergent CTCF sites to demonstrate the relationship between extrusion lifetime and loop size. Loop strength positively correlates with increased extrusion lifetime. (B) Coverage-corrected Hi-C matrices of chromosome 9 (17.65–19.15 Mb) from control, STAG1 and STAG2-depleted cells (upper panels). Hi-C simulations of the same genomic region were performed with short, medium and long extrusion complex lifetimes. Longer extrusion lifetimes generated Hi-C matrices that resembled those from STAG2-depleted cells. (C) Zoom in of the loops that are boxed in panel B.
Figure 7 with 1 supplement

The function of long chromatin loops by cohesinSTAG1 depends on CTCF and ESCO1.
(A) Coverage-corrected Hi-C contact matrices of chromosome 3 (97.7–99 Mb) in control-, CTCF- and ESCO1-depleted HeLa cells. Matrices were plotted using Juicebox. (B) Coverage-corrected Hi-C contact matrices of chromosome 2 (0–200 Mb) in control-, CTCF- and ESCO1- depleted HeLa cells. Matrices were plotted using Juicebox. (C) Total contact counts around loops longer than 150 kb in control-, CTCF- and ESCO1-depleted HeLa cells are shown in the lower panel. Loops were identified by hiccups in control cells. The values of the centre peaks are indicated. (D) Number of loops identified by hiccups in the matrices described in (A). (E) Average insulation score around TAD boundaries in control-, ESCO1- and CTCF-depleted cells synchronized in G1. Dashed lines indicate the average insulation score between random positions. (F) Intra-chromosomal contact frequency distribution as a function of genomic distance using logarithmically increasing genomic distance bins for control-, CTCF- and ESCO1-depleted HeLa cells.
Figure 7—figure supplement 1
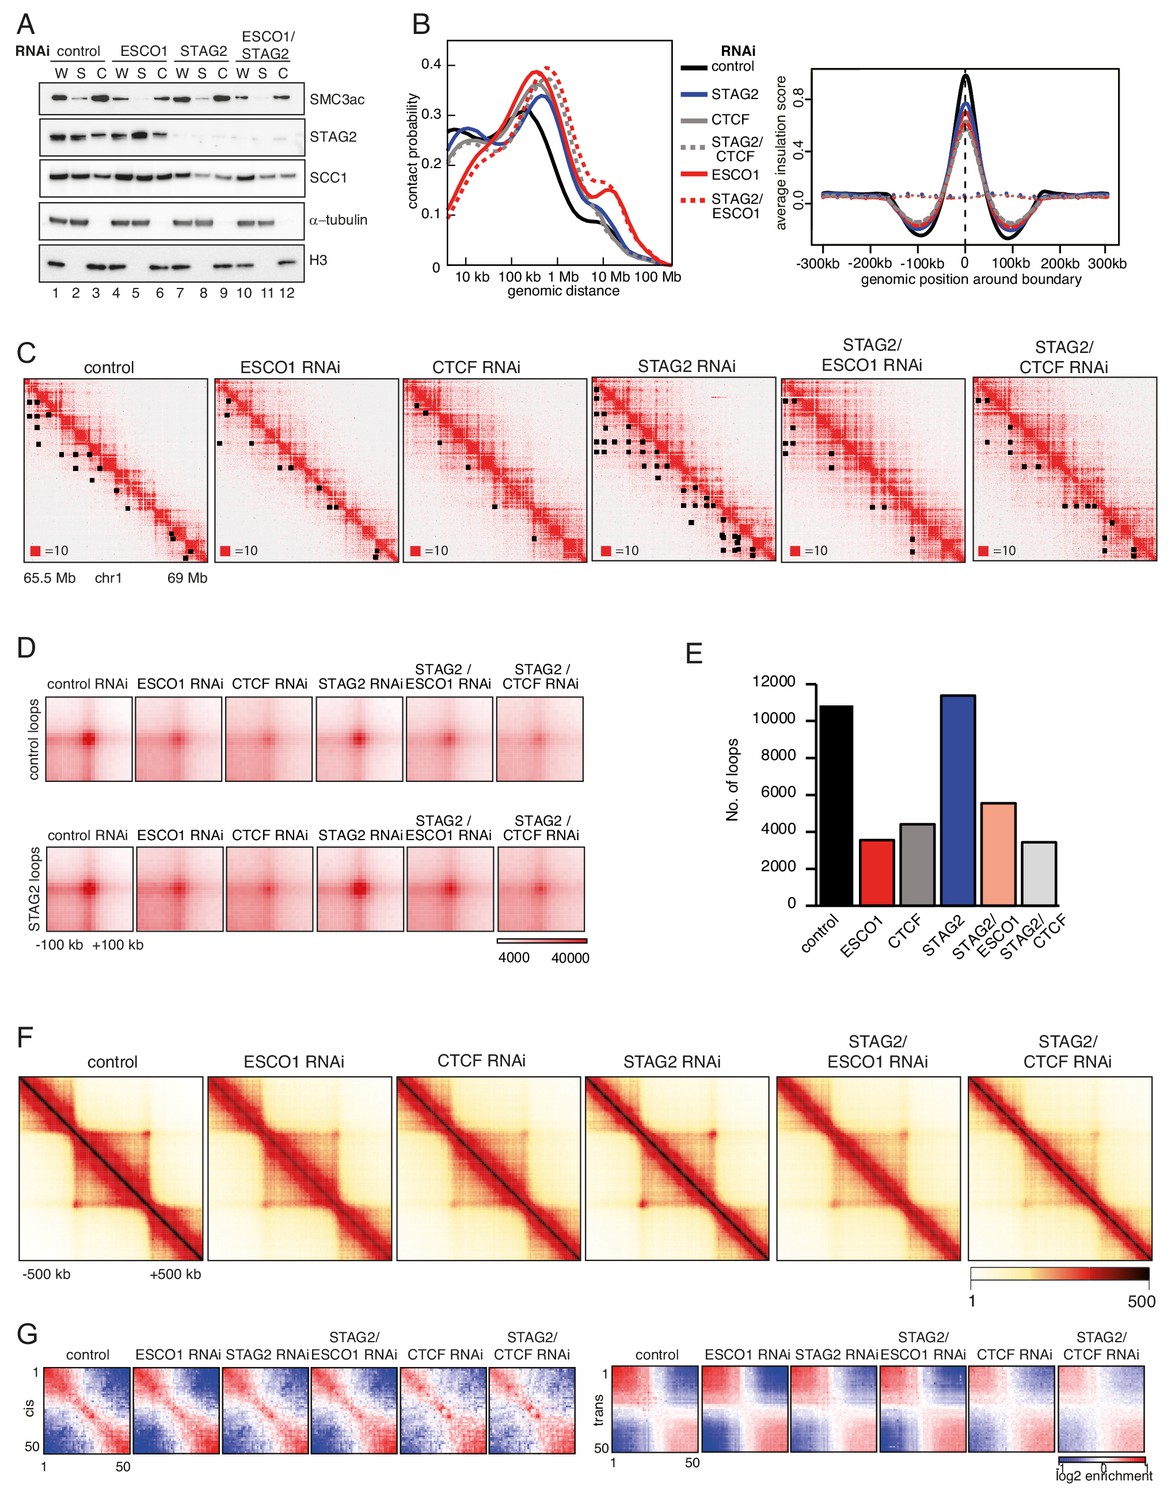
Effect of ESCO1 and CTCF depletion on chromatin organization.
(A) Immunoblot analysis of whole cell (W), cytoplasmic (S) and chromatin (C) extracts from control-, ESCO1-, STAG2- and ESCO1/STAG2-depleted HeLa cells synchronized in G1. Immunoblotting was performed using the indicated antibodies. α-tubulin and histone H3 were used as loading controls. (B) Left panel: intra-chromosomal contact frequency distribution as a function of genomic distance using logarithmically increasing genomic distance bins for control-, STAG2-, STAG2/CTCF-, ESCO1- and STAG2/ESCO1-depleted HeLa cells. Right panel: average insulation score around TAD boundaries. Dashed lines indicate the average insulation score between random positions. (C) Coverage-corrected Hi-C contact matrices of chromosome 1 (65,5–69 Mb), in control-, ESCO1-, CTCF-, STAG2-, STAG2/ESCO1, and STAG2/CTCF-depleted HeLa cells. Loops identified in this region by hiccups are marked by black rectangles. Matrices were plotted using Juicebox. (D) Total contact counts around control-specific loops (>150 kb) and STAG2-specific loops (>150 kb) in control-, ESCO1-, CTCF-, STAG2-, STAG2/ESCO1, and STAG2/CTCF-depleted HeLa cells. Loops were identified by hiccups. (E) Number of loops identified by hiccups in the matrices described in (C). (F) Aggregate TAD analysis for the conditions described in (C). Average coverage-corrected Hi-C contact matrices are shown around 318 × 390–410 kb long TADs identified in the control-depleted cells. (G) Long range (>2 Mb) intra-chromosomal (cis) and inter-chromosomal (trans) contact enrichment between bins with varying compartment signal strength from most B-like (1) to most A-like (50) from HeLa cells depleted for proteins as in (A).
Figure 8
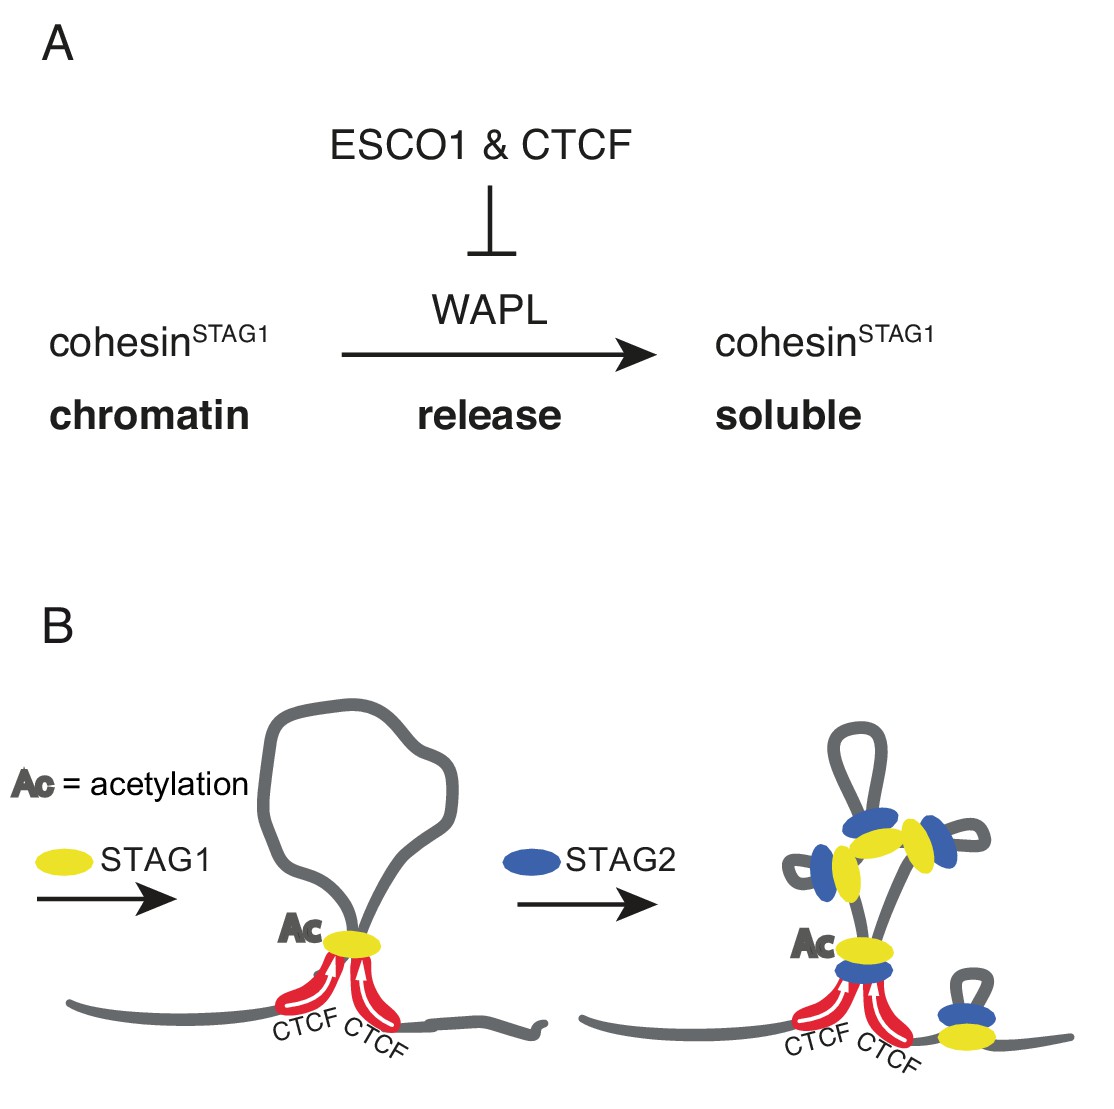
Schematic model.
(A) ESCO1 and CTCF stabilize cohesinSTAG1 by inhibiting WAPL. (B) Schematic model of nested loop extrusion. CohesinSTAG1 makes longer loops; cohesinSTAG2 makes loops in and around cohesinSTAG1 loops.
Tables
Key resources table
| Reagent type (species) or resource | Designation | Source or reference | Identifiers | Additional information |
|---|---|---|---|---|
| Cell line (H. sapiens) | Hela Kyoto BAC recombineering SMC3-LAP | Poser et al., 2008 (doi:10.1038/nmeth.1199) | Figure 2 | |
| Cell line (H. sapiens) | Hela Kyoto CRISPR EGFP-STAG1 cl H4 | this study | Figure 2—figure supplement 1 | |
| Cell line (H. sapiens) | Hela Kyoto CRISPR STAG1-EGFP H8 | Cai et al., 2018 | Figure 2—figure supplement 1 | |
| Cell line (H. sapiens) | Hela Kyoto CRISPR STAG2-EGFP F2 | Cai et al., 2018 | Figure 2—figure supplement 1 | |
| Cell line (H. sapiens) | Hela Kyoto CRISPR EGFP-STAG1 FLAG-RFP-STAG2 clD10 | this study | Figure 2—figure supplement 1 | |
| Cell line (H. sapiens) | Hela Kyoto CRISPR STAG1-AID | this study | Figure 5—figure supplement 1 | |
| Cell line (H. sapiens) | Hela Kyoto CRISPR STAG2-AID | this study | Figure 5—figure supplement 1 | |
| Cell line (M. musculus) | iMEFs BAC recombineering SMC1-LAP | Poser et al., 2008 (doi:10.1038/nmeth.1199) | Figure 2—figure supplement 3 | |
| Cell line (M. musculus) | iMEFs BAC recombineering SCC1-LAP | Poser et al., 2008 (doi:10.1038/nmeth.1199) | Figure 2—figure supplement 3 | |
| Antibody | Anti-CTCF | Peters laboratory | Antibody ID: A992 | Western blotting |
| Antibody | Anti-CTCF | Merck Milipore | Cat# 07–729, RRID:AB_441965 | ChIP |
| Antibody | Anti-ESCO1 | Peters laboratory | Antibody ID:782M | Western blotting |
| Antibody | Anti-ESCO2 | gift from J. de Winter | Western blotting | |
| Antibody | Anti-GFP | Roche | Cat# 11814460001, RRID:AB_390913 | Western blotting |
| Antibody | Anti-GFP | Abcam | Cat# ab290, RRID:AB_303395 | ChIP |
| Antibody | phospho-histone Histone H3 (Ser10) | Cell Signaling | Cat #:9701, RRID:AB_331535 | Western blotting |
| Antibody | PCNA | Santa Cruz | Cat #:PC10, RRID:AB_628110 | Western blotting |
| Antibody | Anti-SCC1 | EMD Milipore Corporation | Cat #:05–908 RRID:AB_417383 | Western blotting |
| Antibody | Anti-SMC1 | Bethyl Laboratories | Cat #:A300-055A, RRID:AB_2192467 | Western blotting |
| Antibody | Anti-SMC3 | Peters laboratory | Antibody ID:A941 | ChIP, Western blotting |
| Antibody | Anti-Smc3 acetyl | gift from K. Shirahige | ChIP, Western blotting | |
| Antibody | Anti-sororin | Peters laboratory | Antibody ID:A953 | Western blotting |
| Antibody | Anti-STAG1 | Peters laboratory | Antibody ID:A823 | ChIP, Western blotting |
| Antibody | Anti-STAG2 | Bethyl | Cat #:A300-158A, RRID:AB_185514 | Western blotting |
| Antibody | Anti-tubulin | Sigma | Cat #:T-5168, RRID:AB_477579 | Western blotting |
| Antibody | Anti-WAPL | Peters laboratory | Antibody ID:A1017 | Western blotting |
Additional files
-
Supplementary file 1
Summary statistics for Hi-C data sets generated in this study.
A. Number of the library. B. Condition used to generate the library. C. Number of the biological replicate. D. Restriction enzyme used to generate the Hi-C library. E. Raw number of read pairs from paired-end sequencing. F. Unique valid mapped read pairs from HiCUP v0.7.1. G. Number of unique valid read pairs that are inter-chromosomal. H. Percentage of unique valid read pairs that are inter-chromosomal. I. Log2 contact enrichment of A-A and B-B contacts for long-range (>10 Mb) intra-chromosomal contacts. J. Log2 contact enrichment of A-A and B-B contacts for inter-chromosomal contacts, K. Percentage of genome covered by TADs called by HOMER v4.7. L. Number of TADs called by HOMER v4.7. M. Number of loops called by the hiccups algorithm of Juicer tools v0.7.5. N. Average standardized insulation score at the corresponding G1 control TAD boundaries (hires or r1, r2 average) called by HOMER v4.7 in the respective conditions. O. Average standardized insulation score at the TAD boundaries called by HOMER v4.7 in the respective conditions. P. Number of loops called by the hiccups algorithm of Juicer tools v0.7.5; please note that the number of loops that can be called depends on the number of unique read pairs. This needs to be taken into consideration when comparing corner peaks between different experiments.
- https://cdn.elifesciences.org/articles/52091/elife-52091-supp1-v2.xlsx
-
Supplementary file 2
Number of cells analyzed by FISH and statistical significance.
Number of cells analyzed by FISH in Figure 5—figure supplement 2 for control,CTCF, SCC1, STAG1, STAG2 and double STAG1/STAG2 RNAi. Statistical significance is measured by t-test relative to the control.
- https://cdn.elifesciences.org/articles/52091/elife-52091-supp2-v2.xlsx
-
Transparent reporting form
- https://cdn.elifesciences.org/articles/52091/elife-52091-transrepform-v2.docx
Download links
A two-part list of links to download the article, or parts of the article, in various formats.
Downloads (link to download the article as PDF)
Open citations (links to open the citations from this article in various online reference manager services)
Cite this article (links to download the citations from this article in formats compatible with various reference manager tools)
ESCO1 and CTCF enable formation of long chromatin loops by protecting cohesinSTAG1 from WAPL
eLife 9:e52091.
https://doi.org/10.7554/eLife.52091


