Acute cerebellar knockdown of Sgce reproduces salient features of myoclonus-dystonia (DYT11) in mice
- Albert Einstein College of Medicine, United States
Figures
Figure 1
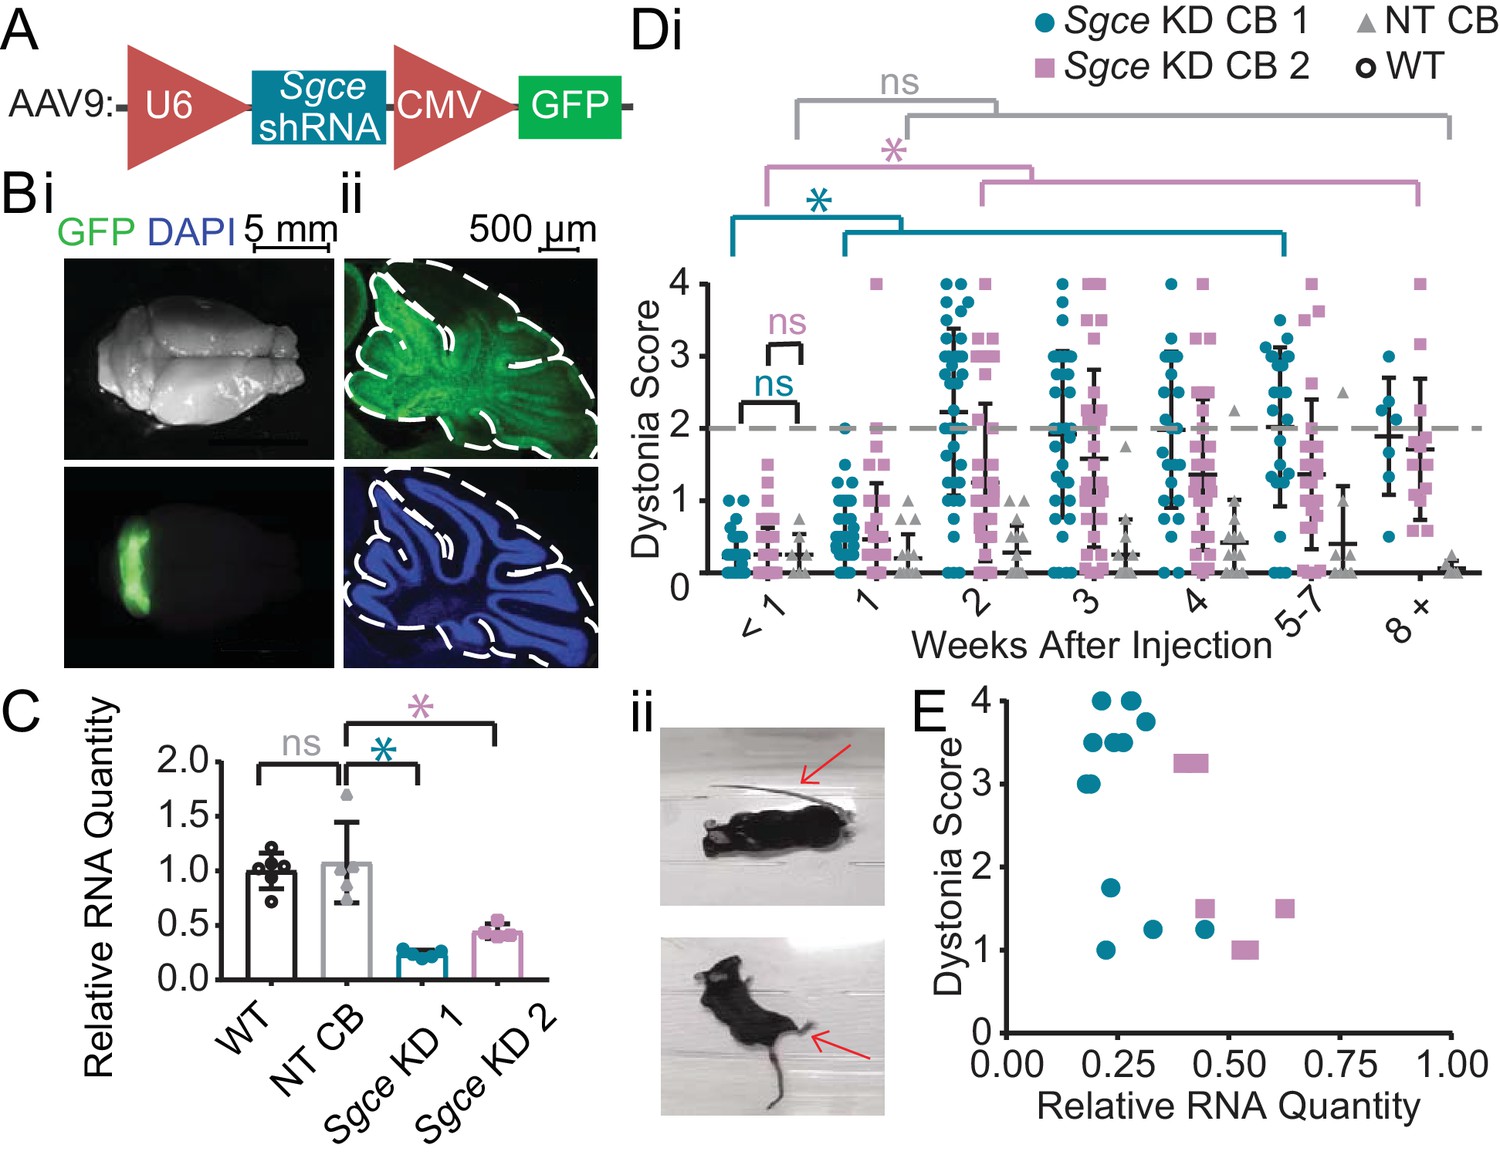
shRNA-mediated knockdown of Sgce in the cerebellum causes dystonia.
(A) Schematic of AAV-shSGCE-GFP construct. (B) Images of the whole brain (i) and sagittal cerebellar section (ii) from an Sgce KD CB mouse. (C) Quantification of qRT-PCR confirms that Sgce RNA is reduced in vivo. (Mann-Whitney Test, WT vs. NT CB: p=0.7922; NT CB vs. Sgce KD CB 1: p=0.0079; NT CB vs. Sgce KD CB 2: p=0.0159; NWT = 6, NNT CB = 5, NSgce KD CB 1 = 5, NSgce KD CB 2 = 4). (D,i) Injection of Sgce KD 1 and 2 into the cerebellum produced dystonia, while injection of NT did not. (Sgce KD CB 1: N = 39; Sgce KD CB 2: N = 40; NT CB: N = 16). Dystonia was measured on a previously published dystonia scale by four scorers blind to the condition of the animal. A score greater than or equal to two indicates dystonia. The dystonia scores for Sgce KD CB 1 and Sgce KD CB 2 mice for time points of 2 weeks or more after injection were significantly different from the dystonia scores of the same animals at <1 week (Wilcoxon matched-pairs signed rank test, p<0.01). The dystonia scores of Sgce KD CB 1 and Sgce KD CB 2 mice at <1 week after injection were not significantly different from NT CB mice at the same time point (t-test, Holm-Sidak method, p=0.81 and p=0.97, respectively). (ii) Example dystonic postures exhibited by Sgce KD CB mice. (E) Scatter plot of RNA levels normalized to the mean of WT, determined by qRT-PCR, plotted against the Dystonia Score observed in a subset of animals injected with varying concentrations of shRNA (WT: N = 5, NT: N = 5, Sgce KD CB 1: N = 13, Sgce KD CB 2: N = 7).
Figure 2 with 2 supplements
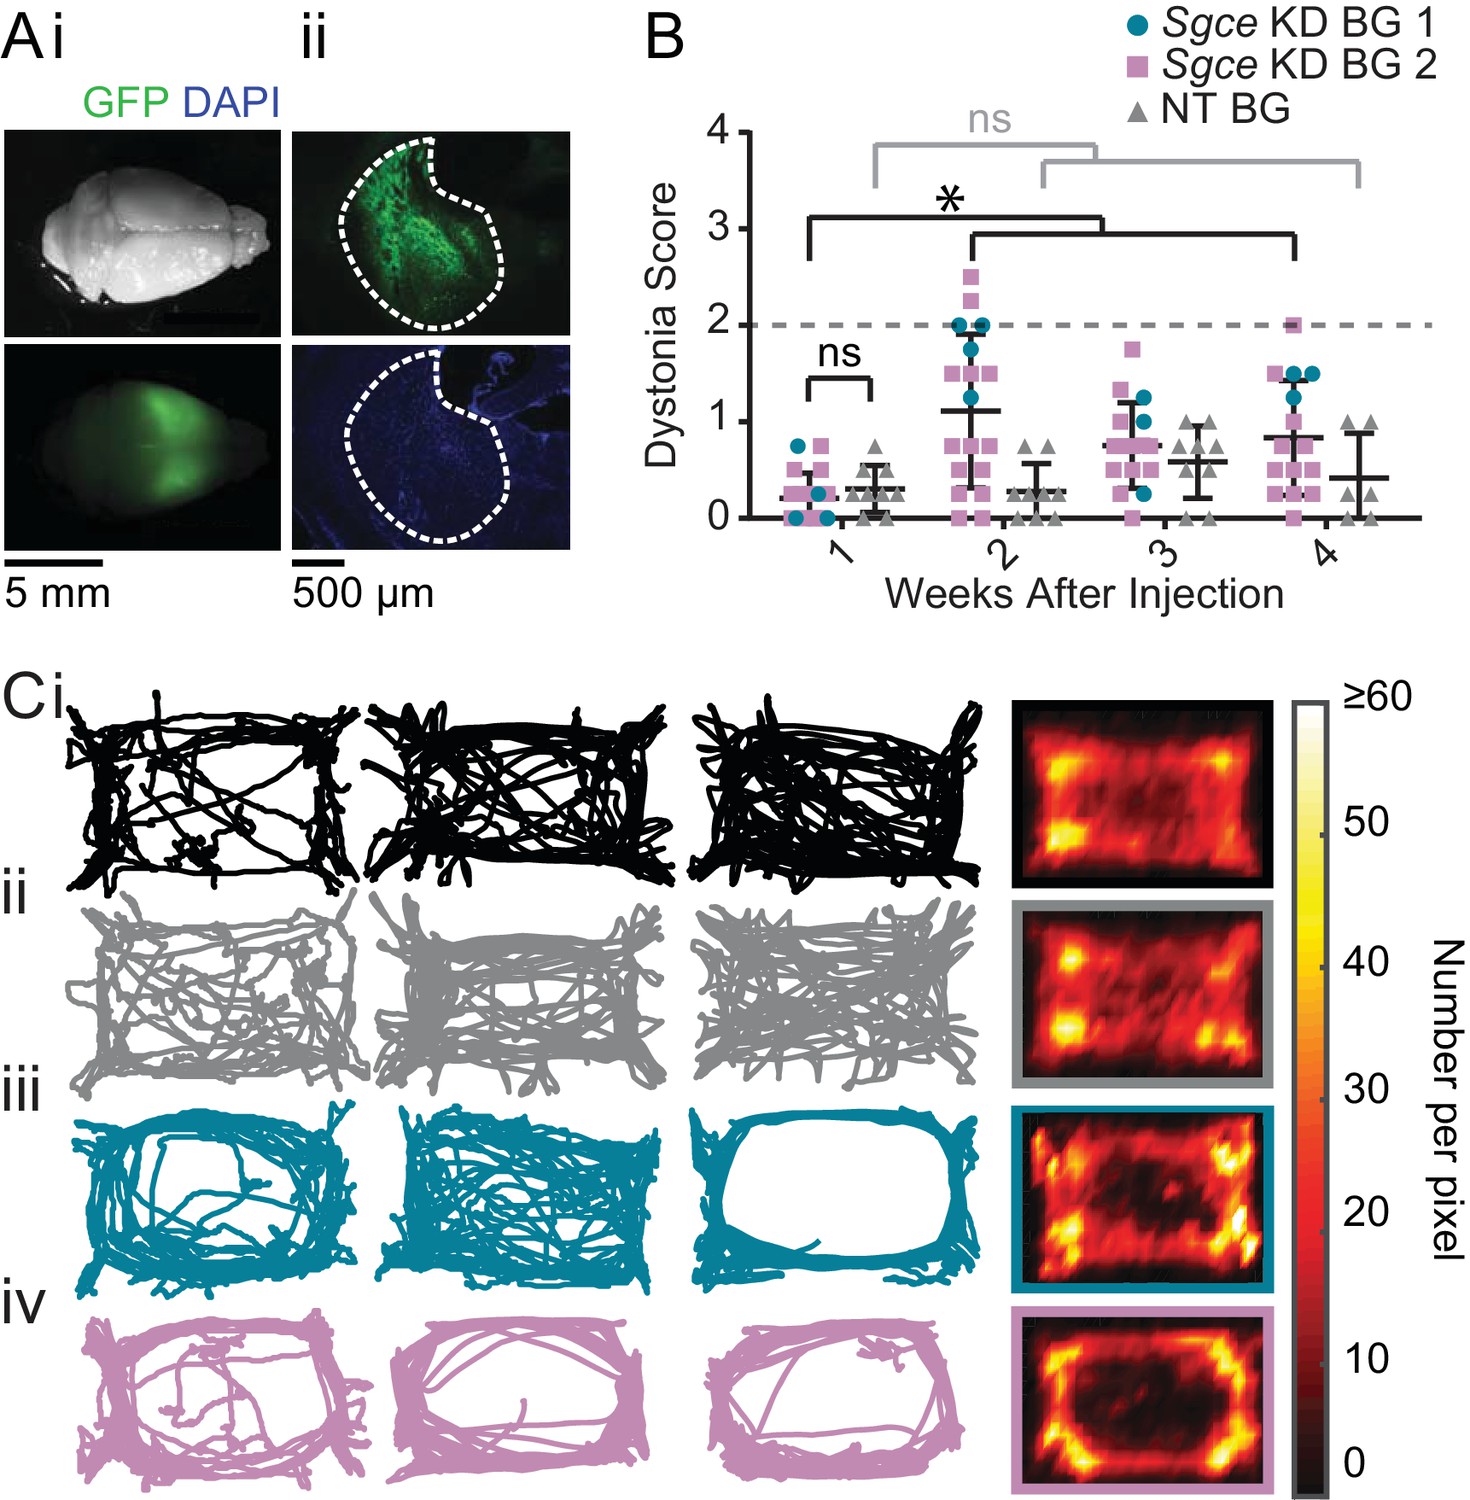
shRNA-mediated knockdown of Sgce in the basal ganglia causes motor abnormalities but does not cause overt dystonia.
(A) Images of the whole brain (i) and coronal section (ii) from an Sgce KD BG mouse. (B) Injection of Sgce KD- or NT-shRNA into the basal ganglia did not produce dystonia, as indicated by a score greater than two on the Dystonia scale. (Sgce KD BG 1: N = 4; Sgce KD BG 2: N = 14; NT BG: N = 9). The dystonia scores for Sgce KD BG mice for time points of 2 weeks or more after injection were significantly different from the dystonia scores of the same animals at 1 week (Wilcoxon matched-pairs signed rank test, p<0.001). The dystonia scores of Sgce KD BG mice at 1 week after injection were not significantly different from NT BG mice at the same time point (t-test, Holm-Sidak method, p=0.36). (C) Sgce KD BG 1 (iii) and Sgce KD BG 2 mice (iv) appeared to ambulate more in the periphery of the open field chamber than wild-type (i) and NT BG (ii) mice. The first three columns show example tracks from individual mice. The last column depicts the average, which reflects the number of times the center of mass was detected at a pixel in the arena, and excludes frames where the animal did not move. (WT: N = 12, NT BG: N = 12, Sgce KD BG 1: N = 4; Sgce KD BG 2: N = 13).
Figure 2—figure supplement 1
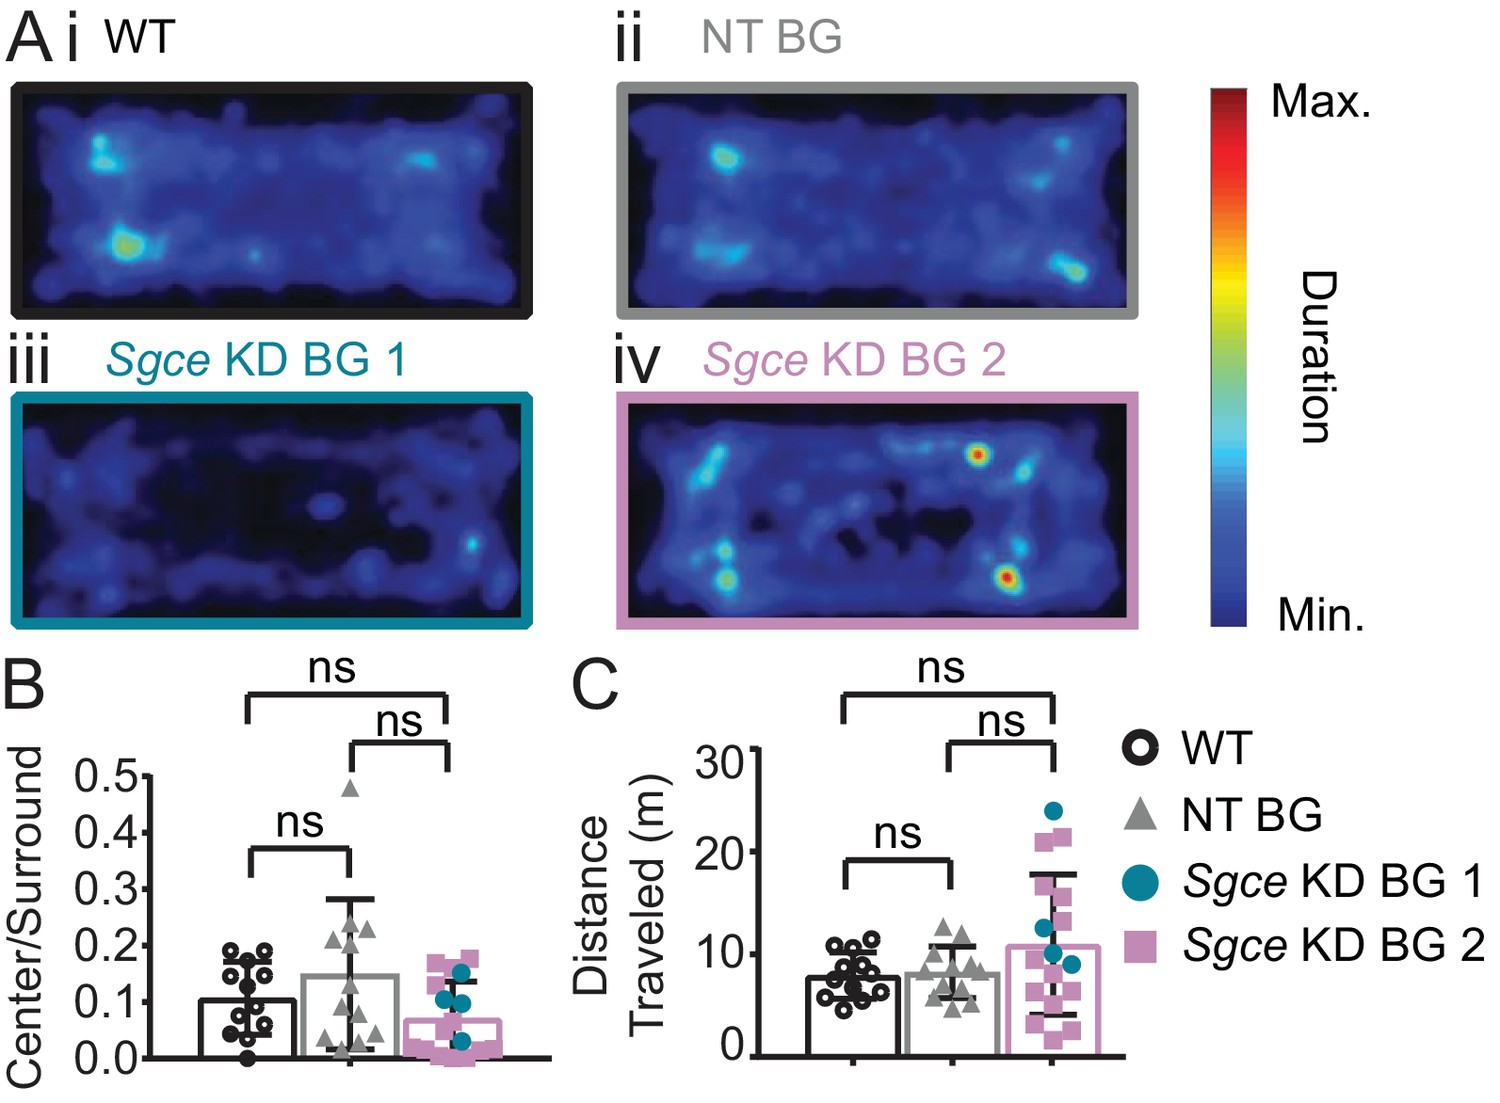
Sgce KD BG mice spend qualitatively less time in the center of the open field with no significant change in the ratio of distance traveled.
(A) Average duration spent per pixel in the open field chamber (WT: N = 12, NT BG: N = 12, Sgce KD BG 1: N = 4; Sgce KD BG 2: N = 13). (B) Ratio of duration of time spent in the center, to the duration of time spent in the surround in a 5 min video (Mean + S.D., WT: N = 12, NT BG: N = 12, Sgce KD BG 1: N = 4; Sgce KD BG 2: N = 13, 1way ANOVA, Holm-Sidak’s multiple comparisons test, p>0.05 for all comparisons). (C) Distance traveled (m) in a 5 min video (Mean + S.D., WT: N = 12, NT BG: N = 12, Sgce KD BG 1: N = 4; Sgce KD BG 2: N = 13, 1way ANOVA, Holm-Sidak’s multiple comparisons test, p>0.05 for all comparisons).
Figure 2—figure supplement 2

Sgce KD CB mice did not show a preference for the periphery and avoidance of the center.
(A) Sgce KD CB 1 (ii) and Sgce KD CB 2 mice (iii) showed no difference in ambulation in the open field chamber compared to NT CB (i) mice. Columns 1–3 are example tracks from individual mice, and column four is the average (NT CB: N = 14, Sgce KD CB 1: N = 11, Sgce KD CB 2: N = 9).
Figure 3 with 2 supplements
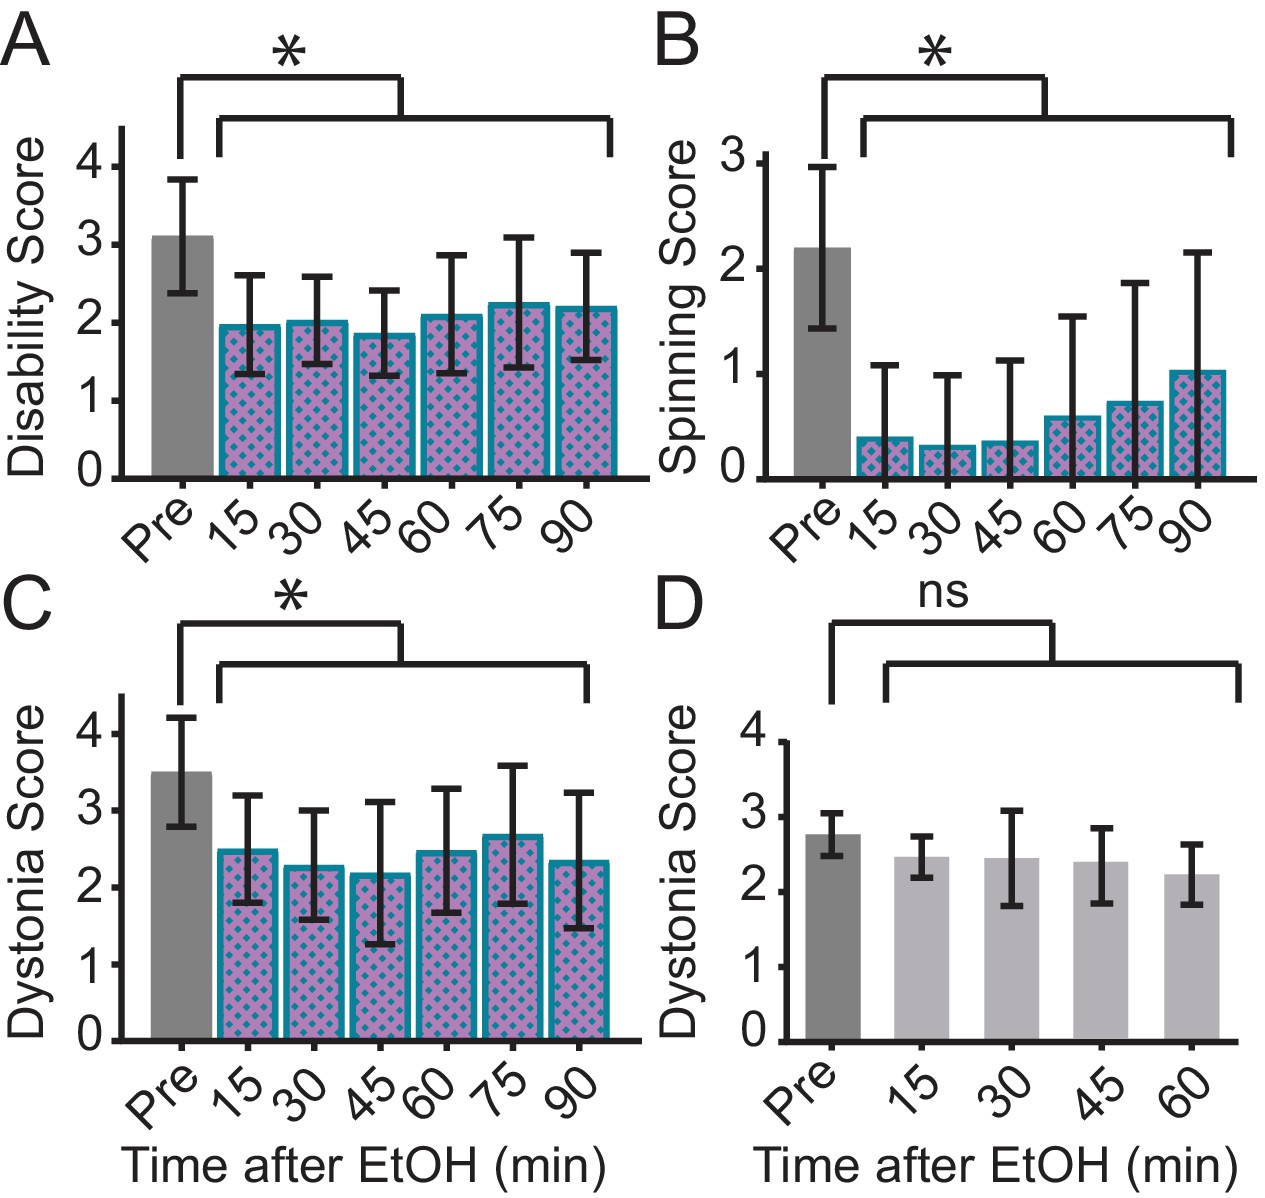
Ethanol relieves motor symptoms in Sgce KD CB, but not Tor1a KD CB, mice.
(A) Disability score of Sgce KD CB mice after ethanol injection. Ethanol reduces the disability score of mice injected with shRNA against Sgce. Alleviation of symptoms persisted for up to 90 min after ethanol (p<0.0001, 1way ANOVA, Mean + S.D., N = 16). (B) Spinning score of Sgce KD CB mice after ethanol injection. Ethanol reduces the spinning score of mice injected with shRNA against Sgce. (p<0.0001, 1way ANOVA, Mean + S.D., N = 19). (C) Dystonia score of Sgce KD CB mice after ethanol injection. Ethanol significantly reduced the dystonia score of Sgce KD CB mice (p<0.0001, 1way ANOVA, Mean + S.D., N = 16). (D) Dystonia score of Tor1a KD mice after ethanol injection. Ethanol had no effect of the dystonia score, which reflects the primary symptoms caused by Tor1a knockdown, in mice injected with shRNA against Tor1a (p=0.2391, 1way ANOVA, Mean + S.D., N = 5).
Figure 3—figure supplement 1
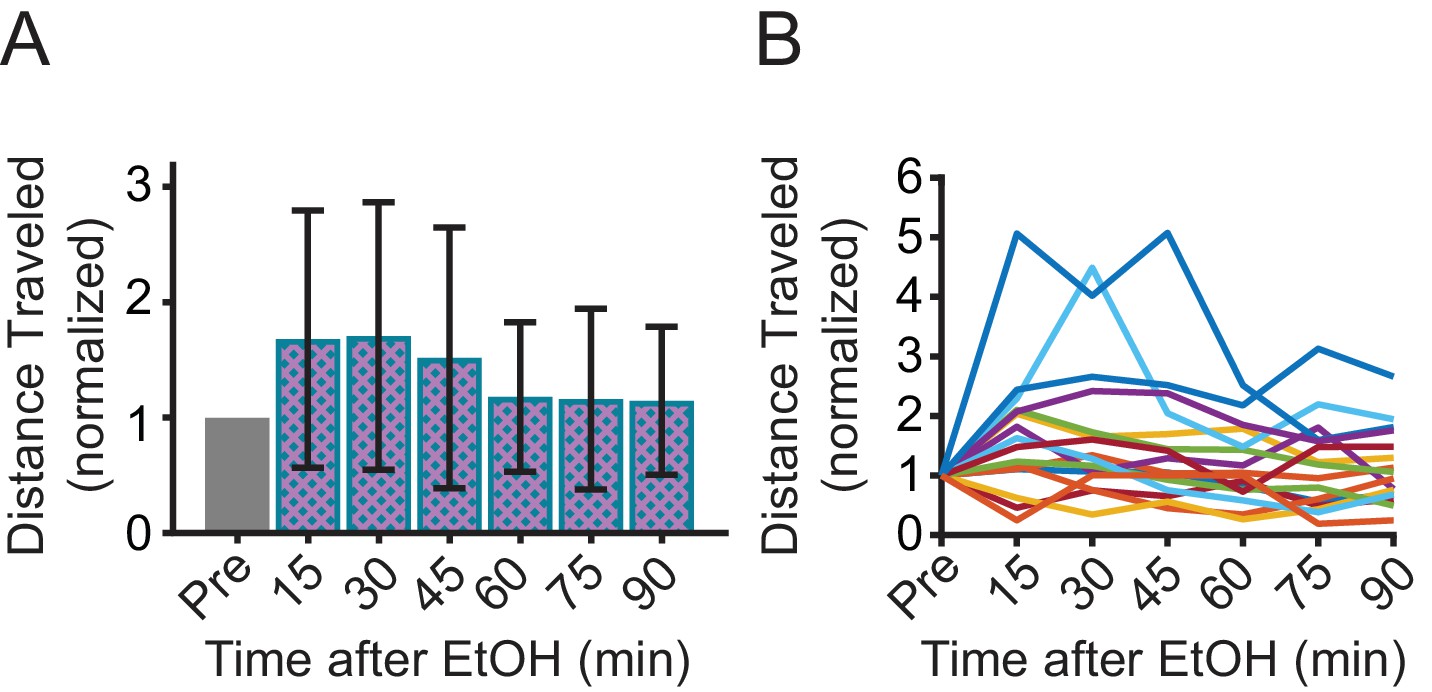
The effect of EtOH on distance travelled varies among individual mice.
(A) Total distance traveled in the open field after ethanol injection, normalized to distance traveled before ethanol (Pre) (1way ANOVA, p=0.0148, N = 16, Dunnett’s multiple comparisson’ test, p>0.05 at each time point). (B) Data in (A) presented for each mouse.
Figure 3—figure supplement 2
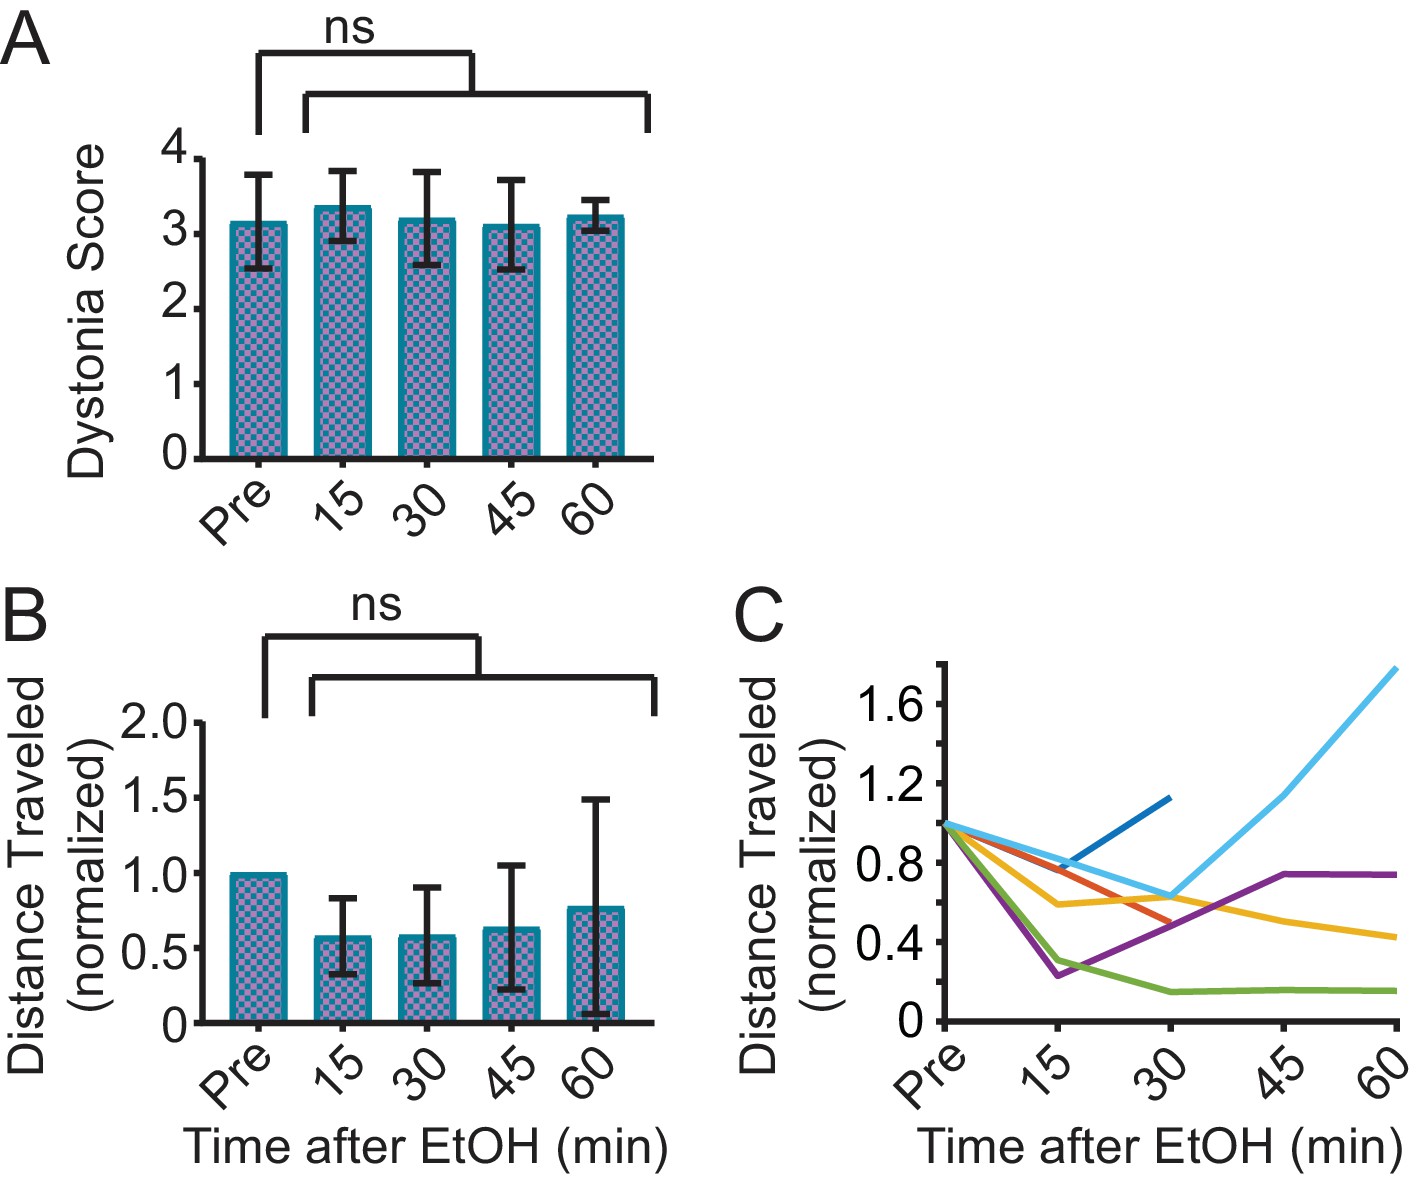
Saline does not improve symptoms in Sgce KD CB mice.
(A) Dystonia score of Sgce KD CB mice after saline injection. Saline had no effect on the dystonia score of Sgce KD CB mice (p=0.9516, 1wayANVOA, N = 6). (B) Total distance traveled in the open field after EtOH injection, normalized to distance traveled before ethanol (Pre) (p=0.2851, 1way ANOVA, N = 6). (C) Data in (B) presented for each mouse.
Figure 4
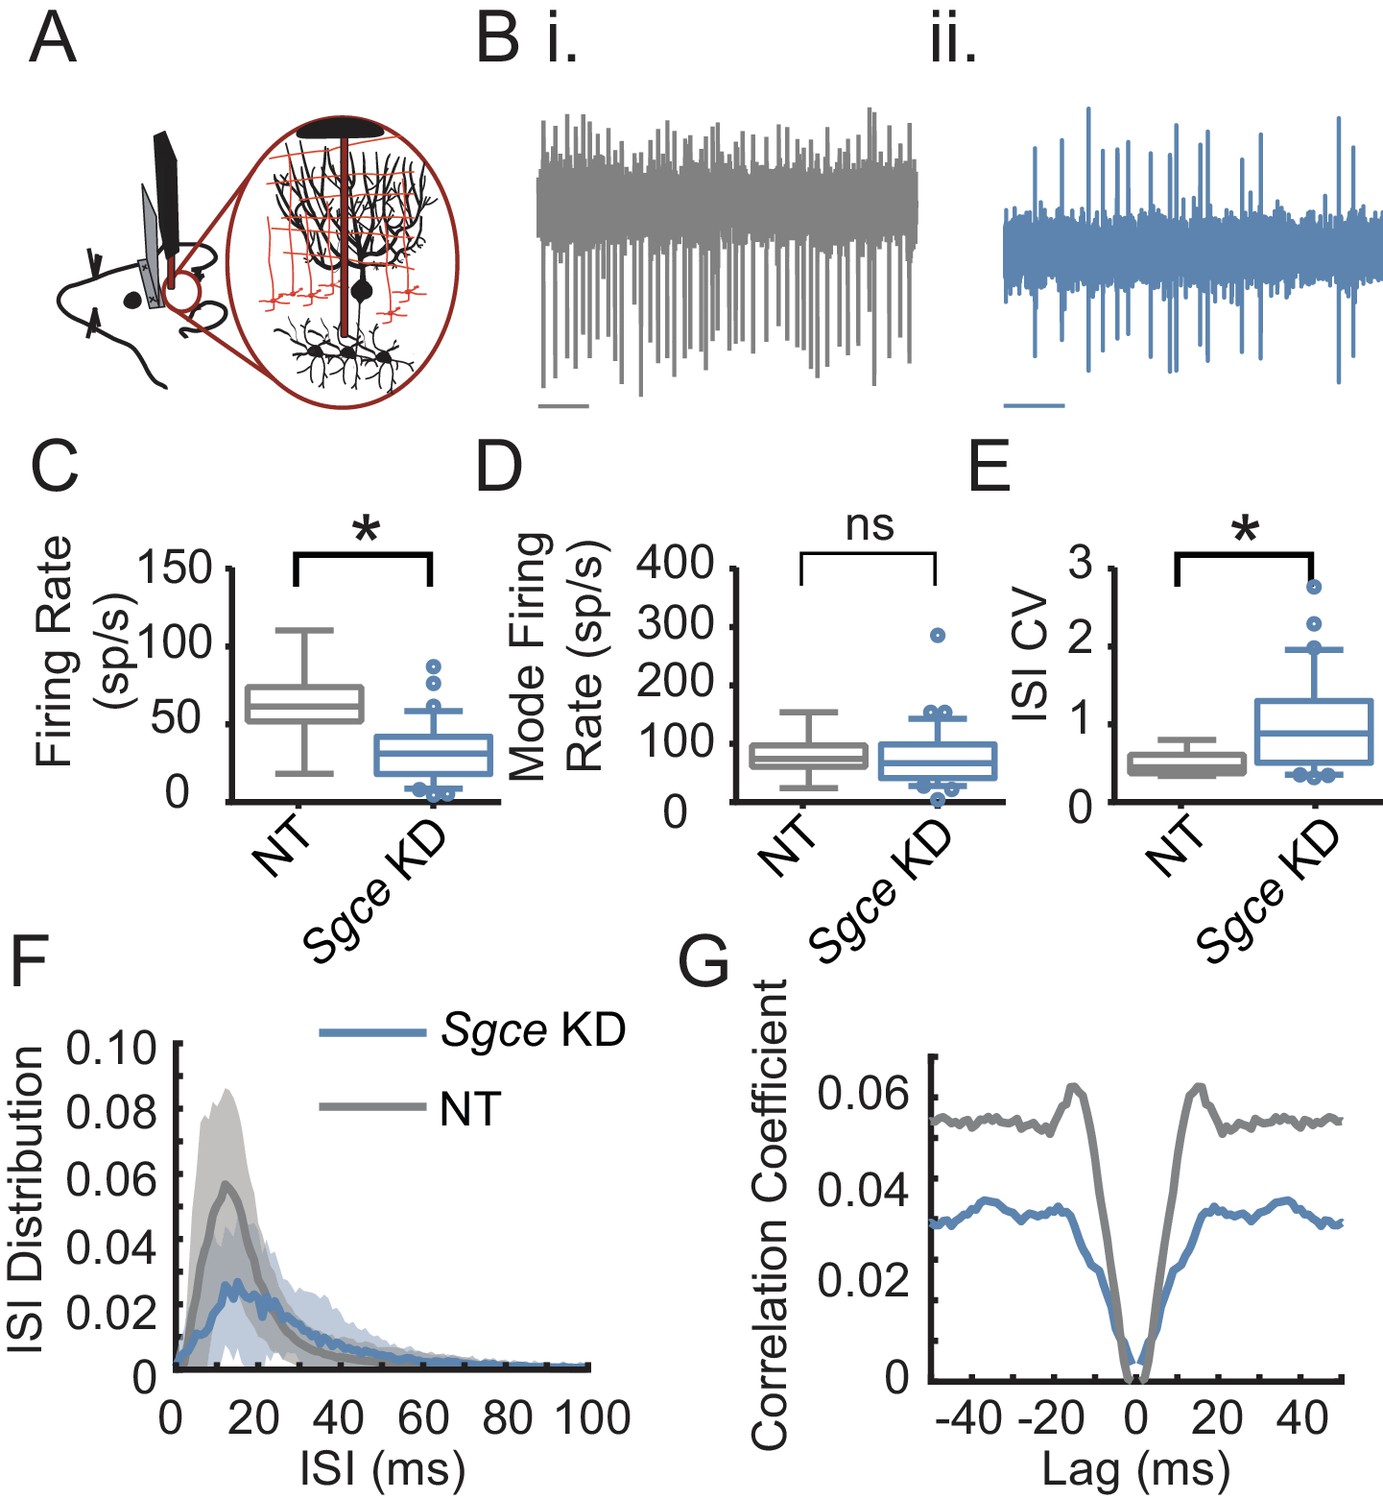
Cerebellar nuclei neurons fire aberrantly in Sgce KD CB mice.
(A) Experimental schematic. Extracellular electrophysiological recordings were made from neurons in the cerebellar nuclei in awake, head-restrained mice. (B) Example traces from a mouse injected with non-targeting shRNA (i) and shRNA against Sgce (ii). Scale bar represents 100 ms. (C) Average firing rates of DCN neurons in NT CB and Sgce KD CB animals (NT CB = 62.9 ± 24.8 spikes/s, n = 9, N = 4 and Sgce KD CB = 32.2 ± 19.5 spikes/s, n = 32, N = 8, Mean ± S.D.; Welch’s t-test, p=0.0057). (D) Mode firing rates of DCN neurons in NT CB and Sgce KD CB animals (NT CB = 80.4 ± 36.6 and Sgce KD CB = 74.8 ± 53.5 spikes/s, Mean ± S.D.; Welch’s t-test, p=0.73). (E) Interspike interval coefficients of variation of DCN neurons in NT CB and Sgce KD CB animals (NT CB = 0.50 ± 0.16 and Sgce KD CB = 1.00 ± 0.61, Mean ± S.D.; Welch’s t-test, p=0.0002). (F) Normalized ISI histogram of DCN neurons in NT CB and Sgce KD CB mice. (G) Autocorrelogram of DCN neurons in NT CB and Sgce KD CB mice.
Figure 5
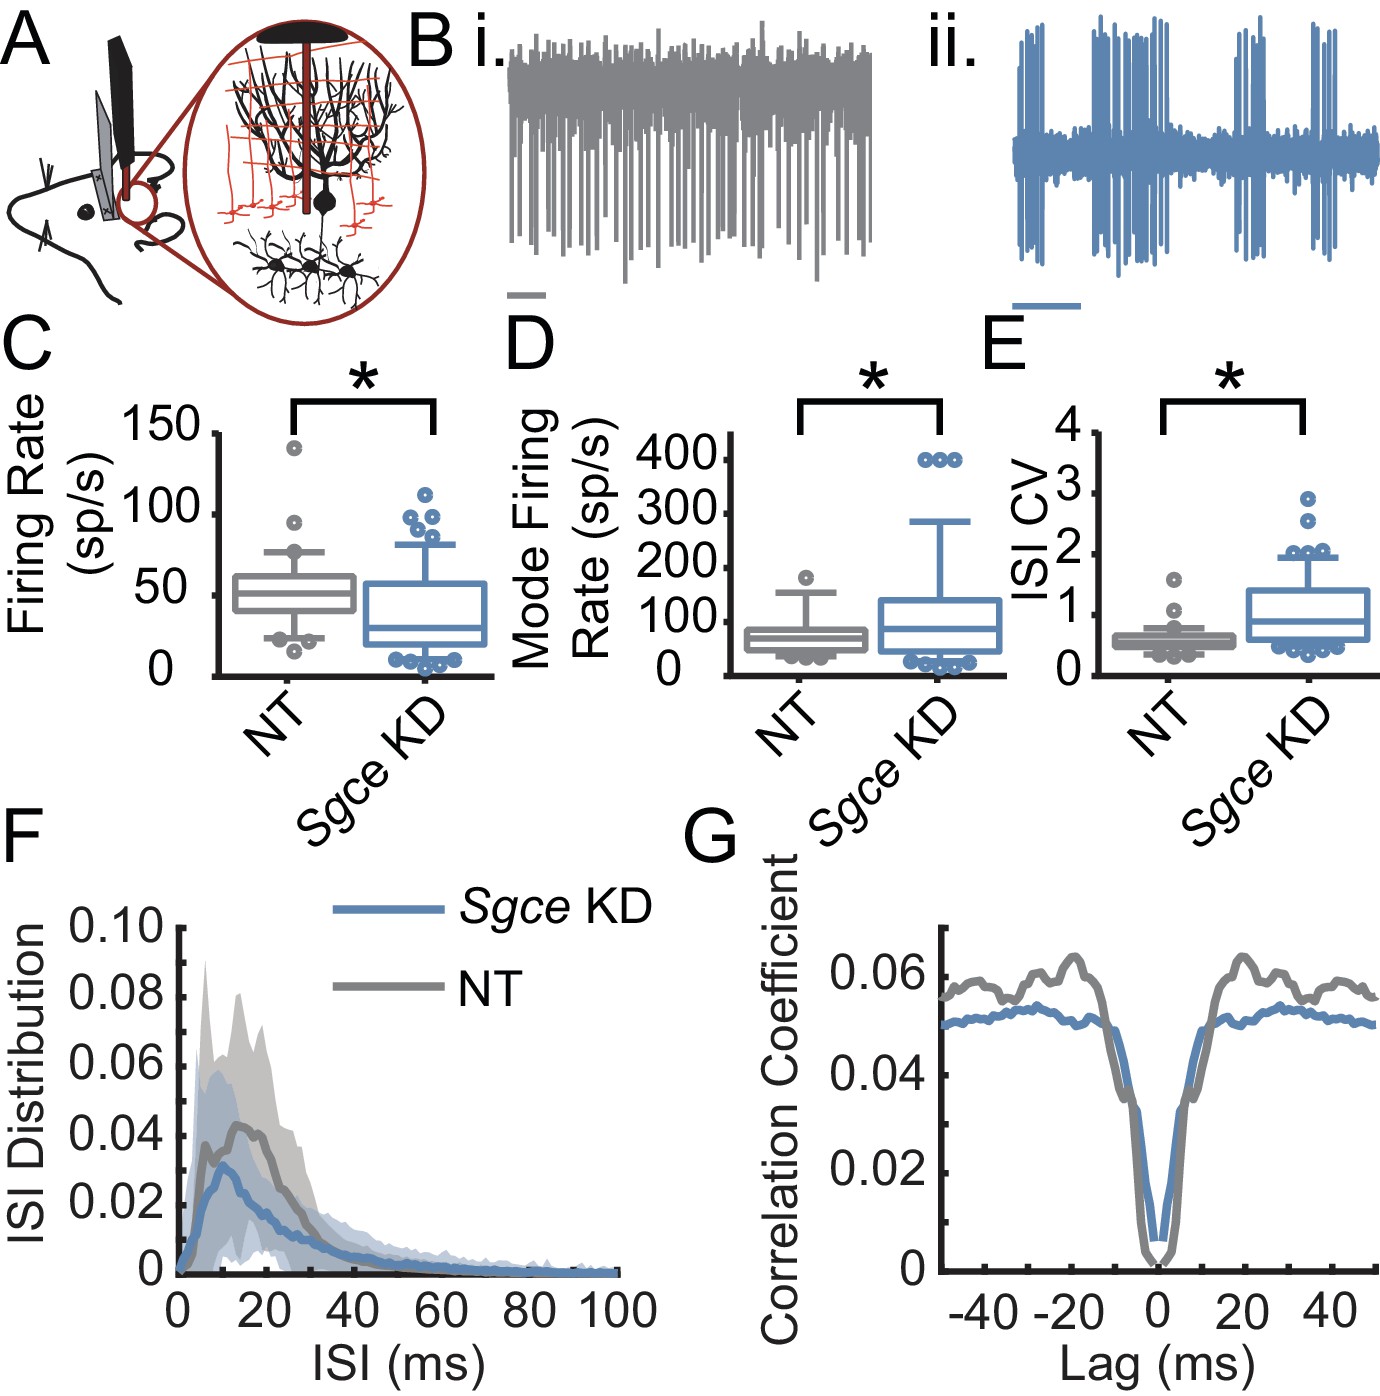
Purkinje cells fire aberrantly in Sgce KD CB mice.
(A) Experimental schematic. Extracellular electrophysiological recordings were made from Purkinje cells in awake, head-restrained mice. (B) Example traces of Purkinje cells from an NT CB (i) or Sgce KD CB (ii) mouse. Scale bar represents 100 ms. (C) Average firing rates of Purkinje cells in NT CB and Sgce KD CB animals (NT CB = 53.3 ± 24.1 spikes/s, n = 30, N = 4 and Sgce KD CB = 39.2 ± 26.6 spikes/s, n = 57, N = 11, Mean ± S.D.; Welch’s t-test, p=0.0028). (D) Mode firing rates of Purkinje cells in NT CB and Sgce KD CB animals (NT CB = 77.5 ± 41.6 spikes/s and Sgce KD CB = 115.0 ± 99.4 spikes/s, Mean ± S.D.; Welch’s t-test, p=0.0158). (E) Interspike interval coefficients of variation of Purkinje cells in NT CB and Sgce KD CB animals (NT CB = 0.60 ± 0.25 and Sgce KD CB = 1.06 ± 0.57, Mean ± S.D.; Welch’s t-test, p<0.0001). (F) Normalized ISI histogram of Purkinje cells in NT CB and Sgce KD CB mice. (G) Autocorrelogram of Purkinje cells in NT CB and Sgce KD CB mice.
Author response image 1

Increased frequency of walking backward observed in sgce KD CB mice.
Mice were recorded for 5 minutes in the open field. Walking backward was scored manually by 1 observer blind to the condition of the animal. Increased walking backward was observed in sgce KD CB, but not NT CB, sgce KD BG, or NT BG mice. 1-way ANOVA with Holm-Sidak’s correction for multiple comparisons: p < 0.0001 for WT vs. sgce KD CB, NT CB vs. sgce KD CB, sgce KD CB vs. NT BG, and sgce KD CB vs. sgce KD BG. N, WT = 12; N, NT CB = 14; N, sgce KD CB = 20; N, NT BG = 12; N, sgce KD BG = 19. All data in all figures are represented as mean together with the standard deviation.
Author response image 2
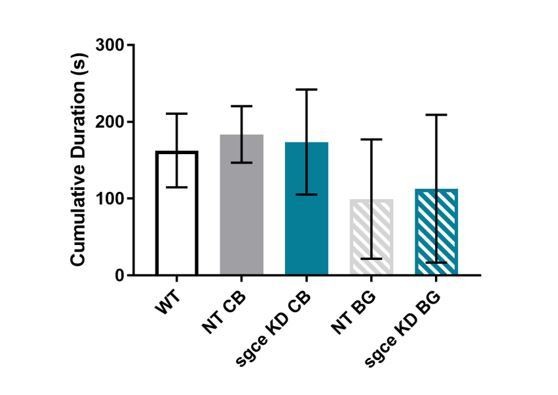
Cumulative duration of time spent inactive in sgce KD CB and sgce BG mice did not differ from NT CB or NT BG mice, respectively, or WT mice.
1-way ANOVA with Holm-Sidak’s correction for multiple comparisons: p > 0.05 for WT vs. NT CB, WT vs. NT BG, WT vs. sgce KD CB, WT vs. sgce KD BG, NT CB vs. sgce KD CB, and NT BG vs. sgce KD BG; N, WT = 12; N, NT CB = 14; N, sgce KD CB = 20; N, NT BG = 12; N, sgce KD BG = 19.
Author response image 3

Rearing is decreased in sgce KD animals.
(A) Supported rearing was reduced in sgce KD CB animals, compared to WT and NT CB mice. 1-way ANOVA with Holm-Sidak’s correction for multiple comparisons: p < 0.0001 for WT vs. sgce KD CB and NT CB vs. sgce KD CB; N, WT = 12; N, NT CB = 14; N, sgce KD CB = 20; N, NT BG = 12; N, sgce KD BG = 19. (B) Supported rearing was reduced in both sgce KD CB and sgce KD BG animals compared to WT and NT CB, and WT and NT BG mice, respectively. 1-way ANOVA with Holm-Sidak’s correction for multiple comparisons: p = 0.0086 for WT vs. sgce KD CB; p = 0.0071 for NT CB vs. sgce KD CB; p < 0.0391 for WT vs. sgce KD BG; p < 0.0001 for NT BG vs. agce KD BG; N, WT = 12; N, NT CB = 14; N, sgce KD CB = 20; N, NT BG = 12; N, sgce KD BG = 19.
Videos
Video 1
Sgce KD CB 1 and sgce KD CB 2 mice have dystonia, as evidenced by a dystonia score of greater than or equal to two in the open field, while NT CB mice do not develop dystonia (p<0.01, Wilcoxon matched-pairs signed rank test, Sgce KD CB 1: N = 39; Sgce KD CB 2: N = 40; NT CB: N = 16).
Video 2
In addition to dystonia, Sgce KD CB mice exhibit myoclonic-like movements in the open field and spin when suspended by the tail.
Video 3
Neither Sgce KD BG nor NT BG mice developed dystonia, as measured by a score of greater than or equal to two in the open field.
Video 4
EtOH relieves motor symptoms of Sgce KD CB mice, as measured on the Disability Scale (p<0.0001, 1way ANOVA, N = 16), Spinning Scale Scale (, p<0.0001, 1way ANOVA, N = 19), and Dystonia Scale (p<0.0001, 1way ANOVA, N = 16), but it does not relieve dystonic symptoms of mice injected with shRNA against Tor1a, an acute shRNA knockdown model of DYT1 (p=0.2391, 1way ANOVA, N = 5).
Video 5
Saline had no effect on the motor symptoms of Sgce KD CB mice (p=0.9517, 1way ANOVA, N = 6).
Tables
Table 1
Disability scale for assessing motor impairment in Sgce knockdown mouse model of DYT11.
| 0 | Normal -- animal has no observable motor deficit |
| 1 | Slight motor disability -- animal may exhibit unsteady gait or uncoordinated movement, but does not have any repetitive movements or sustained postures |
| 2 | Mild motor disability -- ambulation is mildly impaired; animal exhibits wide stance, very unsteady gait, back-walking, and/or occasional repetitive movements or sustained postures |
| 3 | Moderate motor disability -- ambulation is moderately impaired; animal does not properly ambulate, dragging itself on its side, and may exhibit frequent sustained dystonic-like postures or repetitive movements |
| 4 | Severe motor disability -- animal is unable to properly ambulate for most of the duration of the observation, exhibits frequent repetitive movements, and/or sustained dystonic-like postures |
Table 2
Spinning scale for assessing abnormal motor behavior in Sgce knockdown mouse model of DYT11.
| 0 | Not present -- Animal does not spin |
| 1 | Mild -- Animal spins intermittently or clearly struggles more than the wild-type |
| 2 | Moderate -- Animal spins moderately, making several successive complete rotations |
| 3 | Severe -- Animal spins vigorously for most of the duration of the observation |
Key resources table
| Reagent type (species) or resource | Designation | Source or reference | Identifier(s) | Additional information |
|---|---|---|---|---|
| Sequenced-based reagent | Sgce KD 1 | RNAi Consortium (sequence) Virovek (virus) | TRCN0000119308; Lot# 12–183 | shRNA; 5’-CCGGGCCGAGACT ATTACACGGATTCTCGAGAATCCGTGTAATAGTCTCGGCTTTTTG-3’ |
| Sequenced-based reagent | Sgce KD 2 | RNAi Consortium (sequence) Virovek (virus) | TRCN0000119307; Lot# 13–009 | shRNA; 5’-CCGGCCCACTGTG TTGAGAACCAAACTCGAGTTTGGTTCTCAACACAGTGGGTTTTTG-3’ |
| Sequenced-based reagent | NT | Virovek | Lot# 13–234 | shRNA; 5'-GAGGATCAAATTG ATAGTAAACCGTTTTGGCCACTGACTGACGGTTTACTATCAATTTGATCCTCTTTTT-3' |
| Sequenced-based reagent | NT | Virovek | Lot# 13–037 | shRNA; 5'-CCAACTACCCGAA CTATTATTCAAGAGATAATAGTTCGGGTAGTTGGCATTTTTT-3' |
| Commercial assay or kit | iTaq universal SYBR Green reaction mix | BioRad | Catalog #172–5151 | |
| Commercial assay or kit | iScript reverse transcriptase | BioRad | Catalog #172–5151 | |
| Sequenced-based reagent | Sgce Forward Primer | PrimerBank | PrimerBank ID: 31981494a1 | CGGATTCTTTGAAAAGCCGAGA |
| Sequenced-based reagent | Sgce Reverse Primer | PrimerBank | PrimerBank ID: 31981494a1 | GTCTGTGTGCATGGGAGGTAT |
| Sequenced-based reagent | Gapdh Forward Primer | PrimerBank | PrimerBank ID: 6679937a1 | AGGTCGGTGTGAACGGATTTG |
| Sequenced-based reagent | Gapdh Reverse Primer | PrimerBank | PrimerBank ID: 6679937a1 | TGTAGACCATGTAGTTGAGGTCA |
| Antibody | Alexa 488, goat anti rabbit secondary | Invitrogen Life Technologies; Thermo Fisher Scientific | Cat# A-11008, RRID:AB_143165 | IF 1:400 |
| Antibody | GFP Tag (rabbit polyclonal) | Invitrogen Molecular Probes; Thermo Fisher Scientific | Cat# A-11122, RRID:AB_221569 | IF 1:250 |
| Other | DAPI stain | Invitrogen Life Technologies | H1399 | 1:2000 |
| Software, algorithm | LabVIEW | National Instruments | RRID: SCR_014325 | |
| Software, algorithm | GraphPad Prism 7 | GraphPad Software | RRID: SCR_002798 | |
| Other | OptiBond All-In-One | Kerr | 33381 | Adhesive |
| Other | Charisma | Heraeus Kulzer | NA | Adhesive |
| Other | Metabond | Parkell | S380 | C and B Metabond Quick Adhesive Cement System |
Additional files
Download links
A two-part list of links to download the article, or parts of the article, in various formats.
Downloads (link to download the article as PDF)
Open citations (links to open the citations from this article in various online reference manager services)
Cite this article (links to download the citations from this article in formats compatible with various reference manager tools)
Acute cerebellar knockdown of Sgce reproduces salient features of myoclonus-dystonia (DYT11) in mice
eLife 8:e52101.
https://doi.org/10.7554/eLife.52101


