Incomplete vesicular docking limits synaptic strength under high release probability conditions
- Université de Paris, SPPIN-Saints Pères Paris Institute for the Neurosciences, CNRS, France
- Department of Cell Biology and Physiology, Washington University, United States
- Graduate School of Brain Science, Doshisha University, Japan
Figures
Figure 1 with 1 supplement

Effects of different release conditions on synaptic parameters and short-term plasticity.
(A) Upper panel: Schematics of recording configuration. A stimulation pipette is positioned close to the soma of a potential presynaptic granule cell while whole-cell recording from a MLI. Careful presynaptic pipette positioning and stimulation strength adjustment results in selective stimulation of a single PF-MLI connection. Lower panel: Individual traces in response to AP trains (8 stimuli, 100 Hz; stimulation timing in red). (B) Deconvolution-based counts of released SVs per stimulus. Matrices of SV numbers as a function of AP number for 5 individual experiments are illustrated in different external solutions (from top to bottom: 1.5 mM [Ca2+]o in control, in 1 mM TEA, and in 5 mM TEA; 3 mM [Ca2+]o in control and in 1 mM TEA). Each experiment involved a control period and another set of data in one TEA concentration. Accordingly, the two SV count matrices in 1.5 mM [Ca2+]o without TEA and with 1 mM TEA stem from the same experiment. Likewise, the two SV count matrices in 3 mM [Ca2+]o without TEA and with 1 mM TEA stem from the same experiment. (C) Group results of the variance-mean relationship of the number of released vesicles calculated per stimulus (mean ± SEM; results for the first stimulus in blue). The dashed lines represent the parabolic fit after pooling the results in all conditions; it indicates an N = 3.6. Gray thick traces show the excursion over this parabola from the origin until the value that displays the highest P. (D) Time course of SV numbers during a train showing changes in short term synaptic plasticity with [Ca2+]o and TEA (same data set as in C). (E–H) Group analysis (bars: mean ± SEM, n = 4–12; circles: individual experiments) show an increase of the release probability for the 1st stimulus as a function of TEA (E), an increase of the maximal release probability as a function of TEA (F), no change in N (G), and a decrease of the PPR as a function of [Ca2+]o and TEA (H). Statistical comparisons use paired t-tests in E-F, and unpaired t-tests for all combinations in G-H. No symbol or n.s. = p > 0.05; *=p < 0.05; **=p < 0.01; ***=p < 0.001.
Figure 1—figure supplement 1
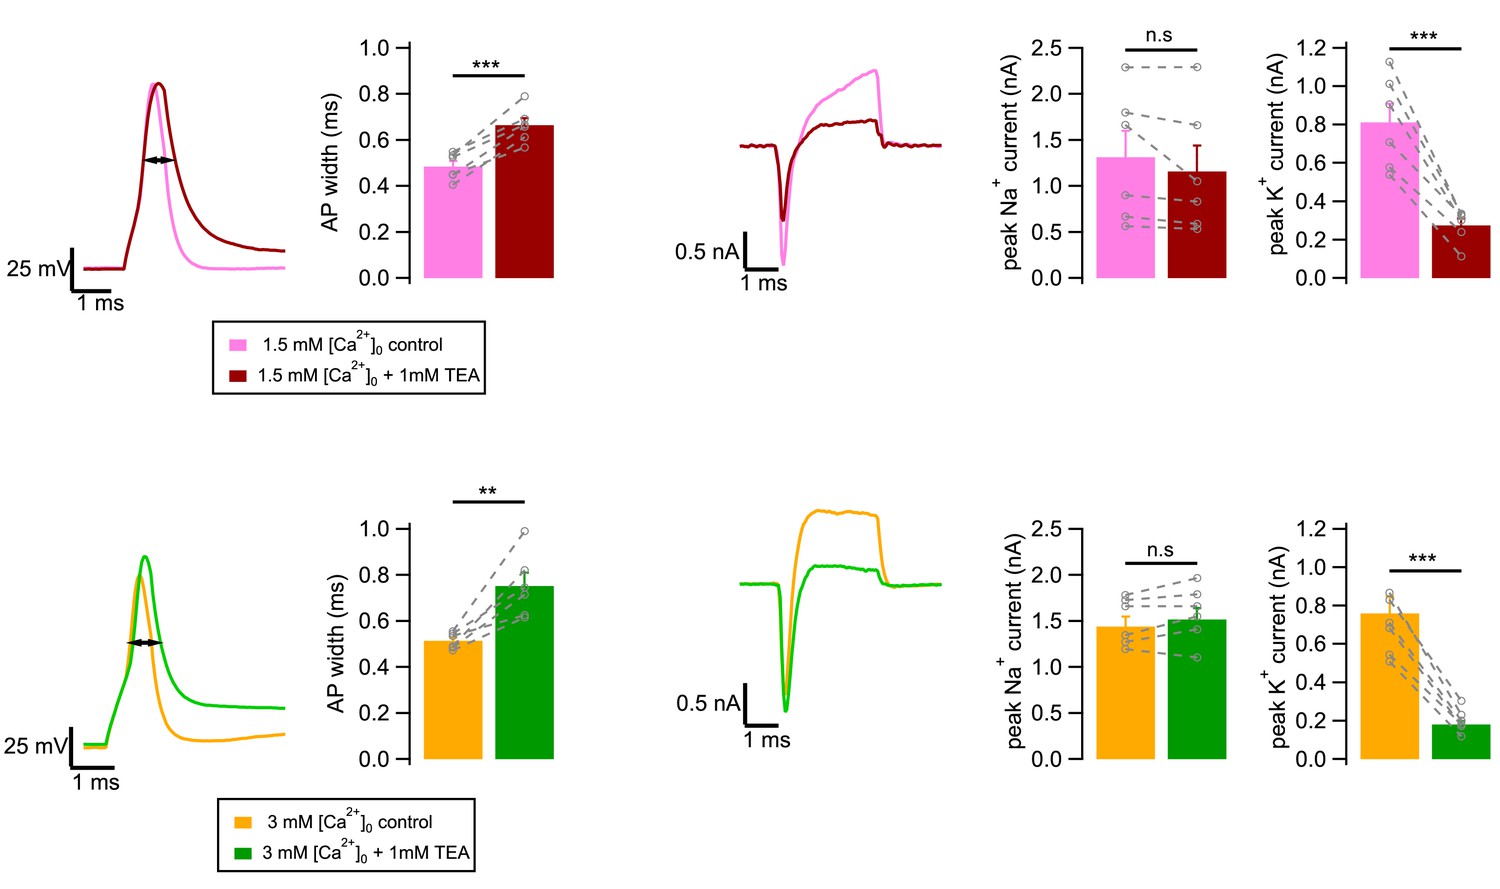
Effect of adding TEA on granule cell excitability.
In these experiments, granule cells were examined under current clamp and voltage clamp, before and after addition of TEA. Under current clamp, we measured AP width in 1.5 mM [Ca2+]o at 0 mV, without (pink) or with (brown) 1 mM TEA. Likewise we measured AP width in 3 mM [Ca2+]o, without (yellow) or with (green) 1 mM TEA. Under voltage clamp, peak voltage-dependent Na+ and K+ currents were estimated by measuring the peak amplitudes of inward and outward current responses to depolarizing voltage pulses to 0 mV. Group results show significant increases in AP width with TEA, both in 1.5 mM [Ca2+]o and in 3 mM [Ca2+]o. Peak K+ currents are decreased in the presence of TEA, both in 1.5 mM [Ca2+]o and in 3 mM [Ca2+]o, while peak Na+ currents are not significantly changed. Levels of significance for statistical tests (paired t-test): **, p<0.01; ***, p<0.001.
Figure 2
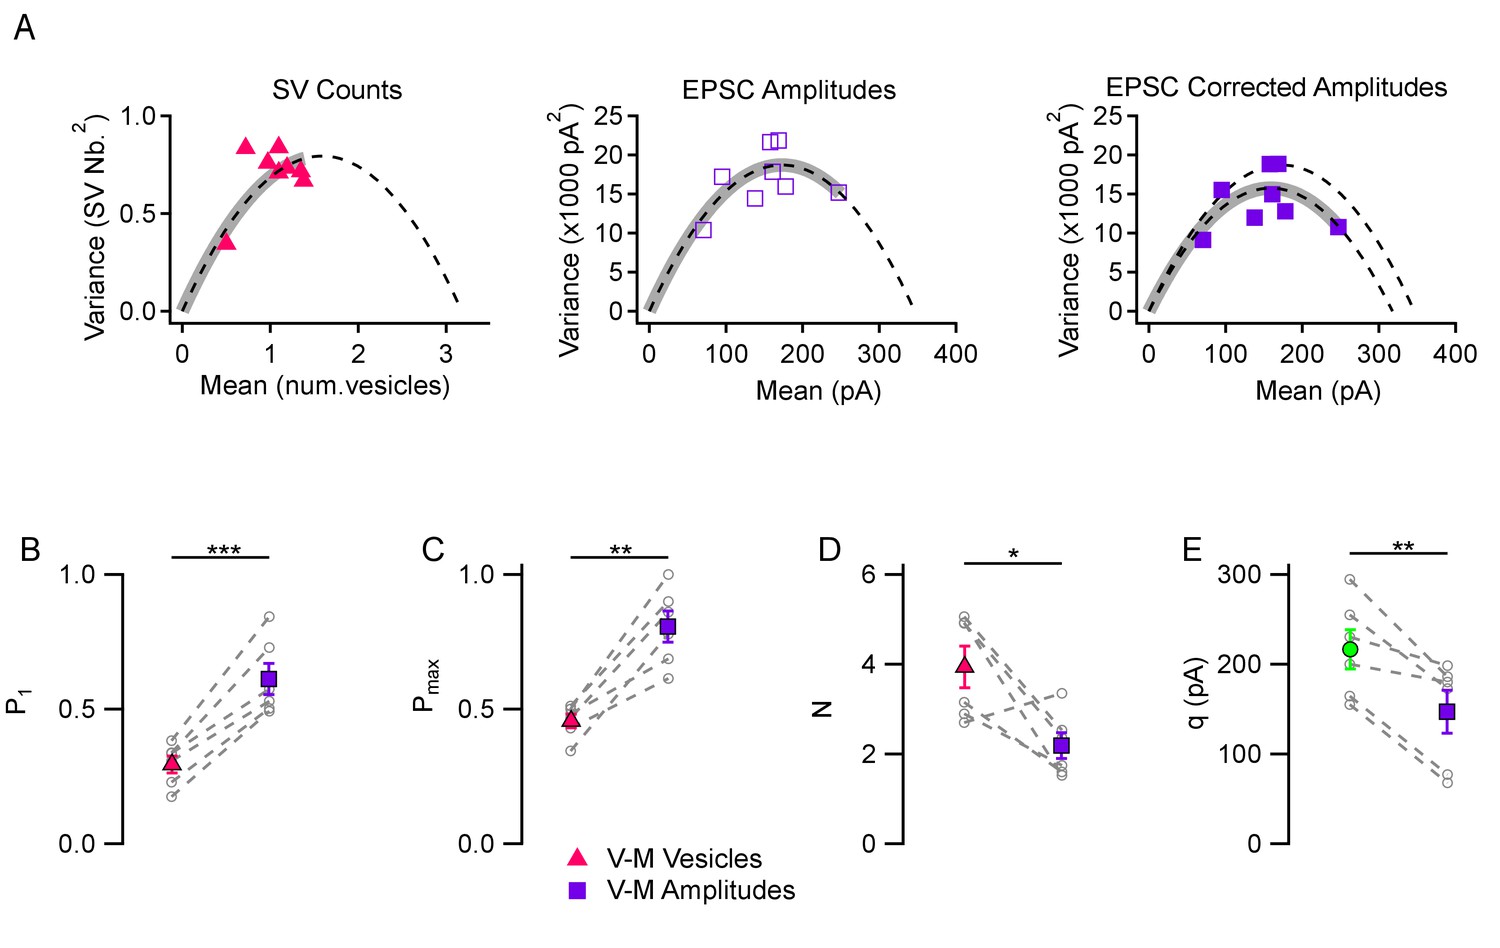
Comparison between variance-mean analysis of SV counts and variance-mean analysis of peak EPSC amplitudes.
(A) Variance vs. mean plots calculated for different stimulus numbers (8 stimuli per plot) in a representative simple synapse experiment (3 mM [Ca2+]o). Using the same data, mean and variance estimates were obtained either using SV counts (left, triangles) or using peak EPSC amplitudes (center and right, squares). Fitted functions follow the equations f(x)=x - x2/N for SV counts, and f(x)=x q – x2/N for EPSC amplitudes (dashed lines: parabolic fits; gray thick traces show the excursion over the parabola from the origin up to the experimental point with highest P value). The right panel shows the effect of correcting the variance in the peak EPSC analysis for variations in q size ('corrected amplitudes': filled squares). The thick grey parabolas indicate a larger maximum P value with EPSC amplitude analysis than with SV counts, particularly after correction. (B–D) Group analysis of synaptic parameters extracted from 6 experiments as illustrated in (A) using variance-mean analysis based either on SV counts (triangles) or EPSC amplitudes (filled squares; data corrected for q variance). These results show higher estimates of P1 and Pmax, as well as lower N estimates, when using EPSC amplitudes compared to using SV counts. (E) Quantal size estimates using variance-mean analysis of EPSC amplitudes (mean: purple square) are lower than direct measurements obtained for each synapse during delayed release (mean: green circle). In (B–E), error bars show ± SEM, and results from same experiments are linked together with dashed lines. Statistical comparisons show results of paired t-tests between indicated data groups: *=p < 0.05; **=p < 0.01; ***=p < 0.001.
Figure 3
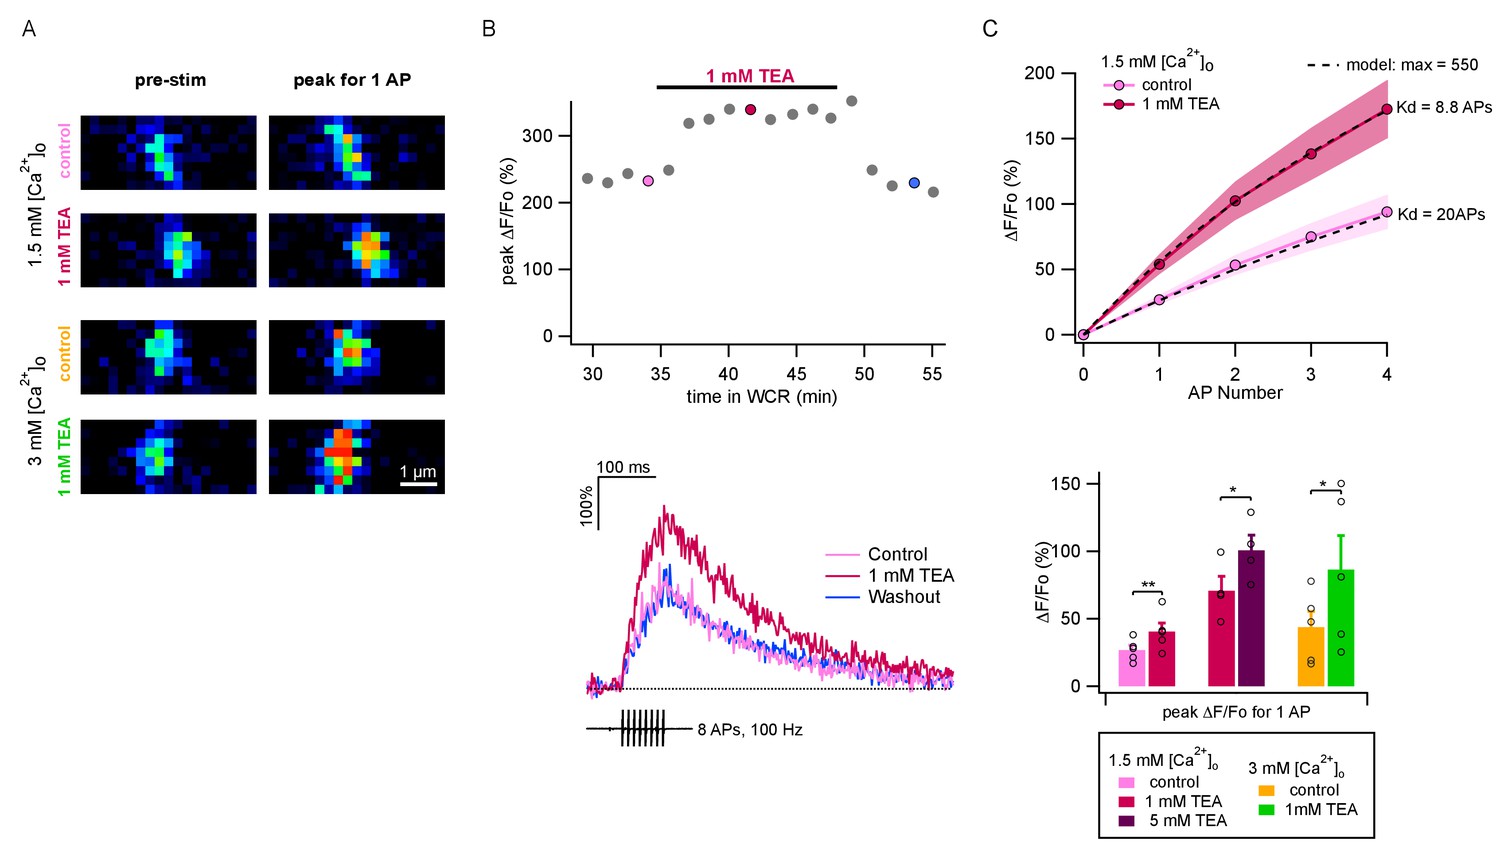
TEA augments AP-evoked Ca2+ rise in single PF varicosities.
(A) Single scans of two representative varicosities (one in 1.5 mM [Ca2+]o and the other in 3 mM [Ca2+]o), showing [Ca2+]i signal at rest (left) and following a single AP (right), both in control conditions (upper panels) and the presence of 1 mM TEA (lower panels). Cells were loaded with 500 μM of the calcium indicator OGB-6F. In both cases TEA appears to increase the AP-driven [Ca2+]i rise. (B) Top: Time-course of peak ΔF/F0 after 8 APs as a function of time in whole-cell recording. After a 30 min loading period the basal fluorescence was stable. 1 mM TEA was added at 35 min, causing an increase in the signal; the effect was reversible upon drug washout. Bottom: Time course of ΔF/F0 signal for individual responses during and after 8 AP stimulation; corresponding dots with same color coding in the upper plot. (C) Top: Average AP-evoked peak ΔF/F0 values as a function of AP number (shadowed colors indicate ± SEM; n = 5 varicosities in control, and n = 10 in 1 mM TEA). Dotted lines show fits of the data assuming constant Ca2+ entry per AP, using a hyperbolic function describing the sensitivity of OGB-6F on Ca2+ concentration (see Materials and methods; half saturation points are indicated next to each trace). Bottom: Average peak ΔF/F0 evoked by the first AP for each treatment. Circles show results from individual experiments. Bars show means ± SEM. Significant differences between mean values are illustrated (*: p<0.05; **: p<0.01; paired t-tests).
Figure 4 with 1 supplement
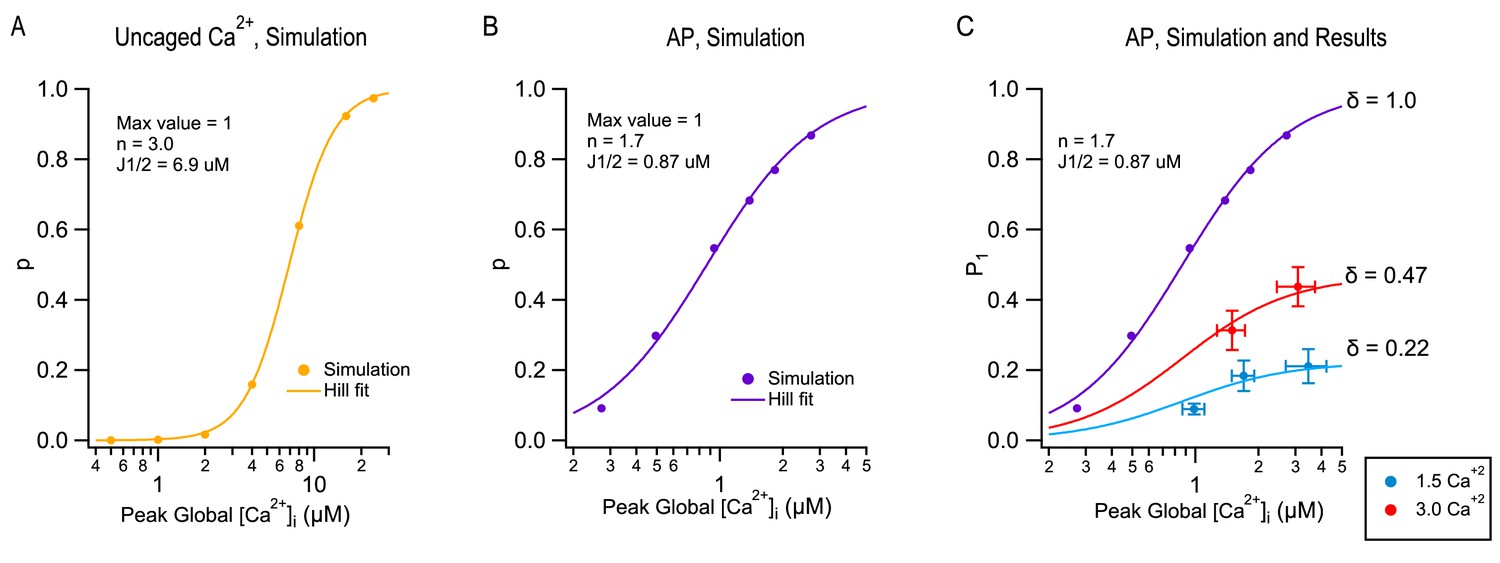
Modeling TEA-induced P increases in 1.5 mM [Ca2+]o and in 3 mM [Ca2+]o.
(A) Plot of the release probability (p) as a function of step [Ca2+]i increases, as predicted by the allosteric vesicular release model of Lou et al. (2005), modified as explained in Miki et al. (2018). (B) The same model predicts a different dose-response curve when plotting the release probability of a docked SV as a function of peak global [Ca2+]i following an AP stimulation, by varying the total amount of Ca2+ entry per AP. For this simulation the Ca2+ diffusion and buffering model developed earlier for PF-MLI synapses was used (Miki et al., 2018). Note the more shallow dose-response curve (Hill coefficient: 1.7 vs. 3.0) and higher apparent affinity (J1/2: 0.87 μM vs. 6.9 μM) with AP stimulation compared to step [Ca2+]i stimulation. (C) Combining together the results of Figure 1 and of Figure 3 for the first stimulation in a train produces a plot of P1 as a function of peak global [Ca2+]i, both at 1.5 mM [Ca2+]o (blue: no TEA, 1 mM TEA, and 5 mM TEA) and at 3 mM [Ca2+]o (red: no TEA, and 1 mM TEA). These data cannot be fit directly with the dose-response curve in (B) (purple), but they can be fit using two different scaled versions of this curve, giving δ = 0.22 in 1.5 mM [Ca2+]o and δ = 0.47 in 3 mM [Ca2+]o.
Figure 4—figure supplement 1

Effect of 4-AP on release.
In these experiments, simple synapses were recorded first in 1.5 mM [Ca2+]o and 1 mM TEA. SV counts were compared under this starting condition and >5 min after addition of 15 μM of 4-aminopyridine (4-AP), a broad spectrum blocker of voltage-dependent K+ channels. (A) An example of cumulative vesicle counts during a train of 8 stimuli evoked at 100 Hz in control condition (red) and after addition of 4-AP (blue). (B) Average number of released vesicles as a function of stimulus number in control and after 4-AP. (C) 4-AP increased the release probability for the 1st stimulus (ppt = 0.049). (D) 4-AP did not significantly increase the maximal release probability (ppt = 0.067).
Additional files
-
Source data 1
Igor figure files.
- https://cdn.elifesciences.org/articles/52137/elife-52137-data1-v2.zip
-
Transparent reporting form
- https://cdn.elifesciences.org/articles/52137/elife-52137-transrepform-v2.docx
Download links
A two-part list of links to download the article, or parts of the article, in various formats.
Downloads (link to download the article as PDF)
Open citations (links to open the citations from this article in various online reference manager services)
Cite this article (links to download the citations from this article in formats compatible with various reference manager tools)
Incomplete vesicular docking limits synaptic strength under high release probability conditions
eLife 9:e52137.
https://doi.org/10.7554/eLife.52137


