Single cell analysis reveals human cytomegalovirus drives latently infected cells towards an anergic-like monocyte state
- Department of Molecular Genetics, Weizmann Institute of Science, Israel
- Department of Medicine, Addenbrooke's Hospital, University of Cambridge, United Kingdom
- Sydney Cellular Therapies Laboratory, Westmead, Australia
- Blood and Bone Marrow Transplant Unit, Westmead Hospital, Australia
- Discipline of Infectious Diseases and Immunology, Faculty of Medicine and Health, Charles Perkins Centre, University of Sydney, Australia
Figures
Figure 1 with 2 supplements
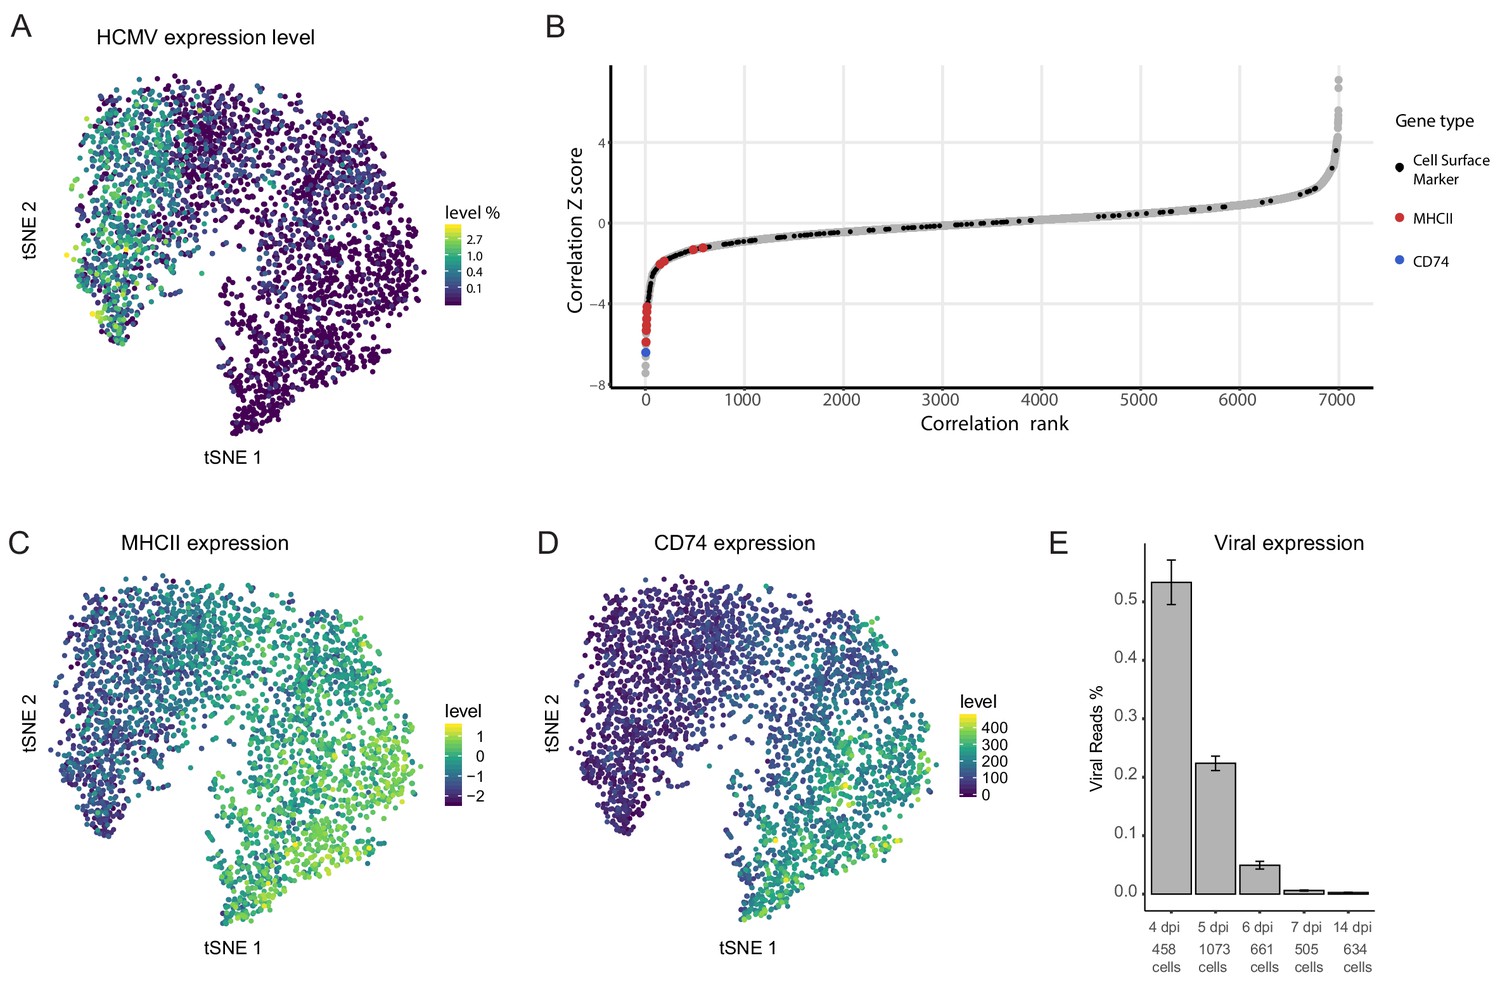
Cellular gene expression co-vary with viral transcript levels.
(A) t-SNE plot of 3416 latently infected CD14+ monocytes based on host and viral gene expression (Shnayder et al., 2018), colored by percentage of HCMV reads per cell. (B) Distribution of Z scores of the Spearman correlation coefficients between host transcript levels and total HCMV transcript levels across a single population of infected CD14+ monocytes. Black dots mark cells surface markers coding transcripts, blue marks CD74 and red marks transcripts of MHCII (isoforms HLA-RB1/HLA-DPB1/HLA-DRA/HLA-DQB1/HLA-DPA1/HLA-DQA1/HLA-DMA/HLA-DRB5/HLA-DQA2 and HLA-DMB, left to right), gray dots mark all other transcripts. (C and D) t-SNE plots of monocytes as presented in A colored coded by their expression levels of MHCII (HLA-RB1/HLA-DPB1/HLA-DRA/HLA-DQB1/HLA-DPA1/HLA-DQA1/HLA-DMA/HLA-DRB5/HLA-DQA2 and HLA-DMB) (C) or CD74 (D) transcripts. (E) Percentage of viral reads measured in all single cells by days post infection (dpi). Error bars represent standard deviation across the single cells.
-
Figure 1—source data 1
Correlation coefficients and Z scores between host transcript level and total HCMV transcript level across single infected CD14+ monocytes.
- https://cdn.elifesciences.org/articles/52168/elife-52168-fig1-data1-v2.xlsx
Figure 1—figure supplement 1
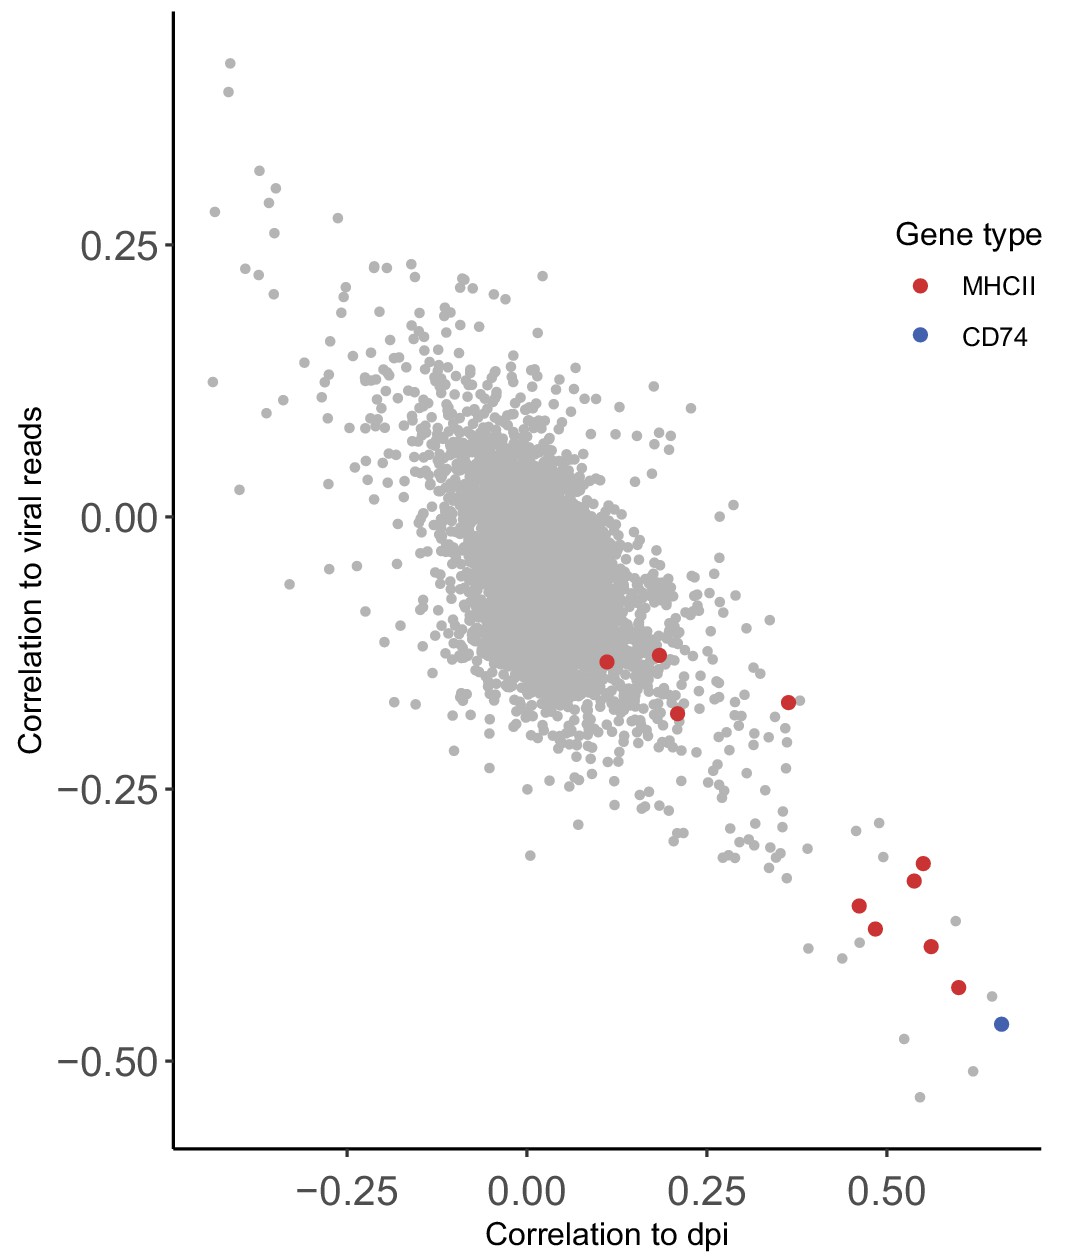
High association between the correlation of host gene expression vs. viral gene expression and host gene expression vs. time post infection.
Scatterplot showing correlation of host transcript levels and total HCMV transcript levels compared to correlation of host transcript levels and time along infection.
Figure 1—figure supplement 2
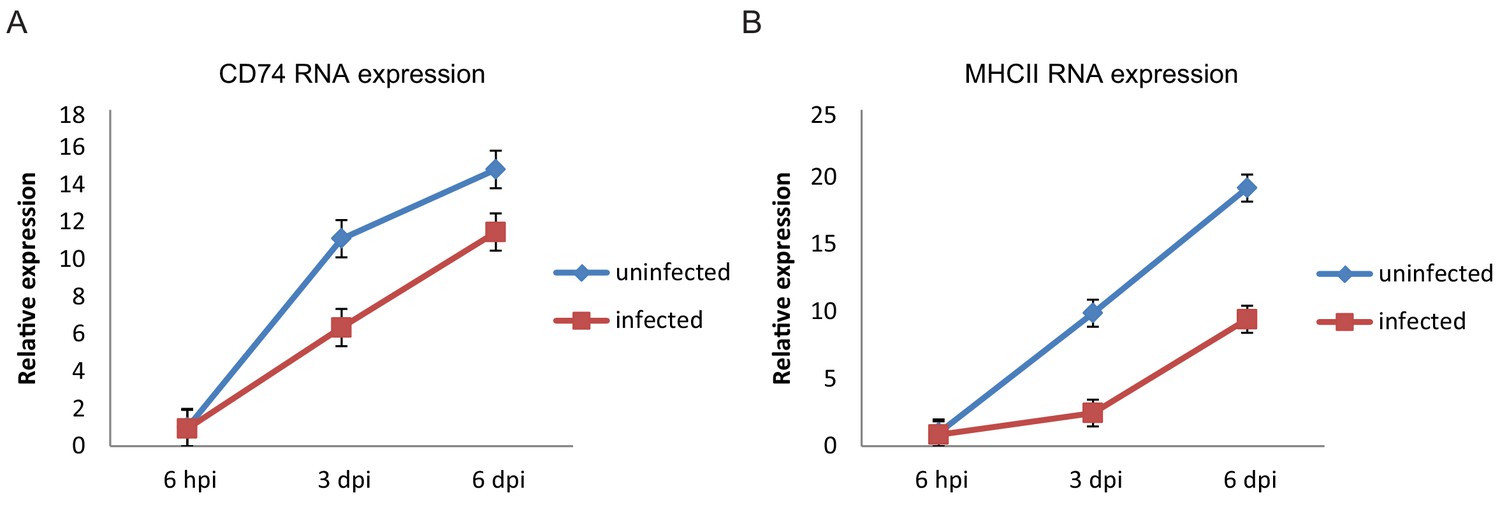
CD74 and MHCII expression increases with culturing time of CD14+ monocytes.
Relative expression levels of CD74 (A) and MHCII (B) in HCMV- infected cells and uninfected cells, measured by RT-qPCR at 6hpi, 3dpi and 6dpi. Error bars reflect standard deviation of 3 measurements. A representative analysis of two independent experiments is shown.
Figure 2 with 4 supplements
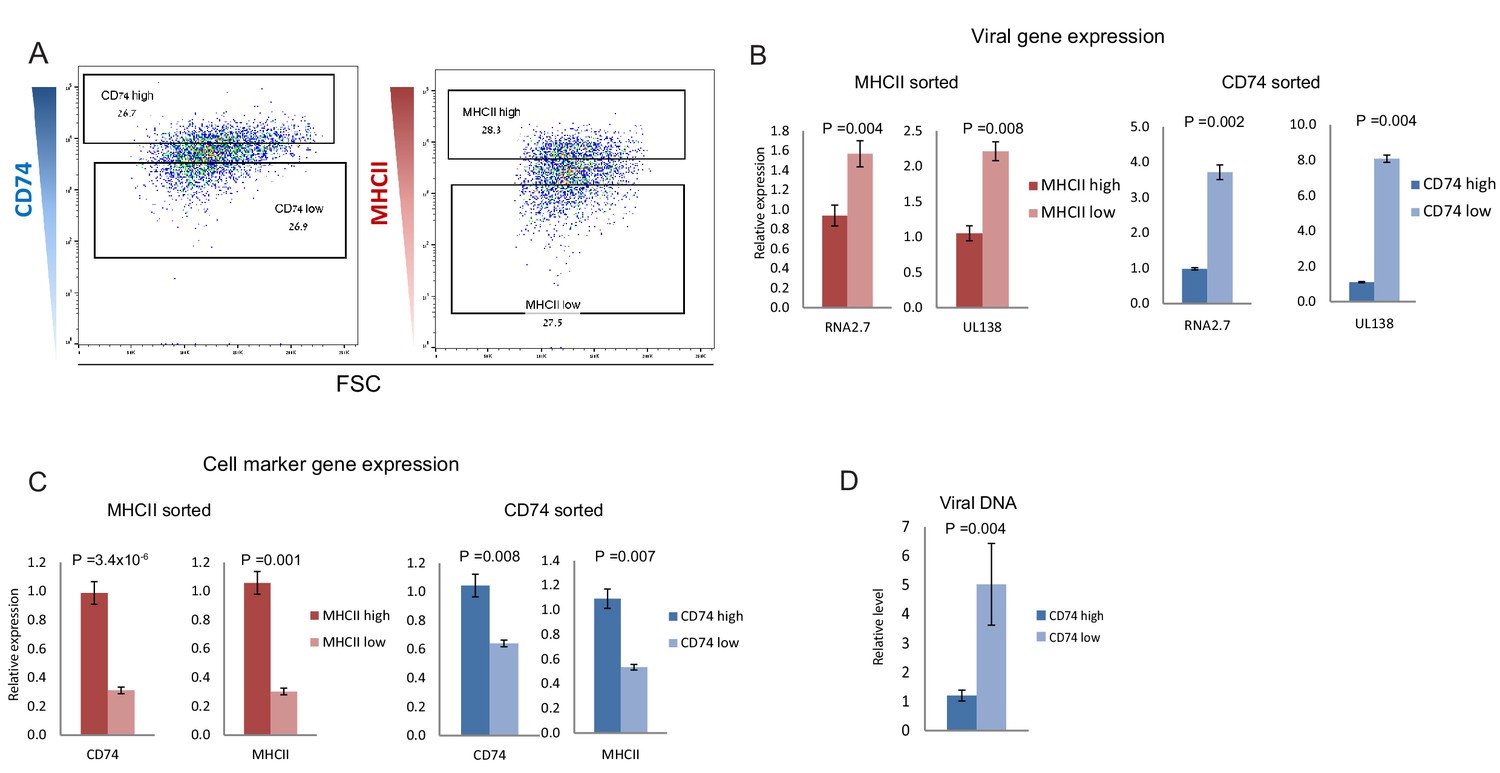
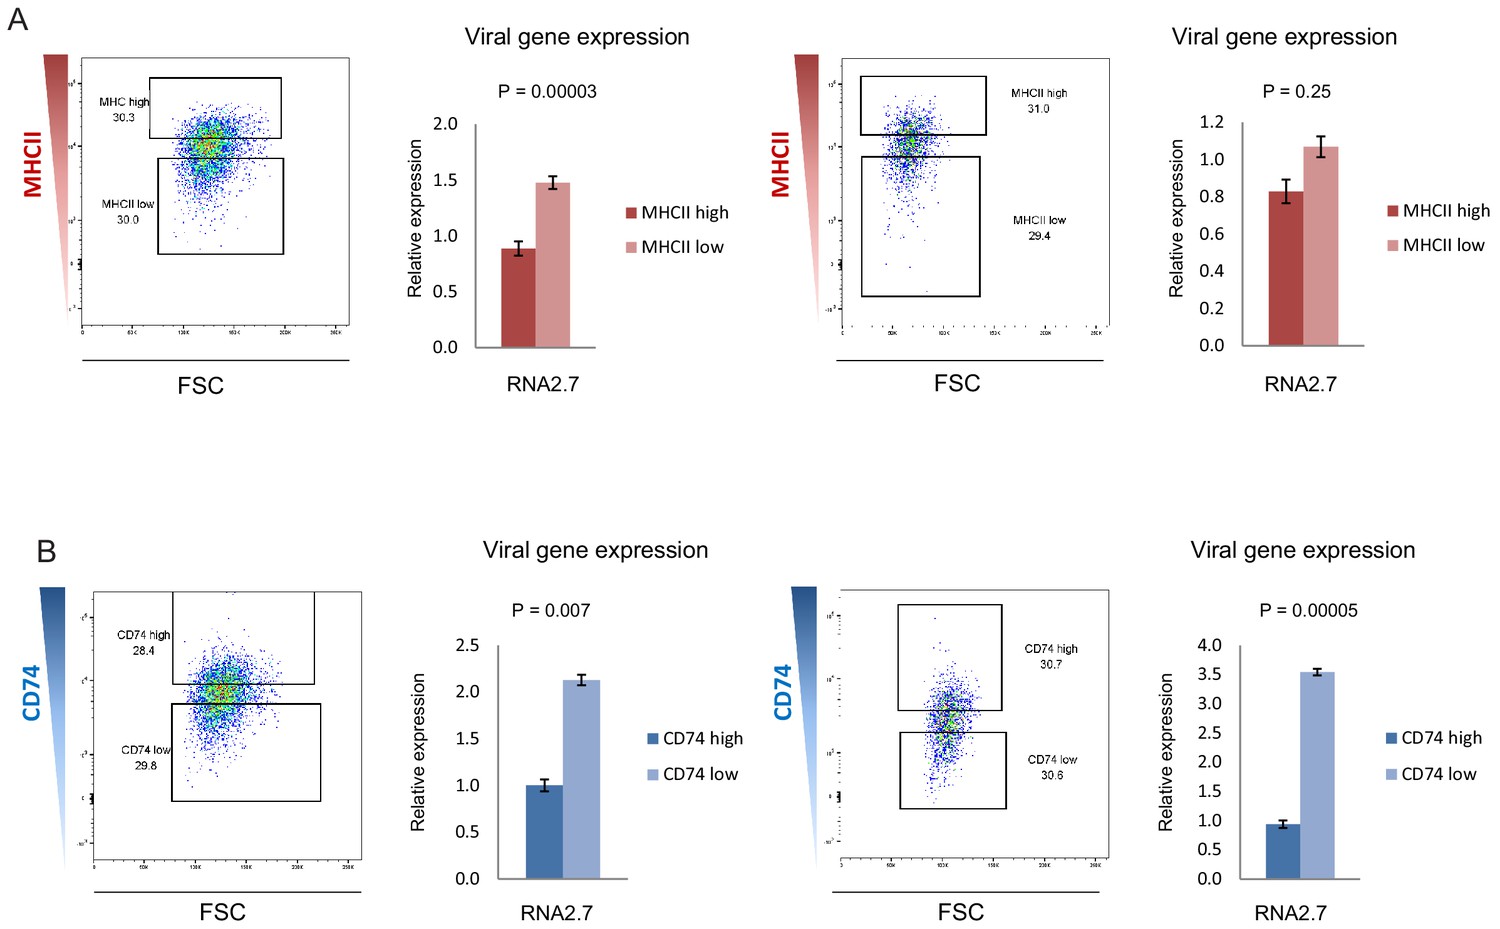
CD74 and MHCII cell-surface levels in HCMV- infected monocytes inversely-correlate with viral transcript levels.
(A) HCMV- infected monocytes were FACS sorted according to cell-surface levels of CD74 or MHCII, at 3dpi. High and low gates were determined as highest and lowest 30% of the population, respectively. (B and C) Relative expression level of the viral transcripts RNA2.7 and UL138 (B) or MHCII and CD74 transcripts (C), as measured by RT-qPCR in HCMV- infected cells, sorted by either MHCII (left) or CD74 (right) cell-surface levels at 3dpi. (D) Relative abundance of viral DNA in HCMV- infected CD74high and CD74low monocytes, at 3dpi as measured by qPCR. Graphs show a representative experiment of 3 biological repeats, error bars reflect standard deviation of 3 measurements. P values as calculated by t-test are indicated.
Figure 2—figure supplement 1
CD74 and MHCII cell-surface levels in HCMV- infected monocytes inversely-correlate with viral transcript levels.
HCMV- infected monocytes were FACS sorted according to cell-surface levels of (A) MHCII or (B) CD74, at 3dpi. High and low gates were determined as highest and lowest 30% of the population, respectively. Two biological repeats are shown. Viral expression levels in cells from each gate were assessed by RT-qPCR measurement of the viral transcript RNA2.7. Error bars reflect standard deviation of 3 measurements. P values as calculated by t-test are indicated.
Figure 2—figure supplement 2
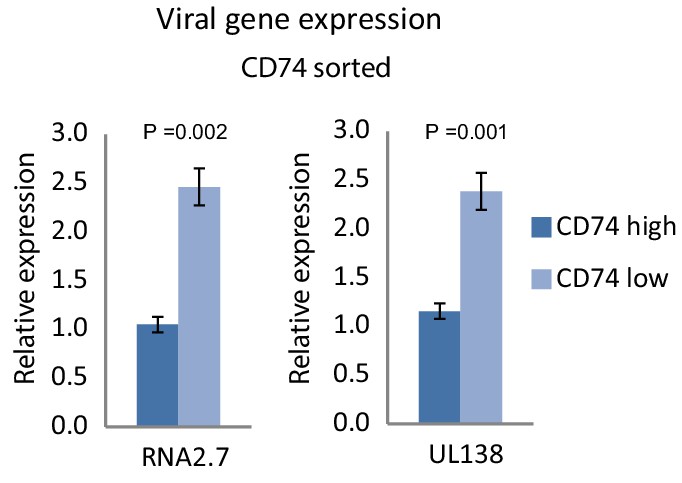
Cell-surface CD74 levels in HCMV- infected monocytes at 6dpi inversely-correlate with viral gene expression.
Expression level of viral transcripts RNA2.7 and UL138, as RT-qPCR measured in HCMV- infected cells, sorted by CD74 cell-surface levels at 6dpi. Error bars reflect standard deviation of 3 technical replicates. P values, as calculated by t-test, are indicated.
Figure 2—figure supplement 3
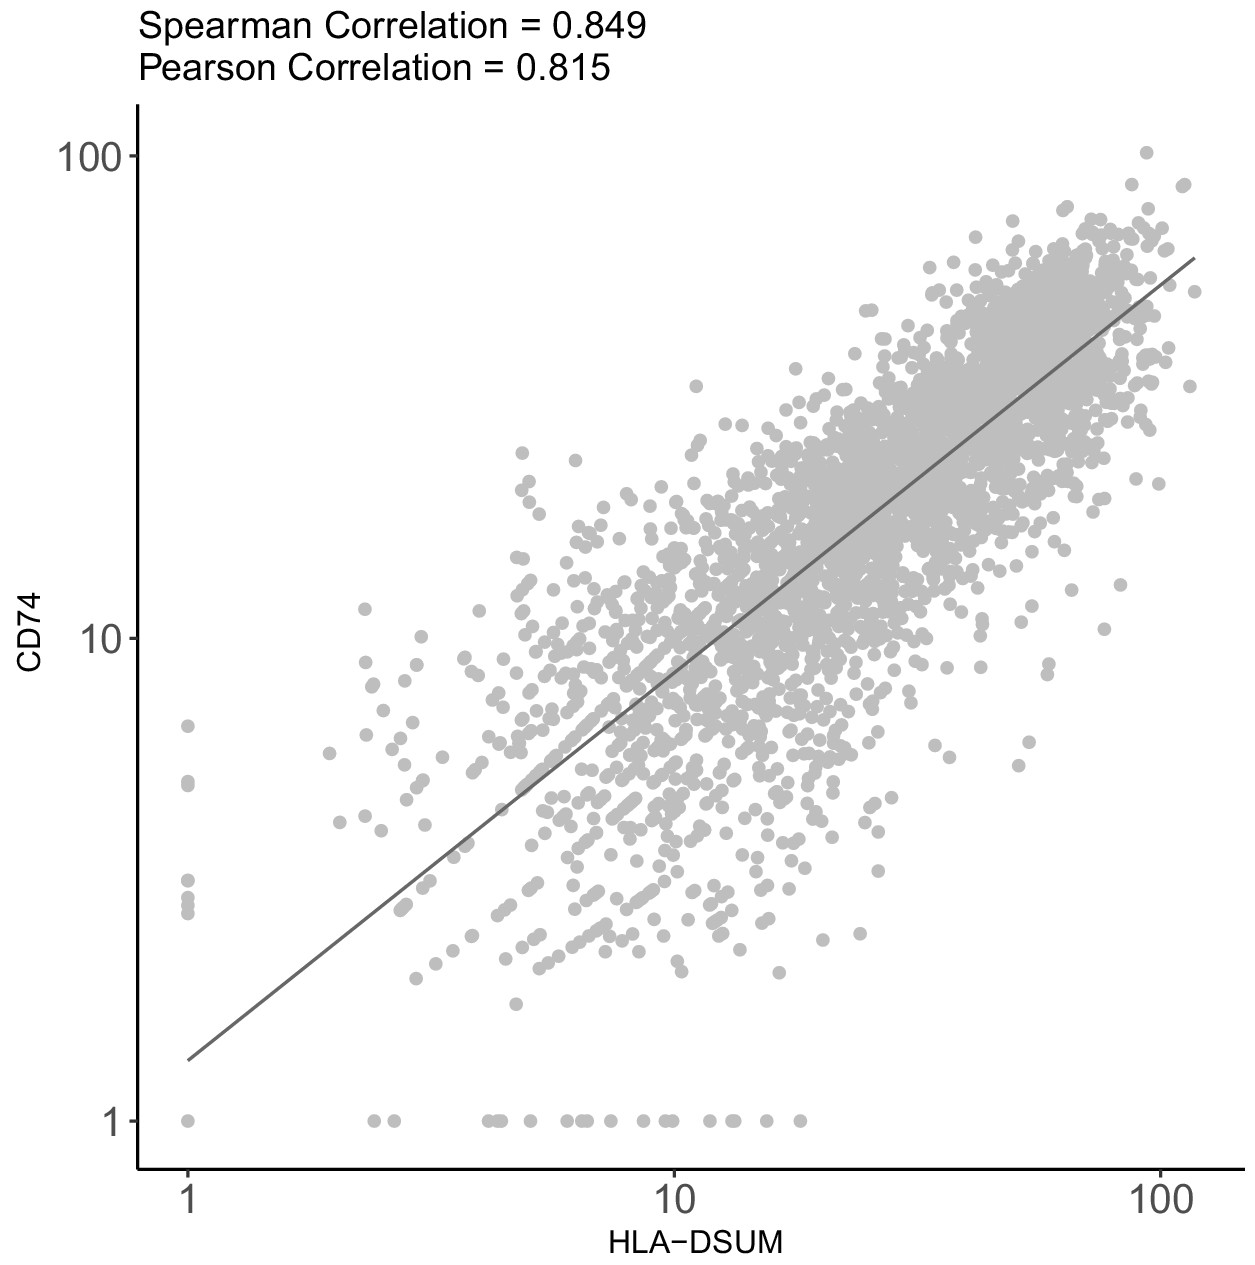
CD74 and MHCII genes are co-expressed in HCMV- infected monocytes.
Scatterplot showing read number of CD74 vs.read number of MHCII genes in single HCMV- infected monocytes according to scRNA-seq data (Shnayder et al., 2018).
Figure 2—figure supplement 4
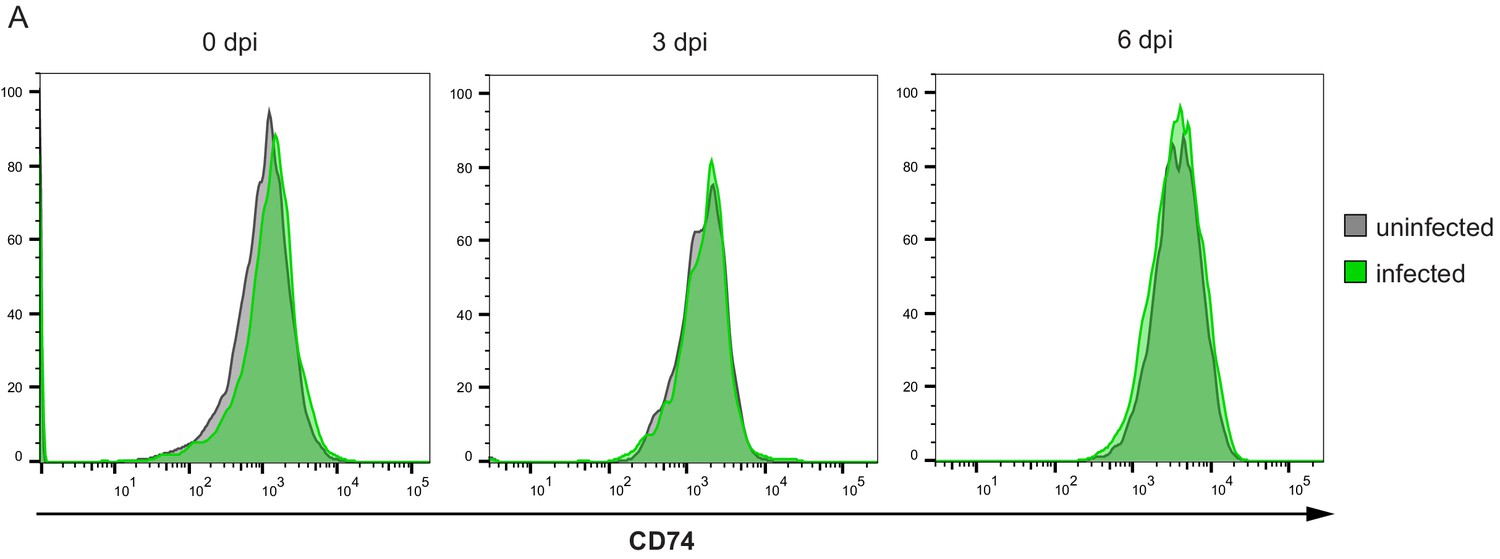
Surface expression distribution of CD74 does not change in uninfected and infected cell populations.
Infected (green) and uninfected (gray) cells were stained for surface expression of CD74 and analyzed by flow cytometry at 0, 3 and 6dpi.
Figure 3

Changes in CD74 expression are induced by infection.
Uninfected primary monocytes were FACS sorted according to cell-surface levels of CD74. Equivalent numbers of CD74high and CD74low cells were infected with HCMV and differences in CD74 RNA levels and in viral DNA and RNA levels between these two cell populations were assessed by qPCR. (A) Relative CD74 transcript levels in CD74high and CD74low cells at 8hpi. (B) Relative abundance of viral DNA in CD74high and CD74low cells at 8hpi and 72hpi. (C) Relative expression level of the viral transcripts UL22A and RNA2.7 in CD74high and CD74low cells as measured at 8hpi and 72hpi. Graphs show a representative experiment of 3 biological repeats, error bars reflect standard deviation of 3 measurements. P values were calculated by t-test.
Figure 4
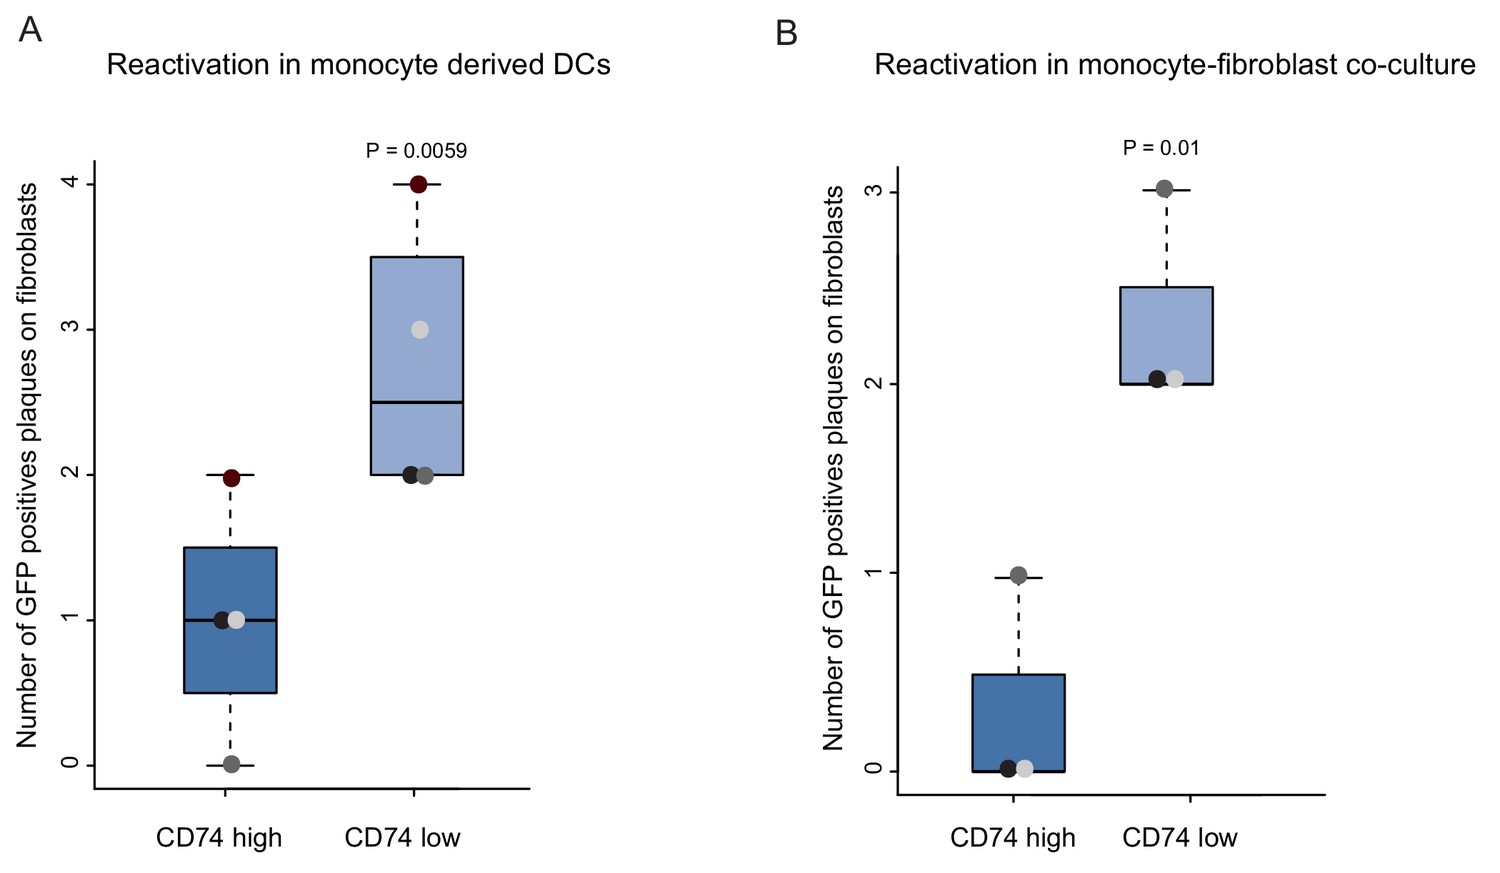
CD74low infected monocytes reactivate more efficiently.
HCMV- infected CD14+ Monocytes were sorted according to cell-surface levels of CD74 at 3dpi. Equivalent numbers of cells were plated and (A) differentiated into DCs followed by co-culture with fibroblasts to quantify reactivation events or (B) directly co-cultured with fibroblasts to induce reactivation. Data ais shown as number of infectious centers formed by CD74high vs. CD74low cells. Means and error bars (reflecting standard deviation) were generated from 4 independent experiments (A) and 3 independent experiments (B). Dot colors indicate sets from the same experiment. P values as calculated by t-test are indicated.
Figure 5 with 2 supplements
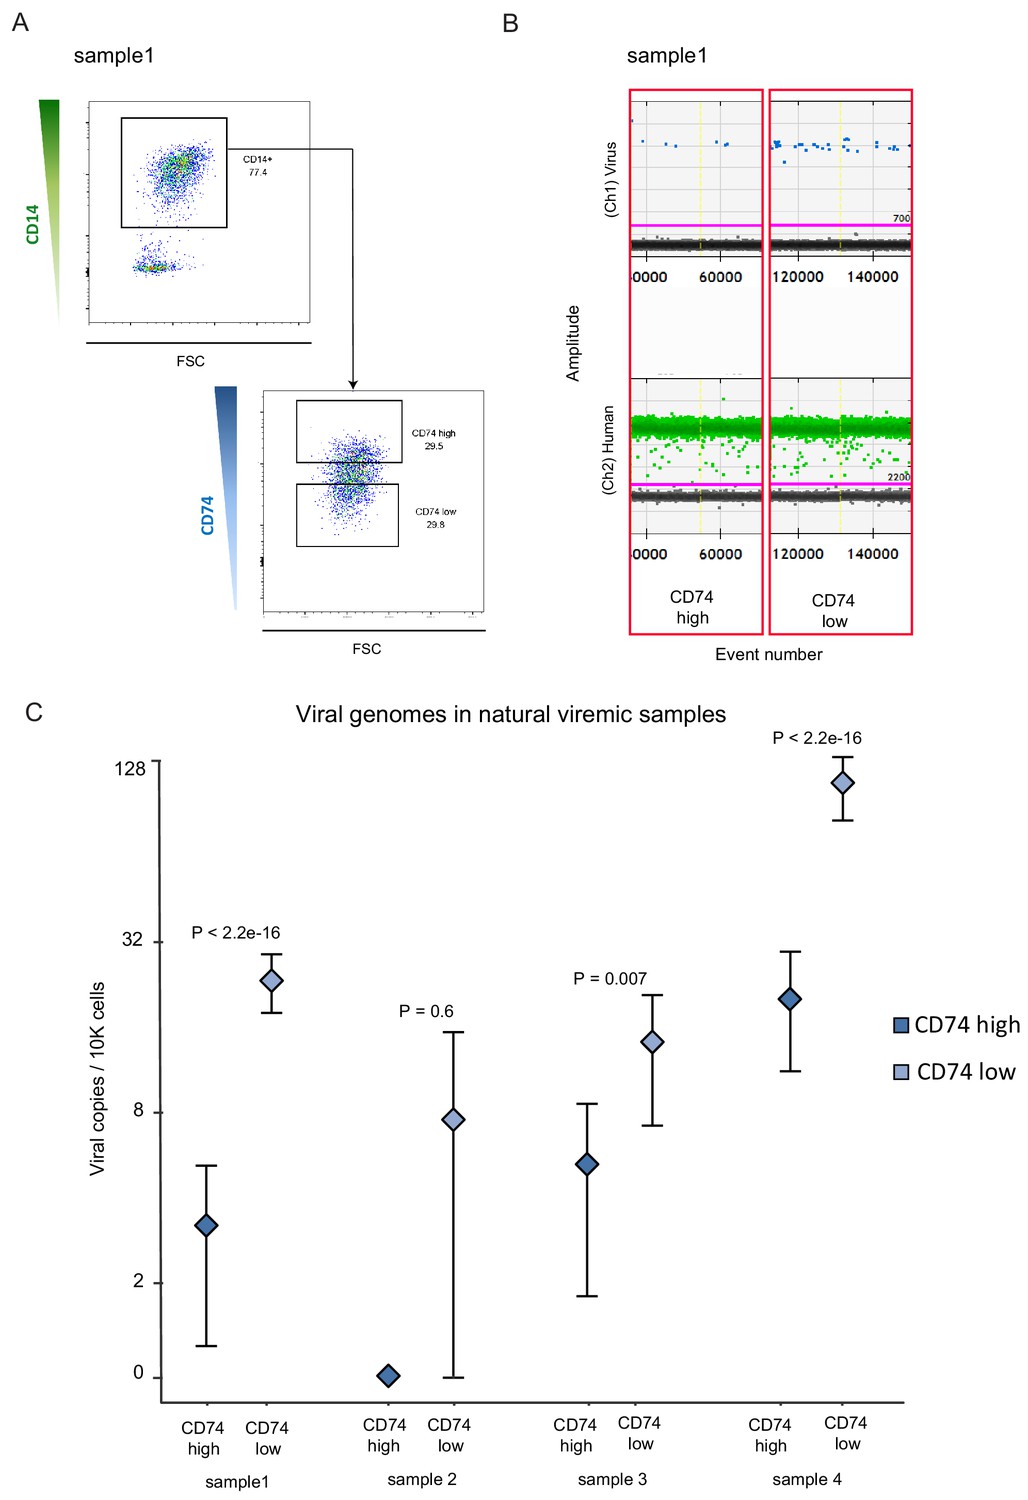
CD74 cell-surface levels allow enrichment of CD14+ monocytes carrying HCMV genomes from viremic patients.
CD14+ monocytes from HSCT recipients with HCMV reactivation were sorted according to CD74 cell-surface levels. In total, 4 samples were tested, originating from 3 different donors (samples 1 and 2 were collected at different time points from the same donor), and viral genome abundance was measured by ddPCR. (A) A representative FACS sort of the cells. The highest and lowest 30% of the population were collected as CD74high and CD74low samples. (B) ddPCR results of two representative replicates from a single sample, separated by yellow vertical line. Upper panel shows detection of viral DNA, lower panel reflects detection of host genomes. The magenta line marks the threshold. (C) Quantification of viral genomes in CD74high and CD74low cells from four different samples, presented as copies per 10,000 cells. Graph reflects mean and 95% CV of poisson distribution, calculated from 5 technical replicates for each donor. P values as calculated by Fisher test are indicated.
Figure 5—figure supplement 1
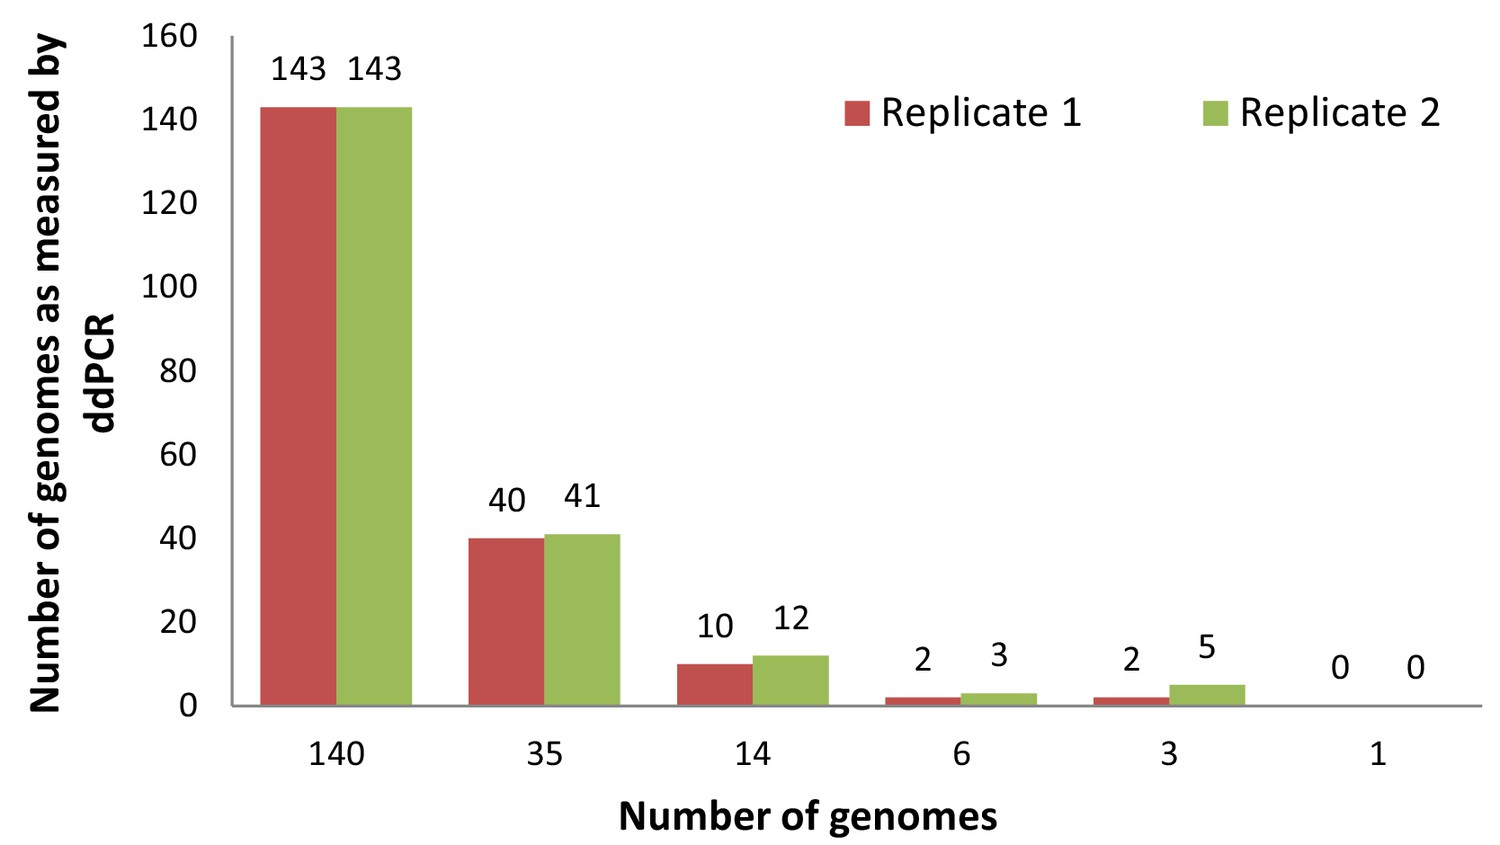
Sensitivity of viral genomes detection by ddPCR.
Standard curve measuring the sensitivity and accuracy of viral DNA detection by ddPCR, using a CMV positive control template in copy number of: 1, 3, 6, 14, 35 and 140. Detection was possible down to 3 copies per sample.
Figure 5—figure supplement 2
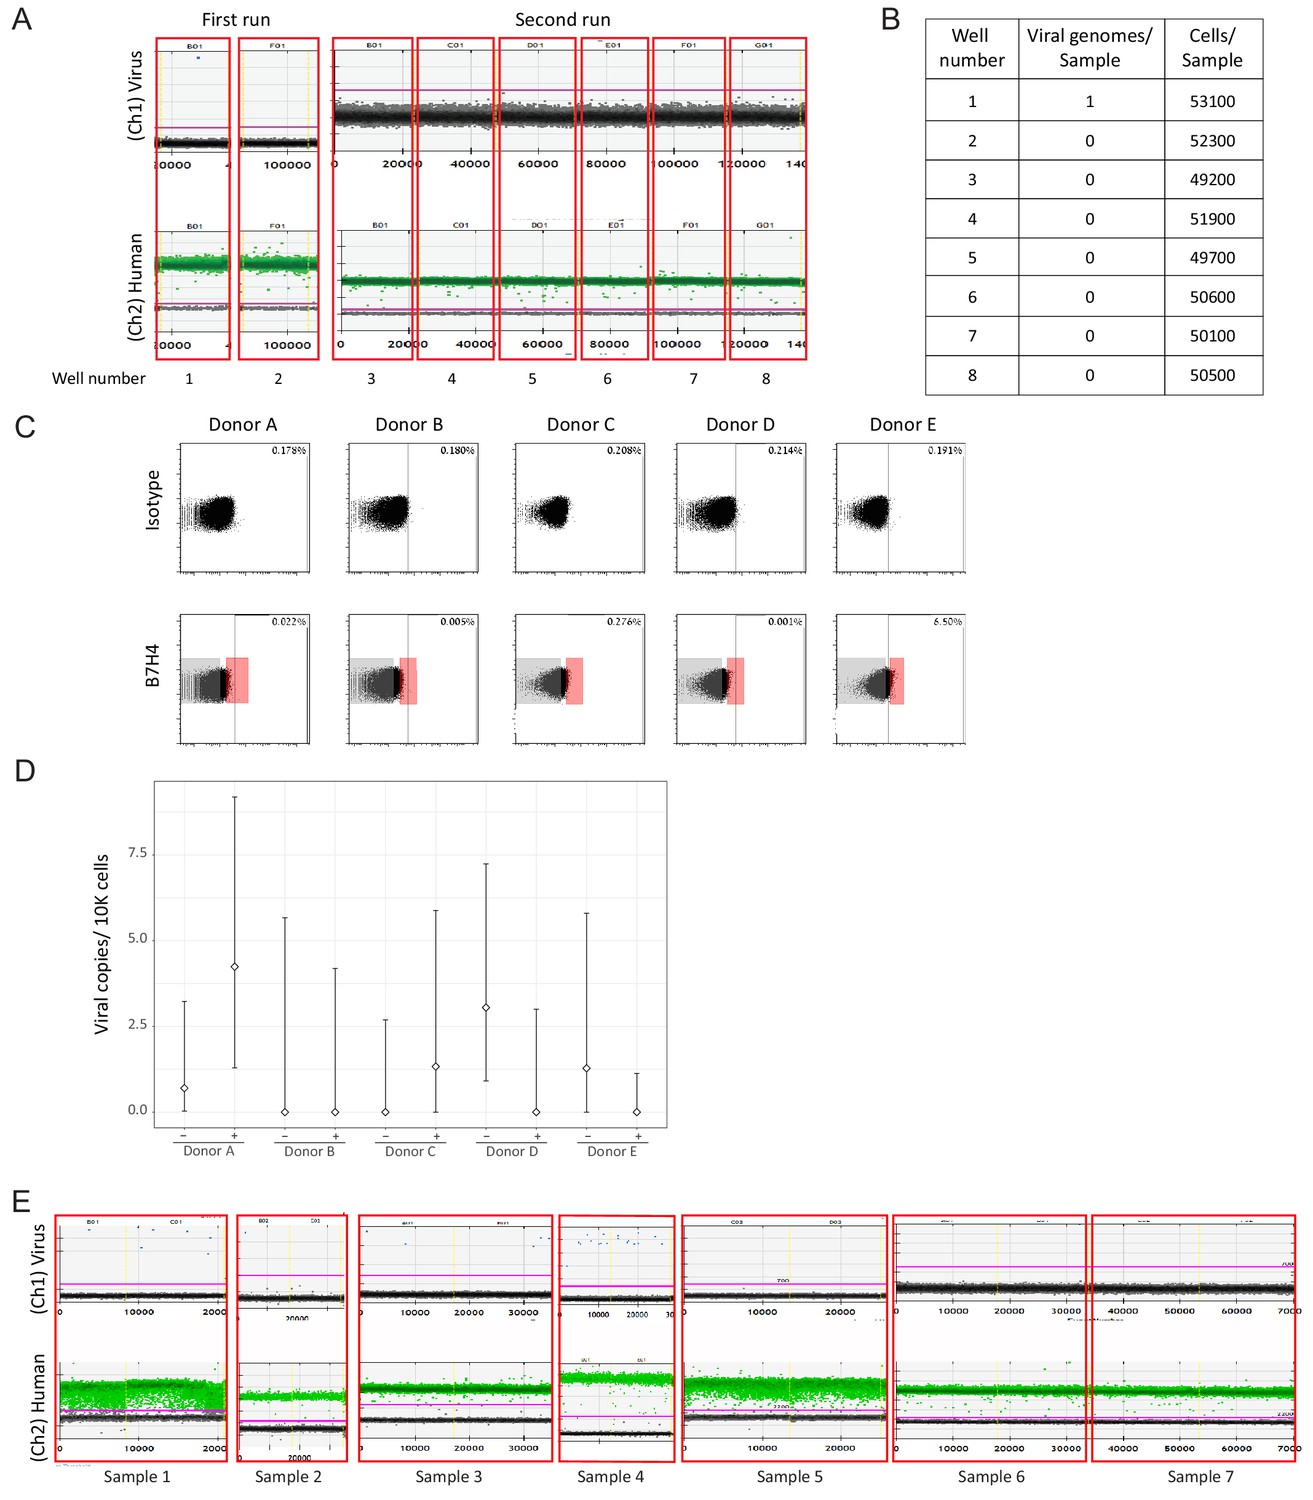
ddPCR analysis of natural samples.
(A) Analysis of samples from a healthy seropositive donor by ddPCR, done in eight replicates. Upper panel shows detection of viral DNA (1 positive event), lower panel reflects detection of host genomes. The magenta line marks the threshold. (B) Summary of all positive events detected in A. (C) Monocytes from 5 healthy seropositive individuals were FACS sorted according to B7H4 levels. A gate defining positive cells, as determined by minimal staining with isotype control (0.2%–0.8%) for each donor, and the sorting gates indicating the top 2% and bottom 70% are shown. (D) Quantification of viral genomes in the bottom 70% and top 2% B7H4 cells, designated as – and +, respectively, from 5 different donors, presented as copies per 10,000 cells. Graph reflects mean and 95% CV of poisson distribution, calculated from 2 to 4 technical replicates for each donor. (E) ddPCR analysis of monocytes from 7 samples originating from 6 HSCT patients with HCMV viremia. Each sample was tested in a duplicate for presence of viral genomes, shown separated by yellow vertical lines. Monocytes from donors that were positive for viral genomes by ddPCR (samples 1–4) were used for CD74 analysis, as shown in Figure 5.
Figure 6 with 2 supplements
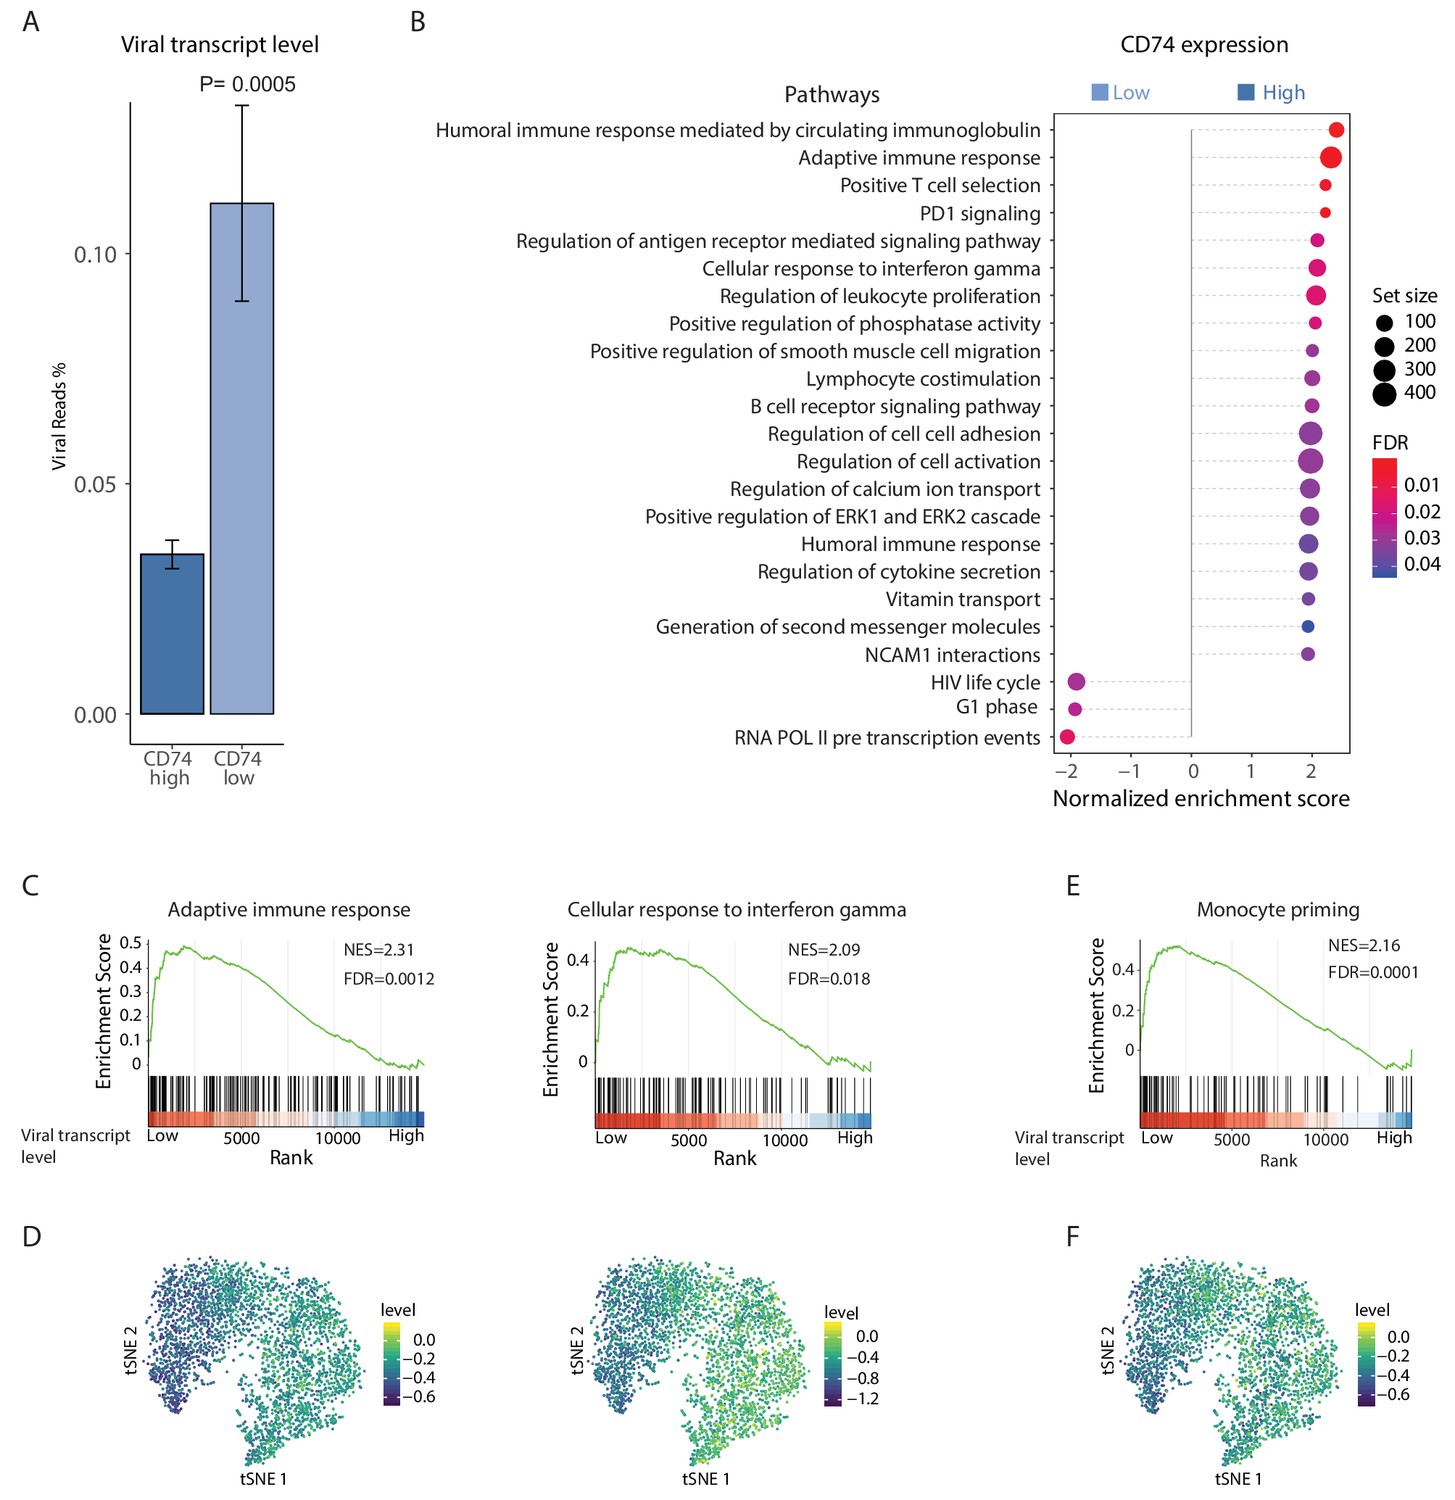
HCMV latency in monocytes is associated with reduced immune-response gene signatures.
RNA-seq was performed on HCMV- infected CD14+ Monocytes that were sorted according to cell-surface levels of CD74 at 3dpi. (A) Normalized viral gene expression in CD74high and CD74low cells. P value, calculated using likelihood ratio test on logistic regression of viral reads, is indicated. (B) Summary of gene set enrichment analysis (GSEA) of differential expressed genes identified in RNA-seq analysis of CD74high and CD74low cells using annotated GO biological processes and Reactome pathways. (C) Representative pathways from GSEA of genes ranked by their differential expression between CD74high and CD74low cells. (D) tSNE plot of scRNA-seq of latent monocytes colored by expression level of the pathways shown in C. (E) Monocyte priming gene set from Velten et al. (2017) analyzed on GSEA. Genes are ranked by their differential expression between CD74high and CD74low monocytes. (F) tSNE plot of scRNA-seq of latent monocytes colored by the expression level of the monocyte priming gene set from Velten et al. (2017).
-
Figure 6—source data 1
DE analysis of RNA-seq on CD74high and CD74low cells.
- https://cdn.elifesciences.org/articles/52168/elife-52168-fig6-data1-v2.xlsx
-
Figure 6—source data 2
GSEA of genes showing higher expression in CD74high compared to CD74low monocytes.
- https://cdn.elifesciences.org/articles/52168/elife-52168-fig6-data2-v2.xlsx
Figure 6—figure supplement 1
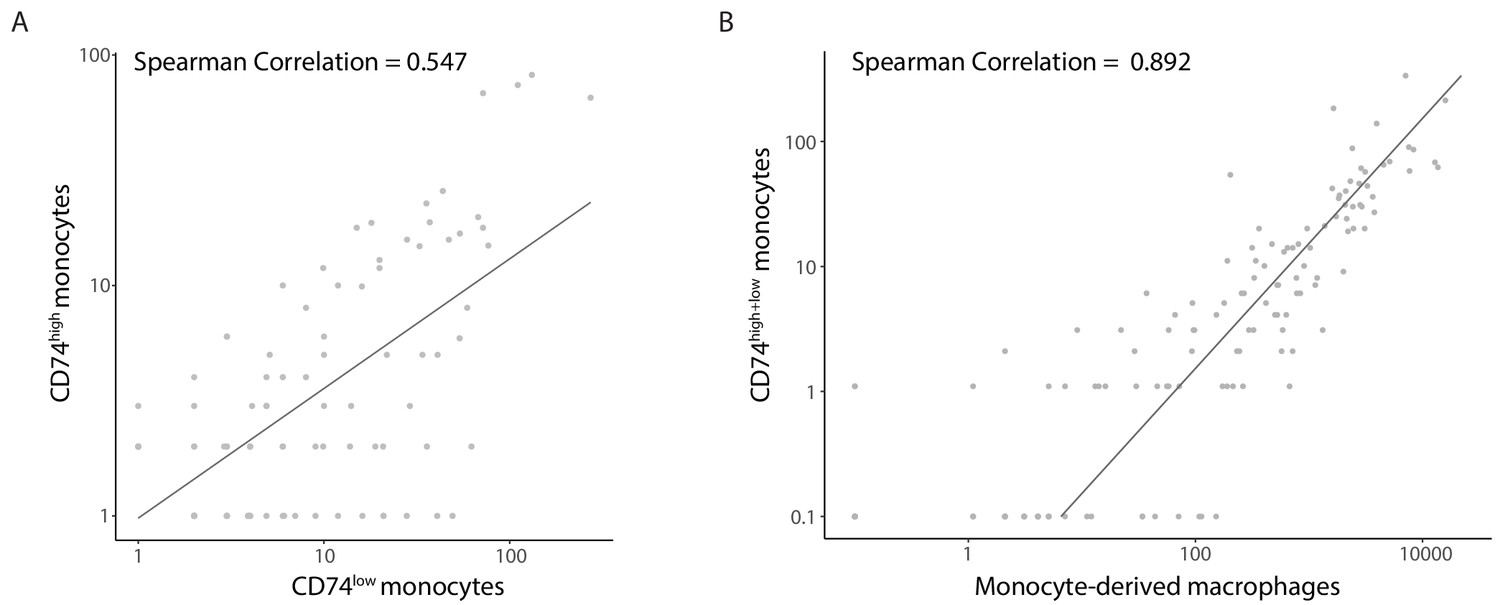
Viral gene expression profile of infected CD14+ monocytes correlates between CD74high and CD74low cells and to late lytic profile.
Scatterplot showing read number of all viral genes in CD74high compared with CD74low cells at 3dpi (A) Scatterplot showing read number of all viral genes in CD74high+CD74low cells at 3dpi compared to lytically infected monocyte-derived macrophages at 4dpi (B).
Figure 6—figure supplement 2
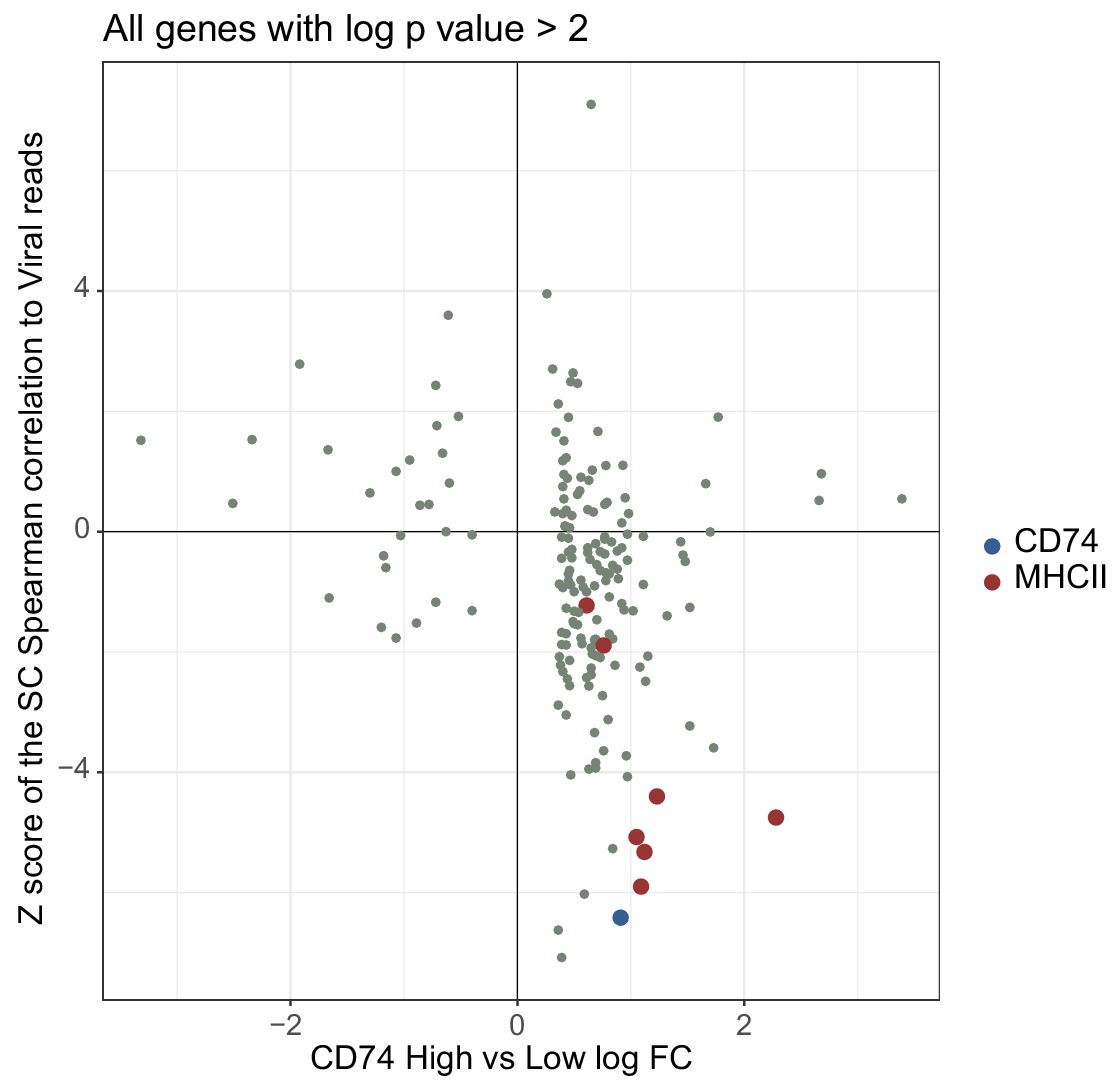
Comparison of changes detected in bulk RNA-seq and scRNA-seq data.
Relationship between the fold changes in RNA-seq of CD74high vs. CD74low infected monocytes and correlation with viral transcript levels in infected monocyte scRNA-seq. Only genes that were differentially expressed in the bulk RNA-seq with p values<0.01 are shown.
Figure 7 with 1 supplement
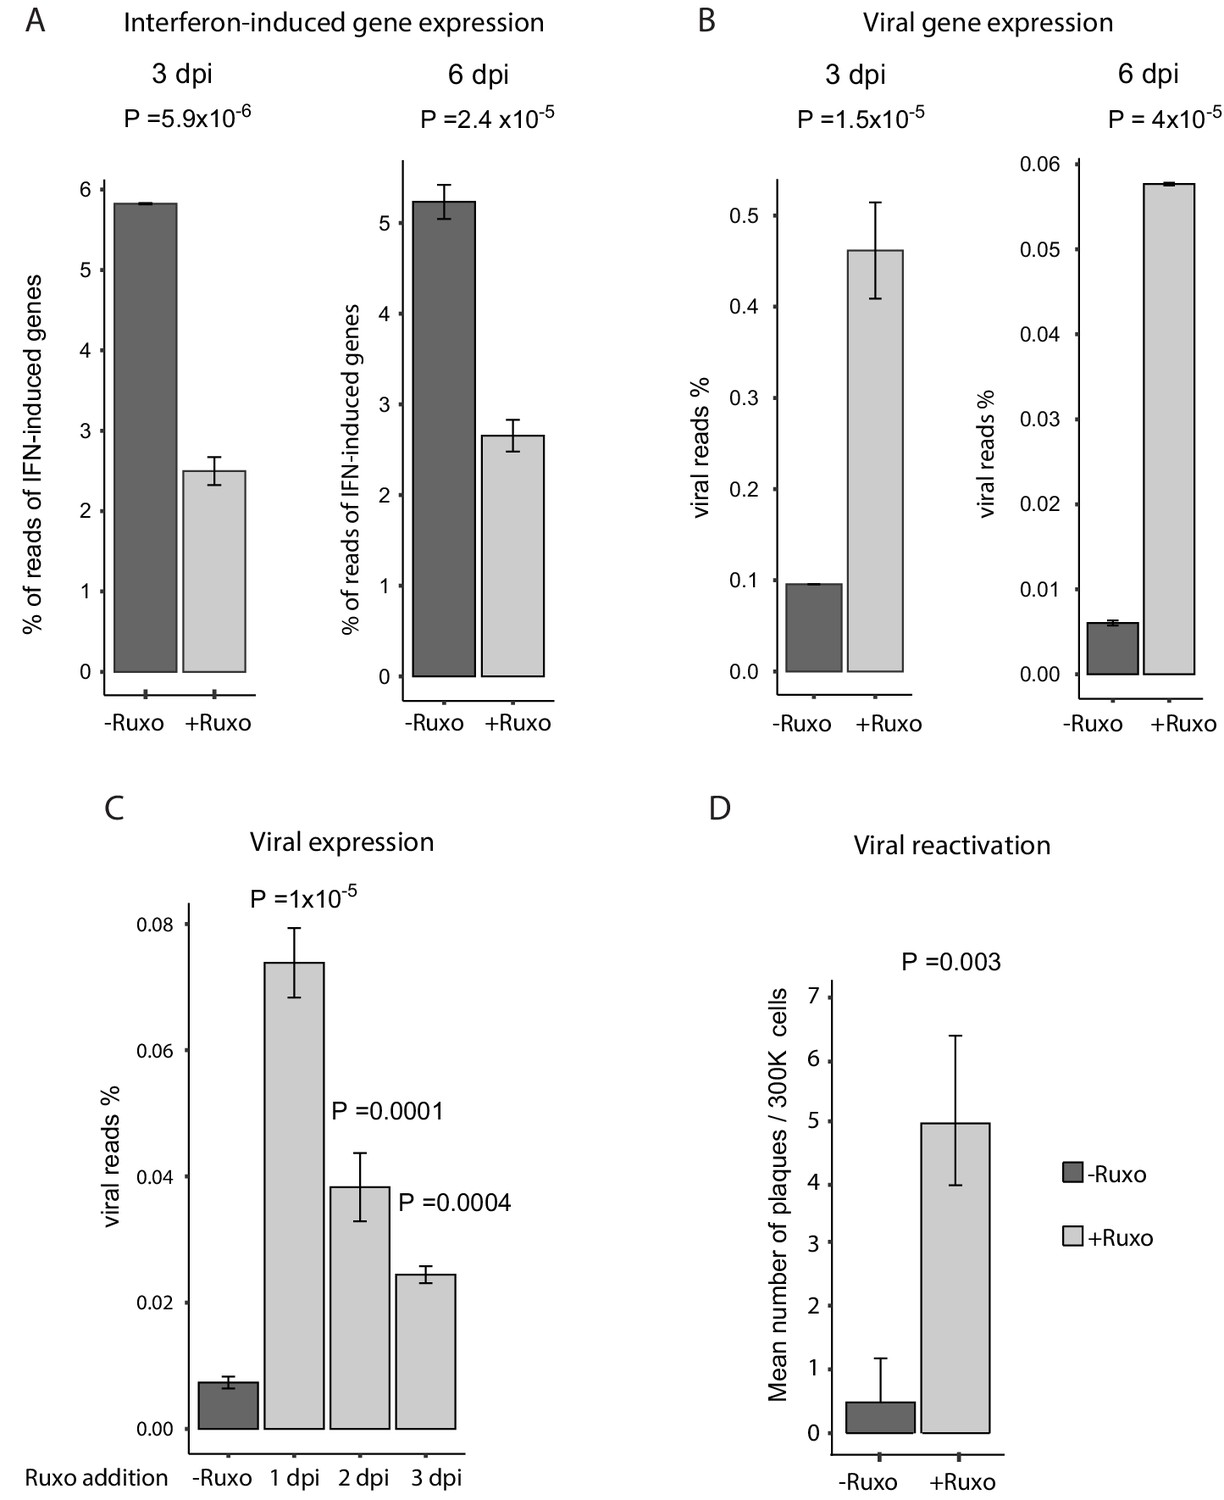
Inhibition of interferon signaling increases viral gene expression and promotes reactivation.
(A and B) HCMV- infected monocytes were treated at 3hpi with interferon signaling inhibitor, ruxolitinib (ruxo), or left untreated, and analyzed for gene expression level, by RNA-seq. (A) Expression of interferon-induced genes at 3dpi (left) and 6dpi (right). (B) Expression of viral genes at 3dpi (left) and 6dpi (right). (C) Viral gene expression in HCMV- infected monocytes that were treated with ruxo at 1, 2, 3dpi or left untreated was measured by RNA-seq at 5dpi. P values for (A-C), calculated using likelihood ratio test on logistic regression of viral reads, are indicated. (D) HCMV- infected monocytes were treated at 3hpi with interferon signaling inhibitor, ruxolitinib (ruxo), or left untreated, and at 6dpi, equivalent numbers of monocytes were co-cultured with fibroblasts to induce reactivation. Viral reactivation in ruxo treated vs. untreated cells was assessed by count of GFP positive plaques formed on the fibroblasts. Means and error bars (reflecting standard deviation) were calculated from 2 independent biological repeats. P value as calculated using likelihood ratio test on Poisson regression of positive plaque events is indicated.
Figure 7—figure supplement 1
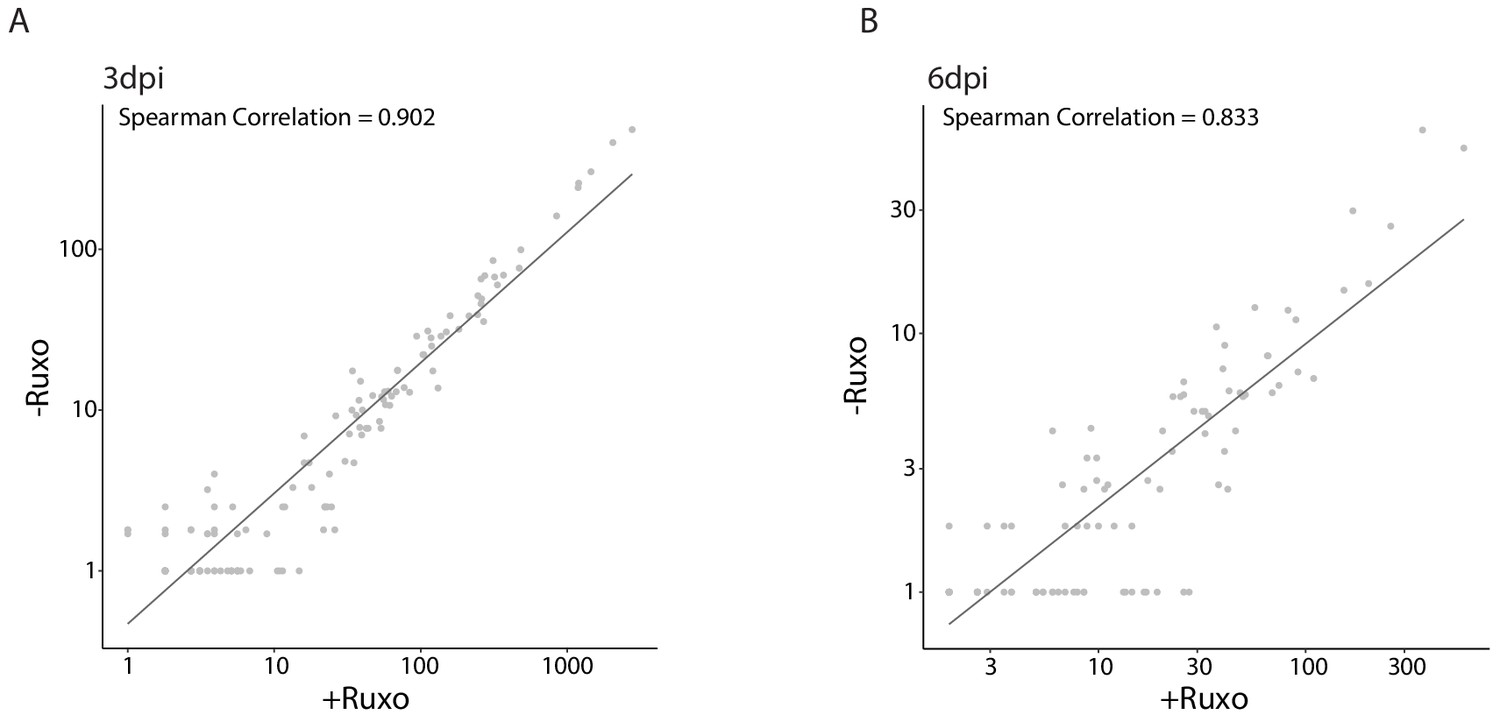
Uniform induction of expression across viral genes by inhibition of interferon signaling.
Scatterplot showing read number of all viral genes in ruxolitinib treated cells compared to untreated cells at (A) 3dpi and (B) 6dpi.
Figure 8
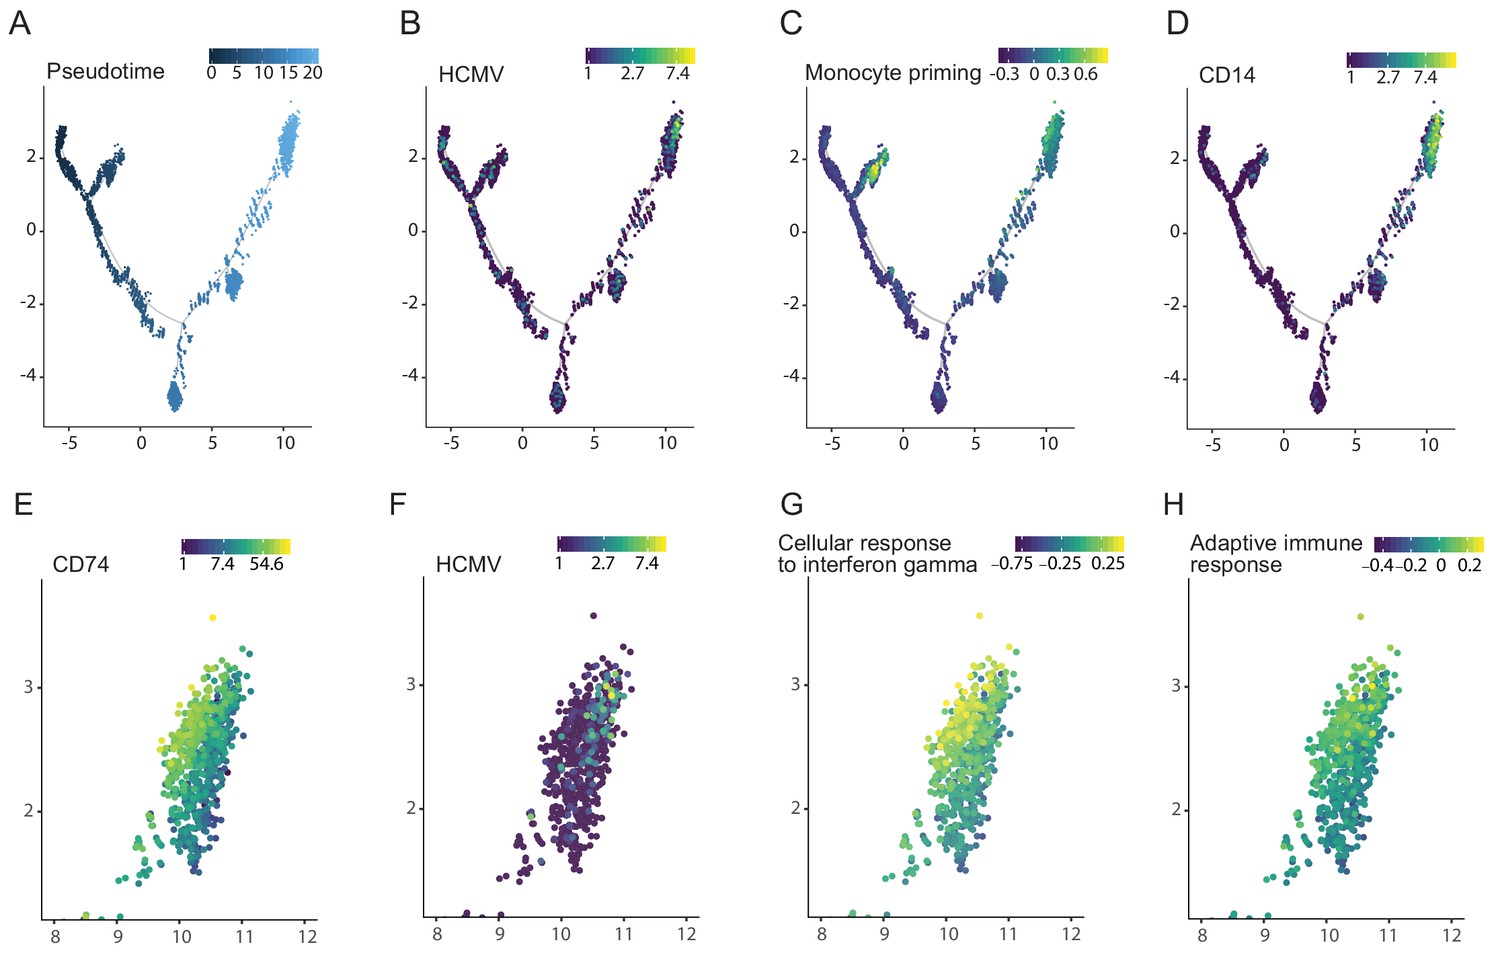
Viral transcript levels in HCMV-infected CD34+ HSPCs is associated with priming towards the monocyte lineage and with reduced immune-response.
Pseudotime trajectory of single cell transcriptomes from HCMV- infected CD34+ HSPCs (n = 7,634, Shnayder et al., 2018) colored by pseudotime (A), viral transcript levels (B), expression of monocyte priming gene signature (Velten et al., 2017) (C) and CD14 expression (D). Zoom-in representation of the pseudotime trajectory in A-D, on the region exhibiting higher viral transcript level (top right group of cells), colored by expression of CD74 (E), viral transcript levels (F), expression level of the cellular response to interferon gamma pathways (G) and of the adaptive immune response pathway (H).
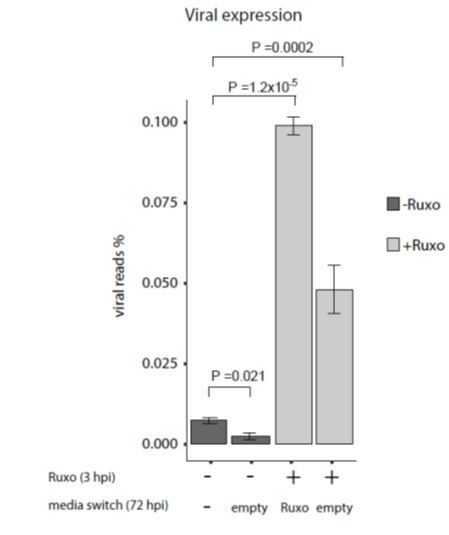
Author response image 1
Tables
Key resources table
| Reagent type (species) or resource | Designation | Source or reference | Identifiers | Additional information |
|---|---|---|---|---|
| Cell line (Homo-sapiens) | Primary human foreskin fibroblasts (HFF) | ATCC | Cat#: CRL-1634 | |
| Strain, strain background (HCMV virus) | TB40E-GFP | O'Connor and Murphy, 2012; Sinzger et al., 2008a | ||
| Antibody | anti-human APC-CD74 (Mouse monoclonal) | Miltenyi Biotec | Clone: 5–329 RRID:AB_2659190 | 1:200 |
| Antibody | anti-human PE-HLA-DR, DP, DQ (recombinant) | Miltenyi Biotec | clone: REA332 RRID:AB_2652177 | 1:200 |
| Antibody | anti-human FITC-CD14 (Mouse monoclonal) | Miltenyi Biotec | Clone: TÜK4 RRID:AB_244303 | 1:200 |
| Antibody | anti-human APC-B7H4 (Mouse monoclonal) | Biolegend | clone: MIH43 RRID:AB_2562580 | 1:200 |
| Antibody (isotype control) | APC-Mouse IgG1 isotype control (Mouse monoclonal) | Biolegend | clone: MOPC-21 RRID:AB_326443 | 1:200 |
| Commercial assay or kit | Human CMV HHV5 kit for qPCR using a glycoprotein B target | PrimerDesign | Cat#: Path-HHV5 | |
| Commercial assay or kit | HEX labeled RPP30 copy number assay for ddPCR | Bio-Rad | Cat#: dHsaCP1000485 | |
| Chemical compound, drug | Ruxolitinib | InvivoGen | Cat#: tlrl-rux | 4 µM |
| Peptide, recombinant protein | Human GM-CSF | Peprotech | Cat#: 300-03-20 | 1,000 U/ml |
| Peptide, recombinant protein | Human IL-4 | Peprotech | Cat#: 200-04-20 | 1,000 U/ml |
| Biological compound (E. coli 0111:B4) | LPS | Sigma | Cat#: L4391 | 500 ng/ml |
| Software, algorithm | R 3.5.1 | https://www.r-project.org/ | RRID:SCR_001905 | |
| Software, algorithm | Monocle 2.10.1 | http://cole-trapnell-lab.github.io/monocle-release/ | 2.10.1 | |
| Software, algorithm | DESeq2 1.22.2 | https://bioconductor.org/packages/release/bioc/html/DESeq2.html | RRID:SCR_015687 | |
| Software, algorithm | enrichplot | https://github.com/GuangchuangYu/enrichplot | ||
| Software, algorithm | GSEA 3.0 | http://software.broadinstitute.org/gsea/index.jsp | RRID:SCR_003199 | |
| Software, algorithm | MSigDB 6.2 | http://software.broadinstitute.org/gsea/index.jsp | RRID:SCR_016863 | Database used for GSEA |
| Software, algorithm | CellRanger 2.0.0 | https://support.10xgenomics.com/single-cell-gene-expression/software/pipelines/latest/what-is-cell-ranger | RRID:SCR_017344 | |
| Software, algorithm | lme4 1.1–21 | https://cran.r-project.org/web/packages/lme4/index.html | RRID:SCR_015654 | R package |
| Software, algorithm | Bowtie2 2.2.9 | http://bowtie-bio.sourceforge.net/bowtie2/index.shtml | ||
| Software, algorithm | Rtsne 0.15 | https://cran.r-project.org/web/packages/Rtsne/index.html | RRID:SCR_016342 | R package |
Additional files
-
Supplementary file 1
ddPCR results of CD14+ monocytes from 7 donors Table showing the summary of ddPCR analysis of 8 samples from 7 healthy HCMV seropositive donors.
- https://cdn.elifesciences.org/articles/52168/elife-52168-supp1-v2.xlsx
-
Supplementary file 2
Correlation coefficients between CD74high enriched pathways (Figure 6B) and total HCMV transcript level across single infected CD14+ monocytes.
- https://cdn.elifesciences.org/articles/52168/elife-52168-supp2-v2.xlsx
-
Transparent reporting form
- https://cdn.elifesciences.org/articles/52168/elife-52168-transrepform-v2.pdf
Download links
A two-part list of links to download the article, or parts of the article, in various formats.
Downloads (link to download the article as PDF)
Open citations (links to open the citations from this article in various online reference manager services)
Cite this article (links to download the citations from this article in formats compatible with various reference manager tools)
Single cell analysis reveals human cytomegalovirus drives latently infected cells towards an anergic-like monocyte state
eLife 9:e52168.
https://doi.org/10.7554/eLife.52168


