Structural color in Junonia butterflies evolves by tuning scale lamina thickness
- Department of Integrative Biology, University of California, Berkeley, United States
- Department of Materials Science and Engineering, University of California, Berkeley, United States
- California Institute for Quantitative Biosciences, University of California, Berkeley, United States
- Marine Biological Laboratory, United States
Figures
Figure 1 with 1 supplement

The lamina of a typical butterfly scale functions as a thin film reflector.
(A) Colorized helium ion micrograph of a nymphaline scale, with a window milled using a gallium focused ion beam. Inset at higher magnification, with labels for general architectural components of a scale (R = ridges, r = crossribs, L = lamina). (B) Diagram of reflection and refraction in a chitin thin film. White light enters, reflections are produced at each surface of the film, and reflections of select wavelengths remain in phase as a function of film thickness (T). (C) Experimental disruptions of wing color are associated with altered lamina thickness. In J. coenia, artificial selection for blue color increased lamina thickness in cover scales. In an optix mosaic knockout mutant, certain wing regions have similar thickness increases. This trend recapitulates natural variation in J. evarete, where blue butterfly scales have thick laminae relative to scales from a brown individual. Boxplots show median and inner quartiles, whiskers extend to 1.5 times the interquartile range, outliers are shown as points, and notches show 95% confidence interval of the median. For wild-type and selected J. coenia cover and ground scales, N = 3 individuals and 20–60 measures from different lateral and distal positions within 4–11 scales. J. evarete and optix mutant data are from single individuals, with minimum N = 21 measures from three scales. (** nested ANOVA p=0.00157) (D) Wild-type J. coenia. (E) Blue artificially selected J. coenia. (F) J. evarete.
Image E provided by Edith Smith
-
Figure 1—source data 1
Thickness measurements for the box plot in Figure 1C.
- https://cdn.elifesciences.org/articles/52187/elife-52187-fig1-data1-v1.csv
Figure 1—figure supplement 1
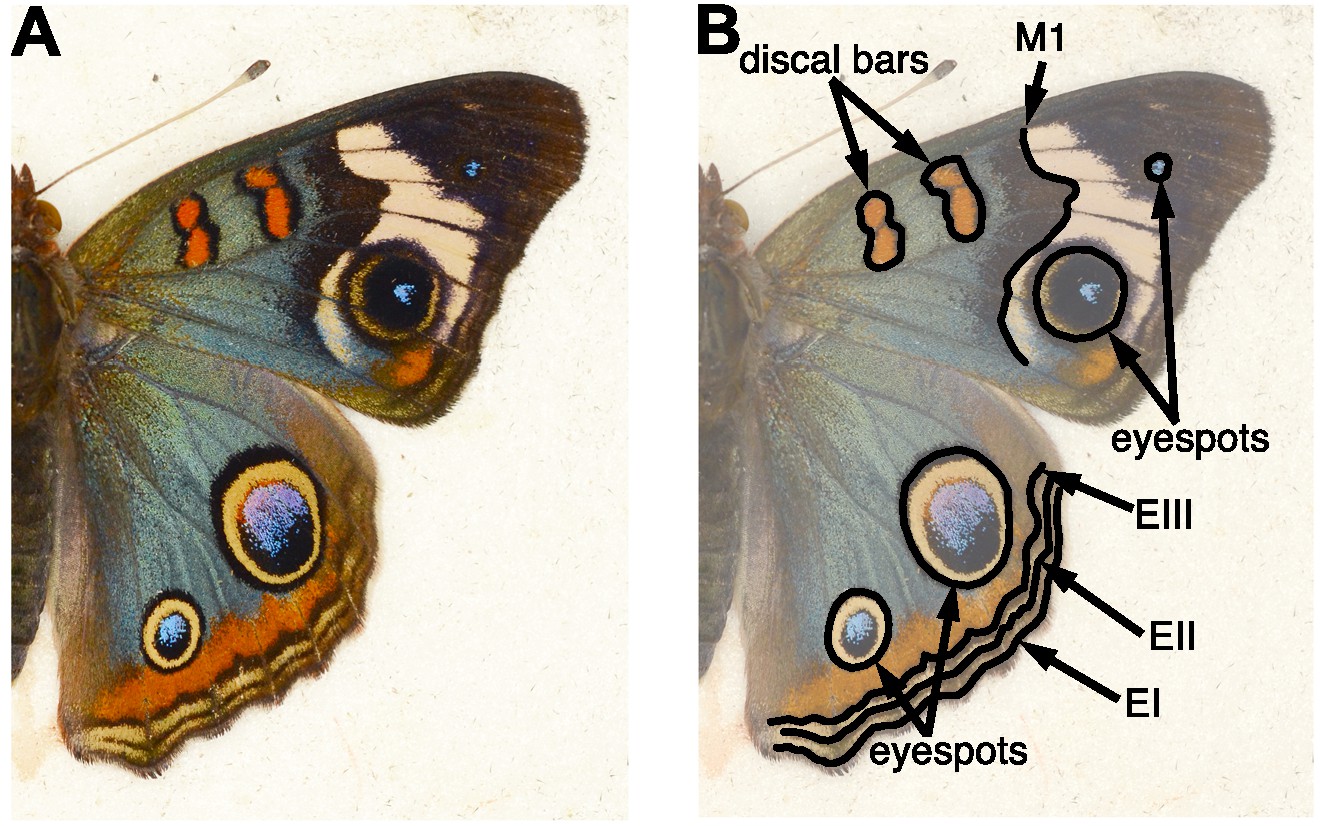
Wing patterning in selected blue J. coenia.
(A) The artificially selected blue phenotype in J. coenia includes much of the dorsal wing surfaces. (B) Pattern elements of the nymphalid ground plan (Nijhout, 1991), which delineate the boundaries of blue regions, are labeled: discal bars, distal band of central symmetry system (M1), eyespots, parafocal element (EIII), and marginal and submarginal bands (EI, EII).
Figure 2 with 1 supplement
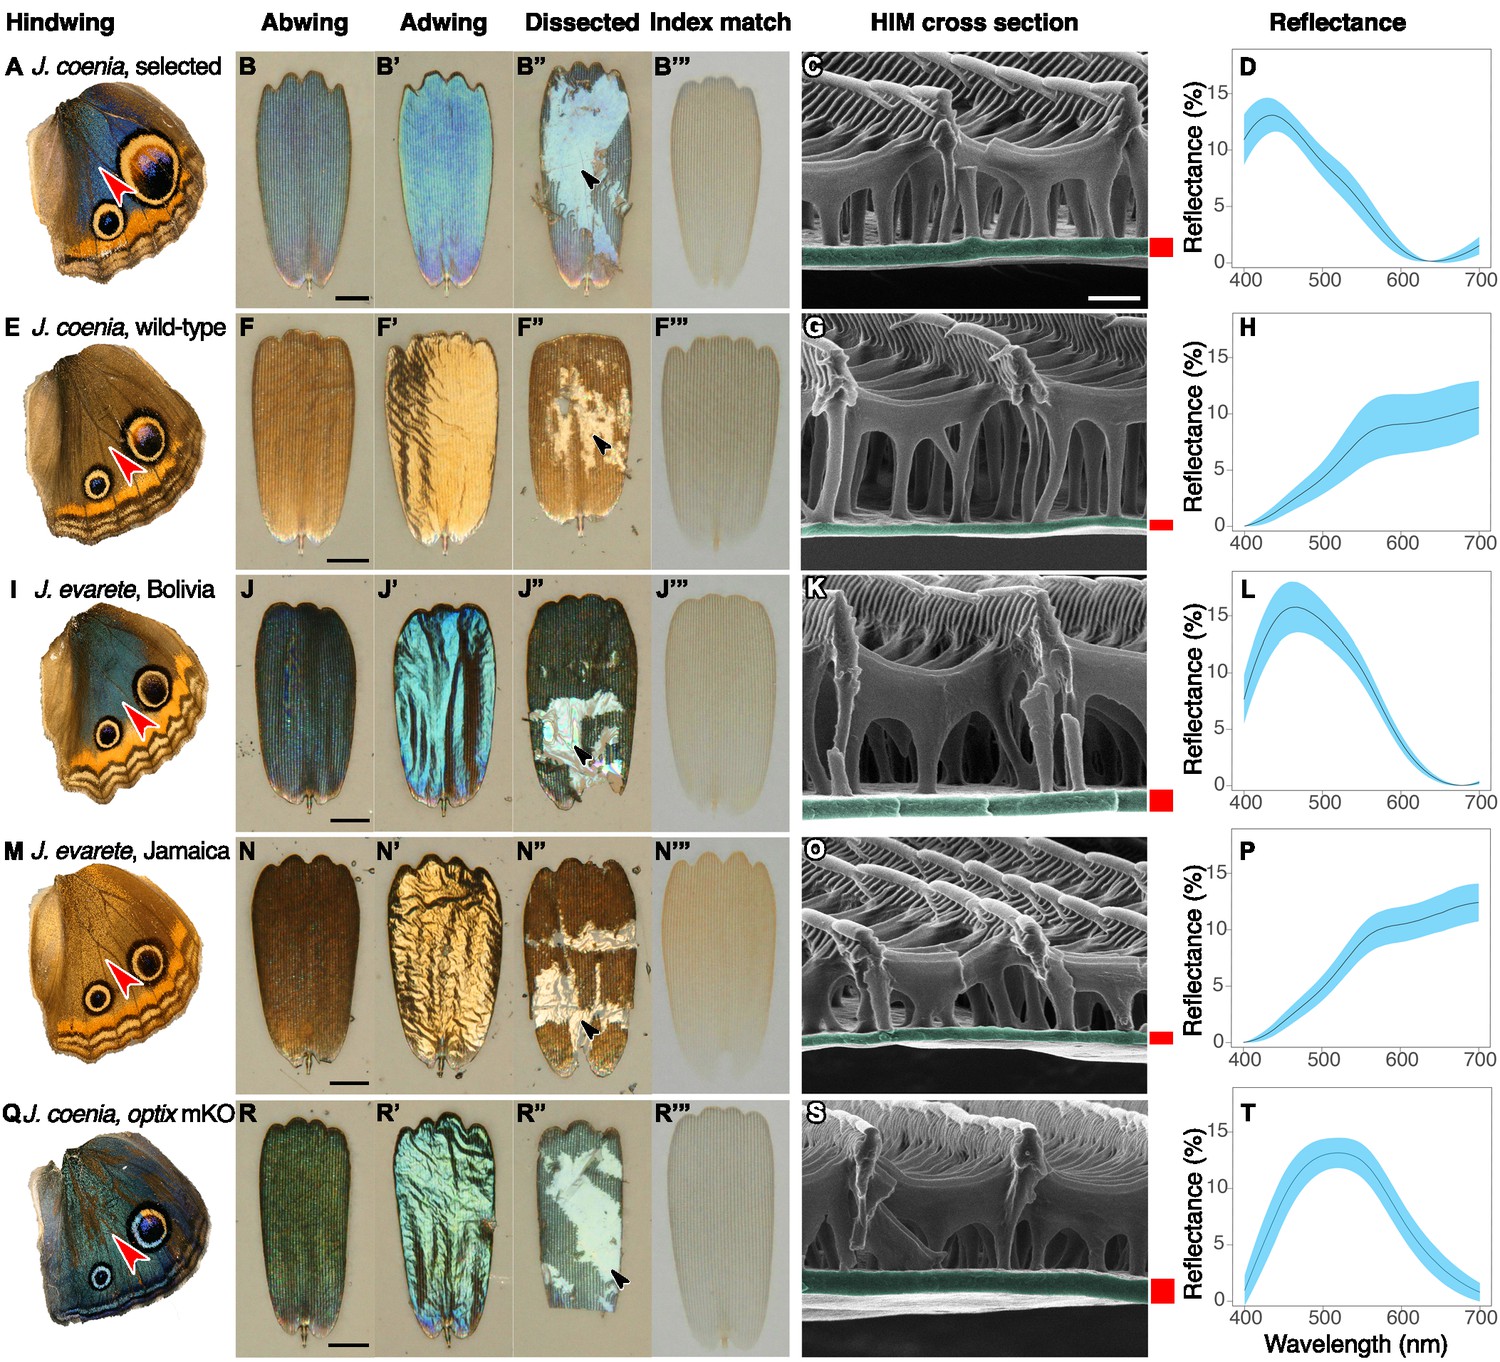
Structure and color of Junonia cover scales.
(A–D) Artificially selected blue J. coenia. (E–H) Wild-type J. coenia. (I–L) J. evarete, blue male from Bolivia. (M–P) J. evarete, brown male from Jamaica. (Q–T) optix mosaic knockout mutant (mKO) in J. coenia. (A,E,I,M,Q) Dorsal hindwing, red arrowhead indicates the characterized scale’s location. (B,F,J,N,R) Scale in the orientation it would occupy on the wing, showing the abwing surface of the cover scale. Black scale bars are 25 µm. (B’,F’,J’,N’,R’) Adwing surface of cover scale, showing the underside of the lamina. (B”,F”,J”,N”,R”) Dissected scale with arrow showing regions where all ridges and crossribs are removed to expose the bare lamina. The lamina is sufficient to create iridescent blue and gold structural colors. (B”’,F”’,J”,N”’,R”’) Scale immersed in fluid with a refractive index matched to chitin, thus eliminating reflection to show only pigmentary color. Blue and brown scales have comparable amounts of a brown pigment. (C,G,K,O,S) Helium ion micrograph of cross-sectioned scale. Each lamina is colorized, with approximate thickness indicated by an adjacent red bar (precise measurements were taken at sites chosen as in Materials and methods). White scale bar is 500 nm and applies to all HIM images. (D,H,L,P,T) Reflection spectra for the adwing surface of disarticulated scales. Solid line is the mean spectrum, and blue envelope is one standard deviation; minimum N = 3 scales per graph.
-
Figure 2—source data 1
Processed reflectance spectra.
- https://cdn.elifesciences.org/articles/52187/elife-52187-fig2-data1-v1.txt
Figure 2—figure supplement 1
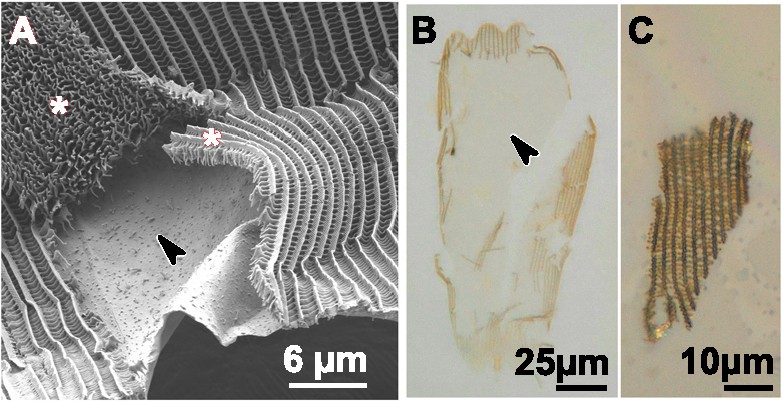
Detailed characterization of dissected scales.
(A) HIM image of a partially dissected scale. The arrow shows the exposed lamina and asterisks show detached swaths of all other scale components, that is ridges and crossribs. (B) Dissected cover scale from artificially selected J. coenia immersed in index-matched oil. Pigments are not primarily localized within the exposed lamina, shown by the arrowhead. (C) A swath of ridges and crossribs removed intact from the scale in panel B. This piece of lamina-less scale is not blue.
Figure 3
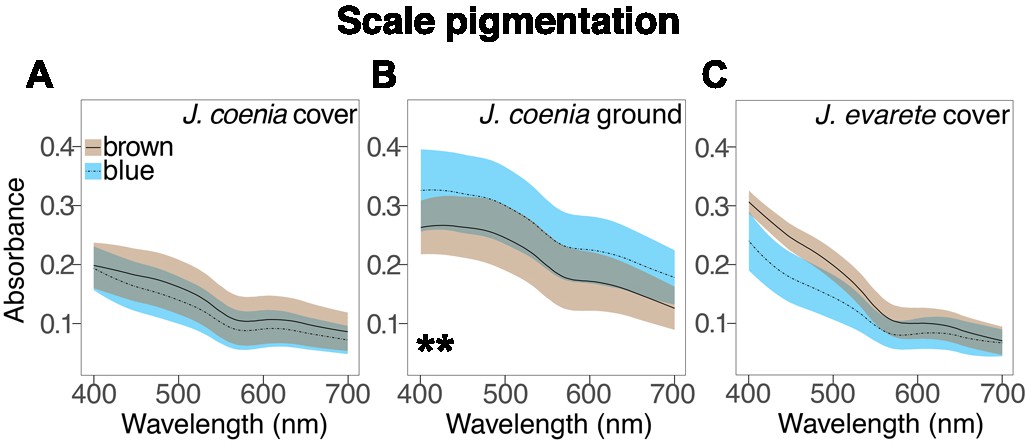
Absorbance spectra show the effect of artificial selection on scale pigmentation.
(A) Absorbance measures in J. coenia wild-type (brown), and artificially selected (blue) cover scales show that both have comparable pigmentation (nested ANOVA, Figure 3—source data 1). (B) Absorbance of selected J. coenia ground scales is increased relative to brown wild-type scales (nested ANOVA, Figure 3—source data 1). (C) Absorbance of both blue and brown J. evarete cover scales is similar to pigmentation in J. coenia cover scales. Plots show mean spectra with envelope of one standard deviation, minimum N = 3 individuals and 15 scales for J. coenia, and N = 1 individual and six scales per J. evarete sample. **p<0.01 at wavelengths tested in Figure 3—source data 1.
-
Figure 3—source data 1
Results of statistical tests on absorbance differences.
- https://cdn.elifesciences.org/articles/52187/elife-52187-fig3-data1-v1.xlsx
-
Figure 3—source data 2
Processed absorbance spectra.
- https://cdn.elifesciences.org/articles/52187/elife-52187-fig3-data2-v1.xlsx
Figure 4
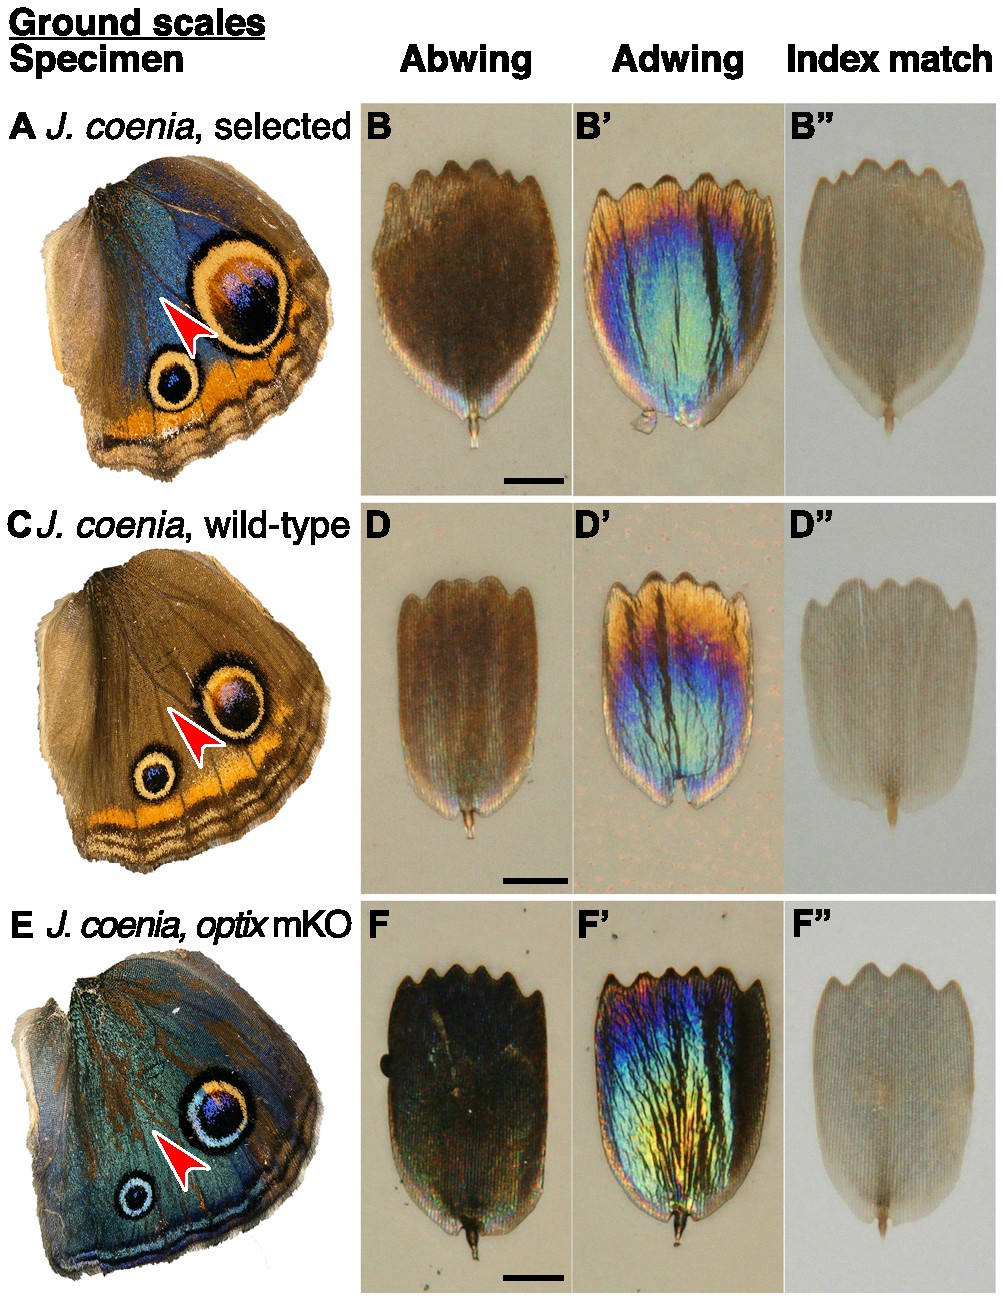
Structure and color of J.coenia ground scales.
(A,C,E) Wings with red arrowhead indicating the region from which scales were sampled. (B,D,F) Scale in abwing orientation, that is ridges facing up. (B’,D’,F’) Scale in adwing orientation, that is lamina facing up. (B”,D”,F”) Scale immersed in fluid with a refractive index matched to chitin, thus eliminating reflection to show only pigmentary color. (A–B”) J. coenia artificially selected ground scales. (C–D”) J. coenia wild-type ground scales. (E–F”) optix mKO mutant ground scales. Scale bars are 25 µm.
Figure 5
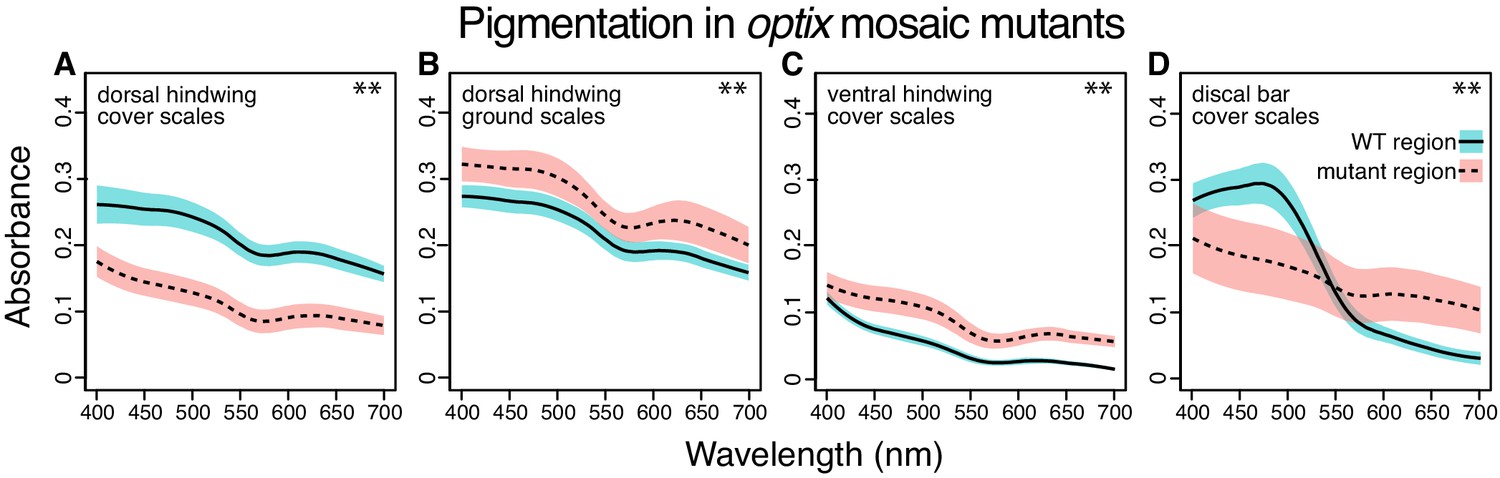
Absorbance spectra show the effect of optix knockout on scale pigmentation across wing pattern elements.
All comparisons are between wild-type and mutant regions in the same mosaic wing. (A) optix mutation decreases absorption in cover scales from the main background region of the dorsal hindwing (Figure 2Q). (B) Absorbance of ground scales from the dorsal hindwing (Figure 4E) is increased in mutant scales. (C) Absorbance increases with optix mutation in ventral hindwing cover scales (Figure 6A,C). (D) In the dorsal discal bars, (Figure 6E,G) optix regulates a switch between orange and brown pigment. Plots show mean spectra with envelope of one standard deviation, N = 6 scales per sample. Differences for all comparisons are statistically significant (Mann-Whitney U, **p<0.01 at wavelengths tested in Figure 5—source data 1).
-
Figure 5—source data 1
Results of statistical tests on absorbance differences.
- https://cdn.elifesciences.org/articles/52187/elife-52187-fig5-data1-v1.xlsx
-
Figure 5—source data 2
Processed absorbance spectra.
- https://cdn.elifesciences.org/articles/52187/elife-52187-fig5-data2-v1.xlsx
Figure 6
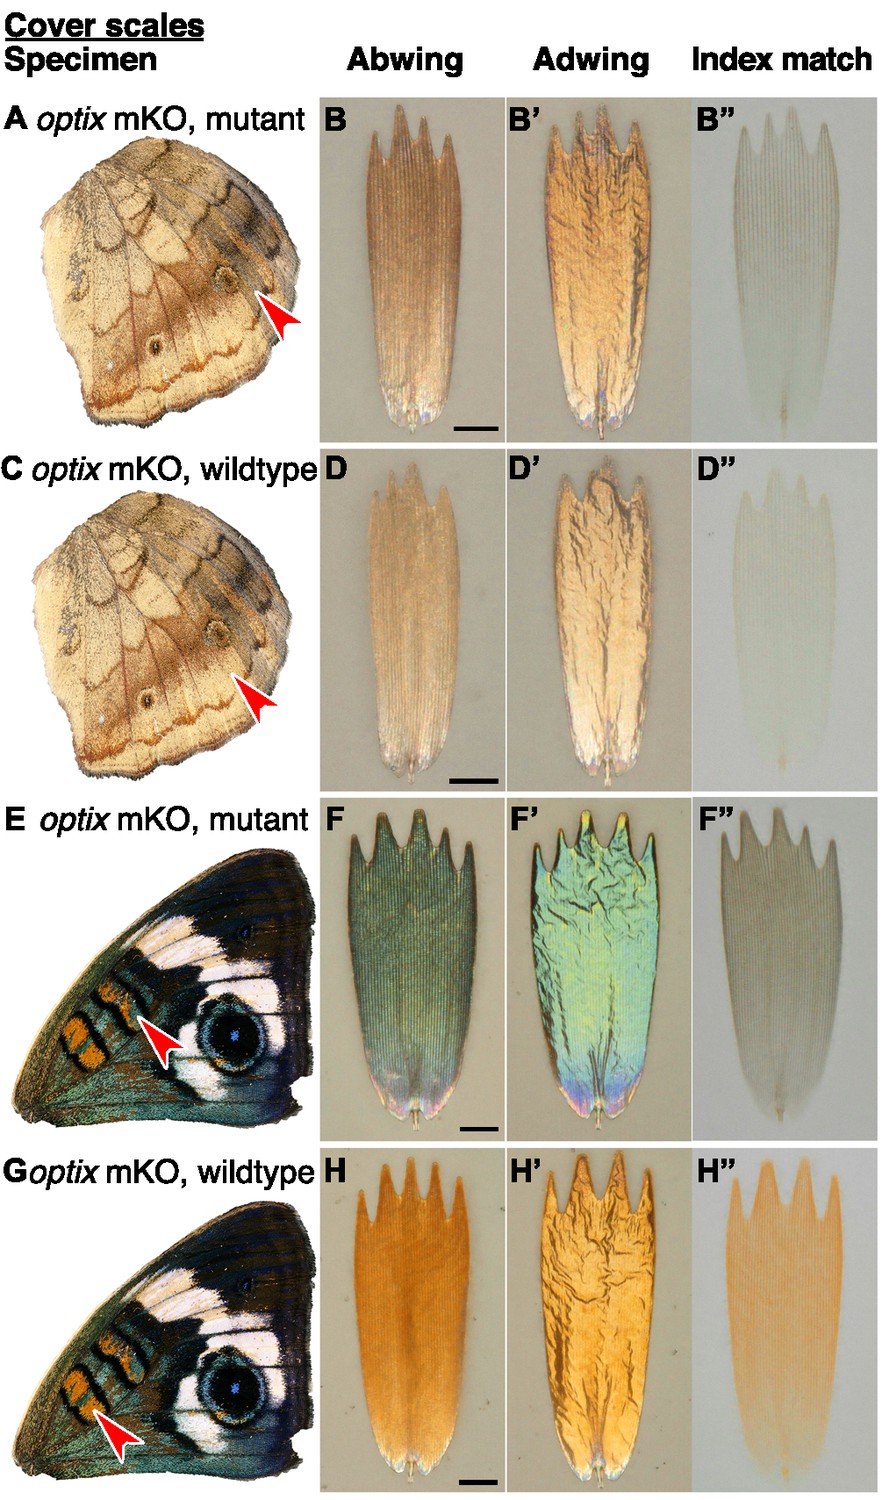
Effects of optix mutation on structure and color of J.coenia cover scales vary by wing region.
(A,C,E,G) Wings with red arrowhead indicating the region from which scales were sampled. (B,D,F,H) Scale in abwing orientation. (B’,D’,F’,H’) Scale in adwing orientation. (B”,D”,F”,H”) Scale immersed in fluid with a refractive index matched to chitin to show only pigmentary color. (A–B”) Mutant cover scales from an optix mKO ventral hindwing have increased melanin. (C–D”) Wild-type cover scales from an optix mKO ventral hindwing. (E–F”) Mutant cover scales from an optix mKO forewing discal bar have lost orange pigment, gained brown pigment, and increased lamina thickness, resulting in a shift to blue. (G–H”) Wild-type cover scales from the optix mKO forewing discal bar have both orange pigment and an orange lamina structural color. Scale bars are 25 µm.
Figure 7

Lamina structural colors are an important component of overall wing color throughout Junonia.
(A) Phylogeny of color variation in Junonia (based on Kodandaramaiah, 2009). Arrowheads indicate the color regions sampled for scale characterization. WT = wild type. AS = artificial selection. mKO = optix mosaic knockout mutant. DS = winter/dry season form. WS = summer/wet season form. J. evarete variants are from different locations. The female J. hierta wing image is reproduced with permission from Krushnamegh Kunte, NCBS. (B,D,F,H,J,L) Dorsal hindwing, arrow indicates the characterized scales’ location. (C,E,G,I,K,M) Abwing surface of cover scale. (C’,E’,G’,I’,K’,M’) Adwing surface of cover scale, showing lamina color. (C”,E”,G”,I”,K”,M”) Scale immersed in fluid with refractive index matched to chitin, thus showing only pigmentary color. (B–C”) J. hierta basal aura scales are unpigmented and appear blue due to lamina structural color. (D–E”) J. hierta has coordinated yellow pigment with a structurally yellow lamina. (F–G”) Neutral light gray of J. atlites is exclusively structural, due to additive color mixing of the multicolored lamina. (H–I”) Blue scales of dry season P. octavia are structurally colored since no pigment is present. (J–K”) Wet season P. octavia has discordant red pigment and blue lamina colors. The red pigment is localized in the ridges and crossribs on the abwing surface of the scale, while blue light from the lower lamina spills through the windows between them. (L–M”) The red band in dry season P. octavia is a more saturated red than in (J), due to the combination of both more red pigment and a structurally reddish lamina.
© 2020 Krushnamegh Kunte, All rights reserved. The female J. hierta wing in panel A is reproduced with permission from Krushnamegh Kunte. This illustration is not covered by the CC-BY 4.0 licence and further reproduction of it would need permission from the copyright holder.
Figure 8 with 1 supplement

Lamina thickness predicts lamina color across the Junonia phylogeny.
(A) Thickness measures for the regions indicated in Figure 7A vary continuously over a 170 nm range (minimum N = 3 scales and 12 measures per specimen). To visualize the relationship between thickness and color, we clustered similar specimens into five color groups described as gold, red, indigo, blue, and green. Thickness is significantly different between groups (nested ANOVA and Tukey’s HSD, p<3×10⁻⁸). J. atlites, which has rainbow color gradients in each individual scale, has especially variable thickness, with measures overlapping the ranges of all color groups. Boxplots show median and inner quartiles, whiskers extend to 1.5 times the interquartile range, outliers are shown as points, and notches show 95% confidence interval of the median. (B) Color groups are associated with different reflectance profiles. Lines are mean spectra and envelopes show one standard deviation. Minimum N = 3 scales per specimen from panel A; clusters follow panel A. (C–G) Adwing reflectance spectra for representative individual specimens with increasing lamina thicknesses. The color sequence follows Newton’s series. Solid line is the mean spectrum and the envelope is one standard deviation; N = 3 scales and six spectra per graph.
-
Figure 8—source data 1
Thickness measurements for Figure 8A.
- https://cdn.elifesciences.org/articles/52187/elife-52187-fig8-data1-v1.xlsx
-
Figure 8—source data 2
Processed reflectance spectra for Figure 8B.
- https://cdn.elifesciences.org/articles/52187/elife-52187-fig8-data2-v1.xlsx
Figure 8—figure supplement 1
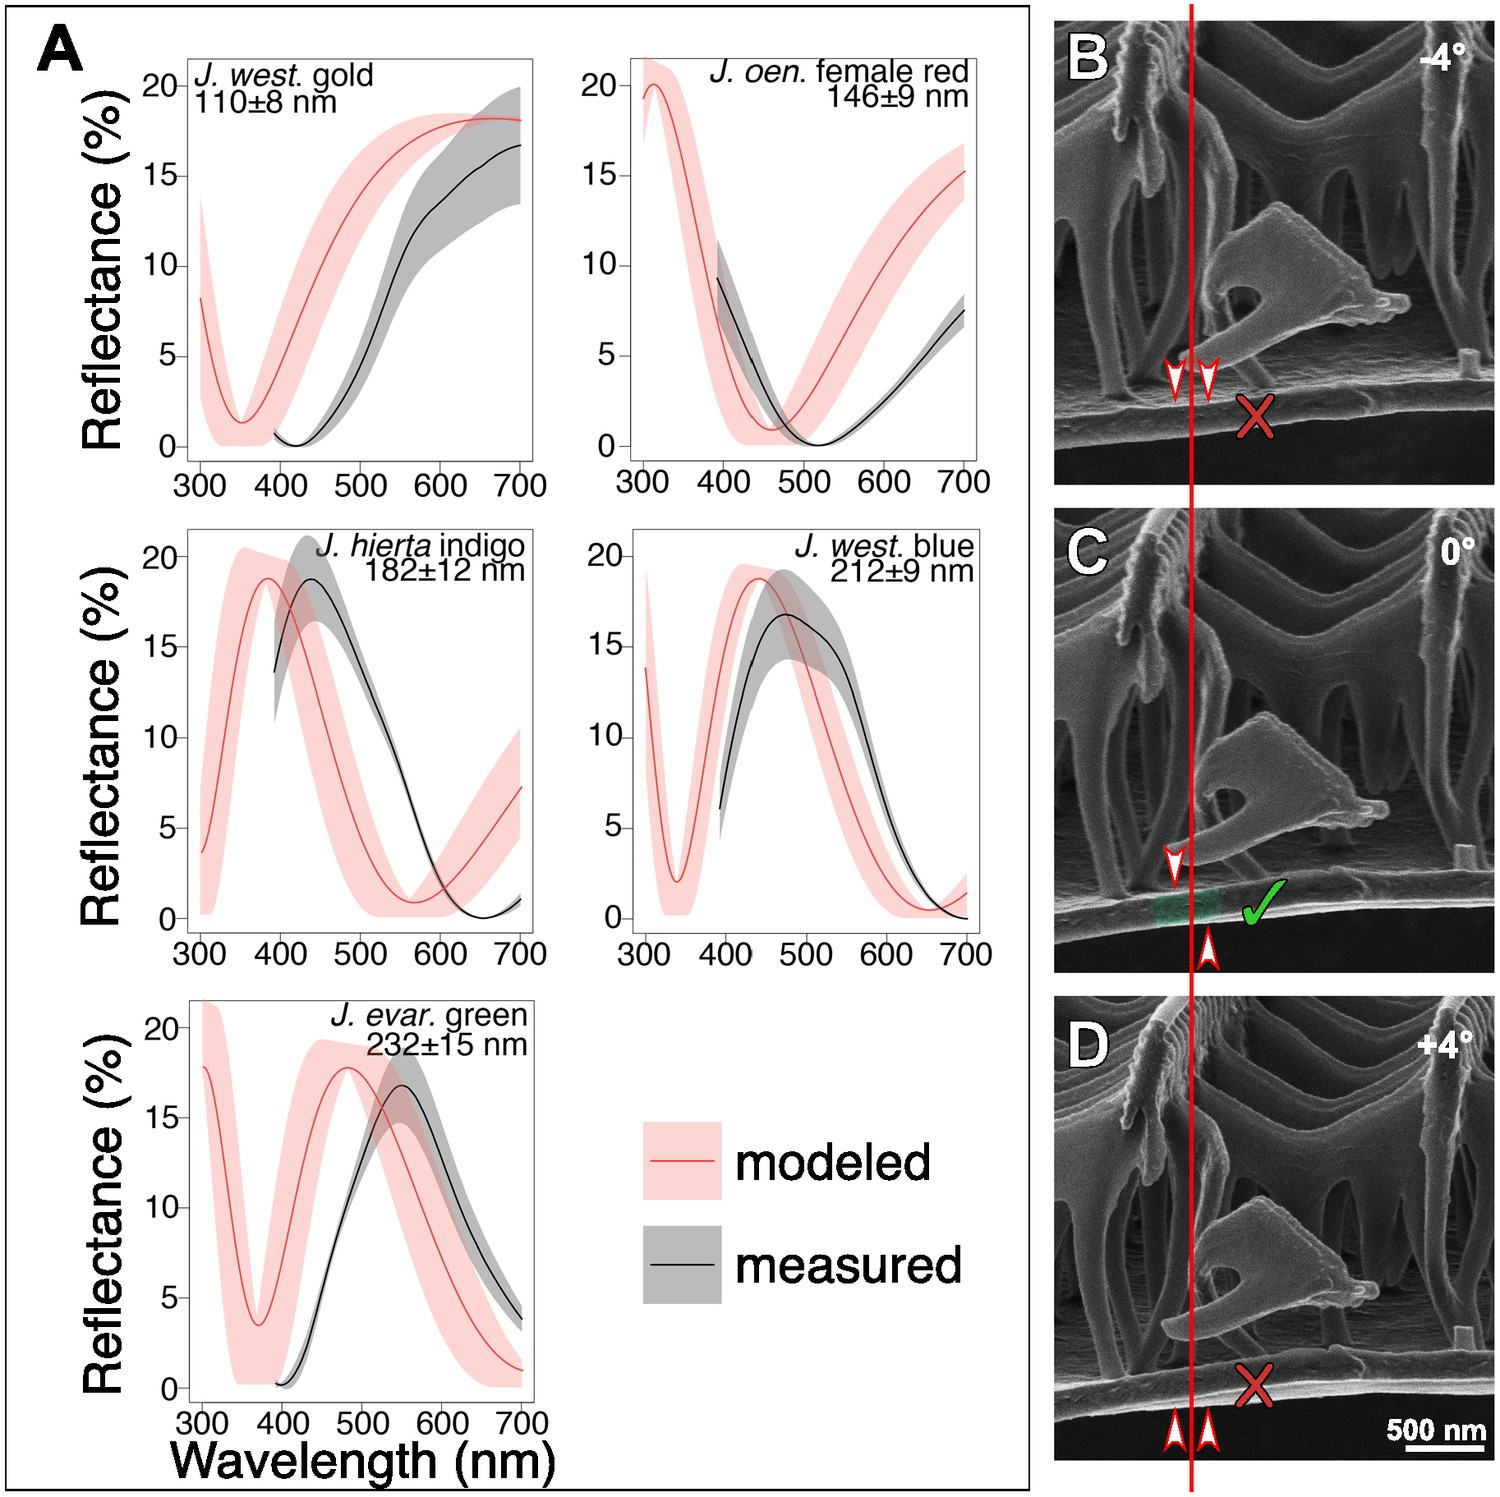
Comparison of modeled and measured spectra and thickness measurement methods.
(A) Modeled reflectances for representative specimens, using the classical Fresnel thin film equations, recover the general shape of observed reflectance spectra. Black lines show the mean measured reflectance spectra; the gray envelope is one standard deviation (N = 3 scales per graph). In red, we show the modeled reflectance (solid red lines) and standard deviation (red envelopes), based on thickness measures from HIM images (See Materials and methods). (B–D) Inflection point method for ensuring that lamina thicknesses are measured without sample tilt. At the position indicated by the vertical red line, an inflection point between the upper and lower surfaces of the lower lamina is visible only in (C). Arrowheads show whether the upper or lower surface of the lamina is visible in each panel, given the sample tilt and the lamina’s curvature. If the lamina is tilted by 4–5° or more from the horizontal, no inflection point is observed at that position.
Figure 9
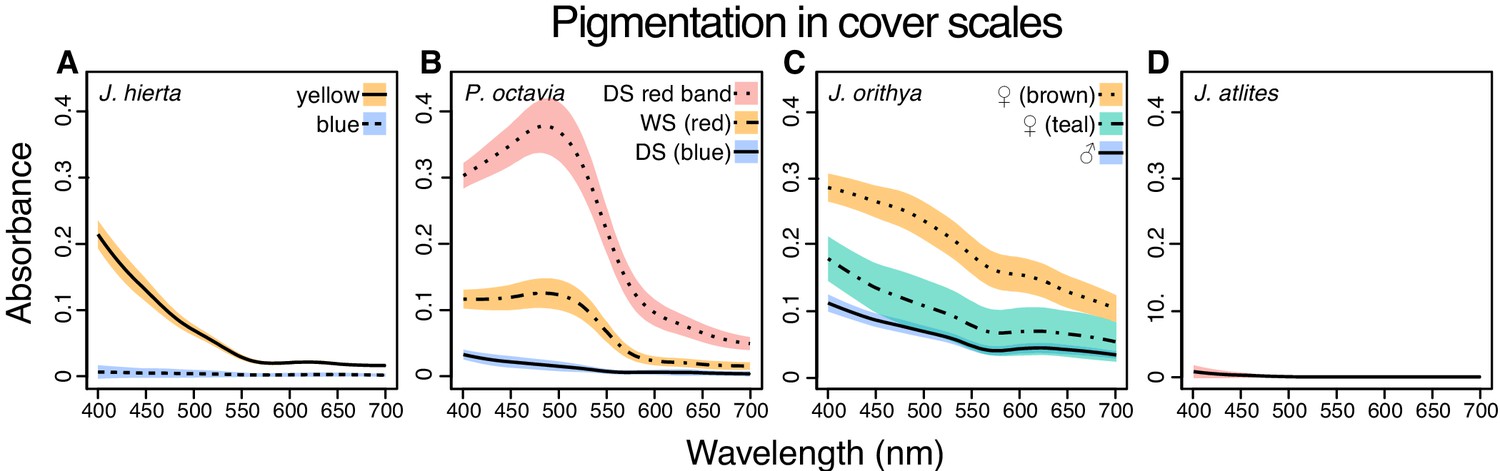
Absorbance spectra show variable pigment concentrations and identities among representative Junonia butterflies.
Spectra were taken from cover scales from the regions shown in Figure 7A. (A) J. hierta pigmentation varies by wing region (Figure 7B–E”). (B) Intensity of red pigmentation is the most important driver of color difference between seasonal morphs of P. octavia (Figure 7H–M”). (C) Pigment absorbance differs by sex in J. orithya. (D) J. atlites scales lack pigmentation (Figure 7F–G”). Plots show mean spectra with envelope of one standard deviation, minimum N = 6 scales per sample.
-
Figure 9—source data 1
Processed absorbance spectra.
- https://cdn.elifesciences.org/articles/52187/elife-52187-fig9-data1-v1.xlsx
Additional files
-
Supplementary file 1
Butterfly specimens used in this study.
- https://cdn.elifesciences.org/articles/52187/elife-52187-supp1-v1.xlsx
-
Transparent reporting form
- https://cdn.elifesciences.org/articles/52187/elife-52187-transrepform-v1.docx
Download links
A two-part list of links to download the article, or parts of the article, in various formats.
Downloads (link to download the article as PDF)
Open citations (links to open the citations from this article in various online reference manager services)
Cite this article (links to download the citations from this article in formats compatible with various reference manager tools)
Structural color in Junonia butterflies evolves by tuning scale lamina thickness
eLife 9:e52187.
https://doi.org/10.7554/eLife.52187


