MS-275, a class 1 histone deacetylase inhibitor augments glucagon-like peptide-1 receptor agonism to improve glycemic control and reduce obesity in diet-induced obese mice
- Dr. Reddy’s Institute of Life Sciences University of Hyderabad Campus, India
- Manipal Academy of Higher Education, India
- Department of Biomedical Sciences and Diabetes Institute, Ohio University, United States
- School of Life Sciences, University of Hyderabad, India
- Department of Applied Biology, Indian Institute of Chemical Technology, India
- Division of Lipid Chemistry, National Institute of Nutrition Hyderabad, India
- Medical Genomics, QIMR Berghofer Medical Research Institute, Australia
- Stem Cell and Regenerative Medicine Department, Nizam’s Institute of Medical Sciences, India
- Department of Chemistry, Indiana University, United States
Figures
Figure 1 with 3 supplements

Class 1 HDAC inhibitor MS-275 promotes incretin receptor signaling.
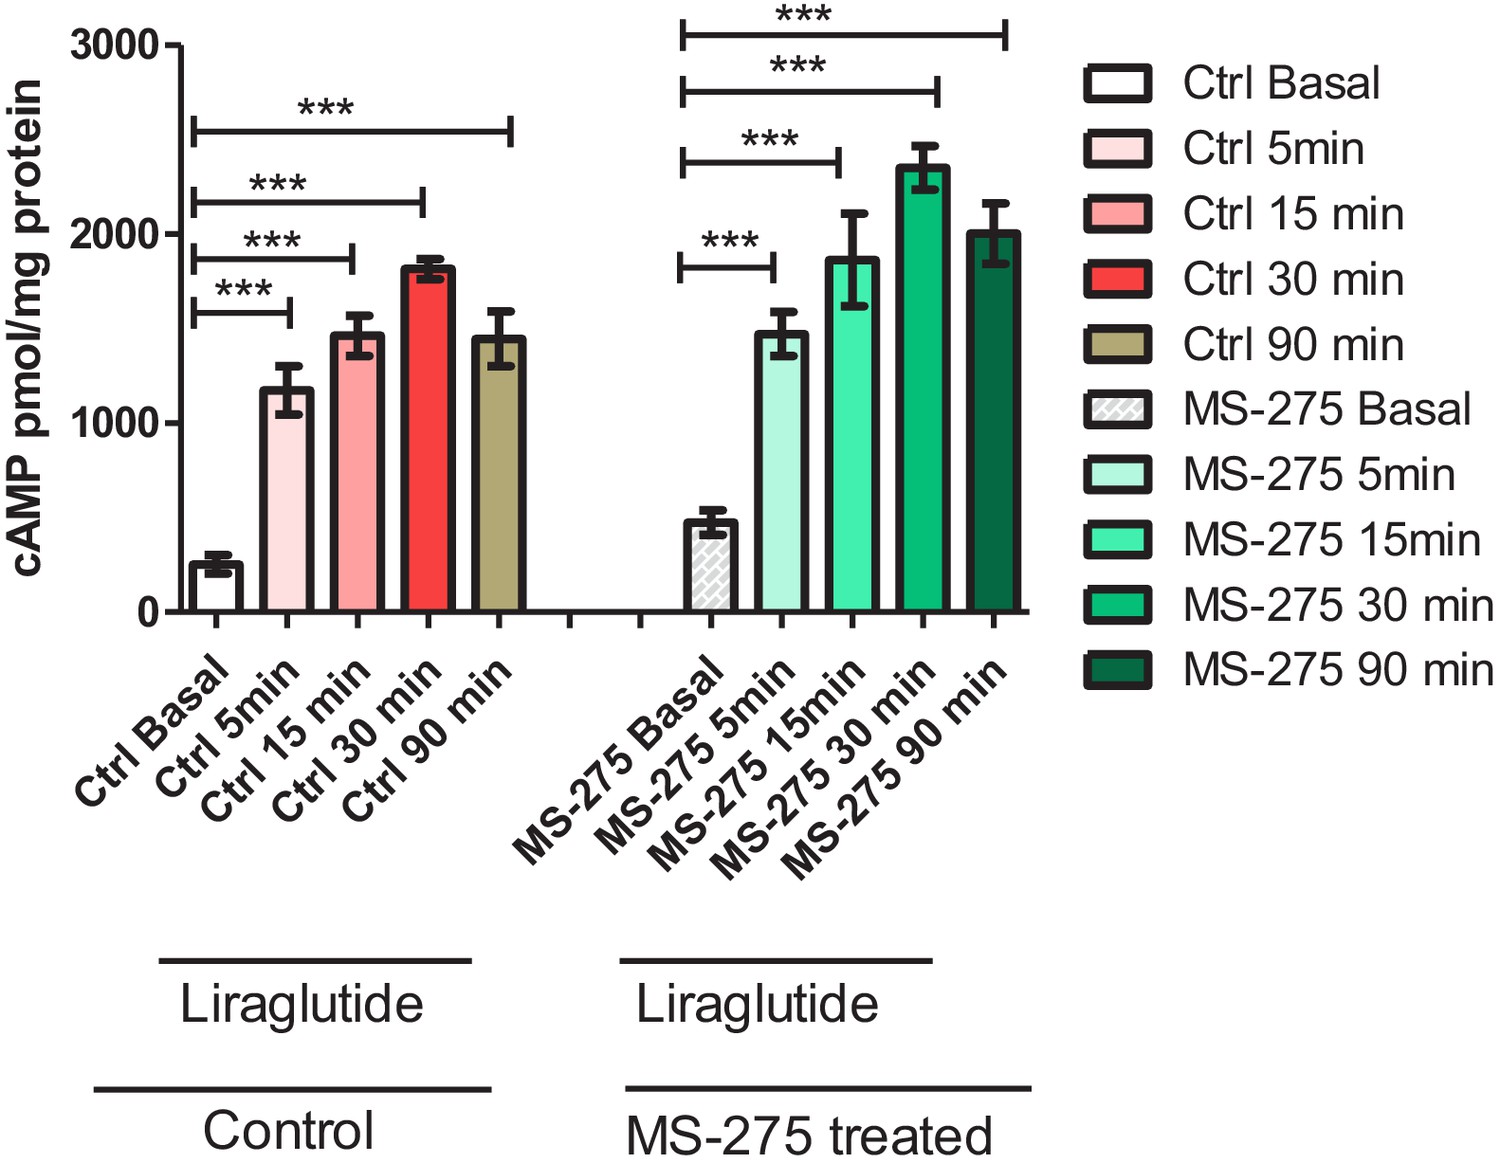
(A) Primary screening using BRIN-BD11 pancreatic beta cells to identify activators of GLP-1R-mediated cAMP generation as assessed by a luciferase reporter assay. Y-axis represents relative Luciferase units normalized by β-galactosidase expression. Liraglutide (100 nM) enhanced cAMP generation over basal, untreated control by 8.20 ± 2.84 fold which was further increased to 17 ± 0.4 fold, 15.2 ± 0.6 fold, 23.5 ± 1.4 fold, and 31.7 ± 3.1 fold in presence of SAHA, TSA, AR-42, and MS-275 respectively (n = 2 replicates per treatment). The concentration of each compound used in primary screening is 10 μM. The final DMSO concentration is 0.01% (B) Generation of cAMP in BRIN-BD11 pancreatic beta cells pretreated for 18 h with MS-275 at different concentrations. Liraglutide at 100 nM provides GLP-1R agonism and results represent mean (± SE) for three independent experiments, each treatment being conducted in duplicate. ***p<0.001 was determined by analysis of variance (ANOVA) using Tukey’s multiple comparison test comparing different concentrations of MS-275 upon liraglutide-induced cAMP generation as shown in normalized relative luciferase units as fold-over basal. (C) Effect of Jant 4 on GLP-1R-mediated cAMP generation in control and MS-275-treated BRIN-BD11 pancreatic beta cells. Results were reported as fold-increase relative to basal (untreated control). Data represented as mean ± SD (n = 2 replicates per treatment). (D) GIPR-mediated cAMP generation in cultured pancreatic beta cells pretreated for 18 h with MS-275(5 μM). IUB68 at different concentrations provides GIPR agonism. Data represent mean (± SE) of three independent experiments, each treatment being conducted in replicate. ***p<0.001 was determined by analysis of variance (ANOVA) using Tukey’s multiple comparison test comparing the effect of MS-275 upon IUB68 treatment at different concentrations. The generation of cAMP is measured in relative luciferase units and is represented as a fold-over basal cAMP generation. (E) The GLP-1R GFP trafficking in control and MS-275-treated pancreatic beta cells upon activation by liraglutide. BRIN-BD11 pancreatic beta cells were transfected with GFP-tagged GLP-1R and stimulated with 100 nM liraglutide for different time intervals. They were then fixed and visualized by confocal microscopy. White arrows pointing at the punctate dots represented internalized activated GLP-1R. Images were representative of three independent experiments, n = 25 cells for each time point. (F) The time course of GLP-1R-mediated cAMP generation in cultured pancreatic beta cells pretreated for 18 h with MS-275 (5 μM). The control and MS-275-treated cells were incubated with liraglutide (100 nM) and 5 min after the incubation the excess ligand was washed with KRB buffer. The cAMP was measured 5, 15, 30, and 90 min after KRB wash using Direct cAMP Enzyme Immunoassay. The statistically significant increase in the cAMP generation on liraglutide agonism between the control and MS-275-treated cells was assessed at 30 and 90 min time points (p<0.05, two-way ANOVA, Bonferroni’s post-tests). Results represent the mean (± SE) of three independent experiments. (G) Effect of Bafilomycin A1 (100 nM) on MS-275-mediated induction of GLP-1R-mediated cAMP generation. Results represent mean (± SE) of three independent experiments and are presented as fold-over basal (untreated control); ***p<0.001 determined by analysis of variance (one-way ANOVA, Tukey’s multiple comparison test) comparing the effect of Bafilomycin A1 in control and MS-275-treated cells on liraglutide-stimulated cAMP generation. (H) Effect of Rab5A S34N dominant negative plasmid on the MS-275-mediated augmentation of GLP-1R signaling measured by cAMP generation using luciferase assay. BRIN-BD11 pancreatic beta cells were transfected with Rab5A S34N dominant-negative plasmid and 12 h post-transfection was treated with MS-275. After 24 h of treatment cAMP assay was performed. The data was presented as a four-parameter-logistic curve analyzed in Prism (version 6.0), and each data point was assessed in duplicates. The dose-response curve represents the mean ± SEM of three independent experiments.
-
Figure 1—source data 1
Source Data 1A: Primary screening data of small molecules for stimulation of GLP-1R-mediated cAMP generation.
Source Data 1B: MS-275 dose-response for induction of GLP-1R-mediated cAMP generation in cultured pancreatic beta cells. Source Data 1C: Impact of GLP-1R antagonist Jant4 on liraglutide-mediated cAMP generation in control and MS-275-treated cultured pancreatic beta cells. Source Data 1D: MS-275-mediated potentiation of GIPR agonist IUB68-mediated cAMP generation in BRIN-BD11 pancreatic beta cells. Source Data 1F: Time course of GLP-1R-mediated cAMP generation in control and MS-275-treated pancreatic beta cells. Source Data 1G: Impact of Bafilomycin A1 on MS-275-induced stimulation of GLP-1R-mediated cAMP generation. Source Data 1H: Effect of Rab5A S34N dominant-negative plasmid on the MS-275-mediated augmentation of GLP-1R signaling.
- https://cdn.elifesciences.org/articles/52212/elife-52212-fig1-data1-v1.xlsx
Figure 1—figure supplement 1
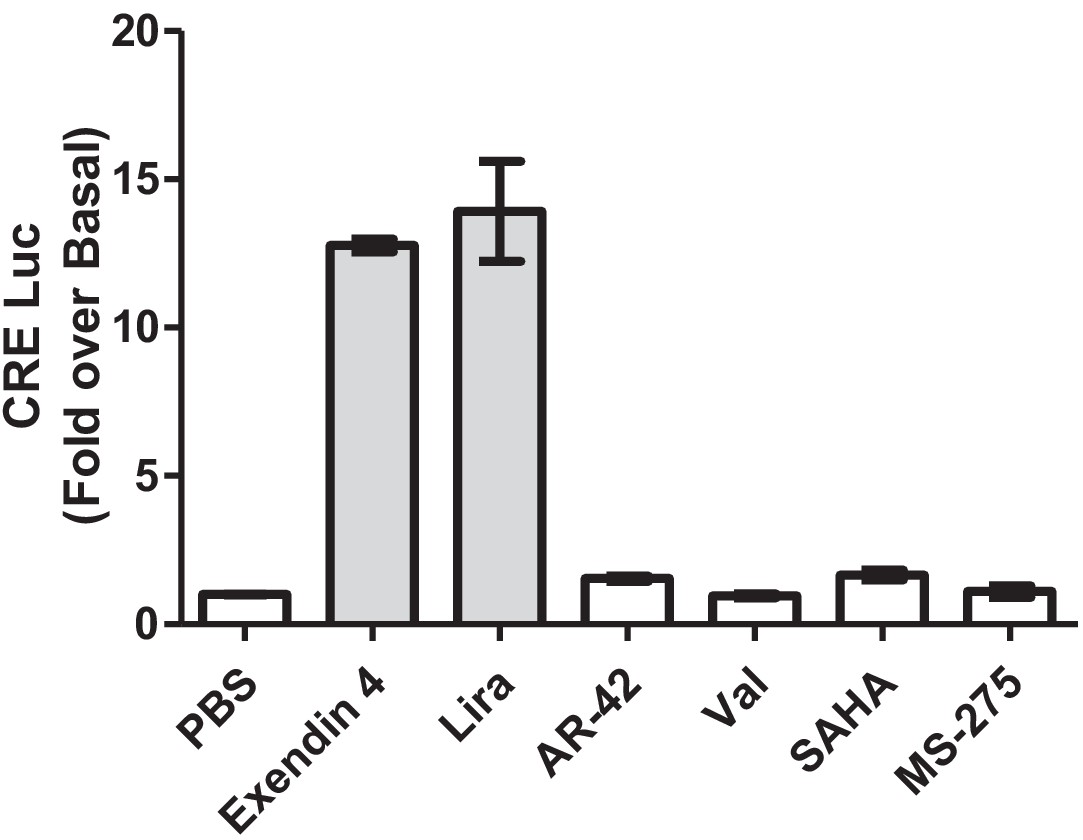
Direct GLP-1R agonism assessment of primary hits obtained from the cell-based screening of GLP-1R-mediated cAMP generation as measured by fold-increase over vehicle control in cAMP-responsive luciferase (Cre) reporter assay in BRIN-BD11 pancreatic beta cells.
Figure 1—figure supplement 2
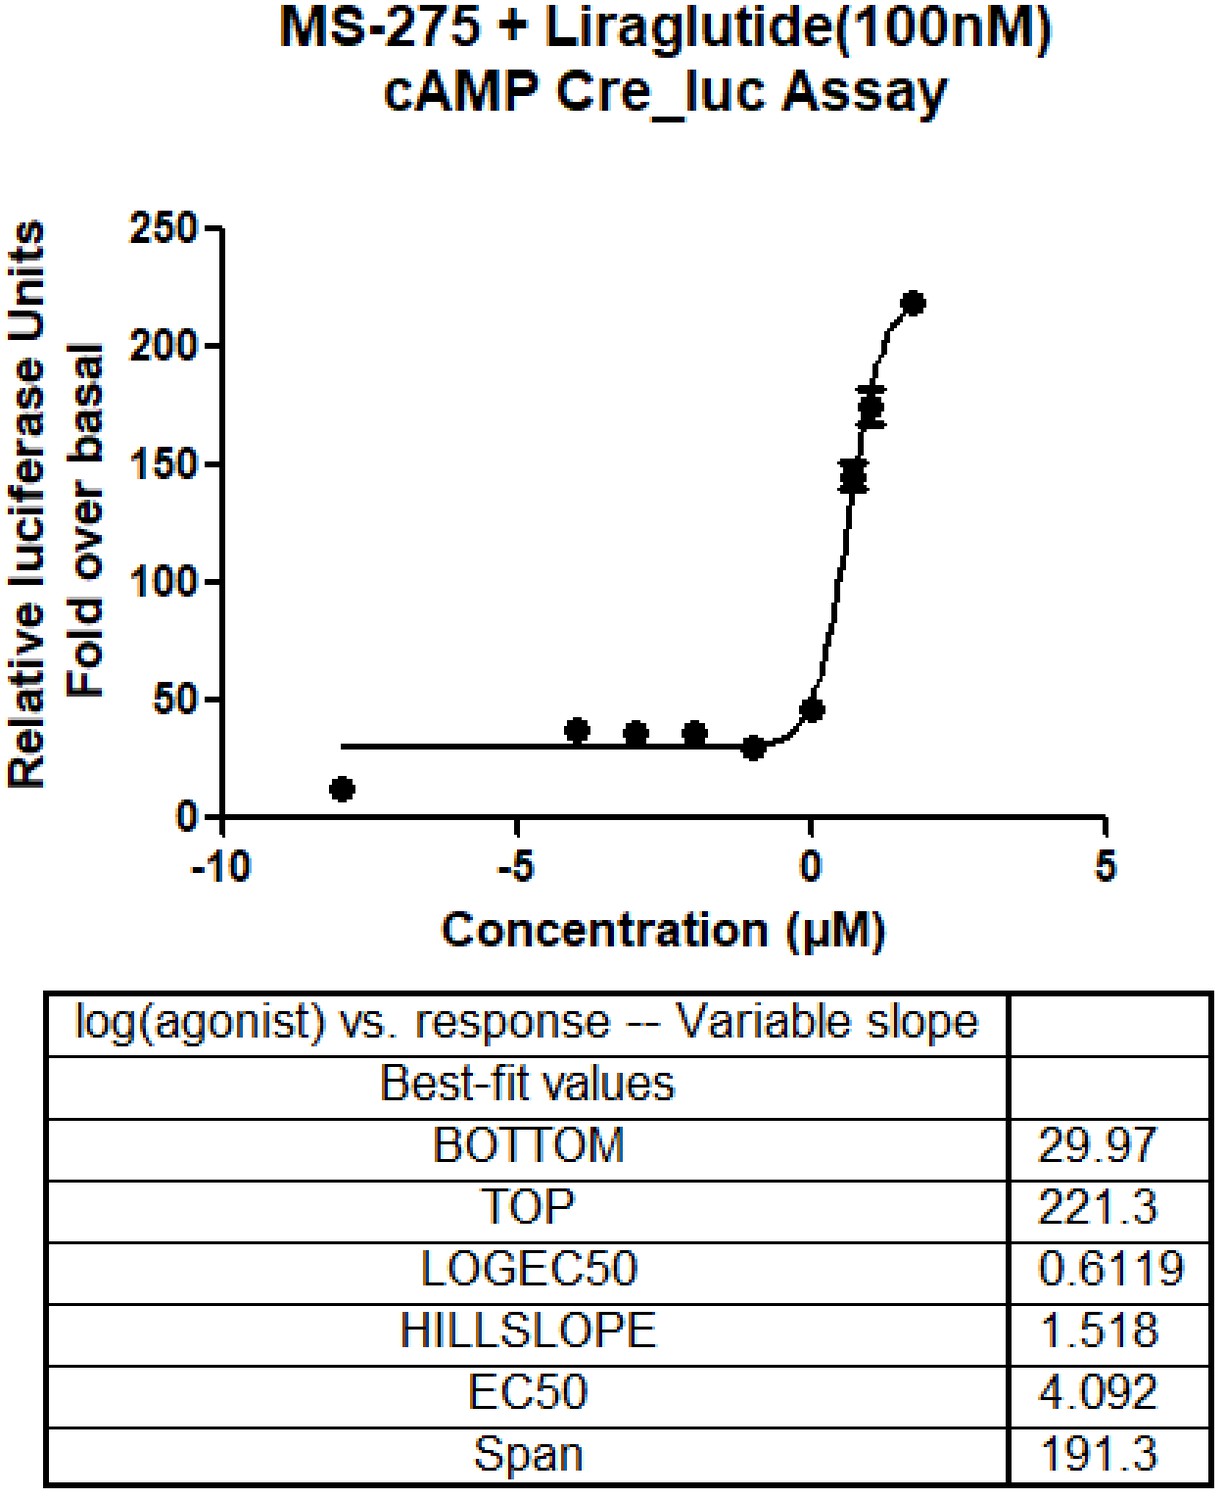
Dose-response curve depicting the role of MS-275 on GLP-1R-mediated cAMP generation.
Figure 1—figure supplement 3
Liraglutide-mediated cAMP generation as compared to basal in control and MS-275-treated pancreatic beta cells.
Test for statistical significance between basal and upon liraglutide treatment is carried out using one-way ANOVA (Tukey’s multiple comparison test).
Figure 2
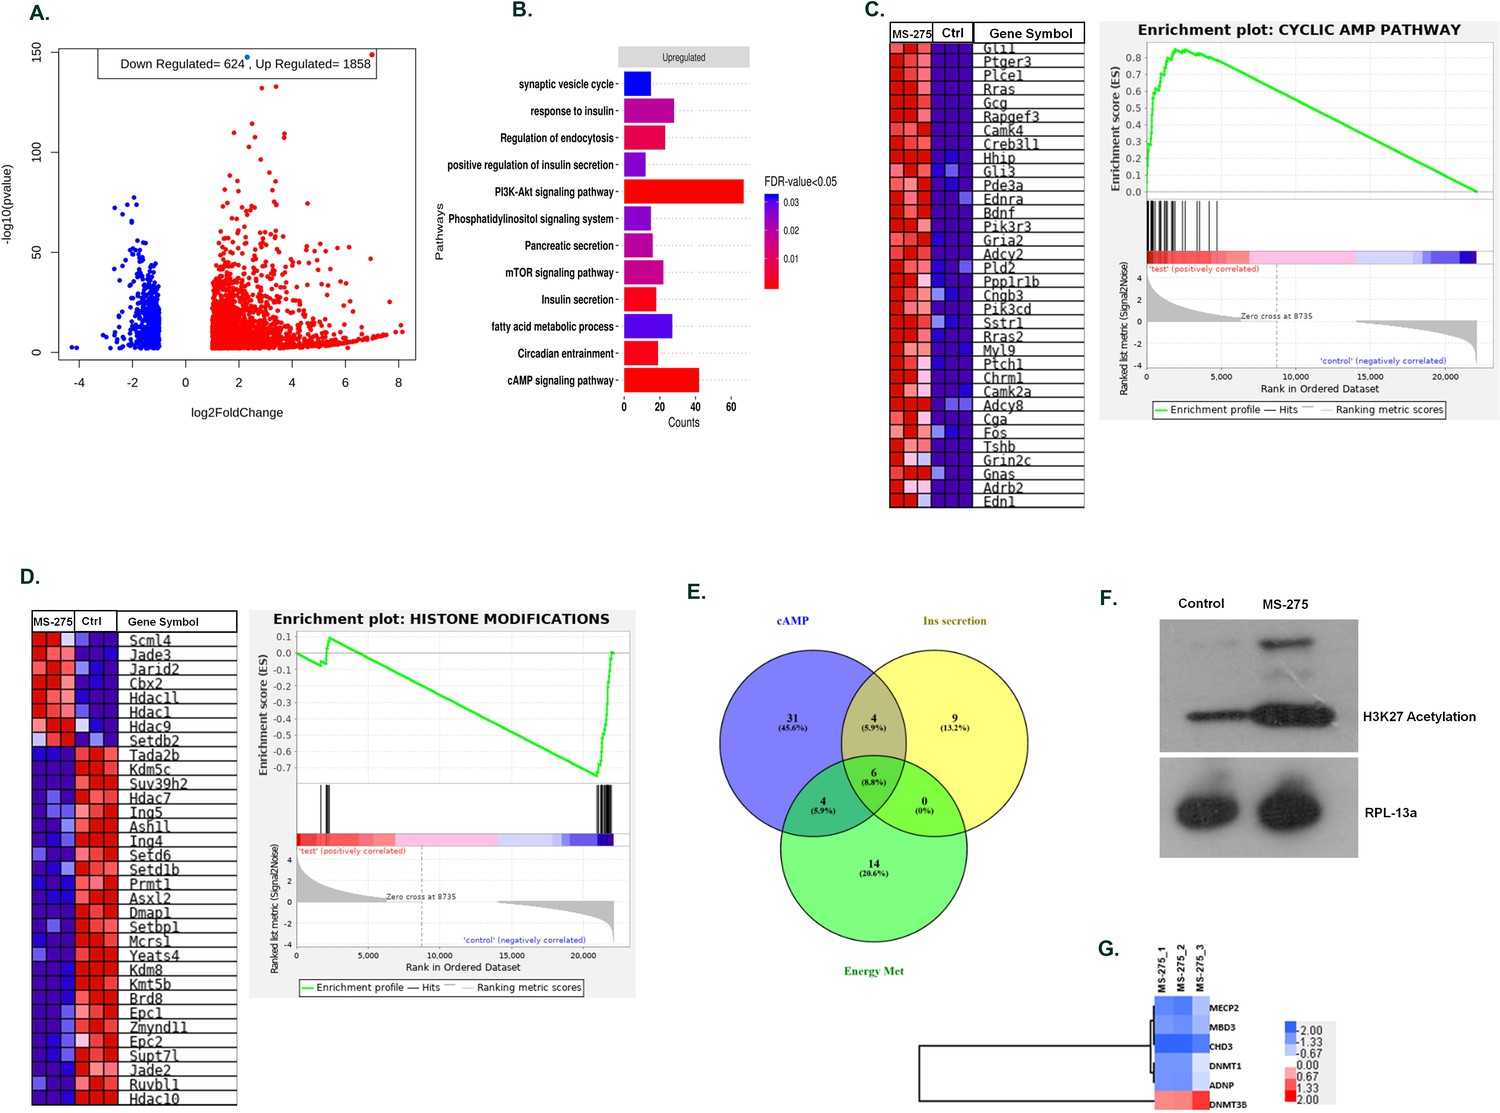
MS—275 alters transcriptome profile in BRIN-BD11 pancreatic beta cells.
(A) Volcano plot from hierarchical clustering of differentially expressed genes on MS-275 treatment in BRIN-BD11 pancreatic beta cells. The log2 fold change is represented in the x-axis, whereas –log10 of the corrective p-value is represented in the y-axis. Red dots show upregulated while blue dots represent downregulated genes. (B) Gene ontology (GO) pathway enrichment upon MS-275 treatment in BRIN-BD11 pancreatic beta cells; only significantly enriched terms shown; FDR < 0.05. (C) GSEA Blue–Pink O’ gram of the cAMP pathway in the control and MS-275-treated pancreatic beta cells. Enrichment plot of the cAMP pathway in the control and MS-275 (test)-treated pancreatic beta cells depicting the profile of the running enrichment score (ES) and the position of the representative gene-set members in the rank order list. NES = Normalized enrichment score, FDR = False Discovery Rate. (D) GSEA Blue–Pink O’ gram of the genes related to Histone modifications in the control and MS-275-treated pancreatic beta cells. The graph represents the profile of the running enrichment score and positions of the Gene Set members in the rank order list. NES = Normalized enrichment score, FDR = False Discovery Rate. (E) Venn diagram of differentially expressed genes related to the cAMP-signaling pathway, insulin secretion pathway, and pathways involved in the energy metabolism. All Venn Diagrams were produced with Venny 2.0.2 (http://bioinfogp.cnb.csic.es/tools/venny/index.html). The numbers on the Venn diagram indicates the number of genes shared among the pathways. (F) Effect of MS-275 on H3K27 acetylation; the immunoblot images are representative of three independent experiments; RPL-13a immunoblot served as the loading control. (G) Differential Expressed Gene (DEG) heat map by GO terms of select genes related to chromatin modification in BRIN-BD11 pancreatic beta cells (log2 fold enrichment ≥2.0, p<0.05); upregulated genes in red, downregulated in blue.
-
Figure 2—source data 1
Source Data Figure 2G.
Western blot pictures (uncut) showing the impact of MS-275 on H3K27 acetylation; RPL-13a immunoblot served as the loading control.
- https://cdn.elifesciences.org/articles/52212/elife-52212-fig2-data1-v1.docx
Figure 3 with 1 supplement
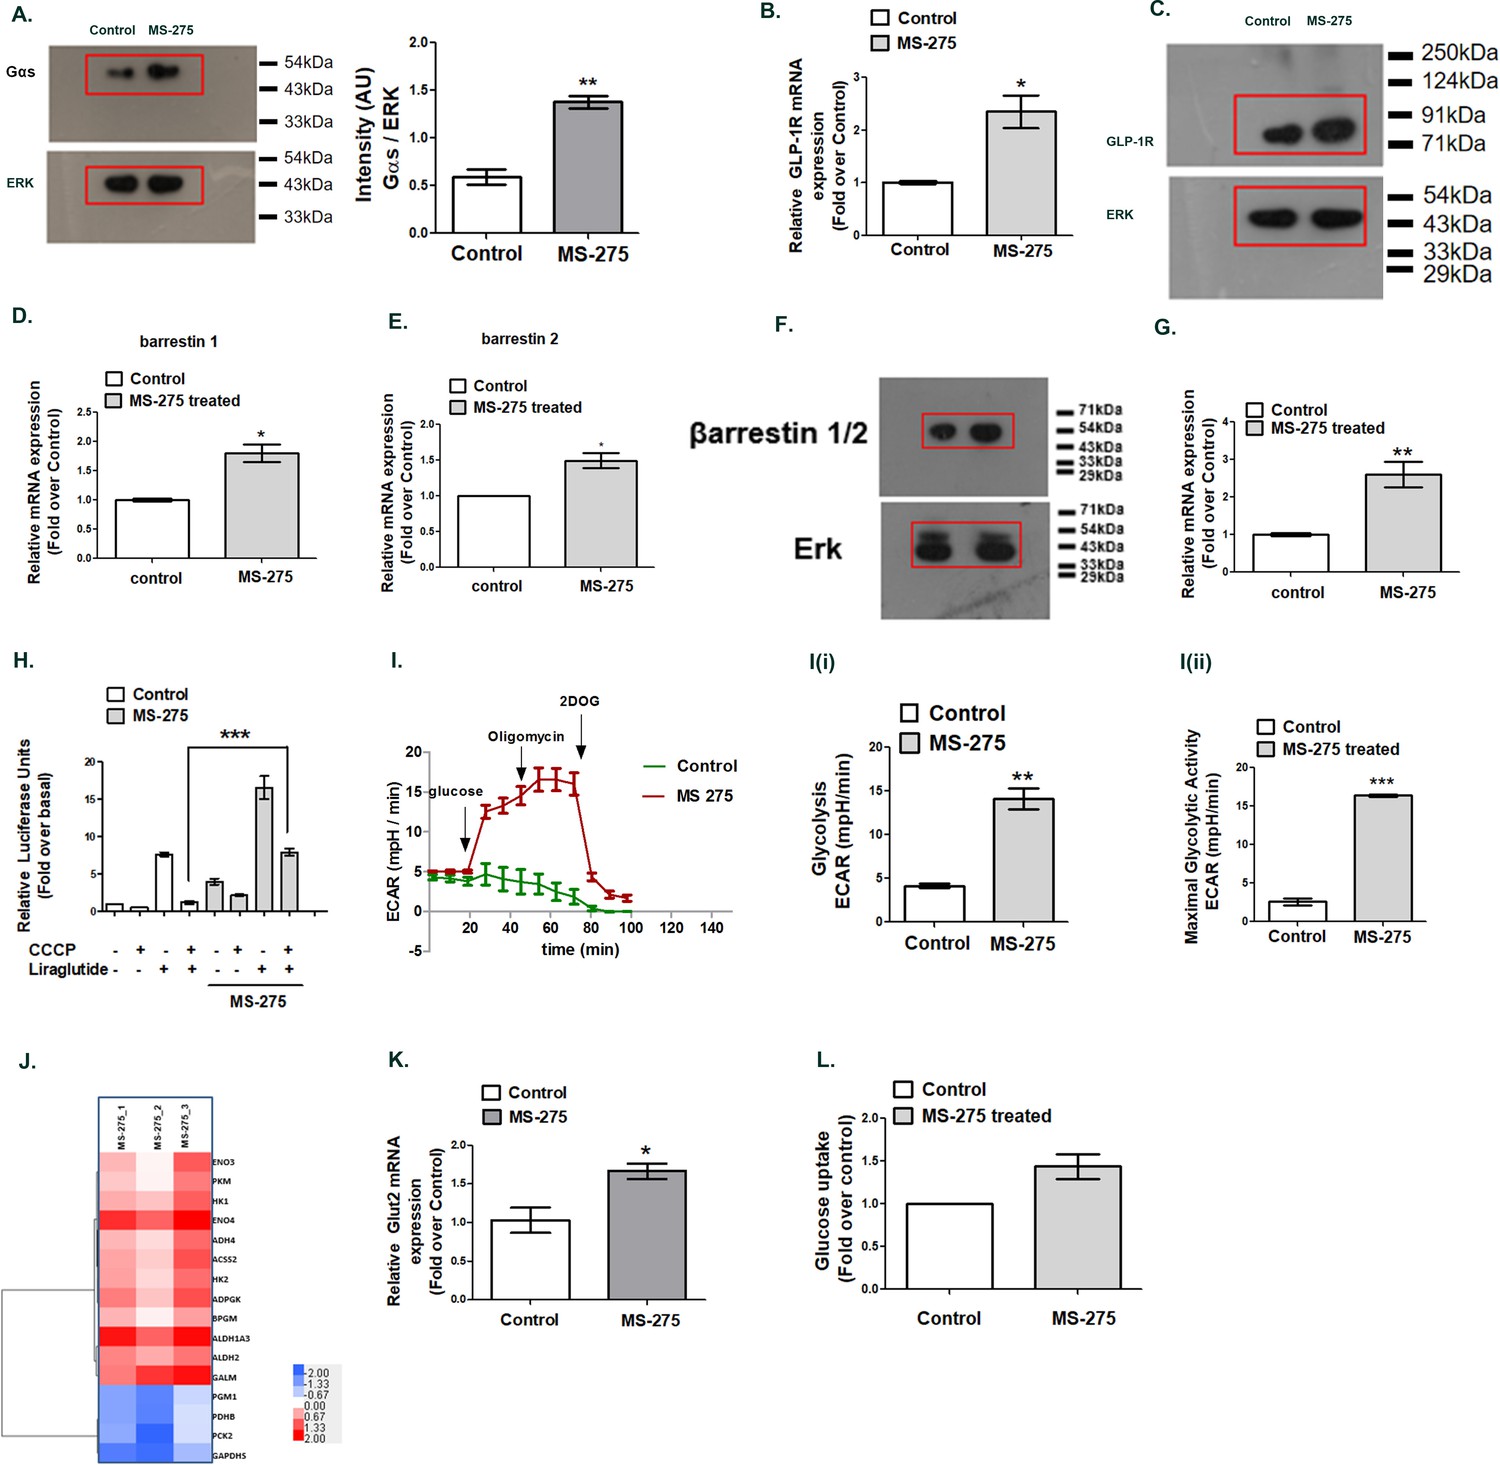
MS—275 augments GLP-1R-mediated cAMP generation.
(A) Effect of MS-275 on Gαs protein expression; the immunoblot images are representative of three independent experiments; images being quantified using Image J. Total p44/42 (ERK) protein expression considered as the loading control; the data is quantified as the ratio of Gαs and total p44/42 expression (arbitrary units (AU)). **p<0.01 for Student’s t-test (unpaired) comparing the effect of MS-275 in control and MS-275-treated cells. (B) Effect of MS-275 on the mRNA expression of GLP-1R; the quantification being carried out using the 2-ΔΔCT method and the data normalized using GAPDH as reference. Results are represented as the mean (± SE) of three independent experiments. *p<0.05 was determined using Welch’s t-test comparing the effect of MS-275 in control and MS-275-treated cells. (C) Effect of MS-275 on GLP-1R protein expression; the immunoblot images are representative of three independent experiments; total p44/42 (ERK) protein expression is considered as the loading control, the data being quantified as the ratio of GLP-1R and total p44/42 expression (arbitrary units(AU)). (D) Effect of MS-275 on the mRNA expression of beta arrestin1; the quantification being carried out using the 2-ΔΔCT method and the data normalized using GAPDH as reference. Results are represented as the mean (± SE) of three independent experiments. *p<0.05 was determined by Welch’s t-test (unpaired) comparing the effect of MS-275 in control and MS-275-treated pancreatic beta cells. (E) Effect of MS-275 on the mRNA expression of beta-arrestin 2; the quantification being carried out using the 2-ΔΔCT method and the data normalized using GAPDH as the reference. Results are represented as the mean (± SE) of three independent experiments. *p<0.05 was determined by Welch’s t-test (unpaired) comparing the effect of MS-275 in control and MS-275-treated pancreatic beta cells. (F) Effect of MS-275 on beta-arrestin protein expression; the immunoblot images are representative of three independent experiments; images being quantified using Image J. Total p44/42 (ERK) protein expression considered as the loading control. *p<0.05 for Student’s t-test (unpaired) comparing the effect of MS-275 in control and MS-275-treated pancreatic beta cells. (G) Effect of MS-275 on the expression of adenylyl cyclase 8; relative mRNA expression quantified using the 2-ΔΔCT method and the data normalized using GAPDH as reference. Results are represented as the mean (± SE) of three independent experiments. **p<0.01 was determined by Welch’s t-test comparing the expression in control and MS-275-treated pancreatic beta cells. (H) Effect of chemical uncoupling of mitochondrial oxidative phosphorylation by CCCP (10 μM) on GLP-1R-mediated cAMP generation in control and MS-275-treated pancreatic beta cells measured by a luciferase reporter assay. Results represent mean (± SE) of four independent experiments and expressed as fold-over basal.***p<0.001 was determined by analysis of variance (ANOVA) using Tukey’s multiple comparison test comparing the impact of CCCP in control and MS-275-treated cells treated in the presence of liraglutide (I) The effect of MS-275 on the glycolytic activity is approximated by the Extracellular acidification rate (ECAR) in BRIN-BD11 pancreatic beta cells. I (i) represents glycolysis and I (ii) maximal glycolytic activity. Results are mean (± S.E) of three experiments ***p<0.001, **p<0.01 for Student’s t-test (unpaired) comparing cellular acidification parameters that approximate glycolysis. (J) Heat map of differentially expressed genes involved in glycolysis (log2 fold enrichment ≥2.0, p<0.05). Upregulated genes are in red and downregulated in blue. (K) Effect of MS-275 on GLUT2 mRNA expression; the relative mRNA expression quantified using the 2-ΔΔCT method and the data normalized using 18S rRNA as reference. Results are represented as the mean (± SE) of three independent experiments. **p<0.01 was determined by Welch’s t-test comparing the expression in control and MS-275-treated pancreatic beta cells (L) Effect of MS-275 on Basal Glucose uptake in BRIN-BD11 pancreatic beta cells; results are mean (± S.E) of three independent sets of experiments carried out in replicate.
-
Figure 3—source data 1
Source Data Figure 3A.
Western blot pictures (uncut) showing the impact of MS-275 on Gαs protein expression; ERK immunoblot was considered as the loading control. Source Data Figure 3B: Source Data Figure 3C: Source Data Figure 3D and Figure 3E: Source Data Figure 3F: Source Data Figure 3G: Source Data Figure 3H: Source Data Figure 3K: Source Data Figure 3.
- https://cdn.elifesciences.org/articles/52212/elife-52212-fig3-data1-v1.docx
-
Figure 3—source data 2
Source Data Figure 3B: Relative GLP-1R mRNA expression; the quantification was carried out using the 2-ΔΔCT method and the data normalized using GAPDH as reference.
Source Data Figure 3D and Figure 3E: Relative beta arrestin1 mRNA and beta-arrestin 2 mRNA expression; the quantification was carried out using the 2-ΔΔCT method and the data normalized using GAPDH as reference. Source Data Figure 3G: Relative Adcy8 mRNA expression; the quantification was carried out using the 2-ΔΔCT method and the data normalized using GAPDH as reference. Source Data Figure 3H: Effect of chemical uncoupling of mitochondrial oxidative phosphorylation by CCCP (10 μM) on GLP-1R-mediated cAMP generation in control and MS-275-treated cultured pancreatic beta cells. Source Data Figure 3K: Relative GLUT2 mRNA expression; the quantification was carried out using the 2-ΔΔCT method and the data normalized using 18S rRNA as reference Source Data Figure 3L: Effect of MS-275 on Basal Glucose uptake in BRIN-BD11 pancreatic beta cells.
- https://cdn.elifesciences.org/articles/52212/elife-52212-fig3-data2-v1.xlsx
-
Figure 3—source data 3
Source Data Figure 3C: Western blot pictures (uncut) showing the impact of MS-275 on GLP-1R protein expression; ERK immunoblot was considered as the loading control.
- https://cdn.elifesciences.org/articles/52212/elife-52212-fig3-data3-v1.docx
-
Figure 3—source data 4
Source Data Figure 3F: Western blot pictures (uncut) showing the impact of MS-275 on beta-arrestin protein expression; ERK immunoblot was considered as the loading control.
- https://cdn.elifesciences.org/articles/52212/elife-52212-fig3-data4-v1.docx
Figure 3—figure supplement 1
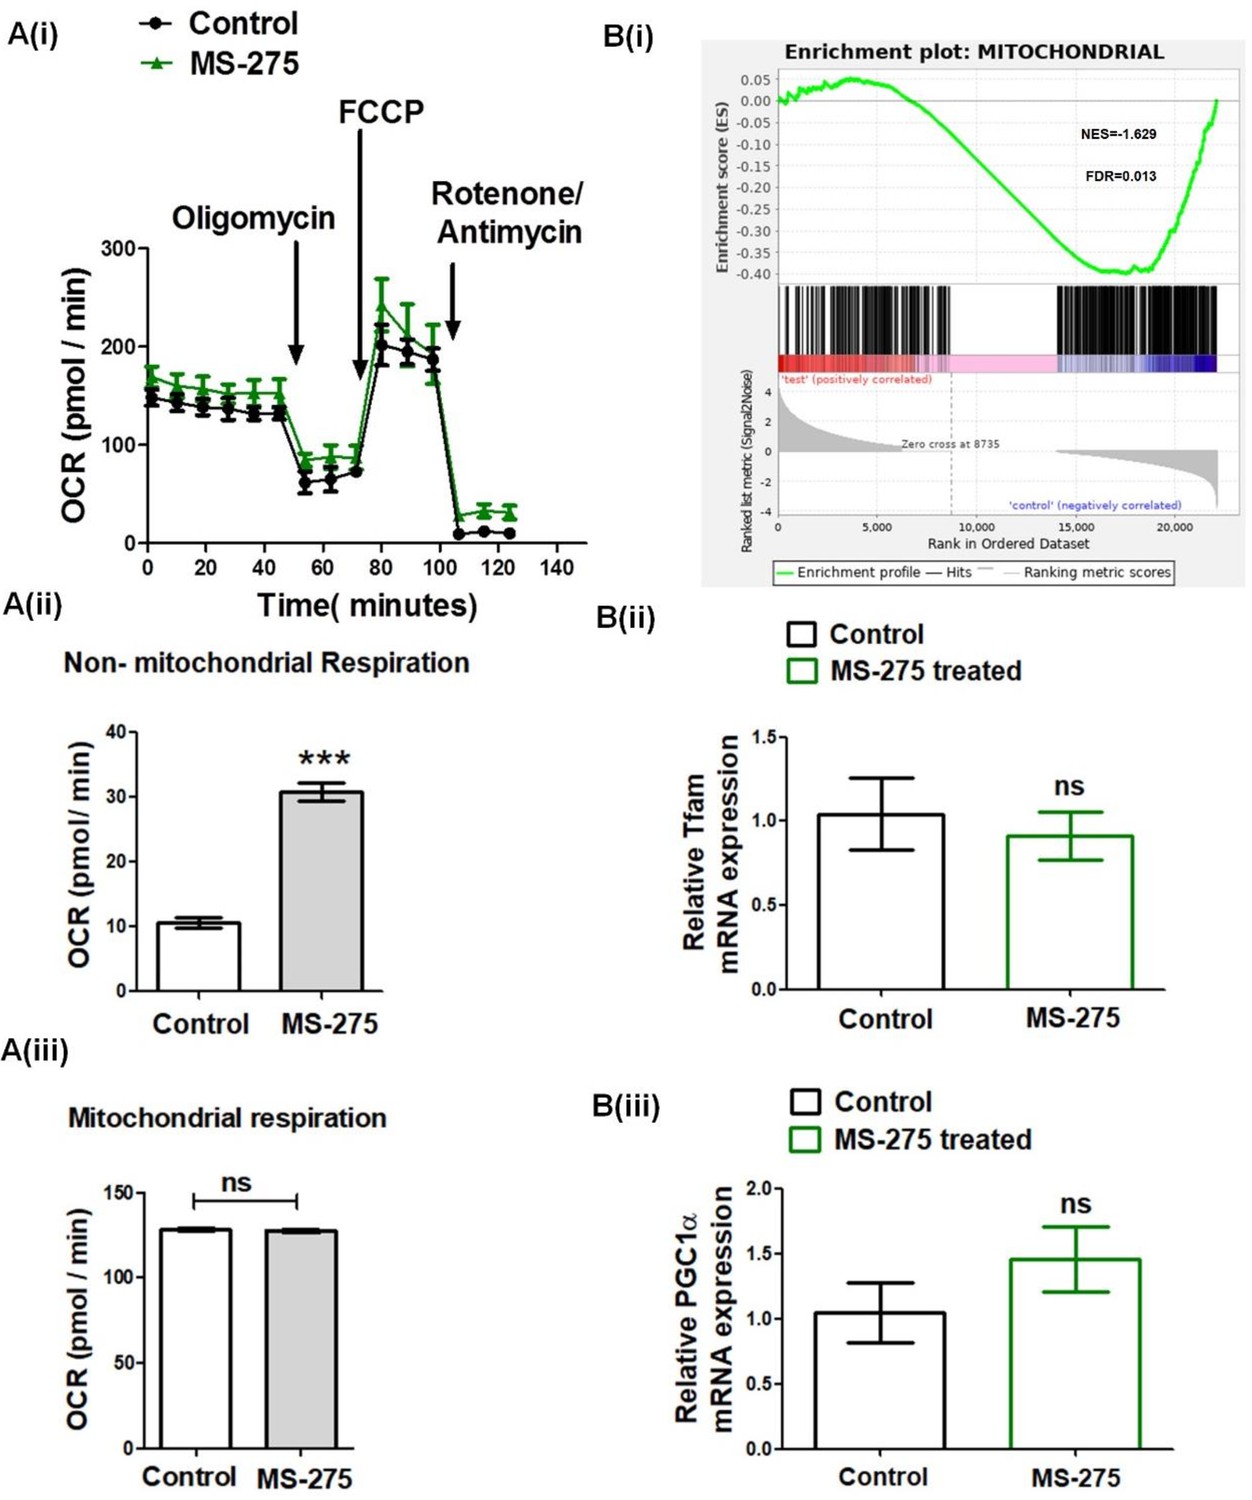
A (i) Real-time respirometry depicting oxygen consumption rate in the control and MS-275-treated pancreatic beta cells measured in Seahorse XF24 extracellular flux analyzer.
The cellular respiration was dissected into non-mitochondrial (A (ii)) and mitochondrial respiration (A (iii)). Data are mean (± S.E) of three stimulated wells measured in triplicate. ***p<0.001, **p<0.01 for Student’s t-test (unpaired) comparing respiratory parameters in control and MS-275-treated cells; n.s = nonsignificant. B(i). GSEA of the mitochondrial genes in control and MS-275-treated pancreatic beta cells. The graph represents the profile of the running enrichment score and positions of the Gene Set members in the rank order list. NES = Normalized enrichment score, FDR = False Discovery Rate B (ii) The Effect of MS-275 on the mRNA expression of Tfam; the quantification being carried out using the 2-ΔΔCT method and the data normalized using 18S rRNA as reference. Results are represented as the mean (± SE) of three independent experiments. ns = non-significant B(iii). The Effect of MS-275 on the mRNA expression of PGC-1α; the quantification was carried out using the 2-ΔΔCT method and the data normalized using 18S rRNA as reference. Results are represented as the mean (± SE) of three independent experiments. ns: non-significant.
Figure 4
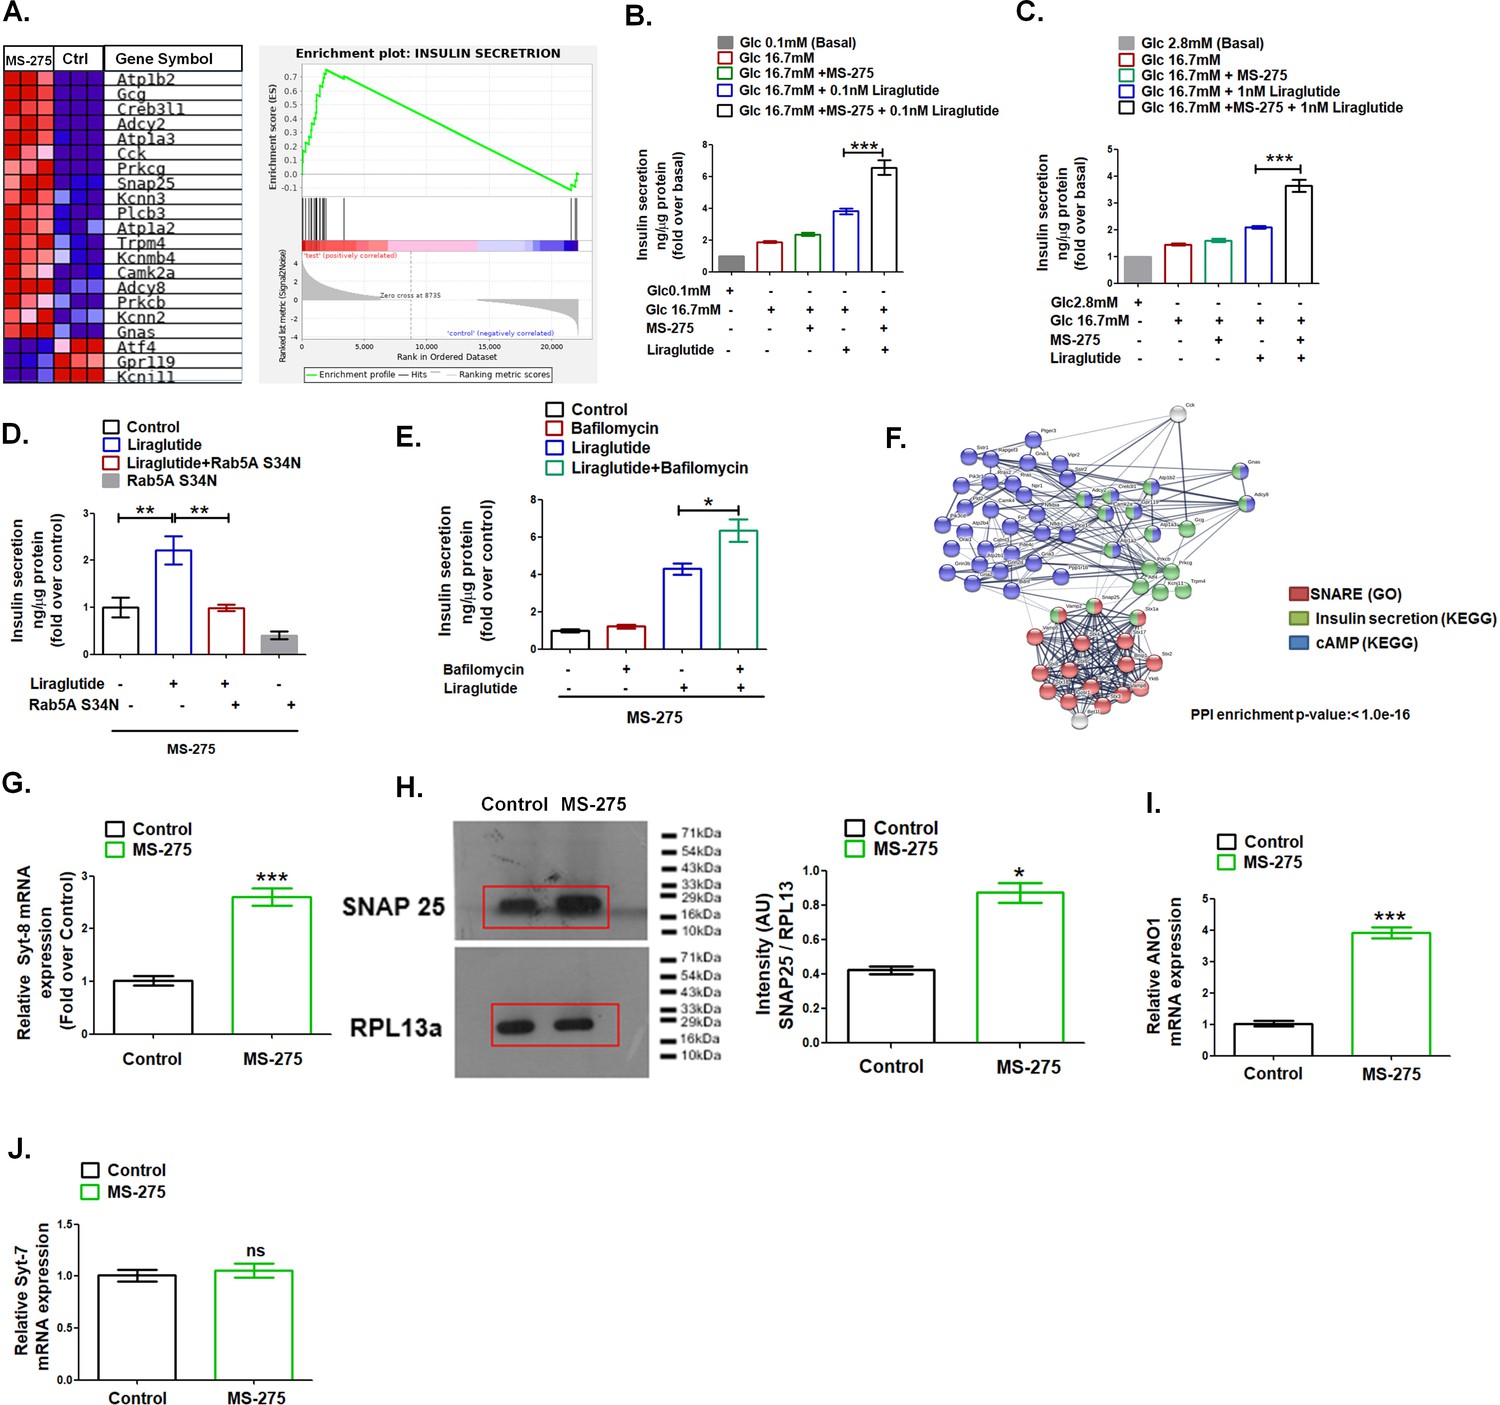
MS—275 stimulates GLP-1R-mediated GSIS and prevents fatty-acid-induced pancreatic beta-cell death.
(A) GSEA Blue–Pink O’ gram of the representative genes involved in insulin secretion in control and MS-275-treated pancreatic beta cells. The graph depicting the profile of the running enrichment score (ES) and the position of the representative Gene Set members in the rank order list. NES = Normalized enrichment score, FDR = False Discovery Rate. (B) Effect of MS-275 on GLP-1R-mediated GSIS in BRIN-BD11 pancreatic beta cells. Insulin secretion is reported as ng/mg protein and expressed as fold over the basal secretion. Data are mean (± S.E) of three independent experiments; ***p<0.001 was determined by analysis of variance (ANOVA) using Tukey’s multiple comparison test comparing the effect of MS-275 on GSIS in the presence and absence of 0.1 nM liraglutide. (C) Effect of MS-275 on GLP-1R-induced GSIS mediated by 1 nM liraglutide in cultured rat islets. Results are the mean (± S.E) of three independent experiments; ***p<0.001 was determined by analysis of variance (ANOVA) using Tukey’s multiple comparison test comparing the effect of MS-275 on GSIS in rat islets in the presence and absence of liraglutide. (D) Effect of Rab5A S34N on GLP-1R-induced GSIS mediated by 1 nM liraglutide in MS-275-treated pancreatic beta cells. GSIS was evaluated in the presence of 16.7 mM glucose. Results are mean (± S.E) of three independent experiments; **p<0.01 was determined by analysis of variance (ANOVA) using Tukey’s multiple comparison test. (E) Effect of Bafilomycin on GLP-1R-induced GSIS mediated by 1 nM liraglutide in control and MS-275-treated pancreatic beta cells. Results are mean (± S.E) of three independent experiments; *p<0.05 was determined by the analysis of variance (ANOVA) using Tukey’s multiple comparison test. GSIS was evaluated in the presence of 16.7 mM glucose. (F) String analysis of DEGs related to the cAMP signaling cascade, SNARE, and insulin secretion pathway that is modulated upon MS-275 treatment. Networks in which there are overlaps between pathways based on the co-occurrence of genes are shown. Enrichment score: 1.0e-16. SNARE (GO) red; cAMP pathway (KEGG) blue; insulin secretion pathway (KEGG) green. The white/gray node indicates the second shell of interactors. (G) The effect of MS-275 on the mRNA expression of Syt-8; the quantification being carried out using the 2-ΔΔCT method and the data normalized using 18S rRNA as reference. Results are represented as the mean (± SE) of three independent experiments. ***p<0.001 was determined by Welch’s t-test (unpaired) (H) Impact of MS-275 on SNAP 25 protein expression in cultured pancreatic beta cells. The immunoblot, representative of three independent experiments, is quantified using image J and the intensity (arbitrary units) is expressed as a ratio of SNAP 25 and RPL13a that serves as a loading control. Results are represented as the mean (± SE) of three independent experiments. *p<0.05 was determined by Welch’s t-test (unpaired) (I) The effect of MS-275 on the mRNA expression of Ano1; the quantification being carried out using the 2-ΔΔCT method and the data normalized using 18S rRNA as reference. Results are represented as the mean (± SE) of three independent experiments. ***p<0.001 was determined by Welch’s t-test (unpaired) (J) The effect of MS-275 on the mRNA expression of Syt-7; the quantification being carried out using the 2-ΔΔCT method and the data normalized using 18S rRNA as reference. Results are represented as the mean (± SE) of three independent experiments. ns: non-significant.
-
Figure 4—source data 1
Source Data Figure 4B: The effect of MS-275 on GLP-1R-mediated GSIS in BRIN-BD11 pancreatic beta cells.
- https://cdn.elifesciences.org/articles/52212/elife-52212-fig4-data1-v1.xlsx
-
Figure 4—source data 2
Source Data Figure 4H: Western blot pictures (uncut) showing the impact of MS-275 on SNAP 25 protein expression in cultured pancreatic beta cells; RPL-13a immunoblot was considered as the loading control.
- https://cdn.elifesciences.org/articles/52212/elife-52212-fig4-data2-v1.docx
Figure 5
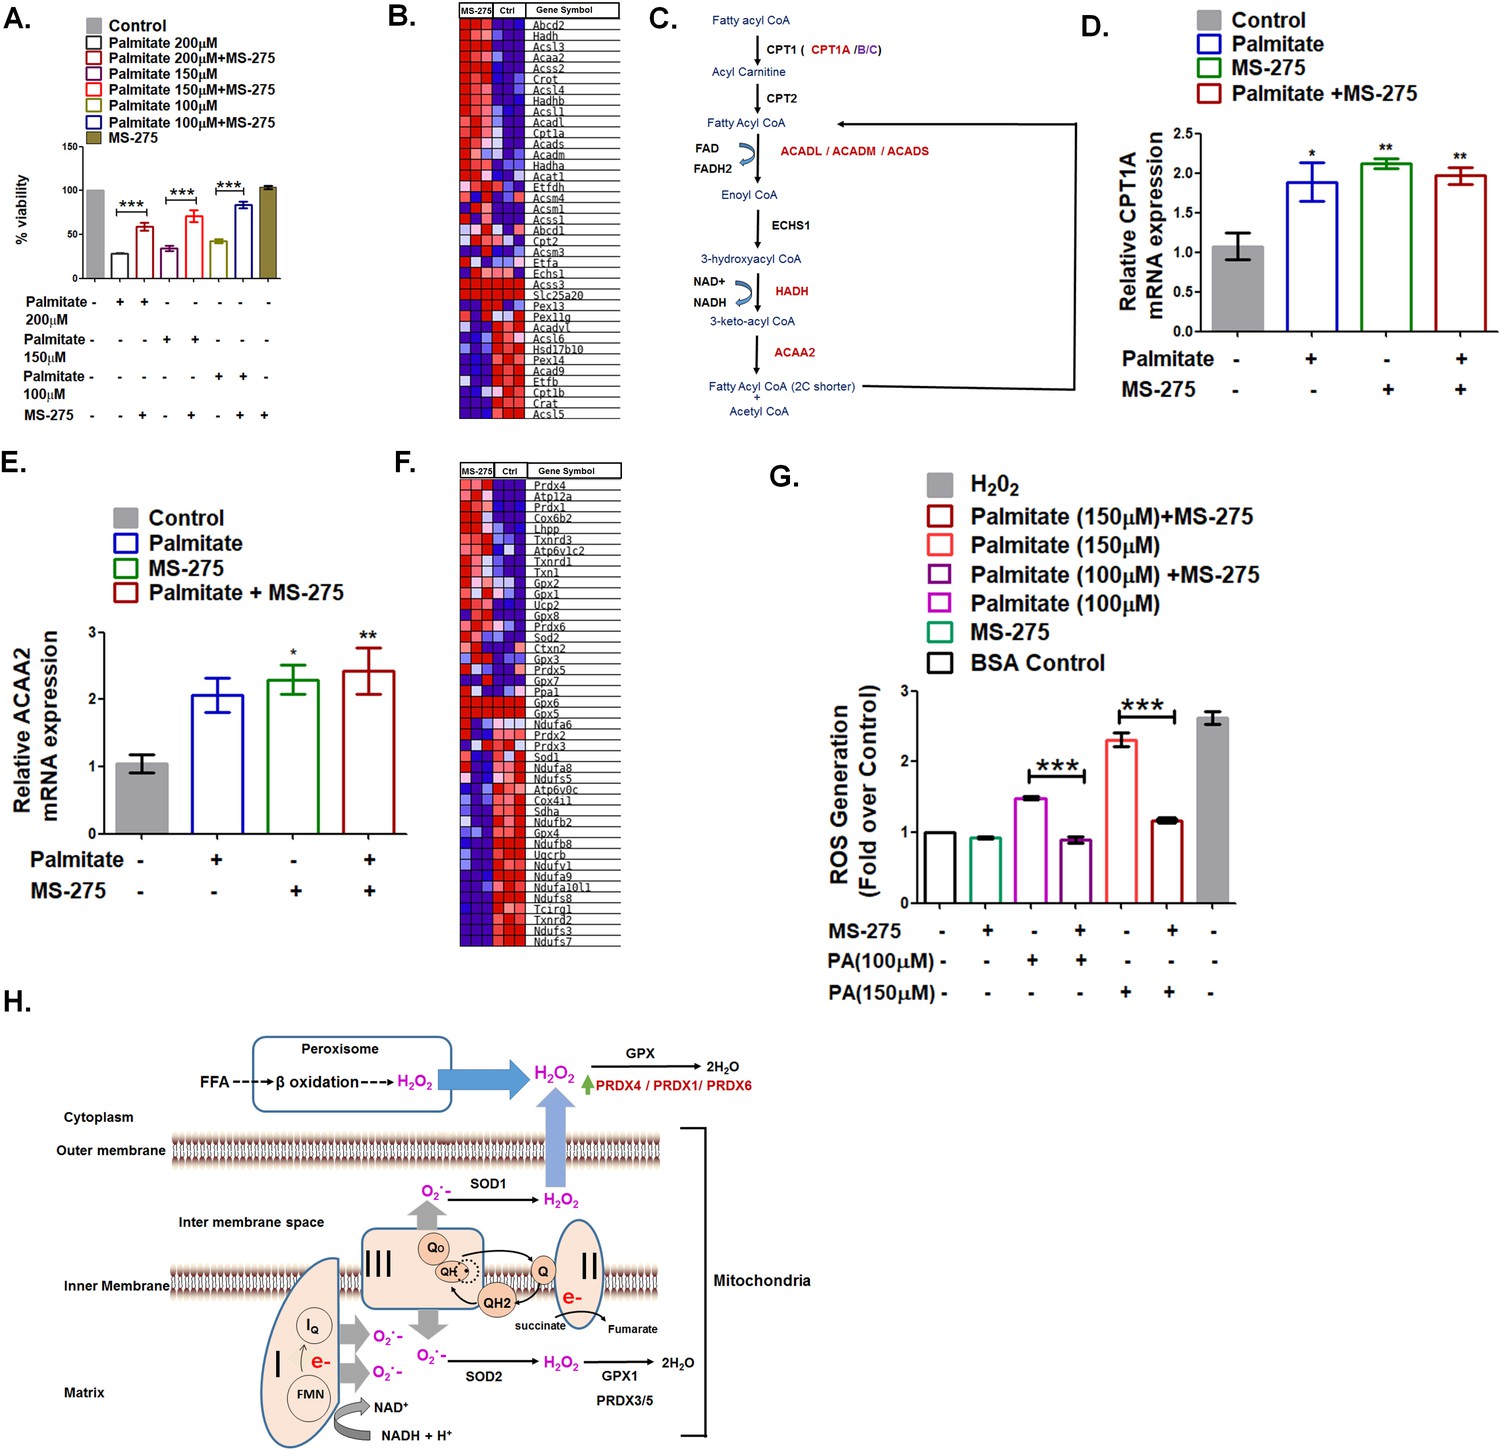
MS275 prevents palmitate-induced cell death in cultured pancreatic beta cells.
(A) MS-275 treatment and its impact on palmitate-mediated pancreatic beta-cell death as assessed by MTT assay. Results are mean (± S.E) of three independent experiments; ***p<0.001 was determined by one-way ANOVA, Tukey’s multiple comparison test. (B) GSEA Blue–Pink O’ gram of the genes of the fatty acid degradation pathway in control and MS-275-treated pancreatic beta cells. The graph represents the profile of the running enrichment score and positions of the gene-set members in the rank order list. NES = Normalized enrichment score, FDR = False Discovery Rate. (C) Flow diagram of the β-oxidation pathway; the enzymes that are upregulated on MS-275 treatment are in red. (D) The Effect of palmitate on the mRNA expression of Cpt1A in the control and MS-275-treated pancreatic beta cells; the quantification being carried out using the 2-ΔΔCT method and the data normalized using 18S rRNA as reference. Results are represented as mean (± SE) of three independent experiments; **p<0.01, *p<0.05 was determined by one way ANOVA, Tukey’s multiple comparison test. (E) The effect of palmitate on the ACAA2 mRNA expression in the control and MS-275-treated pancreatic beta cells; the quantification being carried out using the 2-ΔΔCT method and the data normalized using 18S rRNA as reference. Results are represented as mean (± SE) of three independent experiments; **p<0.01, *p<0.05 was determined by one-way ANOVA, Tukey’s multiple comparison test. (F) GSEA Blue–Pink O’ gram of the representative antioxidant genes in the control and MS-275-treated pancreatic beta cells. (G) The effect of palmitate on ROS generation in the control and MS-275-treated pancreatic beta cells. The results are represented as mean (± SE) of three independent experiments; ***p<0.001, determined by one-way ANOVA, Tukey’s multiple comparison test. (H) Graphical representation of the generation of reactive oxidants upon free-fatty acid oxidation and their quenching upon MS-275-mediated upregulation of Prdx1, Prdx4, and Prdx6 genes in pancreatic beta cells.
-
Figure 5—source data 1
a.Source Data Figure 5A.
MS-275 treatment and its impact on palmitate-mediated pancreatic beta-cell death. b. Source Data Figure 5G: The effect of palmitate on ROS generation in control and MS-275-treated pancreatic beta cells.
- https://cdn.elifesciences.org/articles/52212/elife-52212-fig5-data1-v1.xlsx
Figure 6
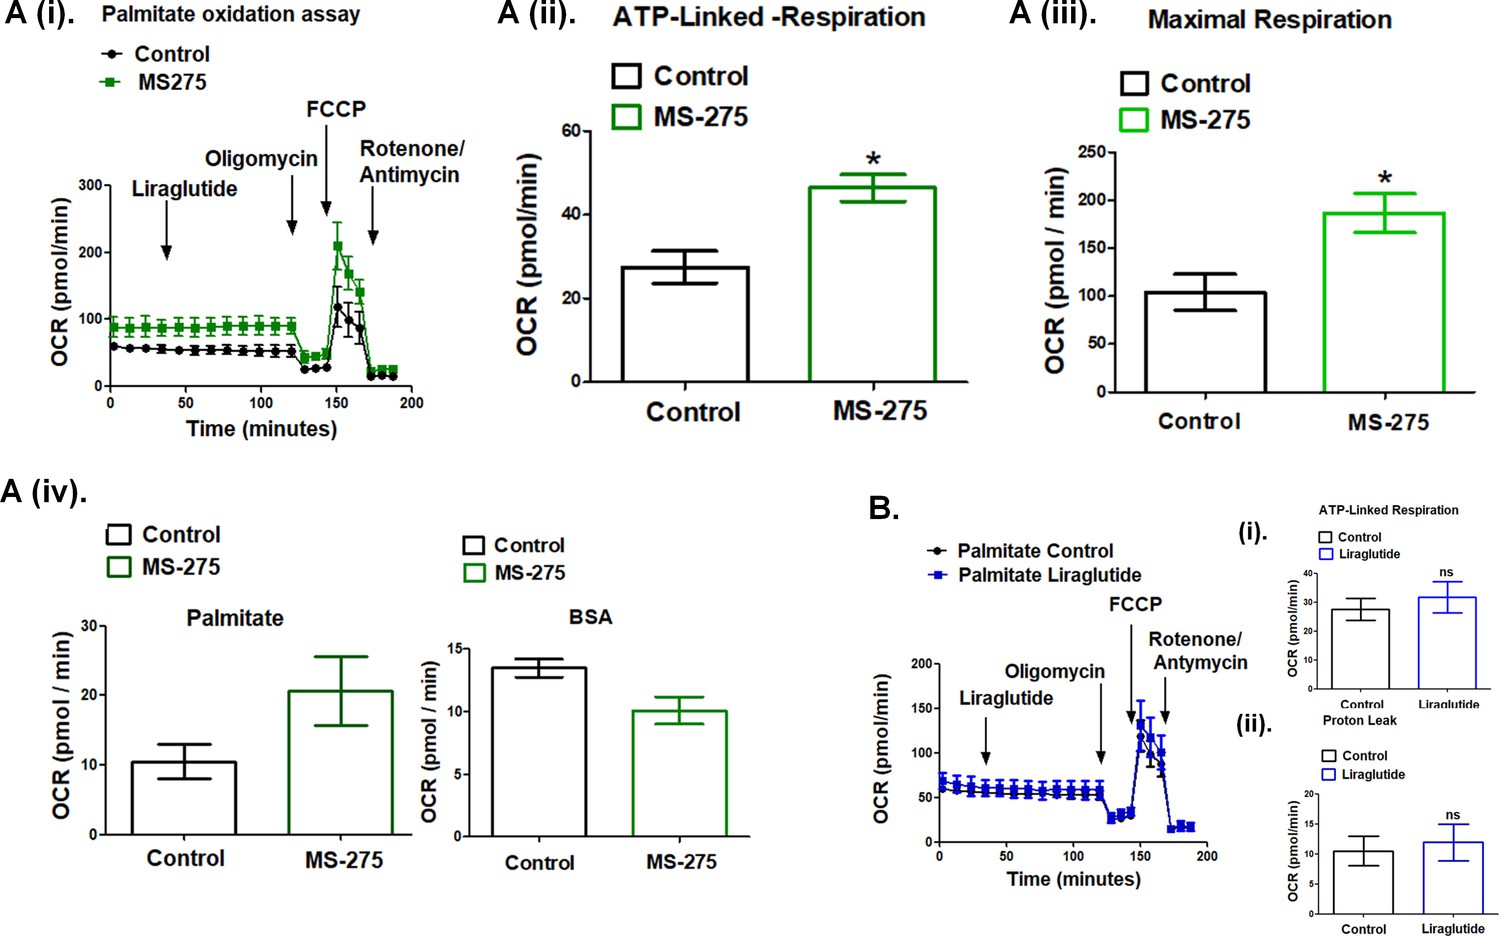
MS—275 promotes fatty acid oxidation in cultured adipocytes.
(A) (i) Oxygen consumption rate (OCR) over time using palmitate (500 μM) as the substrate in the control and MS-275-treated cultured mouse adipocytes; after 30 min of recording the basal respiration, liraglutide (1 μM) was added and the OCR was recorded for another 90 min. Oligomycin (2 μM), FCCP (5 μM), and Rotenone/Antimycin (8 μM each) were added at 120, 145, and 170 min, respectively. (ii) ATP-linked Respiration in control and MS-275-treated 3T3L1 adipocytes as determined upon the addition of ATP-synthase inhibitor Oligomycin. Results were represented as mean (± SE); *p<0.05 was determined using Welch’s t-test. (iii) Maximal respiration in control and MS-275-treated 3T3L1 adipocytes that were obtained upon the addition of FCCP and subtracting non-mitochondrial respiration rates. Results are represented as mean (± SE); *p<0.05 was determined using Welch’s t-test. (iv) Proton leak in the control and MS-275-treated adipocytes derived by subtracting ATP-linked respiration from the mitochondrial respiration using (i) Palmitate (500 μM), as substrate and (ii) Fat-free BSA as the substrate. With palmitate as the substrate, the proton leak increased from 10.51 ± 2.43 pmol/min to 20.62 ± 4.97 pmol/min. (B) Oxygen consumption rate (OCR) over time using palmitate (500 μM) as the substrate in the control and liraglutide-treated cultured mouse adipocytes. (i) ATP-linked respiration and (ii) OCR linked to Proton leak is comparable in control adipocytes and upon liraglutide treatment.
Figure 7

MS—275 enhances the efficiency of liraglutide in improving glucose tolerance.
(A) Effect of acute MS-275 and liraglutide monotherapy versus combined therapy on the fasting blood sugar in C57BL/6 male mice fed on a high-fat diet (HFD). DIO mice received the intraperitoneal injection of MS-275 (5 mg/kg body weight every alternate day) or subcutaneous injection of liraglutide (3 nmol/kg body weight twice weekly) or a combination of the two drugs (n = 6 each group). The mice received a second dose of the injection after 24 h and fasted for 5 h following which the blood glucose was measured. Data represent mean ± S.E; ***p<0.001, **p<0.01, *p<0.05; as determined by one-way ANOVA, Tukey’s multiple comparison test; ns: non-significant (B) Effect of chronic MS-275 and liraglutide combined therapy on fasting blood sugar in C57BL/6 male mice fed on a HFD and receiving intraperitoneal injection of MS-275 (5 mg/kg body weight, every alternate day), subcutaneous injection of liraglutide (3 nmol/kg body weight twice weekly) or combined MS-275 and liraglutide co-therapy (n = 6 each group). Fasting blood glucose was measured at the end of the study. Data represent mean ± S.E.; ***p<0.001, **p<0.01, *p<0.05; as determined by one-way ANOVA, Tukey’s multiple comparison test; ns: non-significant (C) Intraperitoneal glucose tolerance test (IPGTT) in C57BL/6 male mice fed on the chow diet, HFD and receiving intraperitoneal injection of MS-275 (5 mg/kg body weight, every alternate day), subcutaneous injection of liraglutide (3 nmol/kg body weight twice weekly) or combined MS-275 and liraglutide co-therapy (n = 6 each group). Results represent mean ± S.E. ***p<0.001, **p<0.01, depicting the significant difference of glucose tolerance between the group receiving combined therapy versus the vehicle control at specific time points was determined by the analysis of variance (two-way ANOVA, Bonferroni posttests). (D) The AUC of the IPGTT in mice fed on chow diet, HFD and receiving intraperitoneal injection of MS-275 (5 mg/kg body weight, every alternate day), subcutaneous injection of liraglutide (3 nmol/kg body weight twice weekly) or combined MS-275 and liraglutide co-therapy (n = 6 each group). Data represent mean ± S.E.; ***p<0.001, **p<0.01, as determined by one-way ANOVA, Tukey’s multiple comparison test; ns = non significant. (E) Insulin content assessment in mice on chow diet, HFD and receiving an intraperitoneal injection of MS-275 (5mg/kg body weight, every alternate day), subcutaneous injection of liraglutide (3 nmol/kg body weight twice weekly) or combined MS-275 and liraglutide co-therapy (n = 5 each group) as evaluated by insulin ELISA. Data represent mean ± SE; ***p<0.001 as determined by one-way ANOVA, Tukey’s multiple comparison test. (F) GLP-1R Immunoblot from pooled pancreatic tissue isolated from DIO mice receiving vehicle, liraglutide, MS-275, and the combined therapy of liraglutide and MS-275. Beta-actin served as the loading control. (G) Gαs immunoblot from pooled pancreatic tissue isolated from DIO mice receiving vehicle, liraglutide, MS-275, and combined therapy of liraglutide and MS-275. Beta-actin served as a loading control.
-
Figure 7—source data 1
a.Source Data Figure 7A.
Effect of acute MS-275 and liraglutide monotherapy and combined therapy on fasting blood sugar in C57BL/6 DIO male mice b. Source Data Figure 7B: Effect of chronic MS-275 and liraglutide-combined therapy on fasting blood sugar in C57BL/6 male mice fed a high-fat diet. c. Source Data Figure 7C and Figure 7D: Intraperitoneal glucose tolerance test (IPGTT) in C57BL/6 male mice fed on chow diet, high-fat diet and receiving intraperitoneal injection of MS-275 (5mg/kg body weight, every alternate day), subcutaneous injection of liraglutide (3 nmol/kg body weight twice weekly) or combined MS-275 and liraglutide co-therapy.
- https://cdn.elifesciences.org/articles/52212/elife-52212-fig7-data1-v1.xlsx
-
Figure 7—source data 2
a.Source Data Figure 7F.
Western blot pictures (uncut) showing the impact of the vehicle, liraglutide, MS-275, and combined liraglutide and MS-275 co-therapy on GLP-1R protein expression in pancreatic tissue pooled from each group; beta-actin immunoblot served as the loading control. b. Source Data Figure 7G: Western blot pictures (uncut) showing the impact of the vehicle, liraglutide, MS-275, and combined liraglutide and MS-275 co-therapy on Gαs protein expression in pancreatic tissue pooled from each group. Beta-actin immunoblot served as the loading control.
- https://cdn.elifesciences.org/articles/52212/elife-52212-fig7-data2-v1.docx
Figure 8
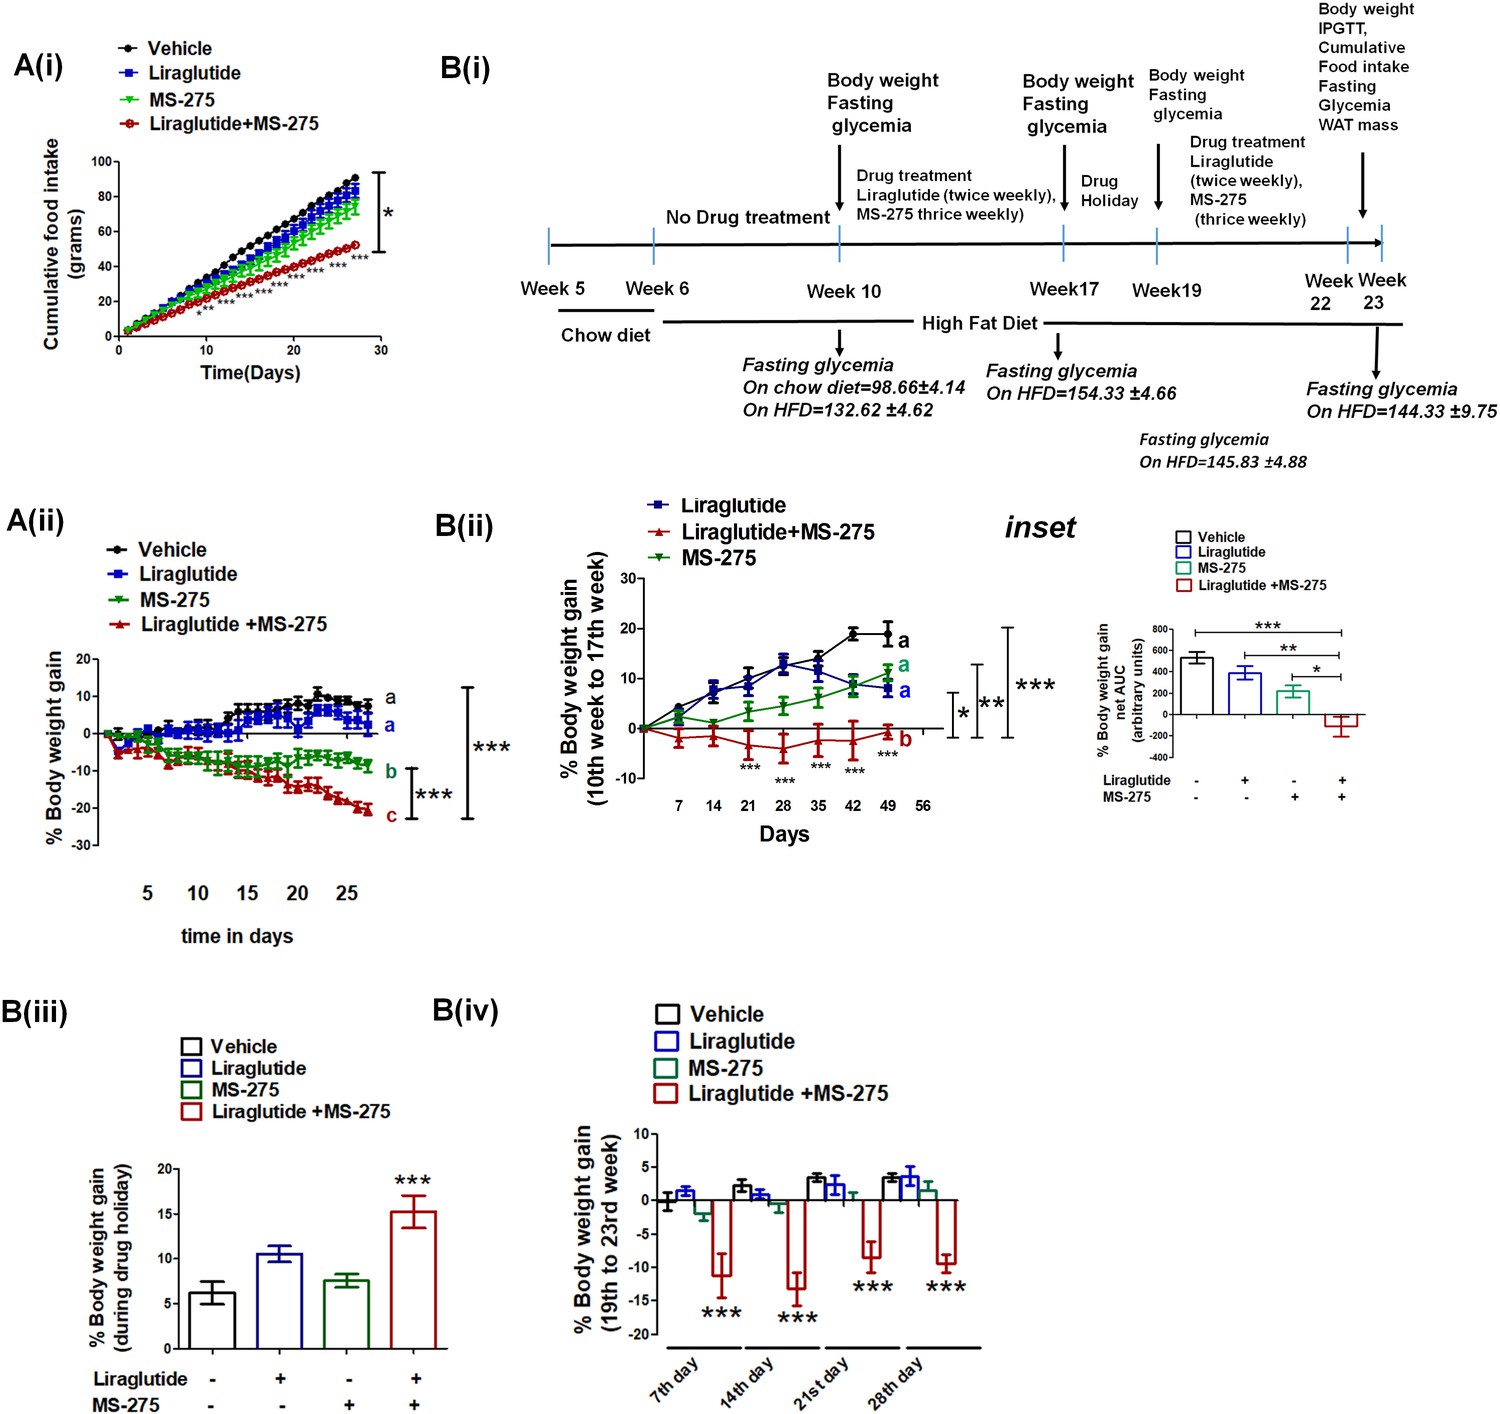
MS—275 and liraglutide reduces calorie uptake and decreases body weight gain.
(A) Diet-induced obese (DIO) male mice were subjected to 4-week treatment with liraglutide (3 nmol/kg body weight twice weekly), MS-275 (5 mg/kg body weight, every alternate day), and a combined co-therapy of the two drugs. Fig A (i): Effects on the cumulative food intake measured every day. Results are mean ± S.E (n = 4). *p<0.05 as determined by one-way ANOVA, Tukey’s multiple comparison test. ***p<0.001, determined by analysis of variance (two-way ANOVA, Bonferroni post-tests) comparing between the groups receiving vehicle or liraglutide and MS-275 combined therapy at specific time points. Fig A (ii): Effects on the body weight gain measured every day. Results are mean ± S.E (n = 4); mean values with different letters are significantly different at ***p<0.001, one-way ANOVA, Tukey’s multiple comparison test. (B) (i) A flow diagram depicting the diet and the treatment regimen, as well as pharmacological parameters measured to assess the impact of liraglutide and MS-275 monotherapy and the combined co-therapy of the two drugs on the progression of diet-induced obesity; (ii) Effect of MS-275, or liraglutide monotherapy and co-therapy on the body weight gain in mice fed on the high-fat diet from the 10th week to the 17th week of their age (n = 6 per group). Data represent mean ± SE; mean values of respective treatment groups represented by different letters that indicate significant statistical difference (***p<0.001, **p<0.01,*p<0.05 as determined by one-way ANOVA, Tukey’s multiple comparison test). ***p<0.001; comparing vehicle and the group receiving liraglutide and MS-275 combined therapy at specific time points was determined by analysis of variance; (two-way ANOVA, Bonferroni posttests). Inset: The area under the curve (AUC) of the body weight gain in DIO mice receiving the intraperitoneal injection of MS-275 (5 mg/kg body weight, every alternate day), subcutaneous injection of liraglutide (3 nmol/kg body weight twice weekly) or combined MS-275 and liraglutide co-therapy (n = 6 each group). Data represent mean ± S.E.; ***p<0.001,*p<0.05, as determined by one-way ANOVA, Tukey’s multiple comparison test. (iii) The body weight gain during drug holiday (from week 17 to week 19); the chronic dosing was discontinued and mice were fed ad libitum with the high-fat diet. Body weight was assessed at the end of the drug holiday period. Results represent mean ± S.E, ***p<0.001 determined by one-way ANOVA, Tukey’s multiple comparison test. (iv) The body weight gain post drug holiday after reintroduction of MS-275, or liraglutide monotherapy relative to combined therapy from 19th to 23rd week. Body weight gain was assessed at the end of every week for 4 weeks. ***p<0.001 determined by analysis of variance (factorial ANOVA, Bonferroni post hoc tests) comparing body weight gain between the vehicle control group and the group receiving liraglutide and MS-275 combined therapy.
-
Figure 8—source data 1
a. Source Data Figure 8A.
Effect of 4-week treatment of DIO male mice with liraglutide (3 nmol/kg body weight twice weekly), MS-275 (5 mg/kg body weight, every alternate day), and a combined co-therapy of the two drugs on cumulative food intake and body weight gain. b. Source Data- Figure 8B, Impact of liraglutide and MS-275 monotherapy and the combined co-therapy of the two drugs on the progression of diet-induced obesity.
- https://cdn.elifesciences.org/articles/52212/elife-52212-fig8-data1-v1.xlsx
Figure 9 with 2 supplements
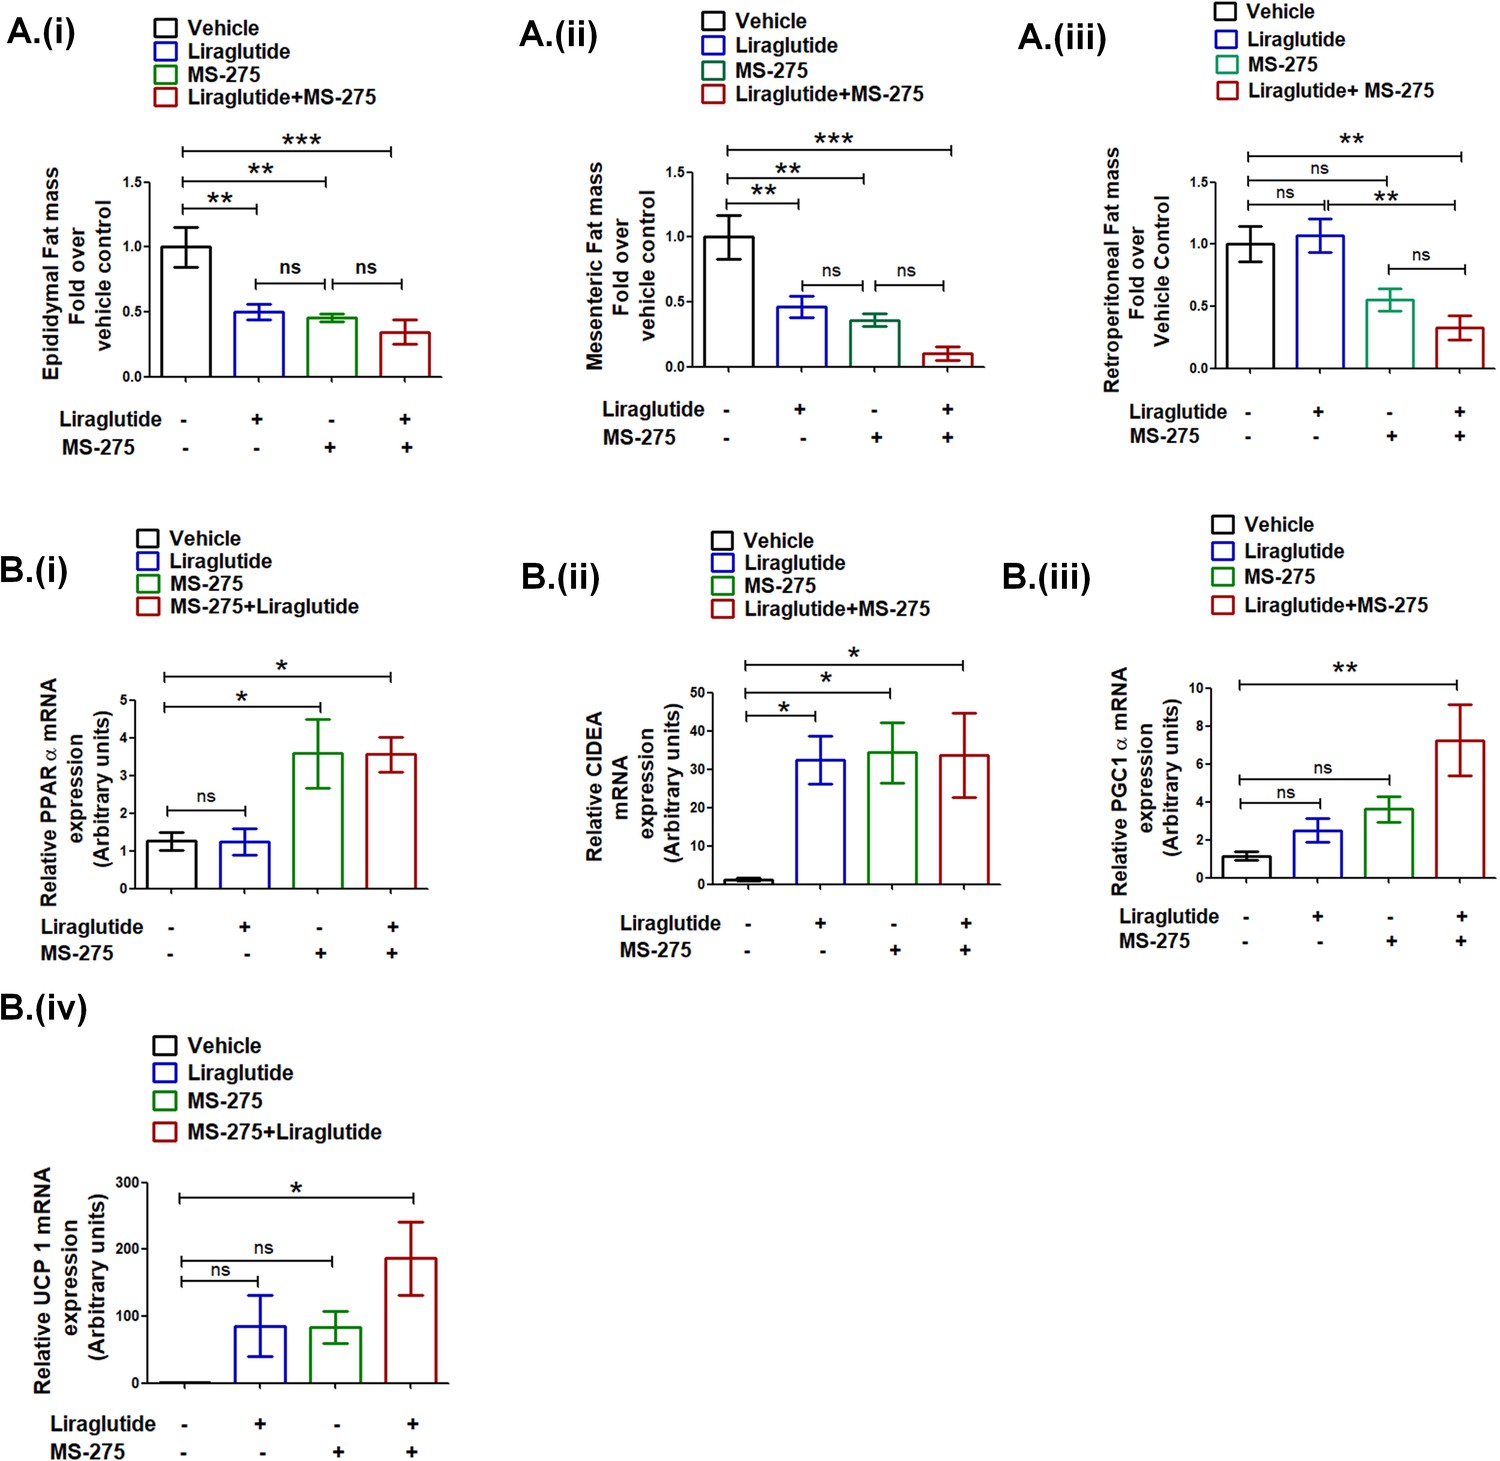
Liraglutide and MS-275 combined therapy reduces visceral obesity.
(A) The effect of liraglutide and MS-275 monotherapy and the combined co-therapy of the two drugs on (i) epididymal fat mass, (ii) mesenteric fat mass, and (iii) retroperitoneal fat mass; the data expressed as fold over the vehicle control represent mean ± S.E; ***p<0.001,**p<0.01, as determined by one-way ANOVA, Tukey’s multiple comparison test; ns: non-significant. (B) The effect of liraglutide and MS-275 monotherapy and the combined co-therapy of the two drugs on (i) PPAR α mRNA expression, (ii) CIDEA mRNA expression, (iii) PGC1α expression, and (iv) UCP1 expression in retroperitoneal WAT as quantified using the 2-ΔΔCT method. Results are normalized using 18s rRNA as a reference and represent mean ± S.E. **p<0.01, *p<0.05, as determined by one-way ANOVA, Tukey’s multiple comparison test; ns = non significant.
-
Figure 9—source data 1
a Source data Figure 9A.
Effect of MS-275, or liraglutide monotherapy and combined therapy on white adipose tissue mass; (i) epididymal, (ii) retroperitoneal, and (iii) mesenteric WAT in DIO mice b. Source data Figure 9B: Effect of MS-275, or liraglutide monotherapy and combined therapy on relative mRNA expression of PPARα (i), CIDEA (ii), PGC1α (iii), and UCP1 (iv) in retroperitoneal WAT of HFD mice that were quantified using the 2-ΔΔCT method.
- https://cdn.elifesciences.org/articles/52212/elife-52212-fig9-data1-v1.xlsx
Figure 9—figure supplement 1
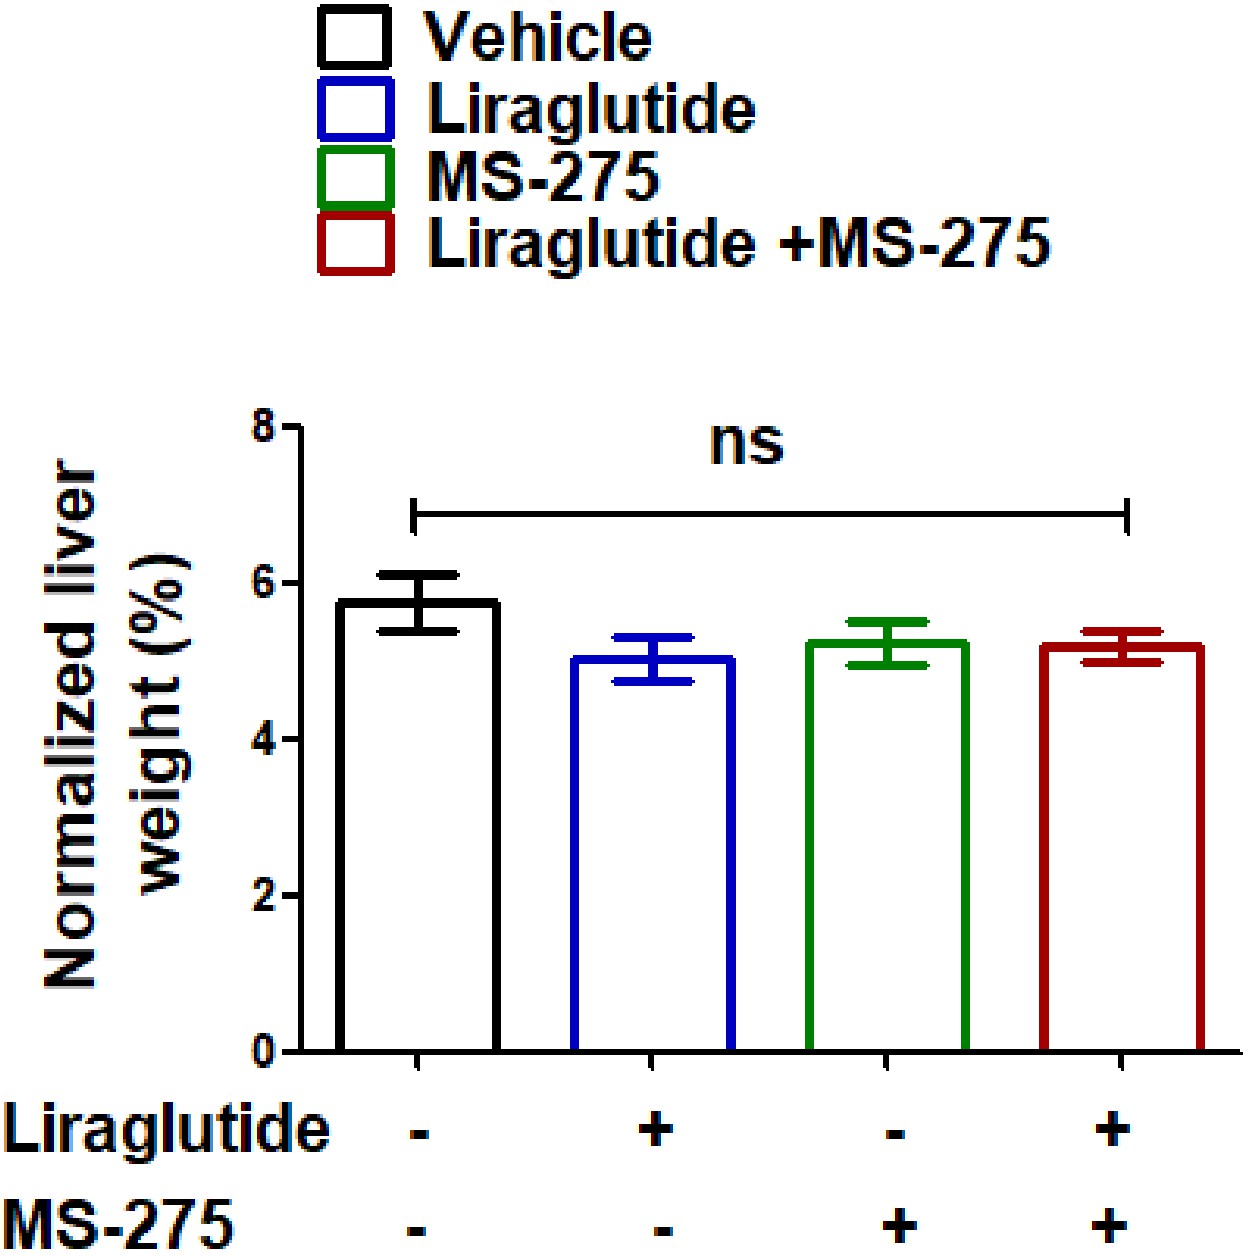
Effect of MS-275, liraglutide monotherapy, and combined therapy or the vehicle control on the liver weight, the data represent mean ± S.E; ns: non-significant.
Figure 9—figure supplement 2
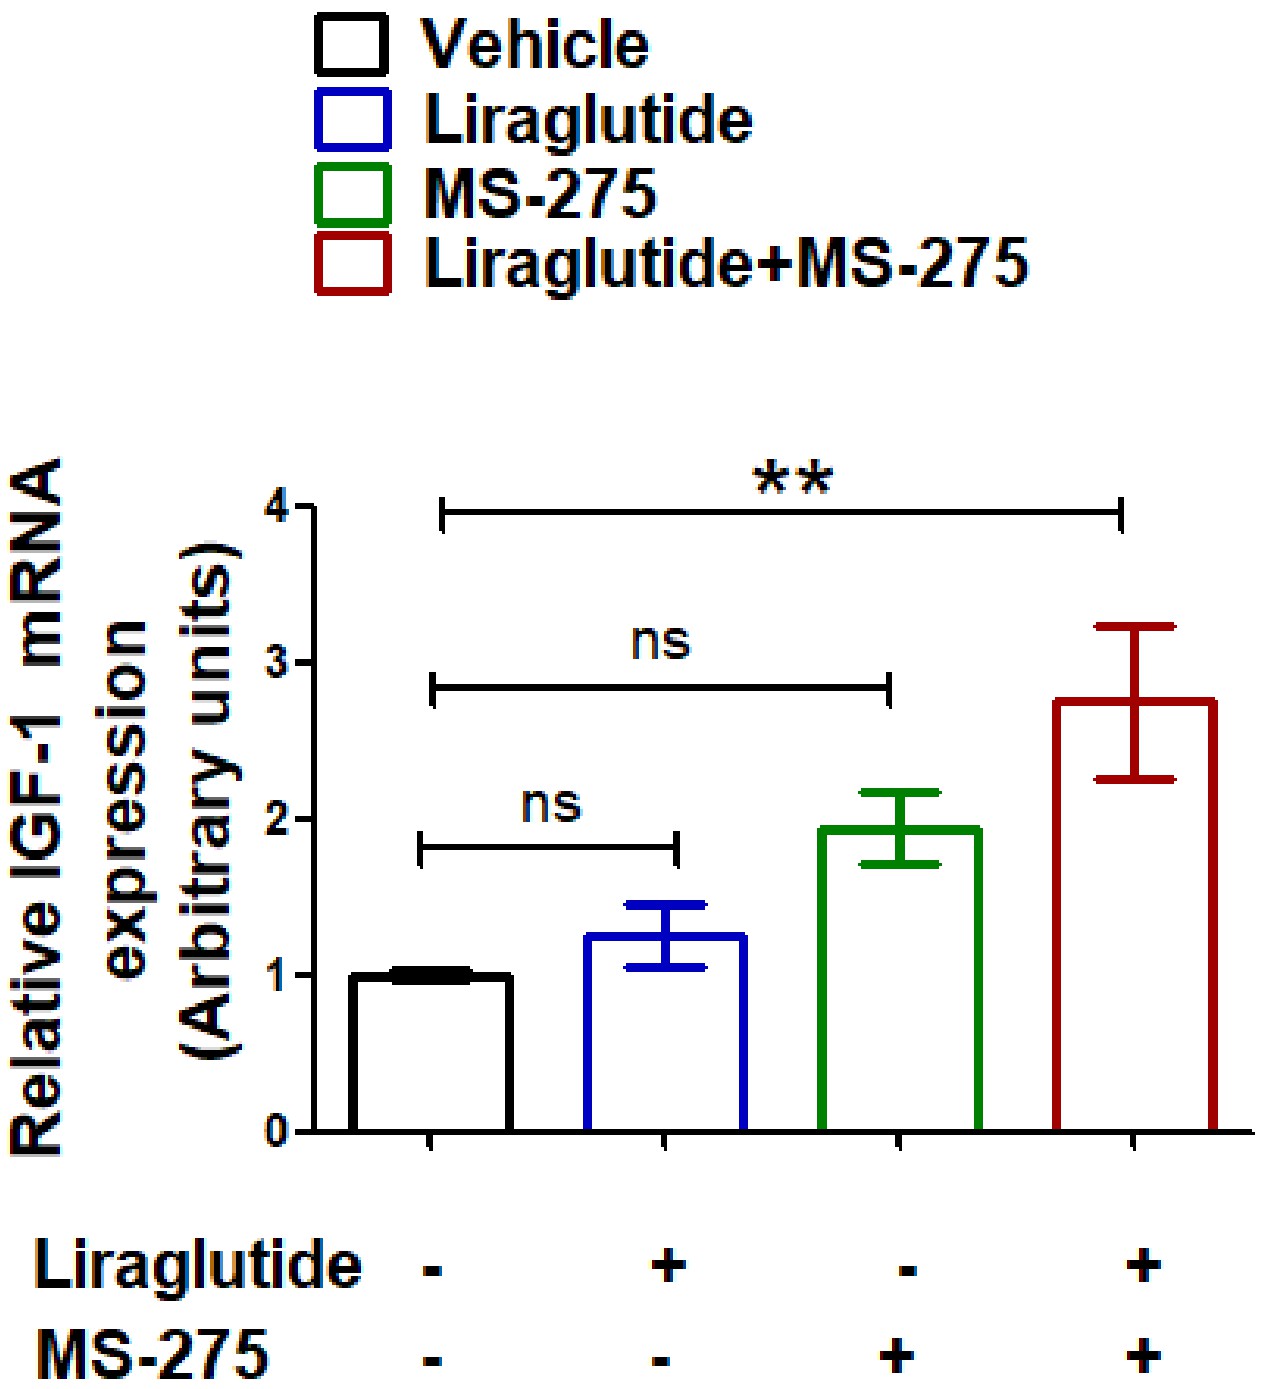
Effect of MS-275, liraglutide monotherapy, and combined therapy or the vehicle control on the IGF1 expression in liver, n = 4; the data represent mean ± S.E.
**p<0.01, as determined by one-way ANOVA, Tukey’s multiple comparison test; ns: non-significant.
Figure 10
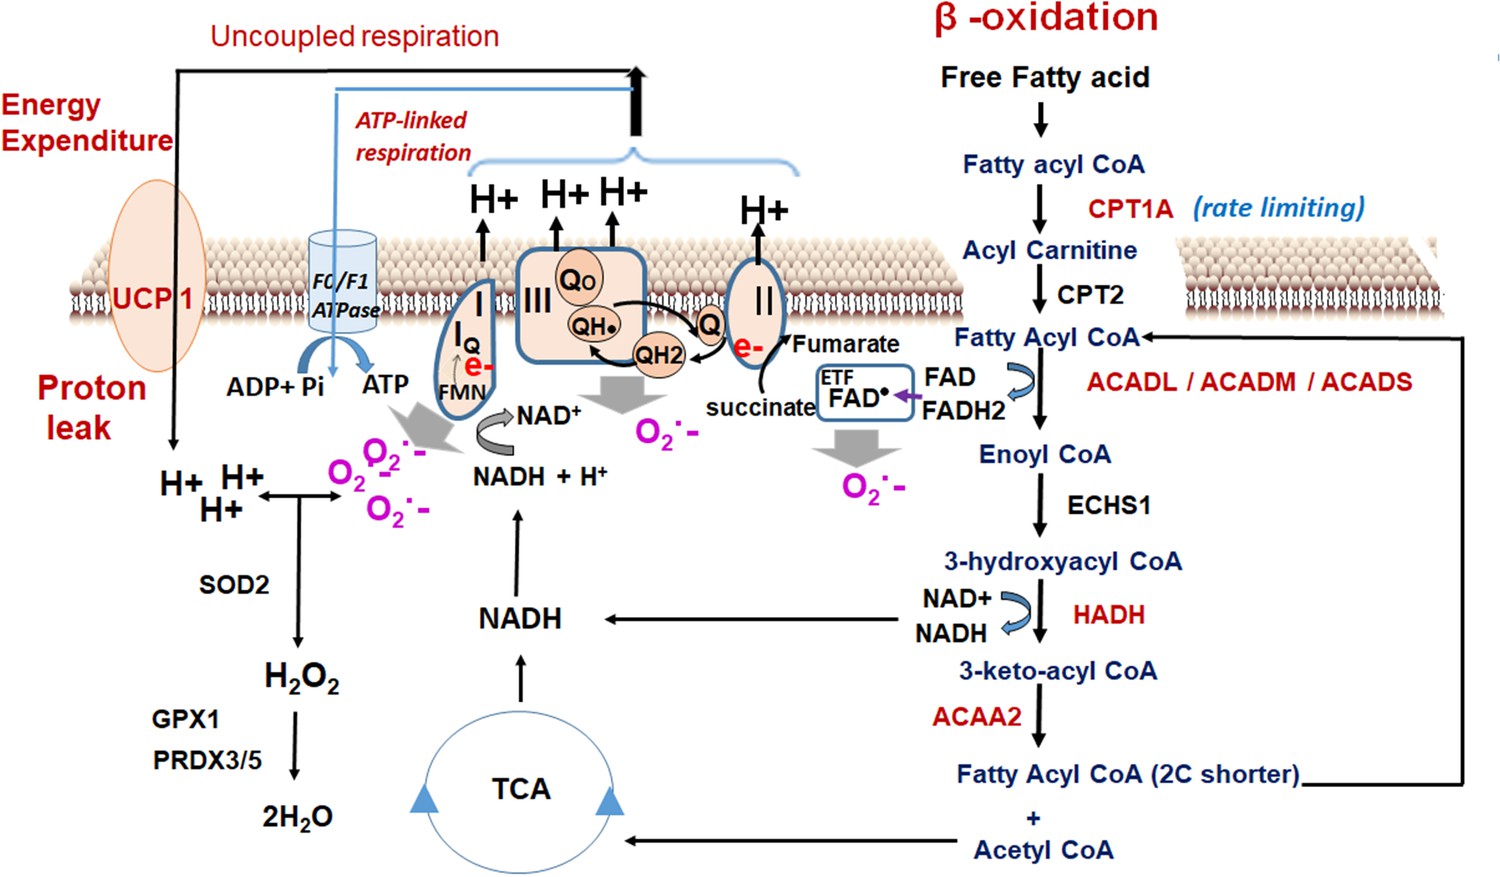
Oxidant quenching cycle drives the proton leak in MS-275-treated adipocytes.
The pathway is initiated upon an increase in the β-oxidation flux that results in the superoxide generation. The quenching of the superoxide by antioxidant enzymes at the mitochondrial matrix drives the proton leak and hence the energy expenditure. The enzymes and the pathway that are activated upon MS-275 treatment are marked in red. FAD: Flavin adenine dinucleotide; ETF; Electron- transferring flavoprotein.
Tables
Key resources table
| Reagent type (species) or resource | Designation | Source or reference | Identifiers | Additional information |
|---|---|---|---|---|
| Cell Line (Rattus norvegicus) | BRIN-BD 11 Strain NEDH | ECACC | Cat No: 10033003 | A hybrid cell line formed by the electrofusion of a primary culture of NEDH rat pancreatic islets with RINm5F (a cell line derived from a NEDH rat insulinoma) |
| Transfected construct (conserved CRE sequence; Homo-sapiens) | CRE6X-Luc | Kuna et al., 2013 | Plasmid vector pcDNA3.1+ | A gift from Prof Richard Day, Indiana University |
| Transfected construct (Homo-sapiens) | Β-galactosidase | Kuna et al., 2013 | Plasmid vector pcDNA3.1+ | |
| Transfected construct (Homo-sapiens) | Rab5A: S34N | Girada et al., 2017 | Plasmid vector pcDNA3 | EGFP-Rab5A S34N was a gift from Dr. Qing Zhong (Addgene plasmid # 28045); |
| Transfected construct (Homo-sapiens) | GLP-1R_GFP | Kuna et al., 2013 | pcDNA3.1+ | |
| Recombinant DNA reagent | pcDNA 3.1+ | Invitrogen | Catalog nos. V790-20 | |
| Peptide, recombinant protein | IUB-68 | Kuna et al., 2013 | Synthesized in house (Prof. DiMarchi’s Lab ) | Chemically synthesized GIPR agonist |
| Peptide, recombinant protein | Jant4 | Patterson et al., 2011 | Synthesized in house (Prof. DiMarchi’s Lab ) | Chemically synthesized GLP-1R antagonist |
| Peptide, recombinant protein | Liraglutide (Victoza) | Novo Nordisk | Acylated GLP-1R agonist | |
| A chemical compound, Drug | MS-275 | Synthesized in house DRILS Chemistry Division | HDAC inhibitor | |
| A chemical compound, Drug | MS-275 | Sigma | EPS002 | HDAC inhibitor |
| Commercial assay, kit | Steady lite Plus | Perkin Elmer | 6066751 | High sensitivity luminescence reporter gene assay system |
| Commercial assay kit | XF Palmitate Oxidation Stress Test Kit | Agilent | 103693–100 | Real-time respirometry advanced assay for palmitate-induced oxygen consumption |
| Commercial assay kit | Seahorse XF Cell Mito Stress Test Kit | Agilent | 103015–100 | Measures oxygen consumption rate in real-time |
| Commercial assay kit | Seahorse XF Cell glycolytic Stress Test Kit | Agilent | 103344–100 | Measures extracellular acidification rate in real-time |
| Commercial assay, kit | BCA PROTEIN ASSAY KIT | Santa Cruz | sc-200629 | Protein estimation |
| Commercial assay, kit | INSULIN ELISA KIT (RAT/MOUSE) | Merck | EZRMI-13K | Insulin quantification |
| Commercial assay, kit | cAMP DIRECT-X IMMUNOASSAY ELISA KIT | ARBOR | K019-H1 | cAMP immunoassay |
| Commercial assay, kit | KAPPA 2X SYBR FAST KIT | KAPA Biosystems | KK4601 | RT-PCR |
| Commercial assay, kit | SUPERSCRIPT III cDNA SYNTHESIS KIT | Invitrogen | 18080051 | First-strand cDNA synthesis |
| Commercial assay, kit | RNA easy mini kit | Qiagen | 74104 | |
| Commercial assay, kit | Plasmid Isolation Kit | Invitrogen | K210005 | |
| Antibody | RPL13A (rabbit polyclonal antibody) | Thermo | PA5-17176 | Dilution (1:1000) |
| Antibody | H3k27 Ac (rabbit polyclonal) | Abcam | Ab4729 | Dilution (1:5000) |
| Antibody | Gαs (mouse monoclonal) | Santa Cruz | Sc-365855 | Dilution (1:1000) |
| Antibody | GLP-1R (mouse monoclonal) | Santa Cruz | Sc-390774 | Dilution (1:1000) |
| Antibody | Β-arrestin ½ (rabbit monoclonal) | CST | CST#4674S | Dilution (1:1000) |
| Antibody | p44/42 MAPK (Erk1/2) (rabbit polyclonal) | CST | CST#9102 | Dilution (1:1000) |
| Antibody | Β-actin (mouse monoclonal) | Santa Cruz | Sc-47778 | Dilution (1:2000) |
| Antibody | SNAP25 (mouse monoclonal) | Santa Cruz | Sc-376713 | Dilution (1:500) |
| Biological sample (Rattus norvegicus) | Pancreatic islets | Vivo Biotech | Freshly isolated fromRattus norvegicus | |
| Biological sample (Mus musculus) | Visceral adipose tissue, liver, pancreas | In house animal facility at University of Hyderabad, India | Freshly isolated from Mus musculus | |
| Software, algorithm | Graphpad Prism 6.0 | Prism 6.0 | Commercial software |
Additional files
-
Supplementary file 1
Table 1: Primary hits in small molecule screening library at a concentration of 10 µM.
BRIN-BD11 pancreatic beta cells were treated for 18 hr to assess its effect on GLP-1R (liraglutide)-mediated cAMP generation as measured by Cre-Luciferase reporter assay.
- https://cdn.elifesciences.org/articles/52212/elife-52212-supp1-v1.docx
-
Supplementary file 2
Table 2: Composition of high-sucrose high-fat diet fed to C57BL/6 male mice.
- https://cdn.elifesciences.org/articles/52212/elife-52212-supp2-v1.docx
-
Supplementary file 3
Table 3: Sequences of primers for quantitative RT-PCR as described in the table.
- https://cdn.elifesciences.org/articles/52212/elife-52212-supp3-v1.docx
-
Transparent reporting form
- https://cdn.elifesciences.org/articles/52212/elife-52212-transrepform-v1.docx
Download links
A two-part list of links to download the article, or parts of the article, in various formats.
Downloads (link to download the article as PDF)
Open citations (links to open the citations from this article in various online reference manager services)
Cite this article (links to download the citations from this article in formats compatible with various reference manager tools)
MS-275, a class 1 histone deacetylase inhibitor augments glucagon-like peptide-1 receptor agonism to improve glycemic control and reduce obesity in diet-induced obese mice
eLife 9:e52212.
https://doi.org/10.7554/eLife.52212


