Subcellular drug targeting illuminates local kinase action
- University of Washington, United States
- Syracuse University, United States
Figures
Figure 1 with 2 supplements
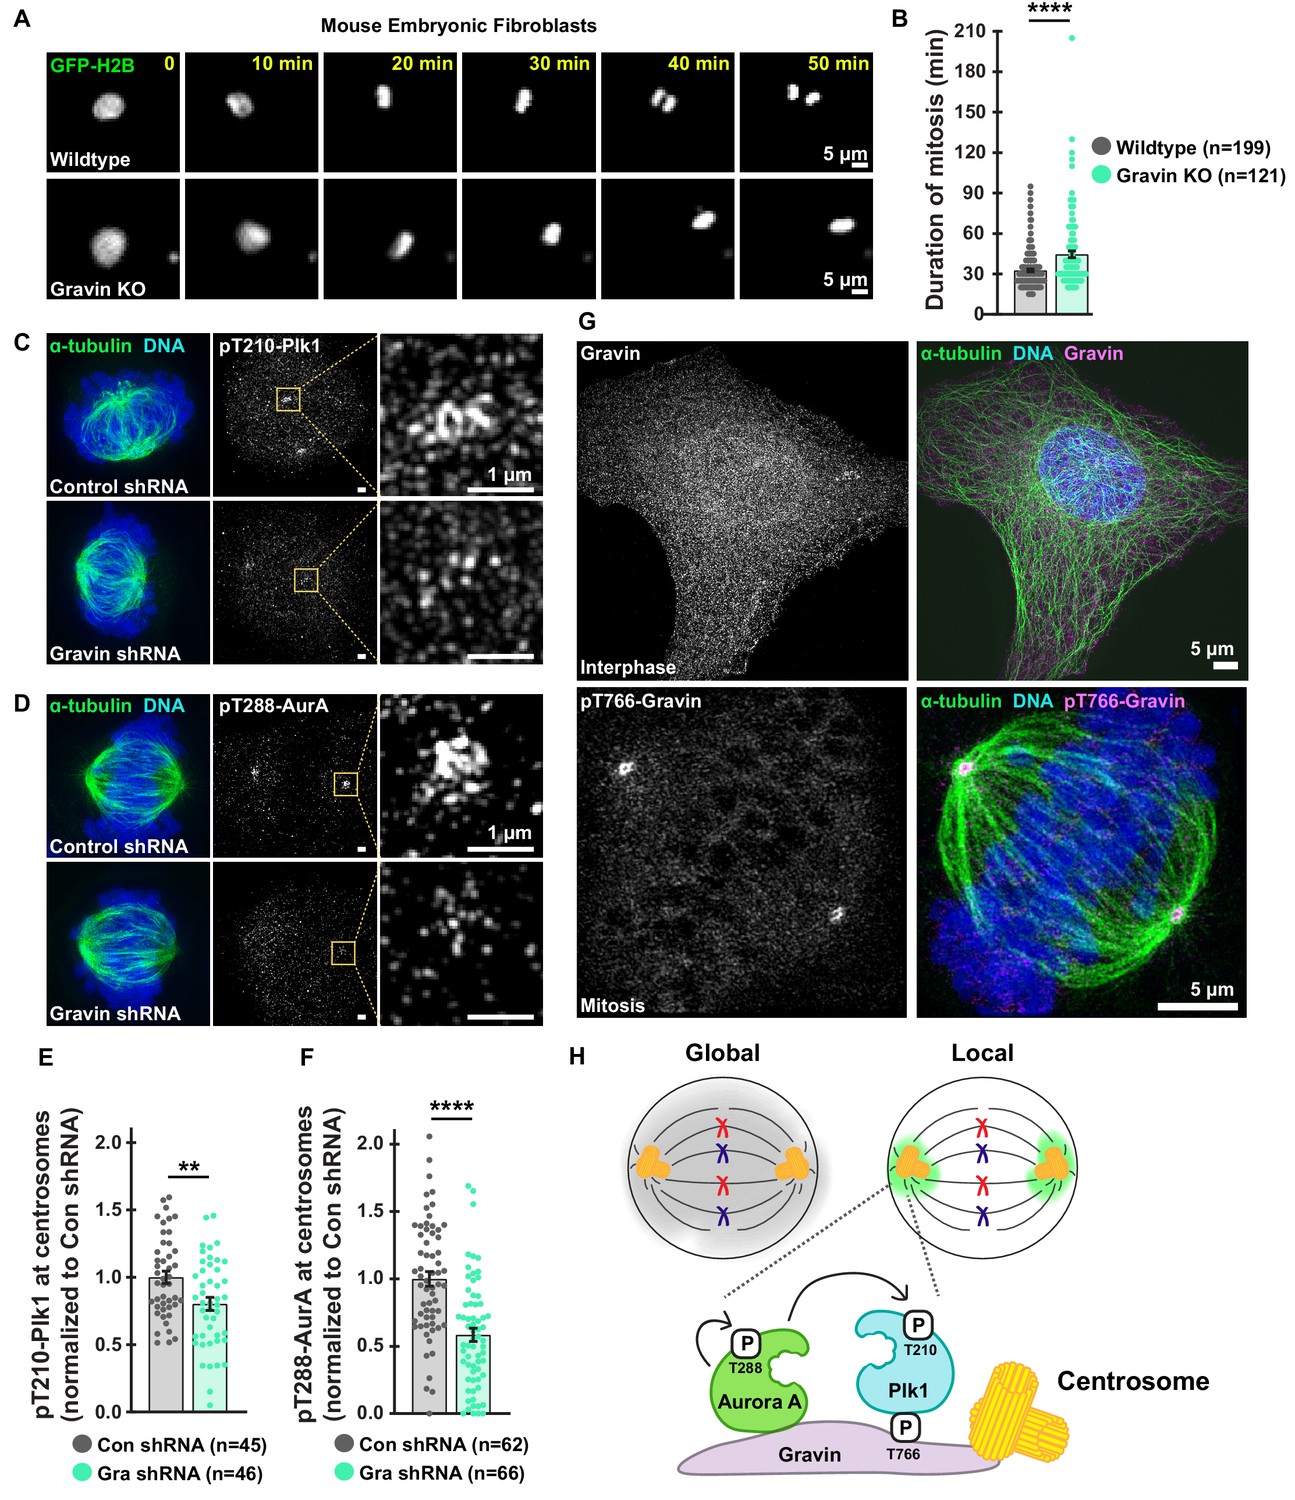
Loss of Gravin perturbs duration of mitosis and accumulation of active mitotic kinases at centrosomes.
(A) Representative time-lapse images of primary MEFs derived from wildtype (top) and Gravin knockout (bottom) cells. Cells transiently expressing GFP-H2B were monitored through mitosis. (B) Quantification of time-lapse experiments depicts duration of mitosis from nuclear envelope breakdown to the onset of anaphase; Wildtype, n = 199, Gravin KO, n = 121, ****p<0.0001. (C, D) Structured illumination microscopy (SIM) of representative mitotic HEK293 cells stably expressing Control or Gravin shRNA. Composite images (left) depict cells stained for α-tubulin (green) and DNA (blue). Immunofluorescence of pT210-Plk1 (C) and pT288-AurA (D) as an index of kinase activity (mid) and 5X magnification of centrosomal pT210-Plk1 (C) and pT288-AurA (D) signals (insets). (E, F) Quantification of centrosomal pT210-Plk1 (E) and pT288-AurA (F) immunofluorescence. Points represent individual cells (n). Data are normalized to Con shRNA; (E) Con shRNA, n = 45, Gra shRNA, n = 46, **p=0.0036; (F) Con shRNA, n = 62, Gra shRNA, n = 66, ****p<0.0001. Experiments were conducted at least three times (N = 3) and P values were calculated by unpaired two-tailed Student’s t-test. Data are mean ± s.e.m. (G) SIM micrographs of Gravin (top, gray and magenta) in interphase and pT766-Gravin (bottom, gray and magenta) in mitotic U2OS cells. Composite images (right) also depict α-tubulin (green) and DNA (blue). (H) Schematic of global drug distribution (gray) vs drug targeting to centrosomes (green). Gravin scaffolds centrosome-localized pools of Plk1 and AurA.
Figure 1—figure supplement 1
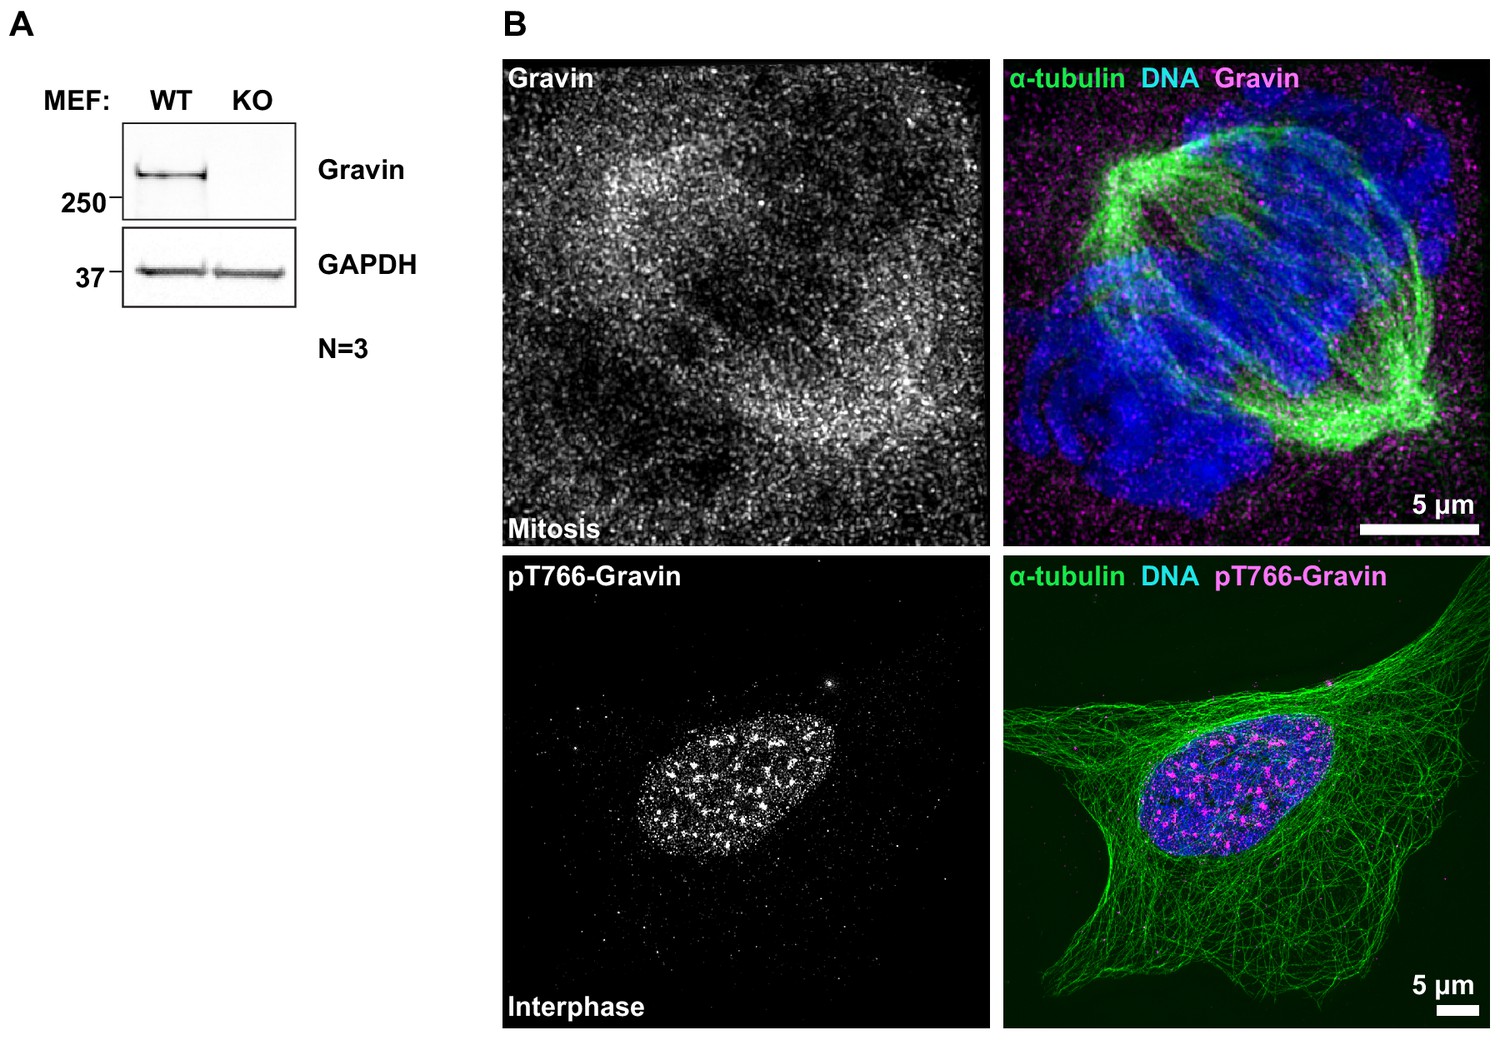
Confirmation of Gravin loss in MEFs and detection of Gravin and pT766-Gravin in mitotic and interphase U2OS cells.
(A) Immunoblot confirming Gravin expression (top) in wildtype (WT) but not Gravin knockout (KO) primary MEFs. GAPDH loading controls (bottom). (B) Matched controls pertaining to Figure 1G. SIM micrographs of Gravin (top, gray and magenta) in mitotic and pT766-Gravin (bottom, gray and magenta) in interphase U2OS cells. Composite images (right) also depict α-tubulin (green) and DNA (blue).
Figure 1—video 1
Loss of Gravin perturbs duration of mitosis.
Time-lapse video of an average wildtype (top) and Gravin KO (bottom) MEF cell expressing GFP-H2B. The interval between each frame is 5 min. Scale bar represents 5 µm. Related to Figure 1A.
Figure 2 with 6 supplements
Validation of the LoKI platform.
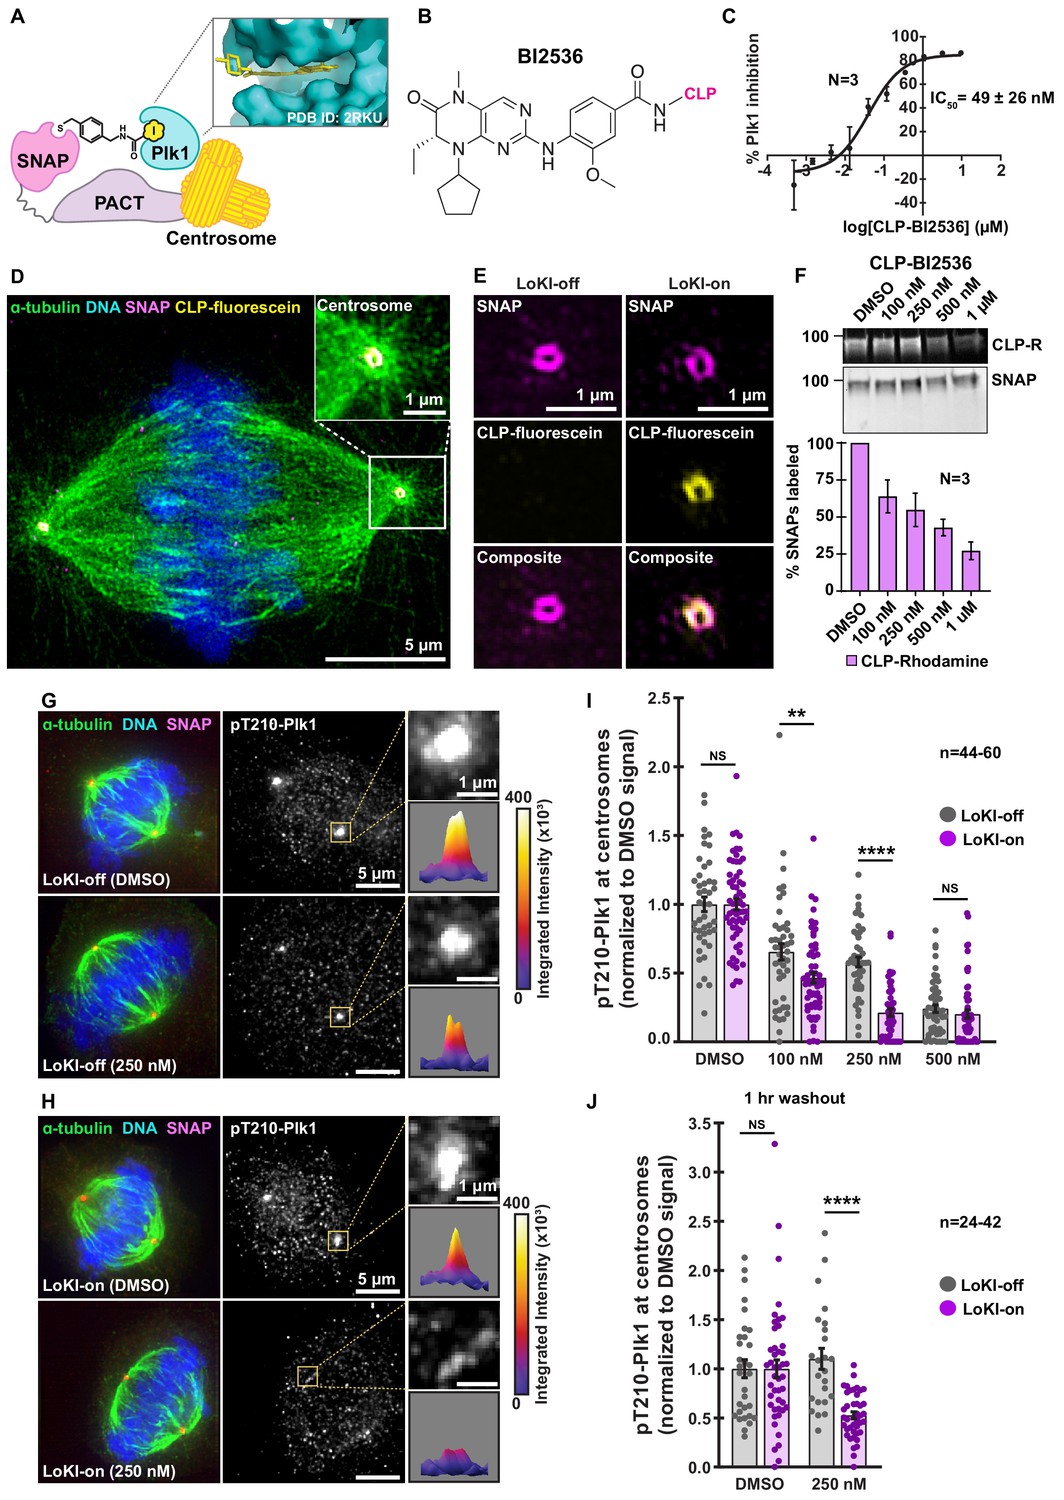
(A) Schematic of a centrosome-directed LoKI platform. SNAP-PACT fusion proteins conjugate CLP-linked Plk1 inhibitors at centrosomes. Inset depicts BI2536 in the ATP-binding pocket of Plk1. (B) Chemical structure of CLP-BI2536. (C) Dose-response curve of in vitro Plk1 inhibition with CLP-BI2536. (D) Structured illumination microscopy (SIM) of a LoKI-on U2OS cell labeled with CLP-fluorescein. Immunofluorescent detection of α-tubulin (green), DNA (blue), mCherry-SNAP-PACT (magenta) and CLP-fluorescein (yellow). Magnification of SNAP and CLP-fluorescein co-distribution at a centrosome (inset). (E) SIM micrographs of LoKI-off (left) and LoKI-on (right) U2OS cells. SNAP expression (top, magenta), CLP-fluorescein conjugation (mid, yellow) and composite images (bottom) are depicted. (F) Pulse-chase experiments measuring CLP-BI2536’s ability to block CLP-rhodamine conjugation to LoKI-on. In-gel rhodamine fluorescence (top), immunoblot of SNAP loading controls (mid), and fluorescence quantification of pulse-chase experiments (bottom). (G, H) Immunofluorescence of representative mitotic LoKI-off (G) and LoKI-on (H) U2OS cells treated with DMSO or 250 nM CLP-BI2536 for 4 hr. Composite images (left) show α-tubulin (green), DNA (blue), and SNAP (magenta). Immunofluorescent detection of pT210-Plk1 (mid, gray) as an index of kinase activity. 5X magnification of centrosomal pT210-Plk1 signals and surface plots measuring integrated intensity of pT210-Plk1 signal (insets). (I, J) Quantification of centrosomal pT210-Plk1 immunofluorescence for LoKI-expressing cells. Points represent individual cells (n). Data normalized to DMSO. Application of DMSO or CLP-BI2536 for 4 hr, (I) 100 nM, LoKI-off, n = 46, LoKI-on, n = 59, **p=0.0059; 250 nM, LoKI-off, n = 46, LoKI-on, n = 46, ****p<0.0001 and drug treatment followed by 1 hr washout (J) 250 nM, LoKI-off, n = 24, LoKI-on, n = 42, ****p<0.0001. Experiments were conducted at least three times (N = 3) and P values were calculated by unpaired two-tailed Student’s t-test. Data are mean ± s.e.m. NS, not significant. Source files for analysis of pulse-chase experiments are available in Figure 2—source data 1 and for quantification of pT210-Plk1 are available in Figure 2—source data 2.
-
Figure 2—source data 1
Analysis for pulse-chase experiments with CLP-BI2536 in SNAP-PACT cells.
- https://cdn.elifesciences.org/articles/52220/elife-52220-fig2-data1-v1.xlsx
-
Figure 2—source data 2
Raw analysis for pT210-Plk1 signal.
- https://cdn.elifesciences.org/articles/52220/elife-52220-fig2-data2-v1.xlsx
Figure 2—figure supplement 1
Validation of the LoKI system.
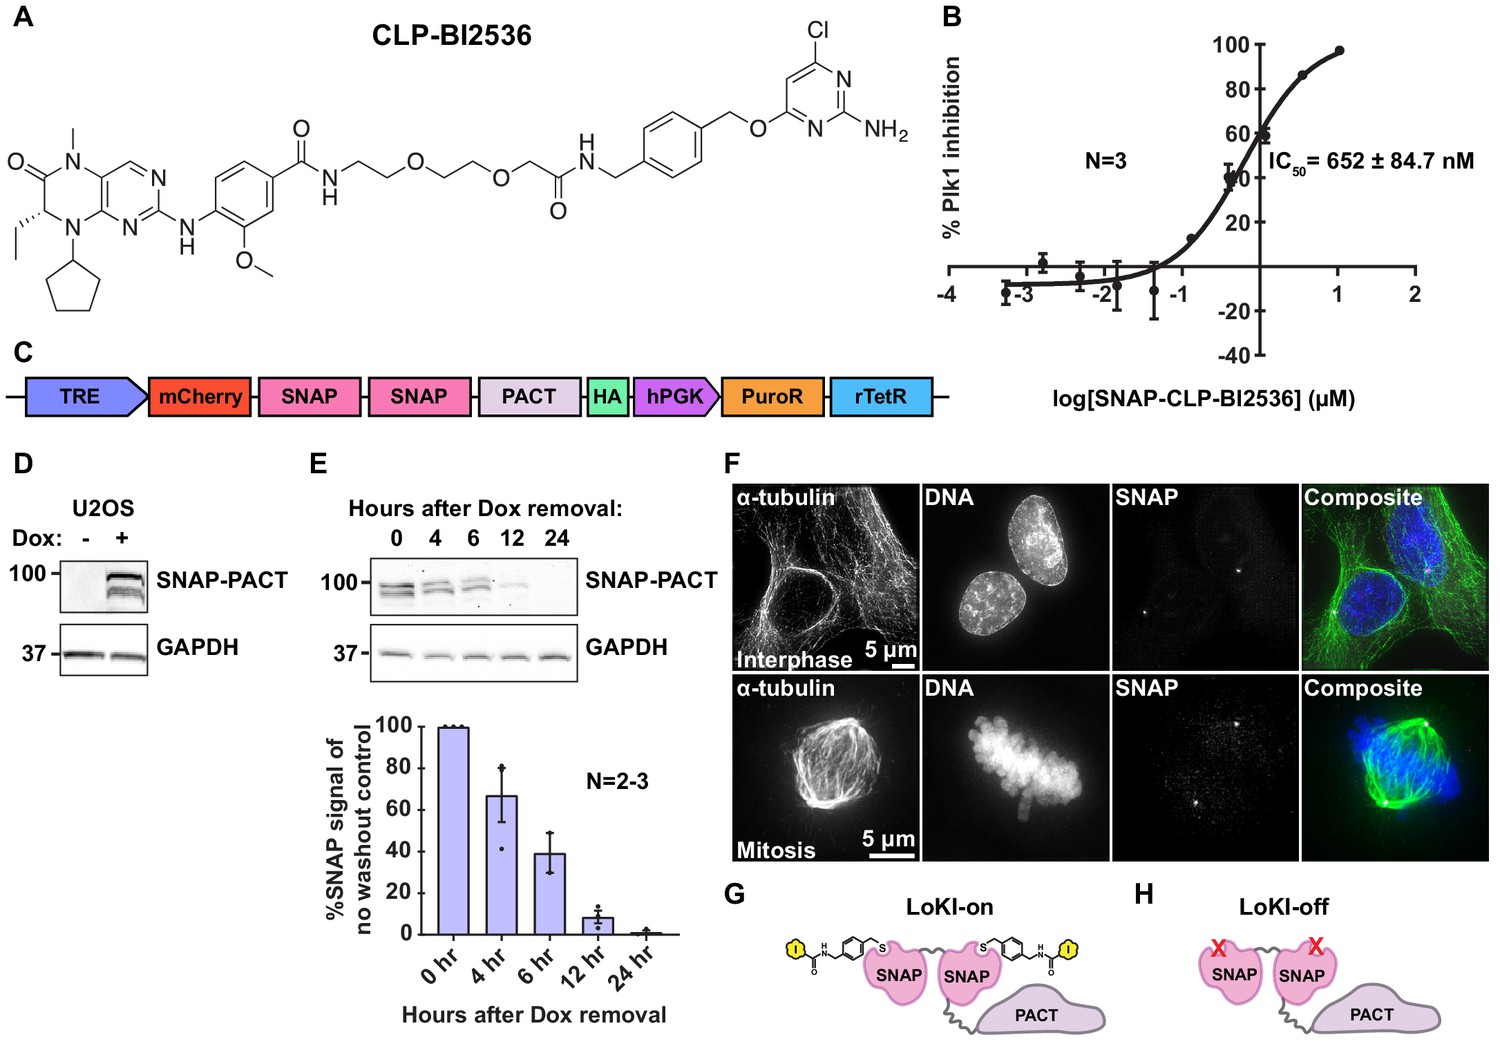
(A) Full chemical structure of CLP-BI2536. (B) Dose-response curve depicting in vitro Plk1 inhibition with increasing concentrations of CLP-BI2536 conjugated to purified SNAP. (C) Schematic of LoKI viral construct with mCherry-SNAP-PACT under control of a doxycycline-inducible promoter. (D) Immunoblot confirming SNAP-PACT (top) expression after induction with doxycycline for 72 hr and GAPDH loading controls (bottom). (E) Immunoblot of SNAP-PACT (top) expression at selected time points after removal of doxycycline and GAPDH loading controls (bottom). Quantification of amalgamated data is presented below. (F) Immunofluorescent detection of interphase (top) and mitotic (bottom) U2OS cells showing α-tubulin (left and green), DNA (mid and blue), and SNAP (right and magenta). (G, H) Diagram of centrosomal LoKI-on (G) platform with drugs conjugated and LoKI-off (H) platform containing a mutation that occludes CLP binding. Experiments were conducted at least two times (N = 2–3). Data are mean ± s.e.m.
Figure 2—figure supplement 2
Conjugation of CLP-BI2536 to LoKI-on.
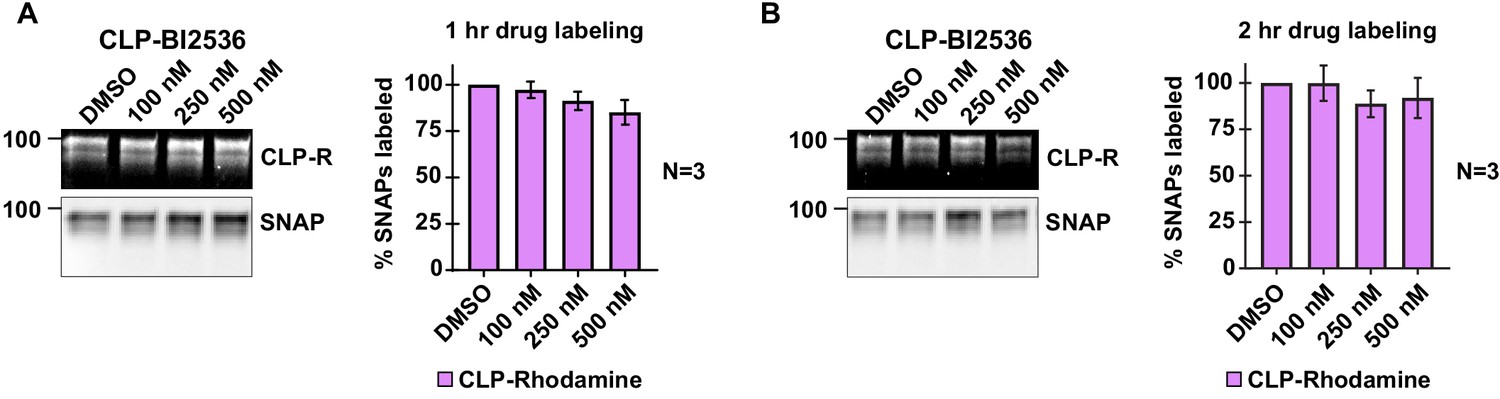
(A, B) Pulse-chase experiments carried out in U2OS cells after 1 hr (A) or 2 hr (B) treatment with CLP-BI2536. In-gel rhodamine fluorescence (top), immunoblot of SNAP loading controls (mid), and fluorescence quantification of pulse-chase experiments (bottom). Experiments were conducted at least three times (N = 3). Data are mean ± s.e.m. Source files for analysis of pulse-chase experiments are available in Figure 2—figure supplement 2—source data 1.
-
Figure 2—figure supplement 2—source data 1
Analysis for pulse-chase time course experiments with CLP-BI2536 in SNAP-PACT cells.
- https://cdn.elifesciences.org/articles/52220/elife-52220-fig2-figsupp2-data1-v1.xlsx
Figure 2—figure supplement 3
Characterization of Plk1 inhibition with CLP-BI2536.
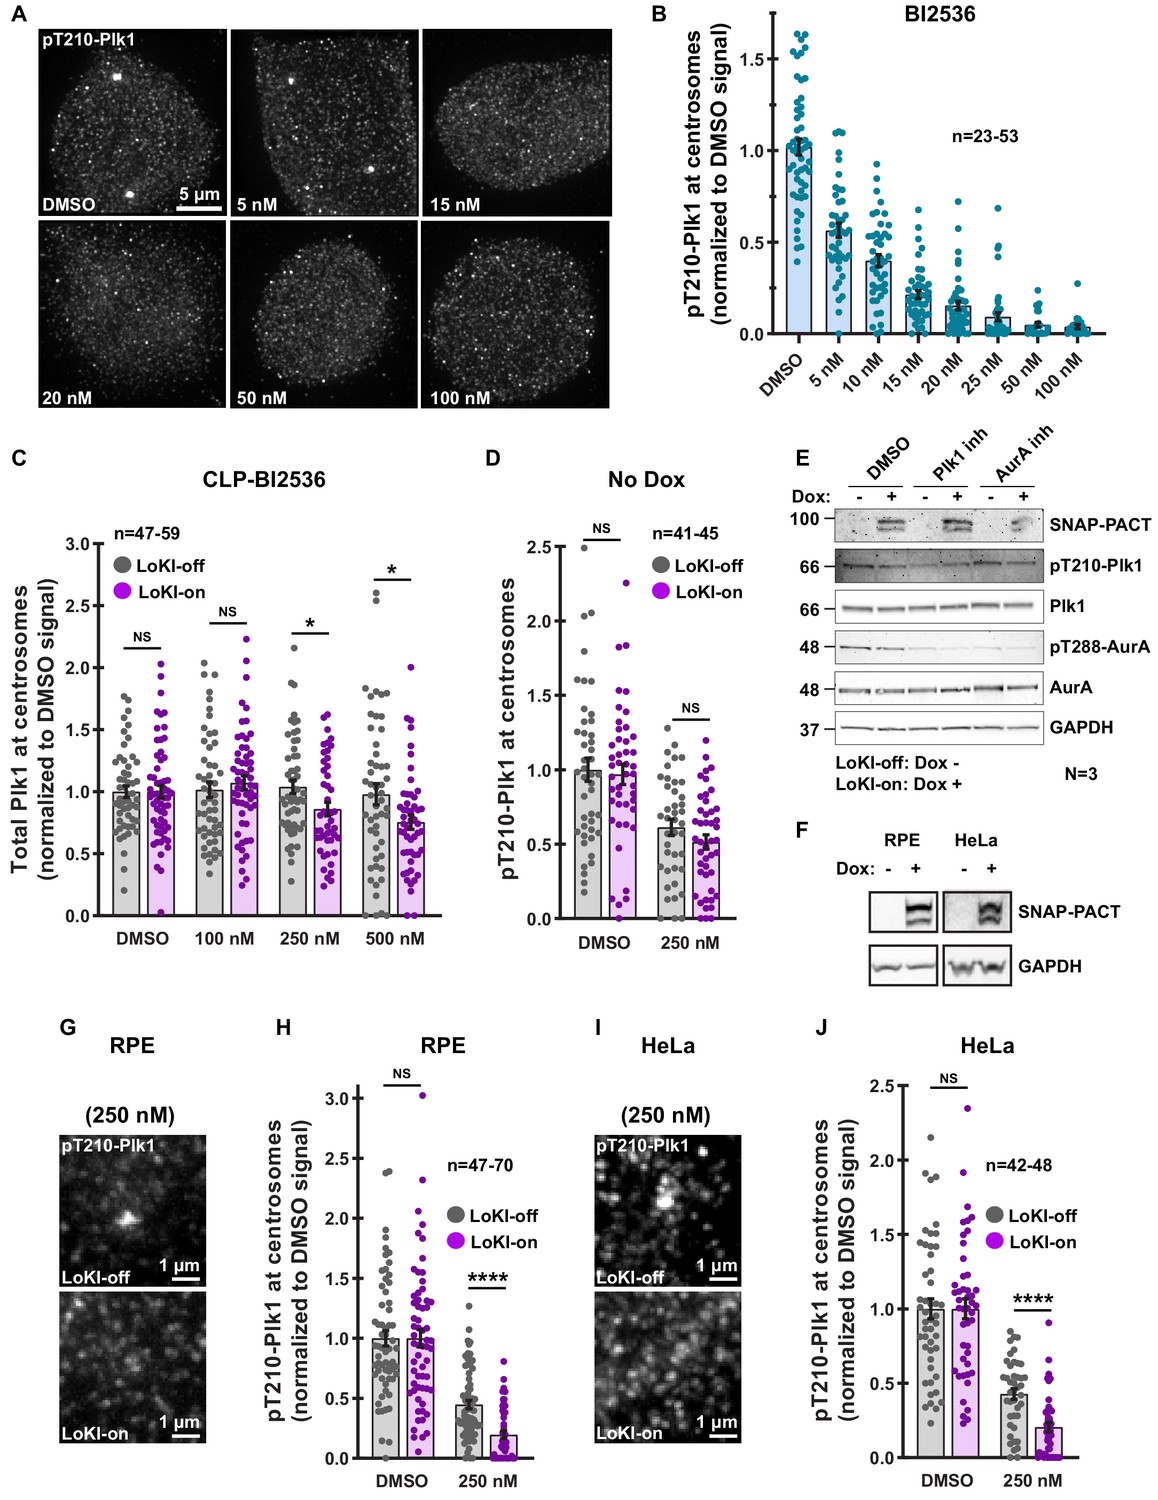
(A) Immunofluorescence detection of pT210-Plk1 as an index of kinase activity in parental U2OS cells treated with DMSO or unconjugated BI2536 for 4 hr. (B) Quantification of centrosomal pT210-Plk1 immunofluorescence collected from parental U2OS cells. (C) Quantification of total Plk1 immunofluorescence at centrosomes in LoKI-expressing cells after 4 hr CLP-BI2536 treatment; 250 nM, LoKI-off, n = 55, LoKI-on, n = 47, *p=0.0217; 500 nM, LoKI-off, n = 52, LoKI-on, n = 51, *p=0.0295. (D) Quantification of pT210-Plk1 immunofluorescence in control cells lacking SNAP expression (not induced with doxycycline) after 4 hr CLP-BI2536 treatment. (E) Immunoblot detection of pT210-Plk1 (blot 2) and pT288-AurA (blot 4) in LoKI-off and LoKI-on expressing cells collected via mitotic shake-off. Cells were treated for 16 hr with nocodazole and 4 hr with nocodazole plus DMSO, 250 nM CLP-BI2536, or 100 nM CLP-MLN8237. Total Plk1 (blot 3), AurA (blot 5), SNAP-PACT (blot 1), and GAPDH (blot 6) are also depicted. (F) Immunoblot confirming SNAP-PACT (top) expression after induction with doxycycline for 72 hr in RPE and HeLa cells and GAPDH loading controls (bottom). (G–J) Immunofluorescence detection of pT210-Plk1 at centrosomes in LoKI-off (top) and LoKI-on (bottom) RPE (G) and HeLa (I) cells treated with 250 nM CLP-BI2536 for 4 hr. Quantification of pT210-Plk1 immunofluorescence at centrosomes in RPE (H) 250 nM, LoKI-off, n = 70, LoKI-on, n = 47, ****p<0.0001 and HeLa (J) 250 nM, LoKI-off, n = 42, LoKI-on, n = 46, ****p<0.0001 LoKI-expressing cells after 4 hr CLP-BI2536 treatment. Points represent individual cells (n). Data normalized to DMSO. Experiments were conducted at least three times (N = 3) and P values were calculated by unpaired two-tailed Student’s t-test. Data are mean ± s.e.m. NS, not significant.
Figure 2—figure supplement 4
Non-normalized quantification of pT210-Plk1 signal at centrosomes.
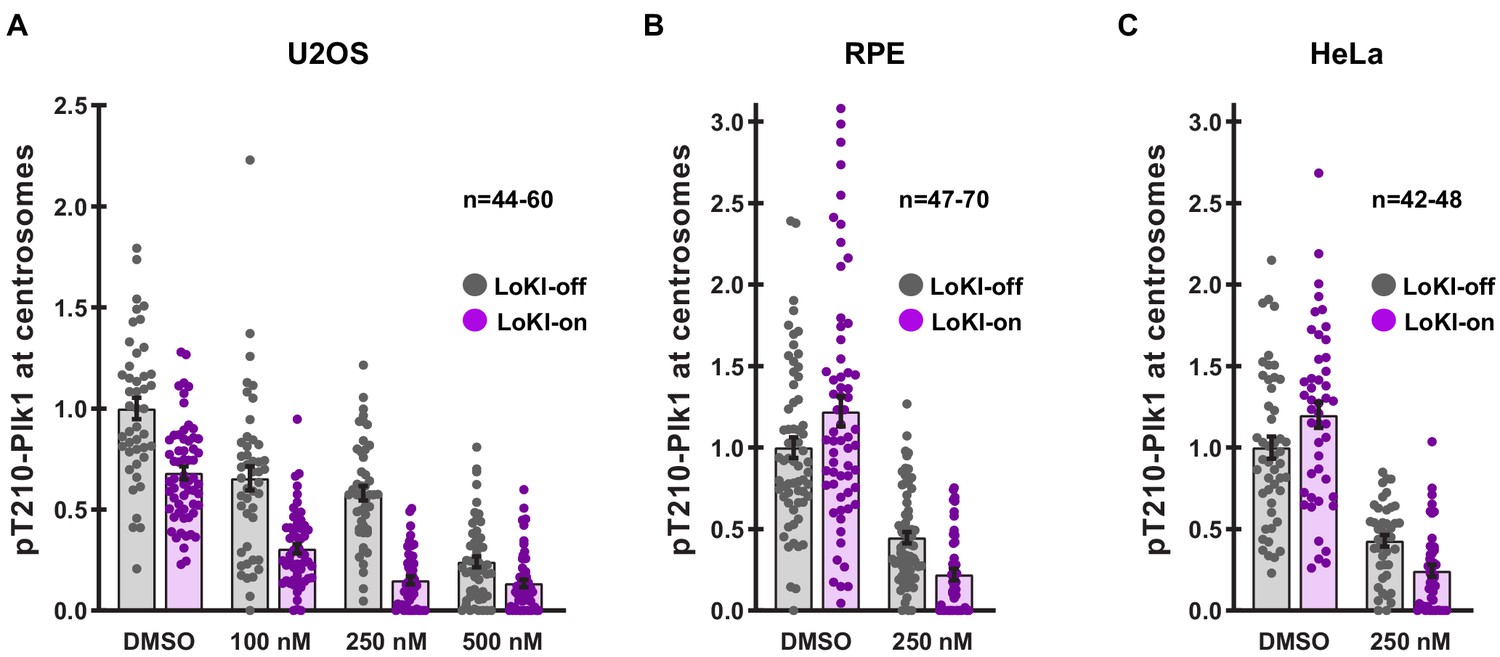
Quantification of non-normalized pT210-Plk1 immunofluorescence signal at centrosomes in U2OS (A) RPE (B) and HeLa (C) LoKI-expressing cells after treatment with indicated concentrations of CLP-BI2536 for 4 hr. Points represent individual cells (n). Experiments were conducted at least three times (N = 3). Data are mean ± s.e.m.
Figure 2—video 1
CLP-substrates bind SNAP in LoKI-on but not LoKI-off cells.
Reconstructed SIM 3D movie of LoKI-off (left) and LoKI-on (right) cells. Composite movies show SNAP (magenta) signal at LoKI-off centrosome while LoKI-on centrosome has an overlapping (white) signal indicating co-localization of magenta SNAP with yellow CLP-fluorescein. Related to Figure 2E.
Figure 2—video 2
CLP-substrates bind SNAP at centrosomes in LoKI-on cells.
Reconstructed structured illumination microscopy (SIM) 3D movie of LoKI-on U2OS cell with α-tubulin (green), DNA (blue), mCherry-SNAP (magenta) and CLP-fluorescein (yellow). Related to Figure 2D.
Figure 3 with 1 supplement
Centrosome-targeted Plk1 inhibitors perturb early mitotic events.
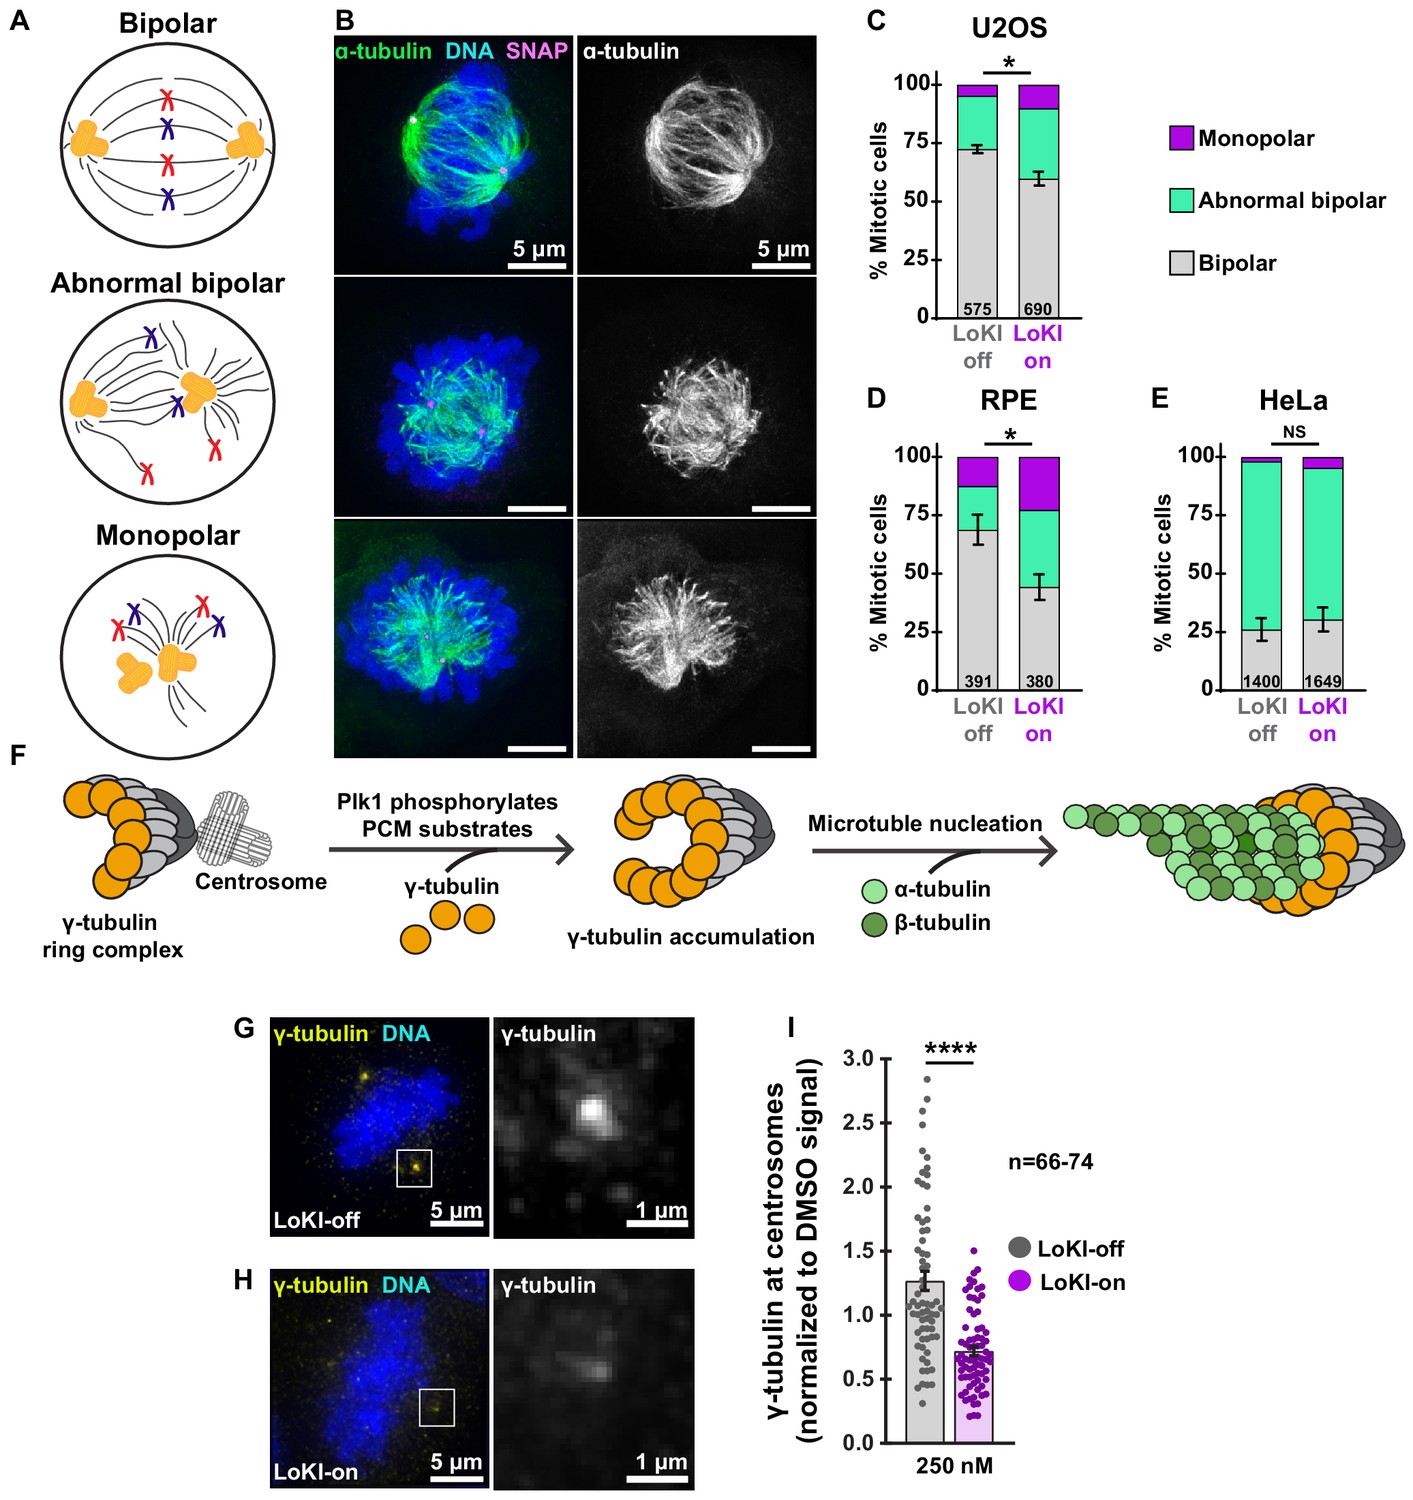
(A) Schematic depicting bipolar (top), abnormal bipolar (mid), and monopolar (bottom) mitotic spindle classifications. (B) Representative composite (left) images show α-tubulin (green), DNA (blue), and SNAP (magenta) or α-tubulin (right, gray) staining alone for each spindle type in U2OS cells. (C–E) Spindle profile measurements of U2OS (C) RPE (D) and HeLa (E) cells treated with 250 nM CLP-BI2536 for 4 hr. Spindle profiling indicates the % of each spindle type in drug-treated LoKI-on and LoKI-off cells. Number of cells analyzed per condition are indicated; (C) n = 3, *p=0.0214; (D) n = 3, *p=0.0269. (F) Schematic depicting that Plk1 phosphorylation of pericentriolar substrates facilitates accumulation of γ-tubulin at centrosomes and microtubule nucleation. (G, H) Representative composite (left) images show γ-tubulin (yellow) and DNA (blue) in U2OS cells expressing LoKI-off (G) and LoKI-on (H) treated with 250 nM CLP-BI2536 for 4 hr, followed by a 1 hr washout. 5X magnified grayscale images of centrosomal γ-tubulin (right). (I) Quantification of centrosomal γ-tubulin immunofluorescence in LoKI-expressing cells. Points represent individual cells (n). Data normalized to DMSO. A ROUT (Q = 1%) outlier test was performed and two values were removed prior to performing statistical tests; LoKI-off, n = 66, LoKI-on, n = 74, ****p<0.0001. Experiments were conducted at least three times (N = 3) and P values were calculated by unpaired two-tailed Student’s t-test. Data are mean ± s.e.m. NS, not significant. Source files for spindle profile analyses are available in Figure 3—source data 1.
-
Figure 3—source data 1
Spindle profile analyses.
- https://cdn.elifesciences.org/articles/52220/elife-52220-fig3-data1-v1.xlsx
Figure 3—figure supplement 1
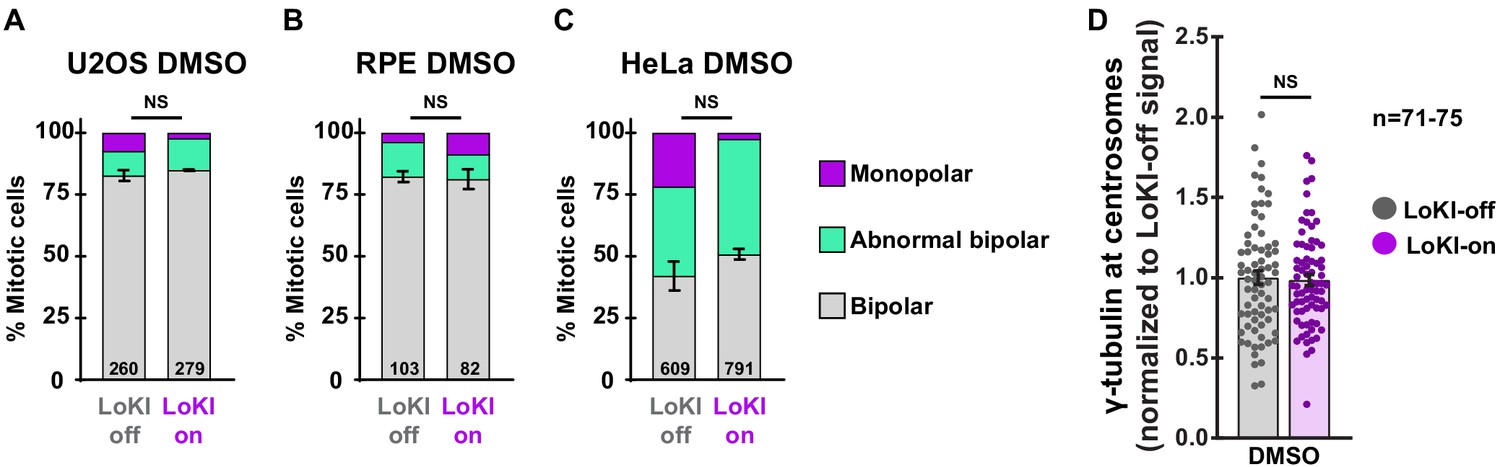
Baseline controls evaluating mitotic defects.
(A–C) Mitotic spindle classifications for LoKI-expressing U2OS (A) RPE (B) and HeLa (C) cells treated with DMSO for 4 hr. Profiling indicates the % of each defined spindle type in drug treated LoKI-on and LoKI-off cells. Number of cells analyzed per condition are indicated. (D) Quantification of γ-tubulin immunofluorescence at centrosomes in LoKI-expressing U2OS cells treated with DMSO, followed by a 1 hr washout. Points represent individual cells (n). Data normalized to DMSO. Experiments were conducted at least three times (N = 3) and P values were calculated by unpaired two-tailed Student’s t-test. Data are mean ± s.e.m. NS, not significant. Source files for control spindle profile analyses are available in Figure 3—source data 1.
Figure 4 with 5 supplements
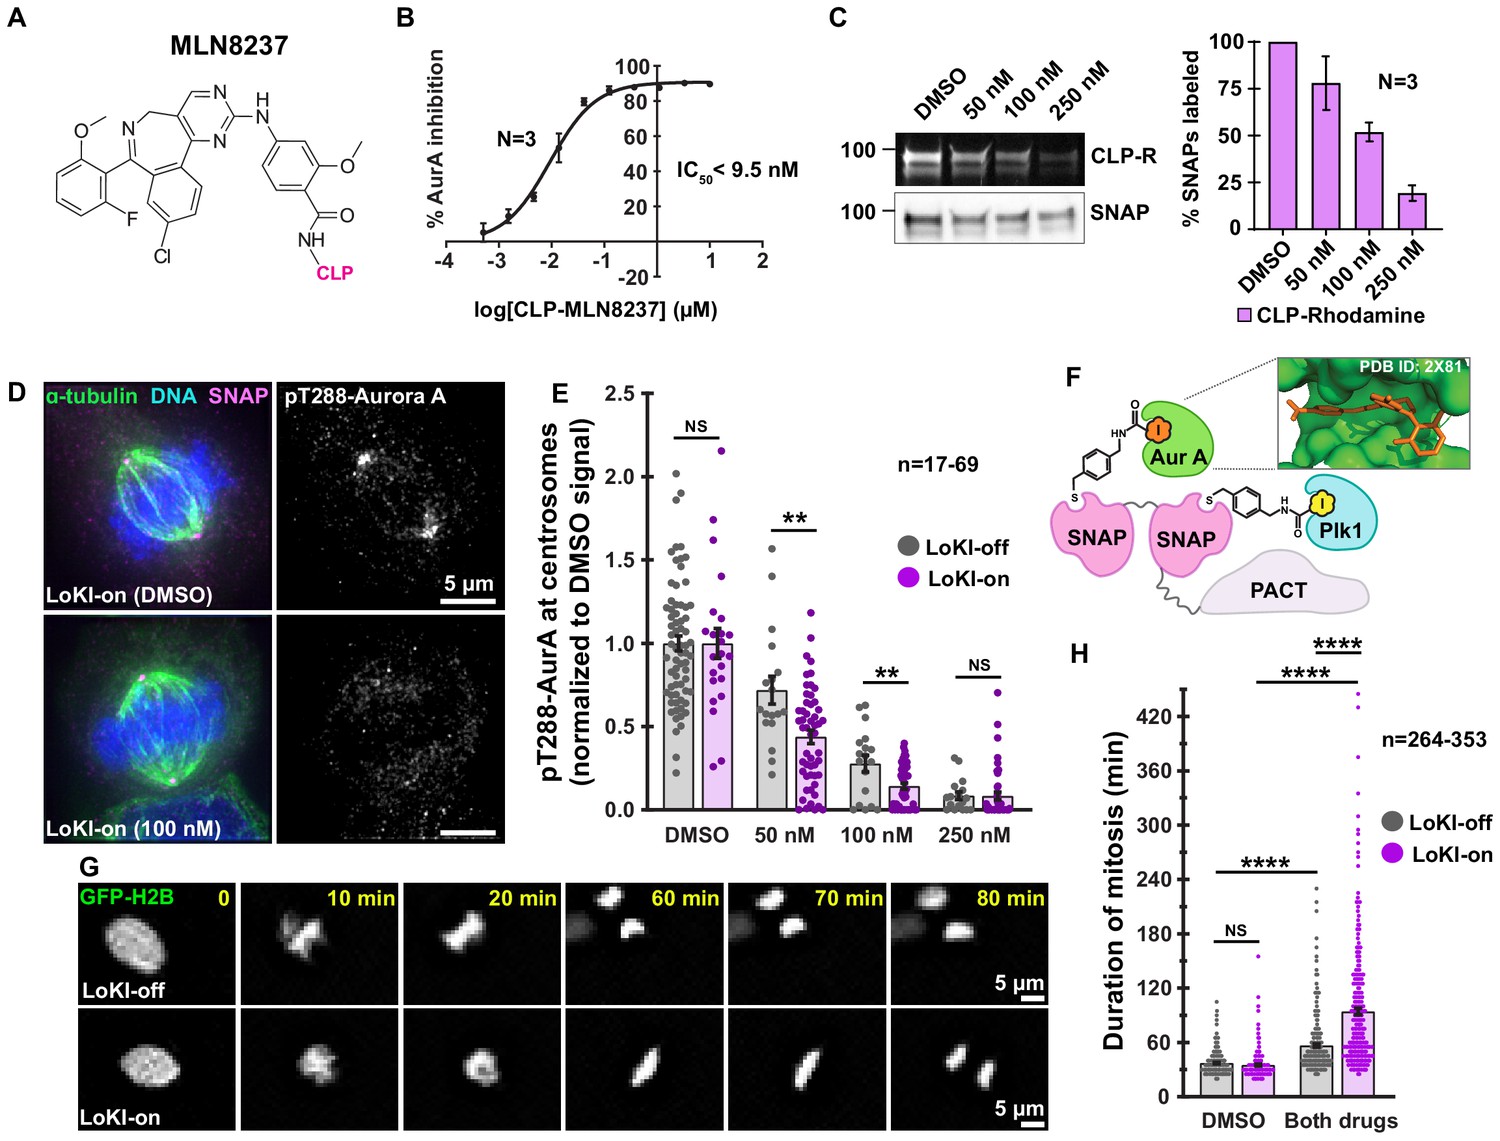
Combined Plk1 and AurA suppression at centrosomes more profoundly delays mitosis than global kinase inhibition.
(A) Chemical structure of AurA kinase inhibitor CLP-MLN8237. (B) Dose-response curve of in vitro AurA kinase inhibition with CLP-MLN8237. (C) Pulse-chase experiments measuring CLP-MLN8237’s ability to block CLP-rhodamine conjugation to LoKI-on. In-gel rhodamine fluorescence (top), immunoblot of SNAP loading controls (mid), and fluorescence quantification of pulse-chase experiments (bottom). (D) Immunofluorescence of representative mitotic LoKI-on U2OS cells treated with DMSO or 100 nM CLP-MLN8237 for 4 hr. Composite images (left) show α-tubulin (green), DNA (blue), and SNAP (magenta). Immunofluorescent detection of pT288-AurA (right, gray) as an index of kinase activity is depicted. (E) Quantification of centrosomal pT288-AurA immunofluorescence after 4 hr CLP-MLN8237 treatment; 50 nM, LoKI-off, n = 18, LoKI-on, n = 53, **p=0.0014; 100 nM, LoKI-off, n = 18, LoKI-on, n = 48, **p=0.0026. (F) Schematic of dual LoKI-on moiety conjugated to CLP-BI2536 and CLP-MLN8237. Inset depicts MLN8237 in the ATP-binding pocket of AurA. (G) Representative time-lapse images of mitotic LoKI-off (top) and LoKI-on (bottom) cells transiently expressing GFP-H2B. Cells were treated with a combination (both drugs) of 250 nM CLP-BI2536 and 100 nM CLP-MLN8237 and monitored for 18 hr. (H) Quantification of time-lapse experiments depicts duration of mitosis from nuclear envelope breakdown to the onset of anaphase; DMSO, LoKI-off, n = 264, both drugs, LoKI-off n = 353, ****p<0.0001; DMSO, LoKI-on, n = 292, both drugs, LoKI-on n = 331, ****p<0.0001; both drugs, LoKI-off, n = 353, both drugs, LoKI-on, n = 331, ****p<0.0001. Points in (E) and (H) represent individual cells (n). Points in (E) are normalized to DMSO. Experiments were conducted at least three times (N = 3) and P values were calculated by unpaired two-tailed Student’s t-test. Data are mean ± s.e.m. NS, not significant. Source files for analysis of pulse-chase experiments are available in Figure 4—source data 1.
-
Figure 4—source data 1
Analysis for pulse-chase experiments with CLP-MLN8237 in SNAP-PACT cells.
- https://cdn.elifesciences.org/articles/52220/elife-52220-fig4-data1-v1.xlsx
Figure 4—figure supplement 1
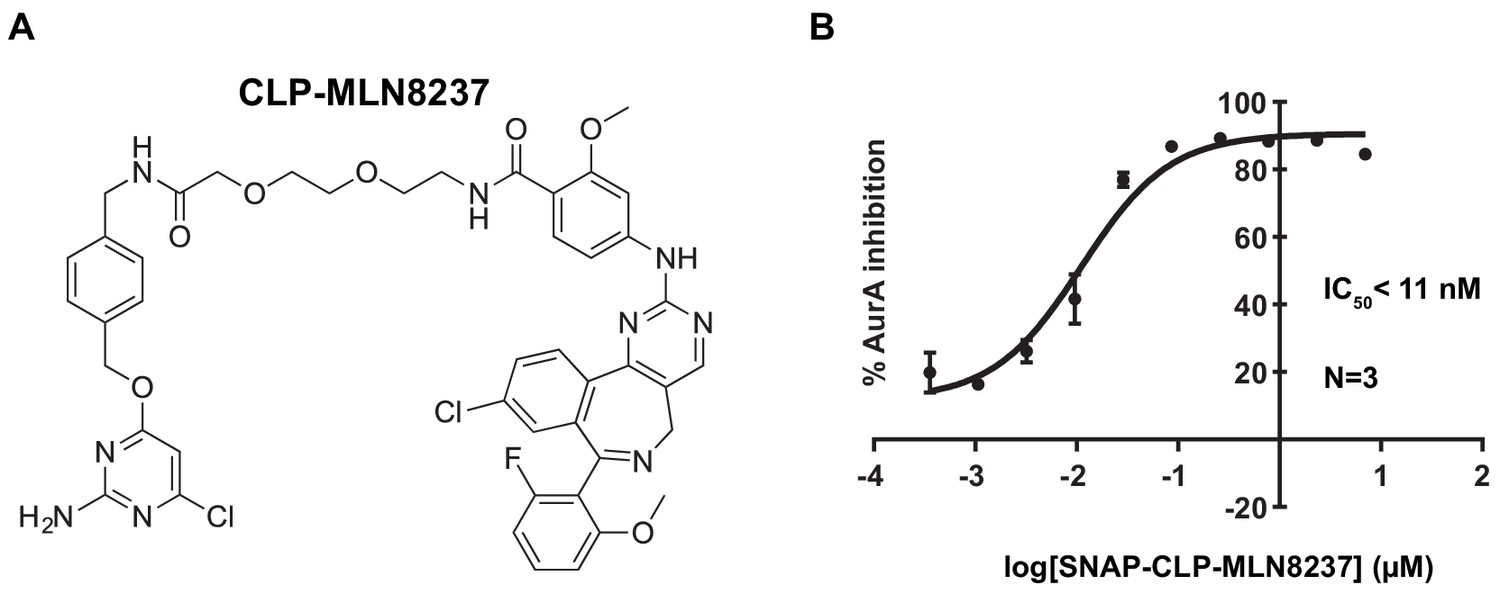
CLP-MLN8237 and AurA activity assay.
(A) Full chemical structure of CLP-MLN8237. (B) Graph depicting in vitro AurA kinase inhibition with increasing concentrations of CLP-MLN8237 conjugated to purified SNAP. Experiments were conducted at least three times (N = 3). Data are mean ± s.e.m.
Figure 4—figure supplement 2
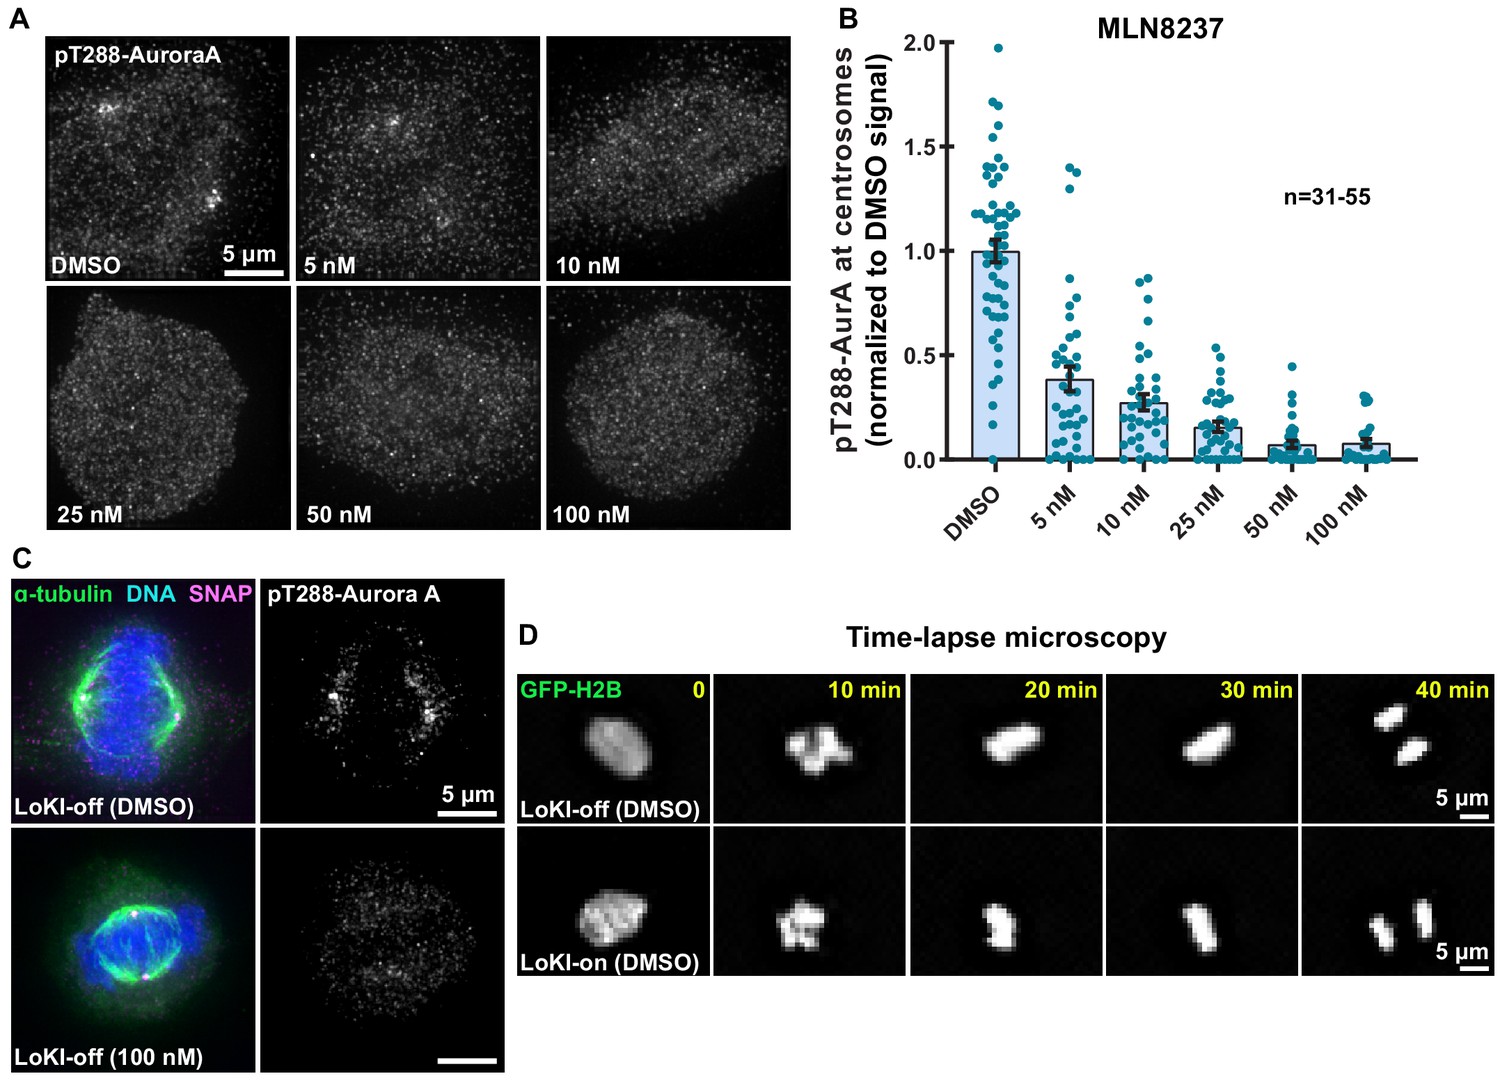
Characterization of AurA inhibition with CLP-MLN8237.
(A) Immunofluorescence detection of pT288-AurA as an index of kinase activity in parental U2OS cells treated with DMSO or unconjugated MLN8237 for 4 hr. (B) Quantification of centrosomal pT210-AurA immunofluorescence collected from parental U2OS cells. Data normalized to DMSO. Points represent individual cells (n). Experiments were conducted at least three times (N = 3). Data are mean ± s.e.m. (C) Immunofluorescence of representative mitotic LoKI-off U2OS cells treated with DMSO or 100 nM CLP-MLN8237 for 4 hr. Composite images (left) show α-tubulin (green), DNA (blue), and SNAP (magenta). Immunofluorescent detection of pT288-AurA (right, gray) as an index of kinase activity is depicted. (D) Representative time-lapse images of mitotic LoKI-off (top) and LoKI-on (bottom) cells transiently expressing GFP-H2B. Cells were treated with DMSO and monitored for 18 hr.
Figure 4—figure supplement 3
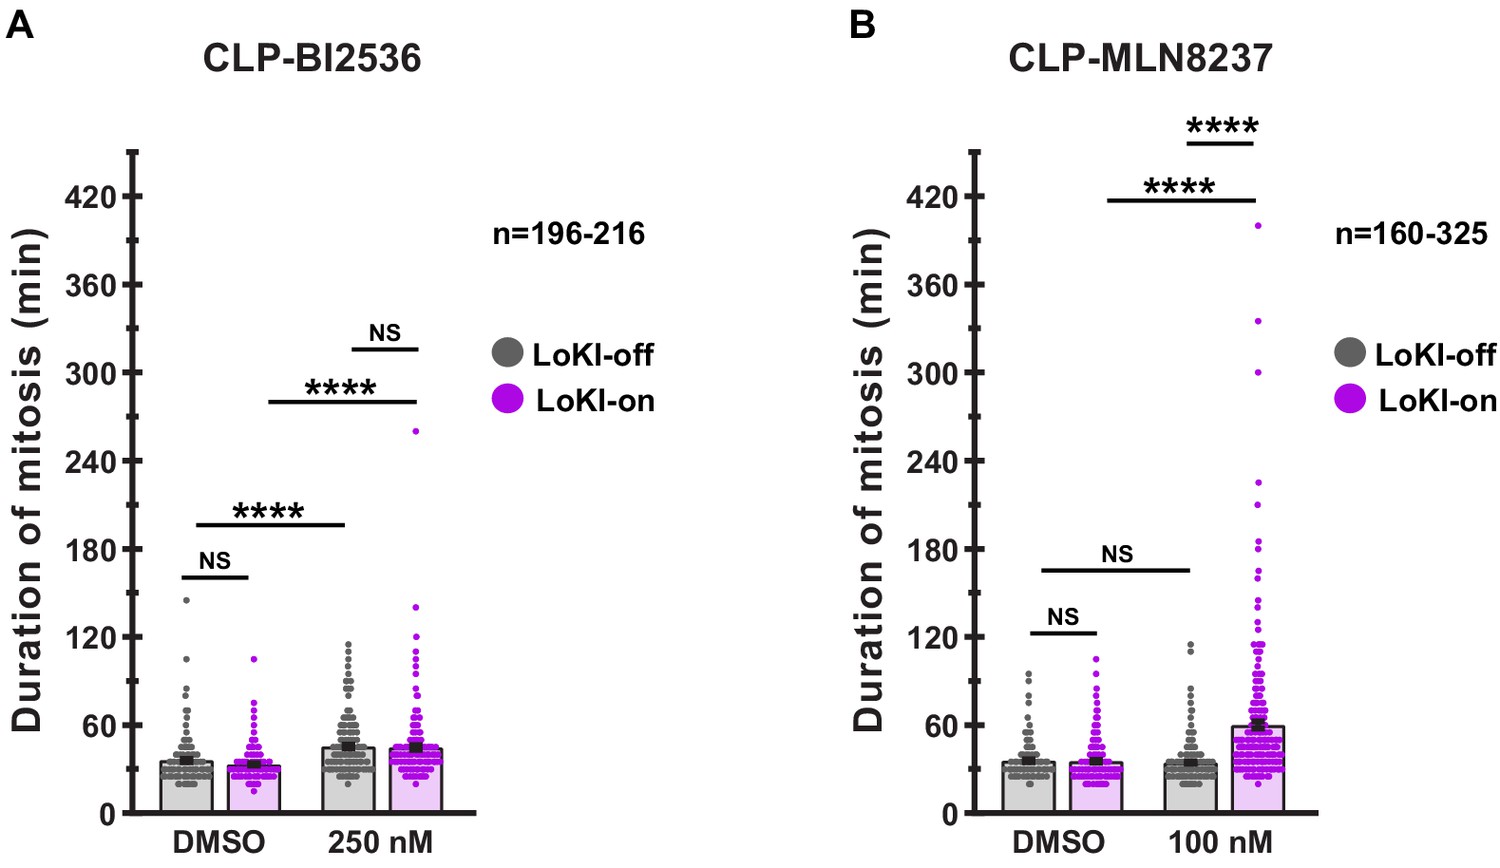
Mitotic duration is prolonged in cells treated with centrosome-targeted Plk1 or AurA inhibitors.
(A, B) Quantification of time-lapse experiments depicts duration of mitosis from nuclear envelope breakdown to the onset of anaphase in cells treated with CLP-BI2536 (A) DMSO, LoKI-off, n = 196, 250 nM, LoKI-off n = 216, ****p<0.0001; DMSO, LoKI-on, n = 211, 250 nM, LoKI-on n = 211, ****p<0.0001 or CLP-MLN8237 (B) DMSO, LoKI-on, n = 257, 100 nM, LoKI-on n = 325, ****p<0.0001; 100 nM, LoKI-off, n = 237, 100 nM, LoKI-on n = 325, ****p<0.0001. Points represent individual cells (n). Experiments were conducted at least three times (N = 3) and P values were calculated by unpaired two-tailed Student’s t-test. Data are mean ± s.e.m. NS, not significant.
Figure 4—video 1
Comparison of mitotic progression in DMSO-treated LoKI cells.
Time-lapse video of an average LoKI-off (top) and average LoKI-on (bottom) U2OS cell expressing GFP-H2B after treatment with DMSO. The interval between each frame is 5 min. Scale bar represents 5 µm. Related to Figure 4—figure supplement 2D.
Figure 4—video 2
Comparison of mitotic progression in drug-treated LoKI cells.
Time-lapse video of an average LoKI-off (top), an average LoKI-on (mid), and a profoundly delayed LoKI-on (bottom) U2OS cell expressing GFP-H2B after treatment with a combination of 250 nM CLP-BI2536 and 100 nM CLP-MLN8237. The interval between each frame is 5 min. Scale bar represents 5 µm. Related to Figure 4G.
Figure 5 with 2 supplements
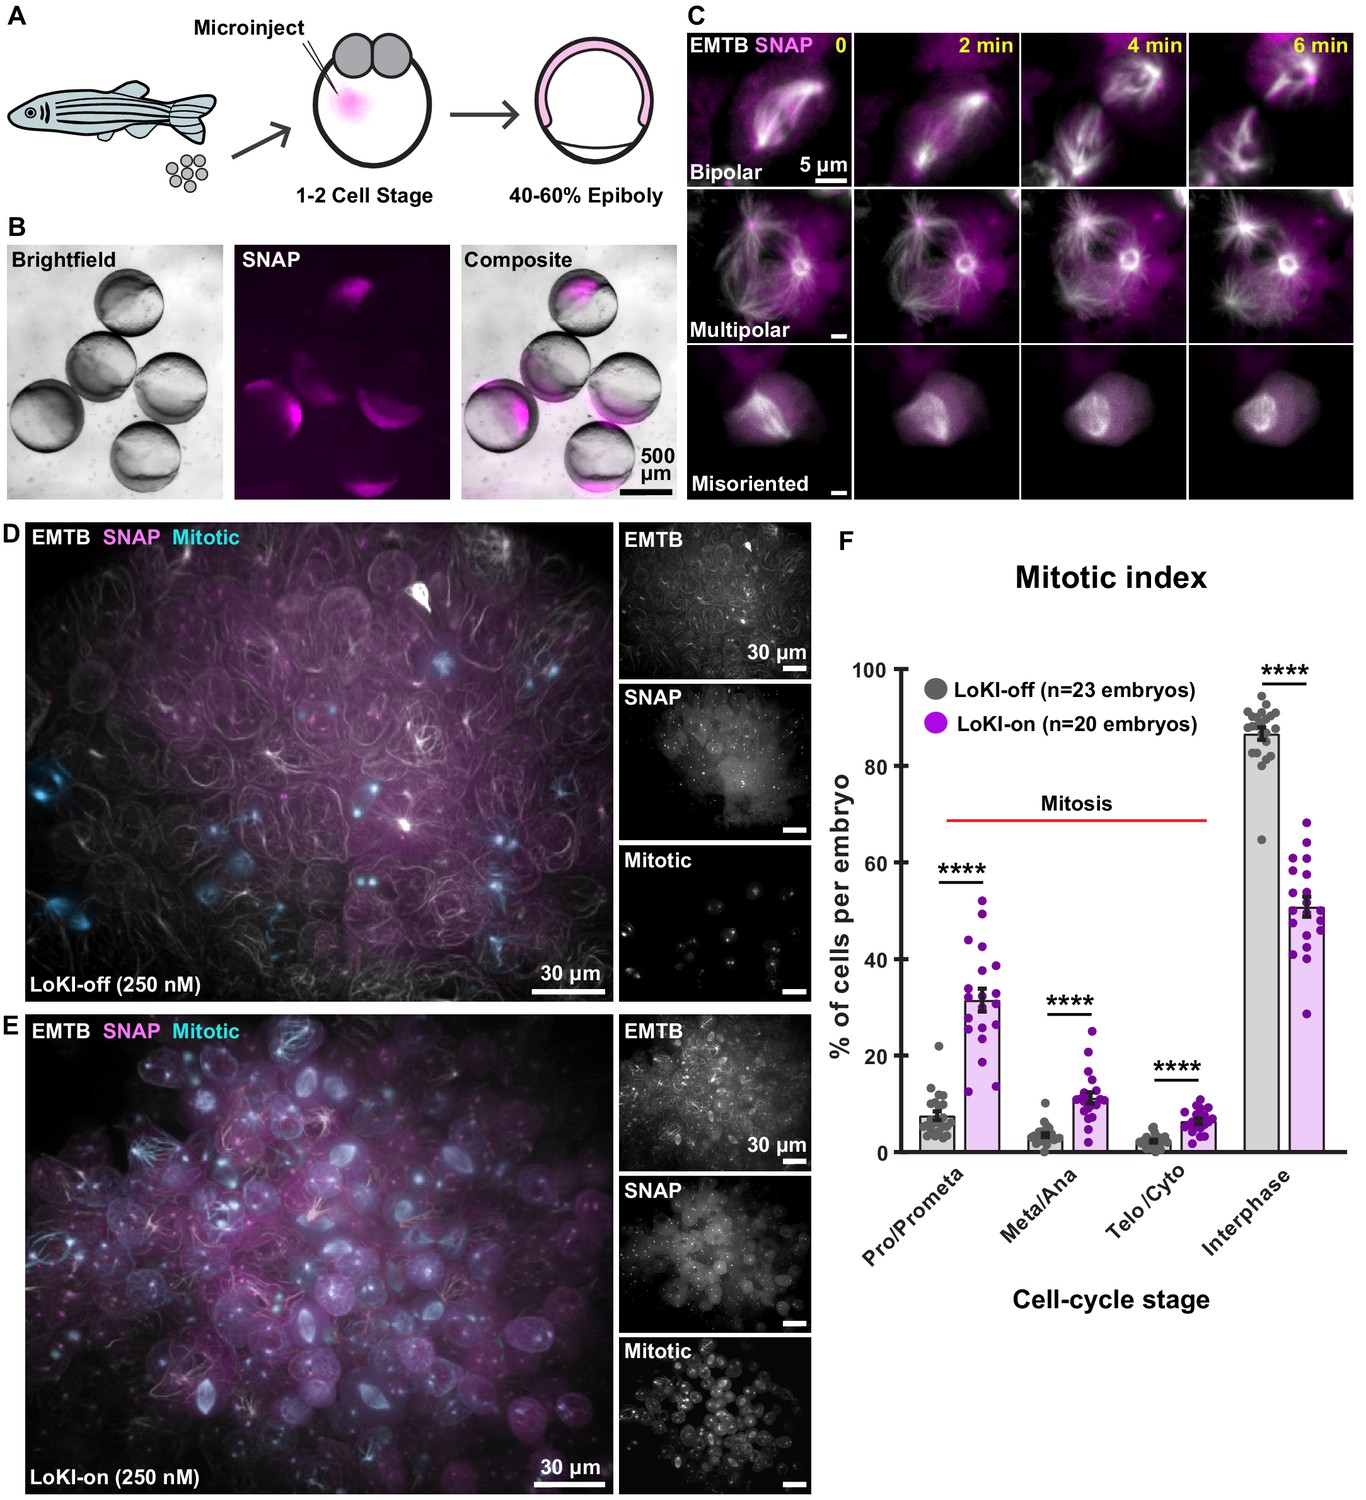
In vivo implementation of LoKI implicates Plk1 activity at centrosomes in coordinating mitoses during early development.
(A) Schematic of experimental scheme. Microinjection of LoKI mRNAs into zebrafish embryos occurs at the 1–2 cell stage. Live-cell imaging is conducted at ~50% epiboly. (B) Zebrafish embryos (left, brightfield) depicting regional expression of SNAP (mid, magenta) at ~50% epiboly. Composite images (right) depict expression of SNAP only in the cells of the zebrafish embryos. (C) Centrosomal delivery of Plk1 inhibitors perturb cell division in zebrafish embryos. Time-lapse images of dividing cells embedded in LoKI-on zebrafish embryos 5 hr post application of 250 nM CLP-BI2536. Representative examples of normal bipolar spindles (top) multipolar spindles (mid) and spindle orientation defects (bottom) are presented. Composite images show microtubule marker EMTB-3xGFP (white) and SNAP (magenta). (D, E) 3D-rendered images depict incidence of mitotic cells and general organization of whole LoKI-off (D) or LoKI-on (E) zebrafish embryos treated with 250 nM CLP-BI2536. EMTB (white and top inset), SNAP (magenta and mid inset), and mitotic cells (cyan and bottom inset) are shown. (F) Graph depicting mitotic index measurements for LoKI-expressing embryos; LoKI-off, n = 23, LoKI-on, n = 20, ****p<0.0001. Each point represents % of cells per individual embryo (n). Experiments were conducted at least three times (N = 3) and P values were calculated by unpaired two-tailed Student’s t-test. Data are mean ± s.e.m.
Figure 5—figure supplement 1
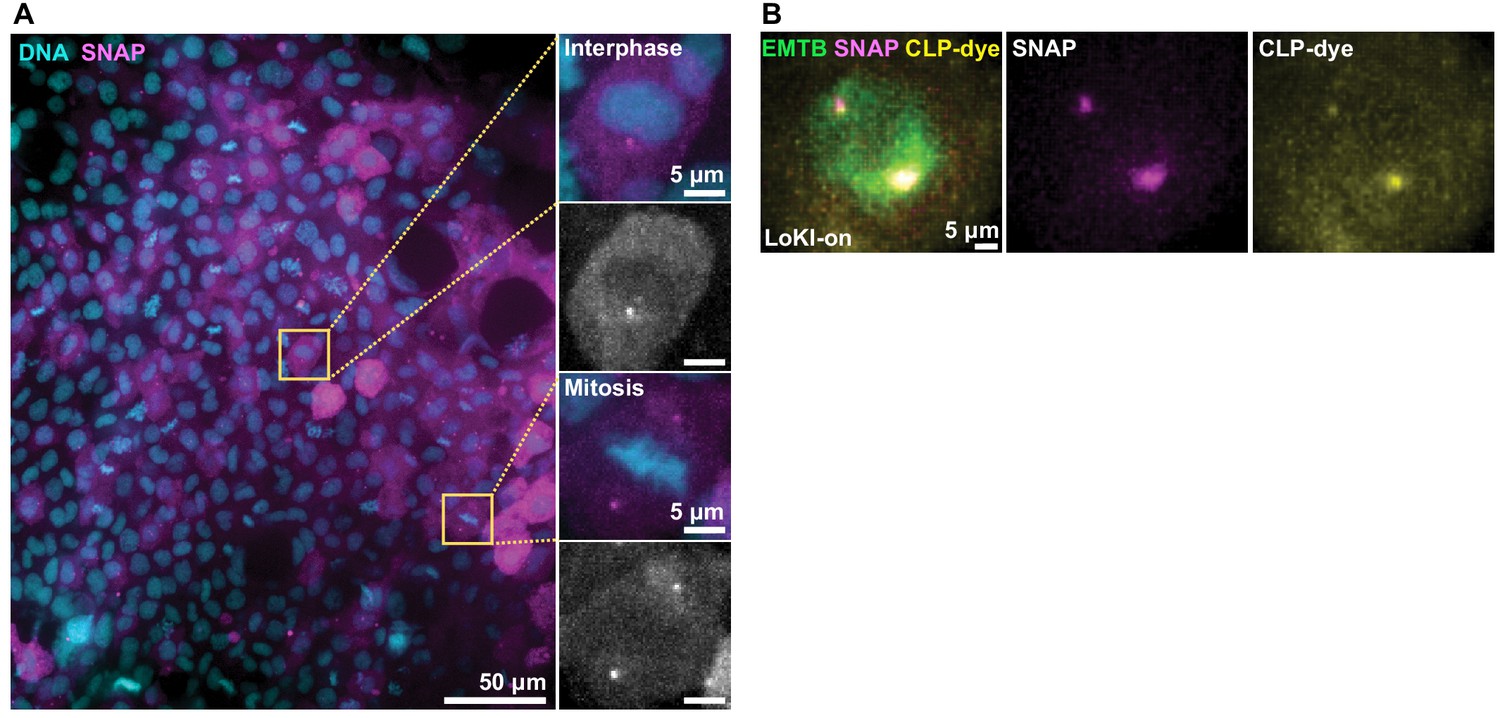
Validation of LoKI expression in zebrafish embryos.
(A) Confocal micrograph of an embryo expressing LoKI-on (magenta) counterstained for DNA (cyan). Magnification of cells (insets) at interphase (upper) and mitosis (lower). Grayscale images reveal localization of the centrosomal LoKI-on platform. (B) In vivo validation of drug delivery. Immunofluorescent detection of microtubule marker EMTB-3xGFP (green), SNAP (magenta) and CLP-647 dye (yellow) in a cell embedded in a living zebrafish embryo.
Figure 5—video 1
Mitotic defects in drug-treated LoKI-on embryos.
Time-lapse videos representing 3 types of spindle abnormalities. Multipolar spindles (left), spindle orientation defects (mid) and mitotic delay (right) are observed in LoKI-on embryos treated with CLP-BI2536 (250 nM). Composite videos show individual cells expressing the microtubule marker EMTB-3xGFP (white) and LoKI-on (magenta). Related to Figure 5C.
Figure 6 with 3 supplements
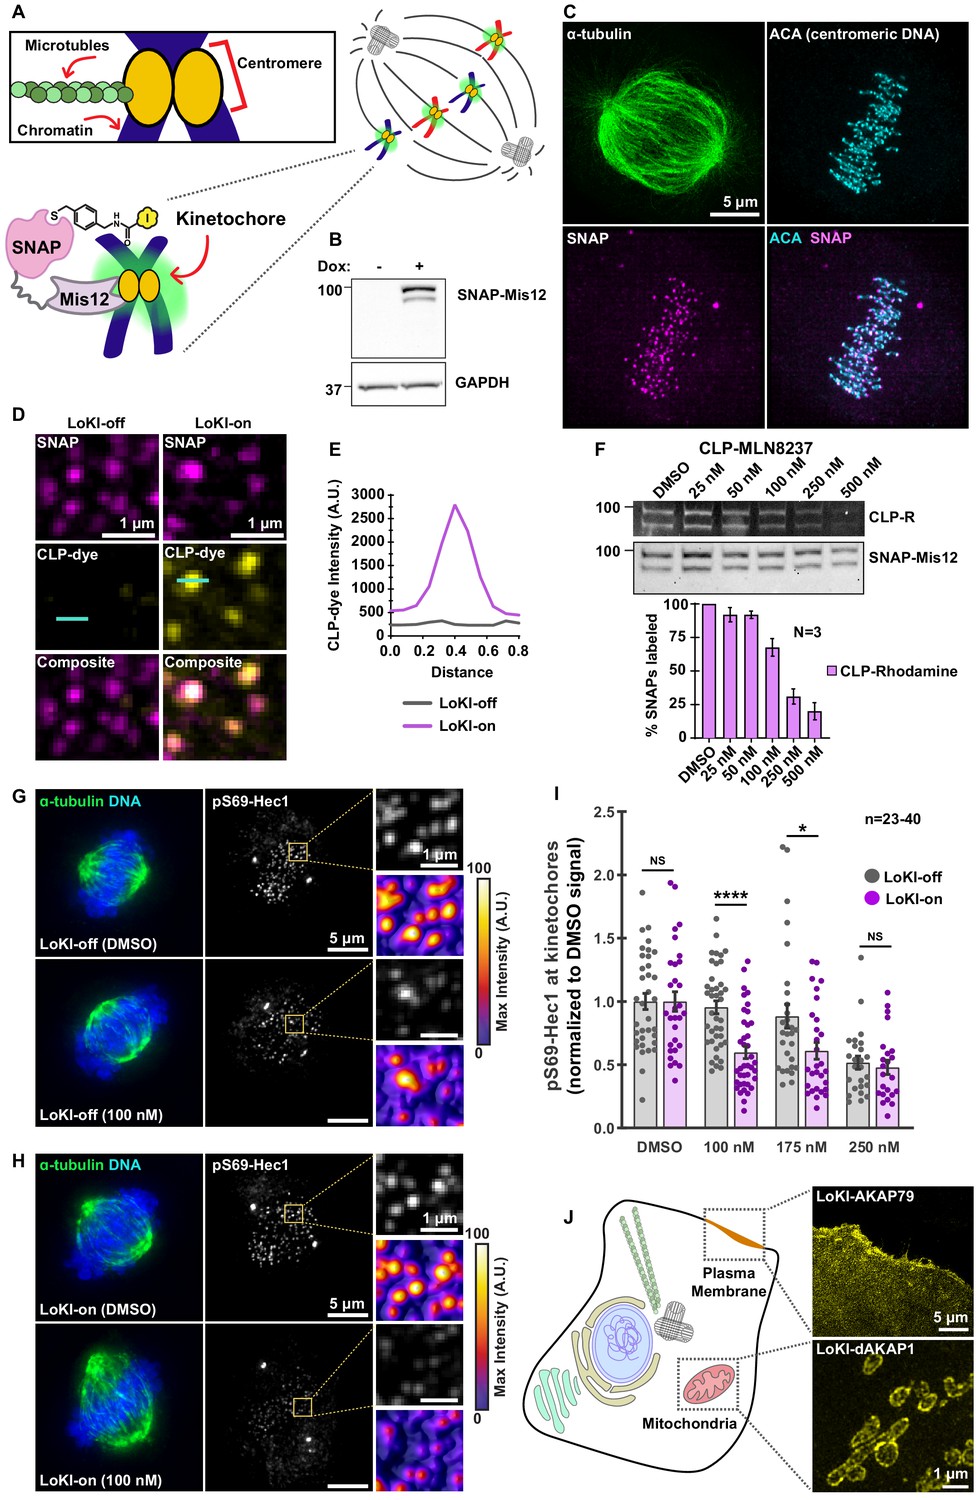
Kinetochore-targeted CLP-MLN8237 reveals that AurA-mediated Hec1 phosphorylation is a local event.
(A) Schematic of microtubule association with centromeric chromatin at kinetochores. Diagram of LoKI-Mis12 securing CLP-linked inhibitors to kinetochores (inset). (B) Immunoblot confirming SNAP-Mis12 (top) expression after induction with doxycycline for 72 hr and GAPDH loading controls (bottom). (C) Representative SIM micrograph depicting α-tubulin (green), mCherry-SNAP-Mis12 (magenta) and centromeric DNA marker ACA (cyan) in U2OS cells. Composite image depicts co-distribution of LoKI-Mis12 with ACA. (D) SIM micrographs of LoKI-off (left) and LoKI-on (right) U2OS cells. SNAP expression (top, magenta), CLP-647 conjugation (mid, yellow) and composite images (bottom) are depicted. Line on CLP-dye was used to generate panel E plot. (E) Line plot of CLP-dye signal from a representative kinetochore in panel D. (F) Pulse-chase experiments measuring CLP-MLN8237’s ability to block CLP-rhodamine conjugation to LoKI-on. In-gel rhodamine fluorescence (top), immunoblot of SNAP loading controls (mid), and fluorescence quantification of pulse-chase experiments (bottom). (G, H) Immunofluorescence of representative mitotic LoKI-off (G) and LoKI-on (H) U2OS cells treated with DMSO or 100 nM CLP-MLN8237 for 4 hr. Composite images (left) show α-tubulin (green) and DNA (blue). Immunofluorescence detection of pS69-Hec1 (mid and top right insets, gray). Heat maps (bottom right) depict maximum intensity measurements of pS69-Hec1 signal from representative insets. (I) Quantification of pS69-Hec1 immunofluorescence at kinetochores after 4 hr CLP-MLN8237 treatment; 100 nM, LoKI-off, n = 40, LoKI-on, n = 39, ****p<0.0001; 175 nM, LoKI-off, n = 29, LoKI-on, n = 29, *p=0.0212. Points represent individual cells (n). Data normalized to DMSO. Experiments were conducted at least three times (N = 3) and P values were calculated by unpaired two-tailed Student’s t-test. Data are mean ± s.e.m. NS, not significant. (J) Implementation of LoKI at other subcellular locations shows SNAP targeting to plasma membrane via AKAP79 and mitochondrial localization via d-AKAP1. Source files for analysis of pulse-chase experiments are available in Figure 6—source data 1.
-
Figure 6—source data 1
Analysis for pulse-chase experiments with CLP-MLN8237 in SNAP-Mis12 cells.
- https://cdn.elifesciences.org/articles/52220/elife-52220-fig6-data1-v1.xlsx
Figure 6—figure supplement 1

Validation of Mis12-LoKI platforms.
(A) Schematic depicting the Mis12-LoKI viral construct with mCherry-SNAP-Mis12 under the control of a doxycycline-inducible promoter. (B) Immunoblot of SNAP-Mis12 (top) expression at selected time points after removal of doxycycline and GAPDH loading controls (bottom). Quantification of amalgamated data is presented below. (C) Pulse-chase experiments measuring CLP-MLN8237’s ability to block CLP-rhodamine conjugation to LoKI-on. In-gel rhodamine fluorescence (top), immunoblot of SNAP loading controls (mid), and fluorescence quantification of pulse-chase experiments (bottom). Experiments were conducted at least two times (N = 2–3). Data are mean ± s.e.m. Source files for analysis of pulse-chase experiments are available in Figure 6—figure supplement 1—source data 1.
-
Figure 6—figure supplement 1—source data 1
Analysis for pulse-chase experiments with CLP-BI2536 in SNAP-Mis12 cells.
- https://cdn.elifesciences.org/articles/52220/elife-52220-fig6-figsupp1-data1-v1.xlsx
Figure 6—figure supplement 2
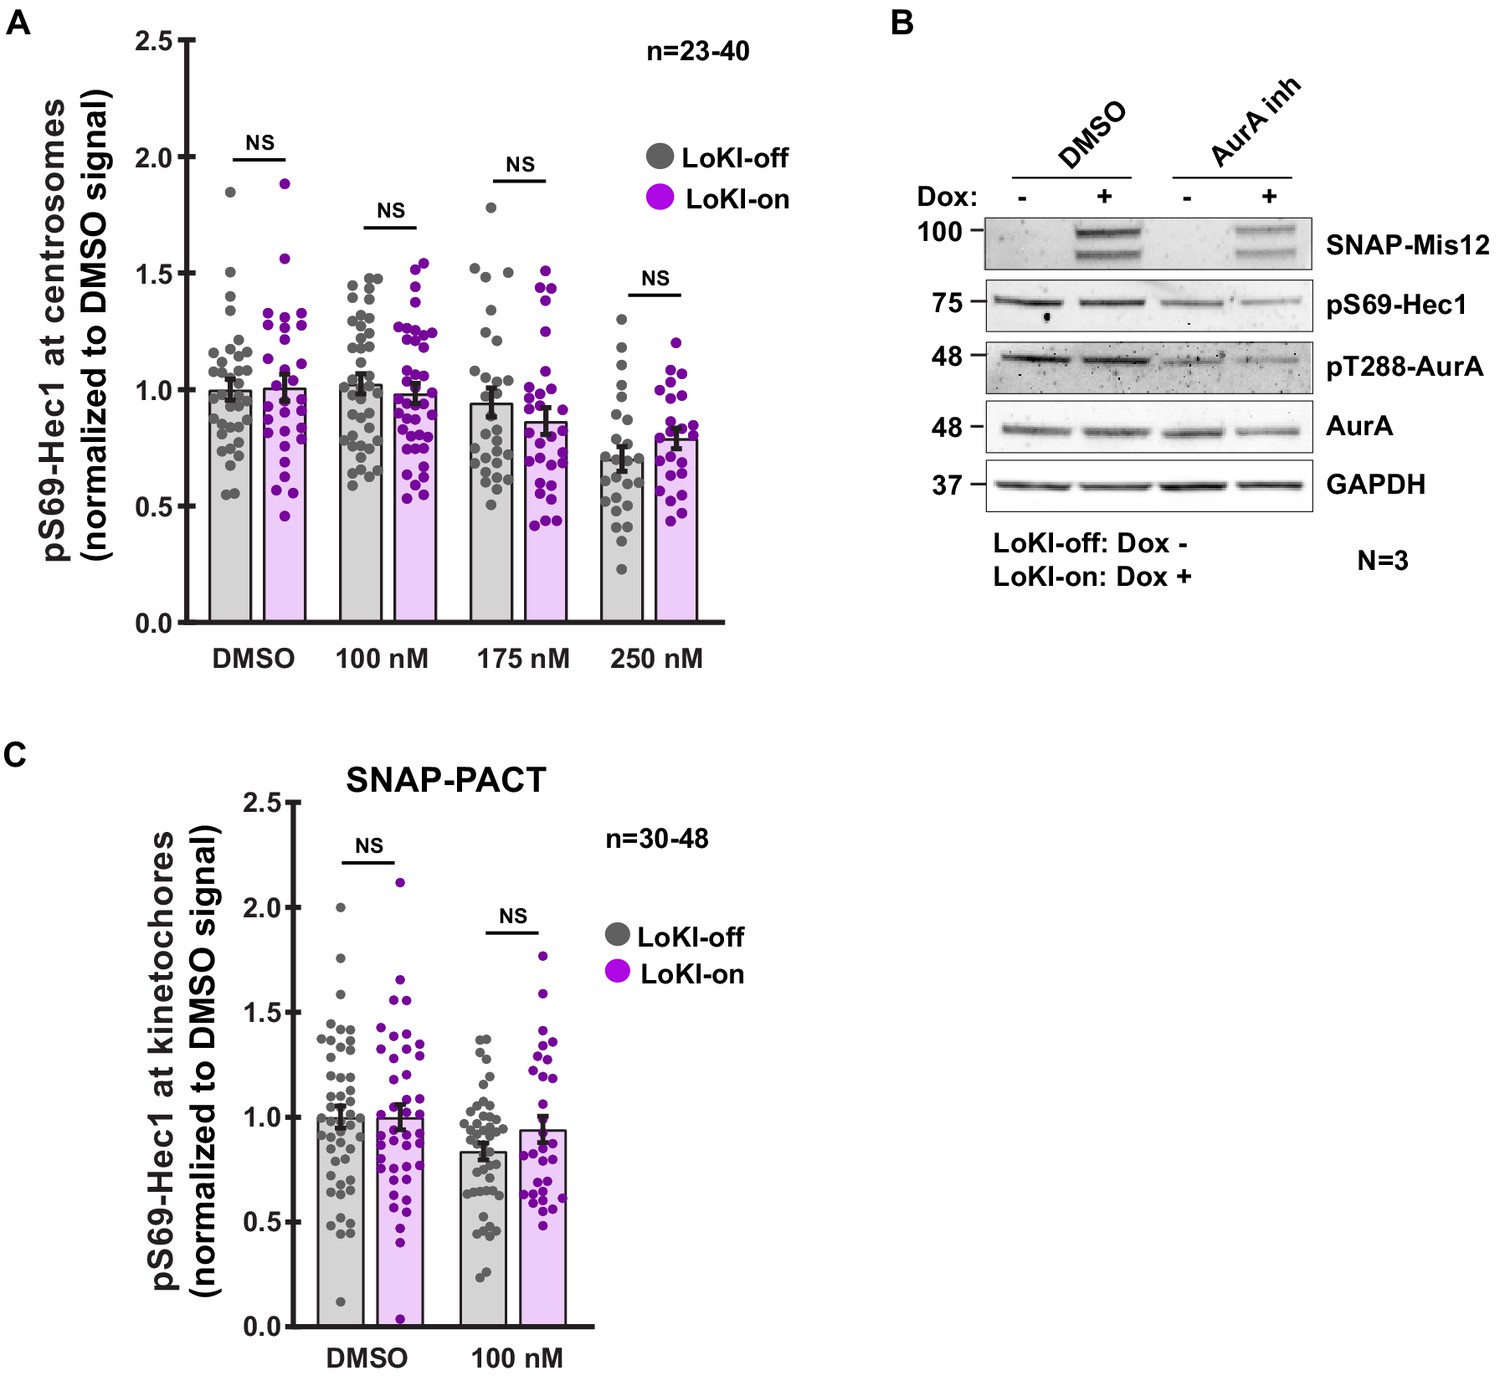
Characterization of AurA inhibition with CLP-MLN8237.
(A) Quantification of pS69-Hec1 immunofluorescence at centrosomes after 4 hr CLP-MLN8237 treatment. (B) Immunoblot detection of pS69-Hec1 (blot 2) and pT288-AurA (blot 3) in Mis12-LoKI-off and Mis12-LoKI-on expressing cells collected via mitotic shake-off. Cells were treated for 16 hr with nocodazole and 4 hr with nocodazole plus DMSO or 100 nM CLP-MLN8237. Total AurA (blot 3), SNAP-PACT (blot 1), and GAPDH (blot 5) are also depicted. (C) Quantification of pS69-Hec1 immunofluorescence at kinetochores after 4 hr CLP-MLN8237 treatment in SNAP-PACT expressing U2OS cells. Points in (A) and (C) represent individual cells (n). Data normalized to DMSO. Experiments were conducted at least three times (N = 3) and P values were calculated by unpaired two-tailed Student’s t-test. Data are mean ± s.e.m. NS, not significant.
Figure 6—video 1
CLP-substrates bind SNAP at kinetochores in Mis12-LoKI-on cells.
Reconstructed structured illumination microscopy (SIM) 3D movie of Mis12-LoKI-on U2OS cell with α-tubulin (green), mCherry-Mis12 (magenta) and centromeric DNA marker ACA (cyan). Related to Figure 6C.
Chemical structure 1
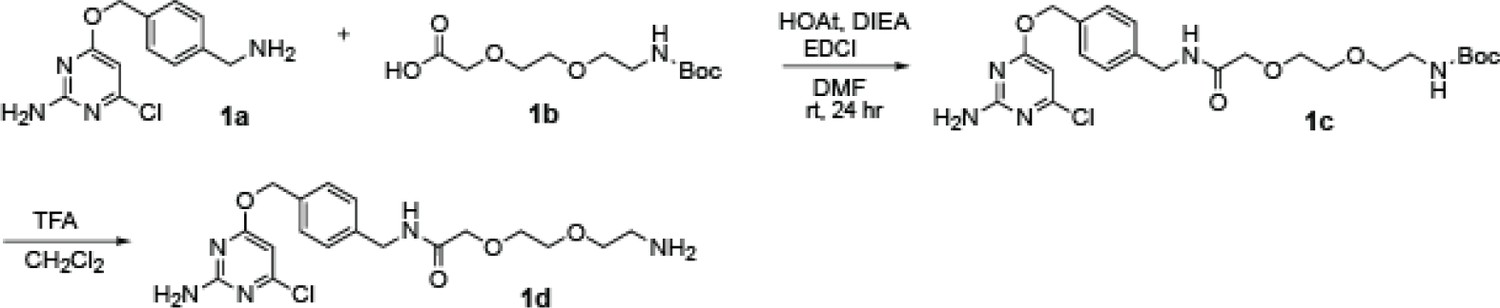
CLP-linker synthesis.
Chemical structure 2
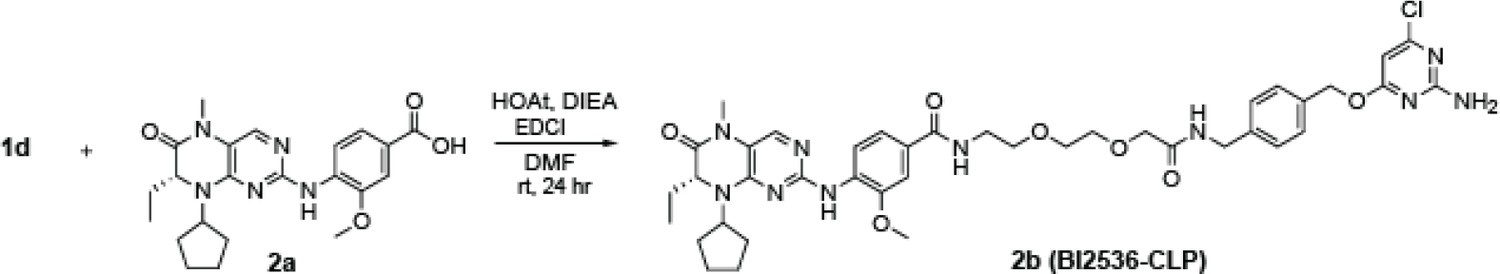
BI2536 functionalization (+CLP-linker).
Chemical structure 3
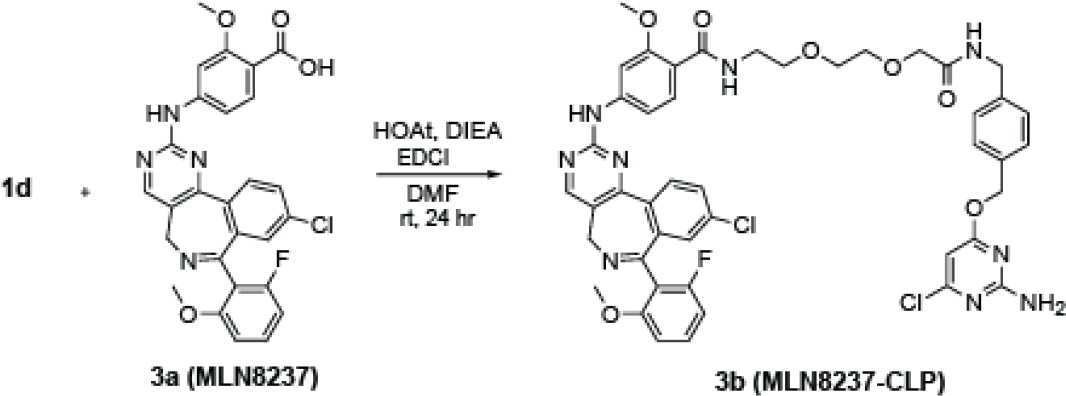
MLN8237 functionalization (+CLP-linker).
Tables
Key resources table
| Reagent type (species) or resource | Designation | Source or reference | Identifiers | Additional information |
|---|---|---|---|---|
| Antibody | Alpha-tubulin, clone DM1A | Sigma Aldrich | T9026 Mouse monoclonal RRID:AB_477593 | IF (1:500) |
| Antibody | Alpha-tubulin-FITC, clone DM1A | Sigma Aldrich | F2168 Mouse monoclonal RRID:AB_477593 | IF (1:200) |
| Antibody | Amersham ECL Mouse IgG, HRP-linked F(ab')₂ fragment (from sheep) | GE Life Sciences | NA9310 | WB (1:10000) |
| Antibody | Amersham ECL Rabbit IgG, HRP-linked F(ab')₂ fragment (from donkey) | GE Life Sciences | NA9340 | WB (1:10000) |
| Antibody | Aurora A | Sigma Aldrich | SAB2500135 Goat polyclonal | WB (1:1000) |
| Antibody | Centromere (ACA) | Antibodies Inc. | 15-234-0001 Human polyclonal | IF (1:200) |
| Antibody | Phospho-Aurora A (T288), clone C39D8 | Cell Signaling | 3079 Rabbit polyclonal | IF (1:500); WB (1:1000) |
| Antibody | Donkey anti-goat IgG-HRP | Santa Cruz | sc-2020 | WB (1:10000) |
| Antibody | Donkey anti-Mouse IgG, Alexa Fluor 488 | Invitrogen | A-21202 | IF (1:500) |
| Antibody | Donkey anti-Mouse IgG, Alexa Fluor 555 | Invitrogen | A-31570 | IF (1:500) |
| Antibody | Donkey anti-Mouse IgG, Alexa Fluor 647 | Invitrogen | A-11126 | IF (1:500) |
| Antibody | Donkey anti-Rabbit IgG, Alexa Fluor 488 | Invitrogen | A-21206 | IF (1:500) |
| Antibody | Donkey anti-Rabbit IgG, Alexa Fluor 555 | Invitrogen | A-31572 | IF (1:500) |
| Antibody | Donkey anti-Rabbit IgG, Alexa Fluor 647 | Invitrogen | A-31573 | IF (1:500) |
| Antibody | DyLight 405 AffiniPure Donkey Anti-Human IgG (H+L) | Jackson Labs | RRID: AB_2340553 | IF (1:500) |
| Antibody | GAPDH-HRP | Novus | NB110-40405 Mouse monoclonal RRID: AB_669249 | WB (1:2000) |
| Antibody | Gamma-tubulin | Abcam | 11317 Rabbit polyclonal RRID: AB_297921 | IF (1:1500) |
| Antibody | Gravin, clone JP74 | Sigma Aldrich | G3795 Mouse monoclonal | WB (1:1000) |
| Antibody | Gravin, clone R3698 | (Nauert et al., 1997) | Rabbit polyclonal | IF (1:1000) |
| Antibody | Phospho-Gravin (T766) | (Canton et al., 2012) | Rabbit polyclonal | IF (1:1000) |
| Antibody | Phospho-Hec1 (S69) | (DeLuca et al., 2018) | Rabbit polyclonal | IF (1:3000) WB (1:3000) |
| Antibody | Phospho-Plk1 (T210) | Biolegend | 628901 Rabbit polycolonal RRID: AB_439786 | IF (1:500); WB (1:1000) |
| Antibody | Plk1, clone 35–206 | Millipore | 05–844 Mouse monoclonal RRID:AB_11213632 | IF (1:500); WB (1:1000) |
| Antibody | SNAP-tag | New England Biolabs | P9310S Rabbit polyclonal | WB (1:1000) |
| Cell line (H. sapein) | HEK293 Control shRNA stable cell line | (Canton et al., 2012) | Maintained in Scott lab in DMEM supplemented with 10% FBS under 4 ug/mL Puromycin selection | |
| Cell line (H. sapein) | HEK293 Gravin shRNA stable cell line | (Canton et al., 2012) | Maintained in Scott lab in DMEM supplemented with 10% FBS under under 4 ug/mL Puromycin selection | |
| Cell line (H. sapein) | HeLa | From L. Wordeman lab, origin ATCC | Maintained in the Scott Lab in DMEM supplemented with 10% FBS | |
| Cell line (H. sapein) | hTERT-RPE | Gift from P. Jallepalli lab, origin ATCC | Maintained in the Scott Lab in DMEM/F-12, Hepes with 10% FBS | |
| Cell line (M. musculus) | MEF Gravin wildtype | (Hehnly et al., 2015) | ||
| Cell line (M. musculus) | MEF Gravin knockout | (Hehnly et al., 2015) | ||
| Cell line (H. sapein) | U2OS | ATCC | HTB-96 | Maintained in the Scott Lab in DMEM supplemented with 10% FBS |
| Chemical compound, drug | Alisertib, MLN8237 | AdooQ | A10004-10nM-D | Manufacturer’s instructions |
| Chemical compound, drug | BI2536 | AdooQ | A10134-50 | Manufacturer’s instructions |
| Chemical compound, drug | Beta-mercaptoethanol (BME) | Sigma Aldrich | M6250 | |
| Chemical compound, drug | CLP-BI2536 | This paper | See ‘synthesis of CLP-reagents’ | |
| Chemical compound, drug | CLP-MLN8237 | This paper | See ‘synthesis of CLP-reagents’ | |
| Chemical compound, drug | CLP-rhodamine | This paper | See ‘synthesis of CLP-reagents’ | |
| Chemical compound, drug | DAPI | Thermo Fisher | 62248 | IF (1:1000) |
| Chemical compound, drug | Dimethylsulfoxide (DMSO) | Pierce | TS-20688 | Manufacturer’s instructions |
| Chemical compound, drug | DMEM FluoroBrite | Life Technologies | A1896701 | |
| Chemical compound, drug | DMEM/F-12 Hepes | Life Technologies | 11330057 | |
| Chemical compound, drug | DMEM, high glucose | Life Technologies | 11965118 | |
| Chemical compound, drug | Doxycycline hyclate | Sigma Aldrich | 24390-14-5 | |
| Chemical compound, drug | Fetal Bovine Serum | Thermo Fisher | A3382001 | |
| Chemical compound, drug | Lipofectamine 2000 Transfection Reagent | Invitrogen | 11668027 | |
| Chemical compound, drug | NuPAGE LDS Sample Buffer 4X | Thermo Fisher | NP0008 | |
| Chemical compound, drug | Opti-MEM I Reduced Serum Medium, no phenol red | Life Technologies | 11058021 | |
| Chemical compound, drug | ProLong Diamond Antifade Mountant | Life Technologies | P36961 | Manufacturer’s instructions |
| Chemical compound, drug | Polybrene | Santa Cruz | 134220 | Manufacturer’s instructions |
| Chemical compound, drug | Puromycin dihydrochloride | Santa Cruz | 58-58-2 | 4 ug/mL |
| Chemical compound, drug | SNAP-Cell Fluorescein | New England Biolabs | S9107S | Manufacturer’s instructions |
| Chemical compound, drug | SNAP-Cell 647-SiR | New England Biolabs | S9102S | Manufacturer’s instructions |
| Chemical compound, drug | SuperSignal West Dura Extended Duration Substrate | Thermo Fisher | 34075 | |
| Chemical compound, drug | TransIT-LT1 Transfection Reagent | Mirus | MIR2300 | |
| Chemical compound, drug | Trypsin-EDTA (0.25%), phenol red | Gibco | 25200056 | |
| Commercial assay or kit | BCA Protein Assay Kit | Thermo Fisher | 23227 | |
| Commercial assay or kit | QuikChange II XL kit | Aligent | 200522 | |
| Commercial assay or kit | GeneJET Genomic DNA purification kit | Thermo Fisher | K0721 | |
| Peptide, recombinant protein | Aurora A, active | Invitrogen | PV3612 | |
| Peptide, recombinant protein | Plk1, active | SignalChem | P41-10H | |
| Recombinant DNA reagent | EMTB-3XGFP | Addgene | pCS2+ backbone | |
| Recombinant DNA reagent | GFP-H2B | Addgene | pEGFP-N1 backbone | |
| Recombinant DNA reagent | His6-SNAP-tag | Addgene | pMCSG7 backbone | |
| Recombinant DNA reagent | pMD2.G | RRID: Addgene_12259 | gift from Didier Trono; Addgene plasmid #12259 | |
| Recombinant DNA reagent | psPAX2 | RRID: Addgene_12260 | gift from Didier Trono; Addgene plasmid #12259 | |
| Recombinant DNA reagent | SNAP-PACT | This paper | In-house modified pLIX402 backbone (gift from David Root; Addgene plasmid #41394) | |
| Recombinant DNA reagent | SNAP-PACT (C144A) | This paper | In-house modified pLIX402 backbone (gift from David Root; Addgene plasmid #41394) | |
| Recombinant DNA reagent | SNAP-Mis12 | This paper | In-house modified pLIX402 backbone (gift from David Root; Addgene plasmid #41394) | |
| Recombinant DNA reagent | SNAP-Mis12 (C144A) | This paper | In-house modified pLIX402 backbone (gift from David Root; Addgene plasmid #41394) | |
| Recombinant DNA reagent | SNAP-AKAP79 | This paper | In-house modified pcDNA3.1+ backbone (Life Technologies) | |
| Recombinant DNA reagent | SNAP-dAKAP1 | This paper | In-house modified pcDNA3.1+ backbone (Life Technologies) | |
| Software, algorithm | Fiji/ImageJ | ImageJ (http://imagej.nih.gov/ij/) | ||
| Software, algorithm | GraphPad Prism | GraphPad Prism (https://graphpad.com) | ||
| Software, algorithm | Imaris | Bitplane | ||
| Software, algorithm | SoftWoRx | GE Healthcare | ||
| Other | 1.5 poly-D-lysine coated coverslips | neuVitro | GG-12–1.5-pdl | |
| Other | AnykD Criterion TGX Precast Midi Protein Gel | Biorad | 5671124 | |
| Other | Bolt 4–12% Bis-Tris Plus Gels | Invitrogen | NW04120BOX | |
| Other | Scienceware cloning discs | Sigma Aldrich | Z374431 | |
| Other | μ-Slide 4 Well Glass Bottom: # 1.5H (170 μm + /- 5 μm) D 263 M Schott glass | (Ibidi)Pierce | 80426 |
Additional files
Download links
A two-part list of links to download the article, or parts of the article, in various formats.
Downloads (link to download the article as PDF)
Open citations (links to open the citations from this article in various online reference manager services)
Cite this article (links to download the citations from this article in formats compatible with various reference manager tools)
Subcellular drug targeting illuminates local kinase action
eLife 8:e52220.
https://doi.org/10.7554/eLife.52220


