Dissecting the immunosuppressive tumor microenvironments in Glioblastoma-on-a-Chip for optimized PD-1 immunotherapy
- Department of Mechanical and Aerospace Engineering, New York University, United States
- Department of Biomedical Engineering, New York University, United States
- Department of Biomedical Engineering, Jinan University, China
- Department of Pathology, NYU Langone Health, United States
- Stem Cell Biology Program, NYU School of Medicine, United States
- Perlmutter Cancer Center, NYU Langone Health, United States
- Department of Neurology, NYU Langone Health, United States
- Department of Neuroradiology, NYU Langone Health, United States
- Department of Neurosurgery, NYU Langone Health, United States
- Department of Radiation Oncology, NYU Langone Health, United States
Figures
Figure 1 with 1 supplement
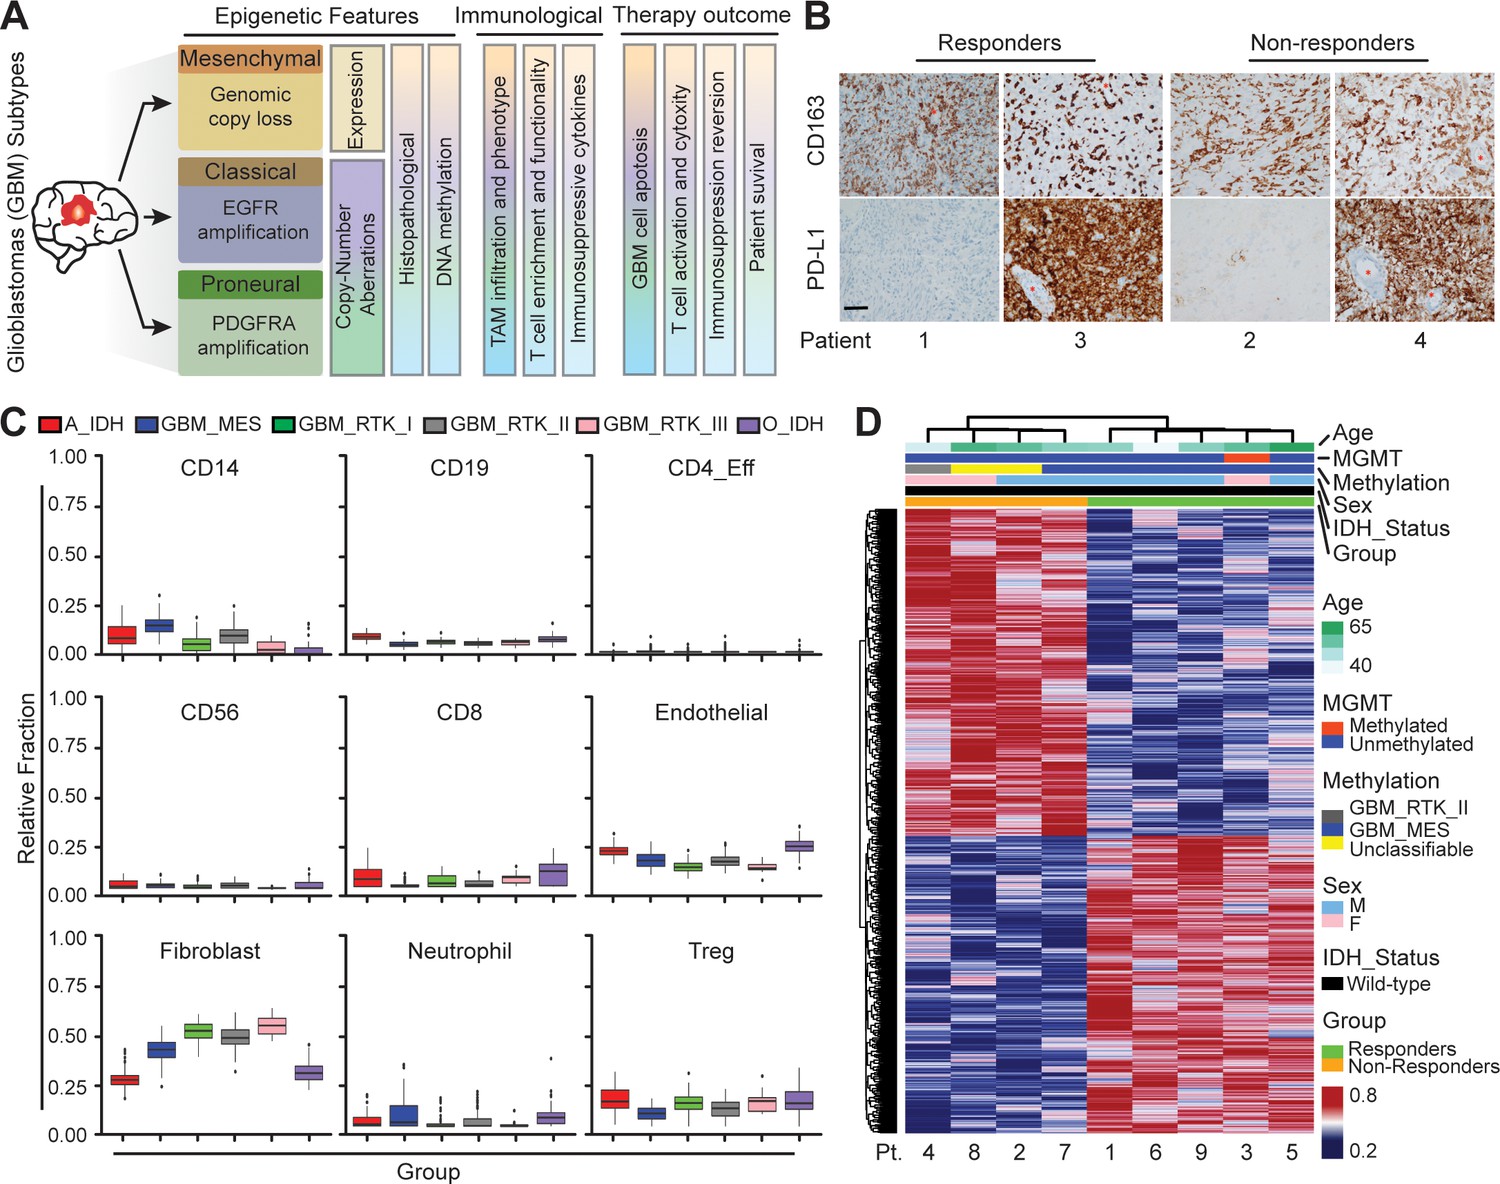
Distinct systemic immunosuppression in clinical GBM patients.
(A) A schematic illustrating the stratification of genetic, molecular and cellular characteristics in distinct GBM subtypes. (B) Immunohistochemical analysis of PD-L1 expression on GBM tumors and CD163+ expression on TAM infiltrate. Varied PD-L1 and CD163 expressions with high or no expression in both responding and non-responding GBM patients with administration of a PD-1 inhibitor (nivolumab). Red stars denote brain microvessel. Scale bar is 100 µm. (C) MethylCIBERSORT deconvolution of whole genome DNA methylation data from 435 glioma patients (Capper et al., 2018) sorted into six main molecular diffuse glioma subtypes (IDH mutated astrocytoma and oligodendroglioma A_IDH and O_IDH; GBM subtypes Mesenchymal: MES, Proneural: RTK_I, and Classical: RTK_II and RTK_III) shows variability in immune cell subpopulations across GBM subtypes. p-Values for Kruskal-Wallis test are as follows for CD14 (p<2.2−16), CD19 (p<2.2−16), CD4_Eff (p=5.9−4), CD56 (p=1.2−3), CD8 (p<6.9−14), Endothelial (p<2.2−16), Fibroblast (p<2.2−16), Neutrophil (p=2.1−11), and Regulatory T-cells (Treg) (p=2−15). CD14 and CD8 were used to identify the monocytic/macrophage and effector T-cell fractions. (D) Clinicopathological information and whole genome DNA methylation showing top 10,000 differentially methylated probes of GBM patients treated with PD-1 inhibitor (nivolumab). Clustering is represented for Responders and non-Responders, irrespective of molecular subtype or other clinicopathological variables (N = 9).
Figure 1—figure supplement 1
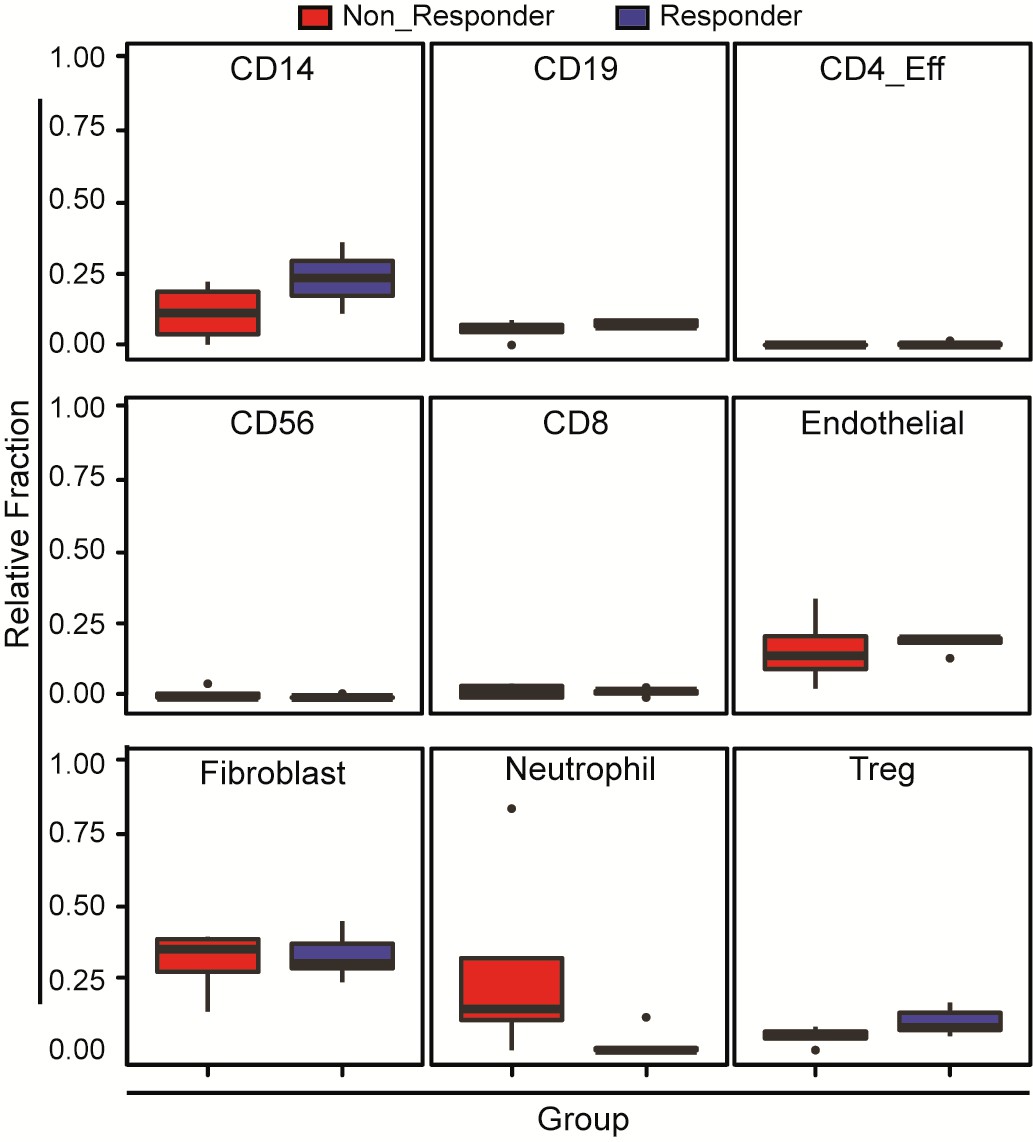
Variability in immune cell subpopulations in both responding and non-responding GBM patients with administration of a PD-1 inhibitor (nivolumab).
Immune cell subpopulation DNA methylation signatures of patients on PD-1 immunotherapy are deconvoluted using methylCIBERSORT. Noted that Repsonders and who showed no response to nivolumab do not show any significant differences in relative fractions of immune and stromal cells. p-Value of Wilcoxon test for CD14, CD19, CD4_Eff, CD56, CD8, endothelial, fibroblast, neutrophil and regulatory T cells (Treg) is 0.18; 0.39; 0.24; 0.47; 0.9; 0.39; 0.9; 0.12 and 0.27, respectively.
Figure 2 with 4 supplements
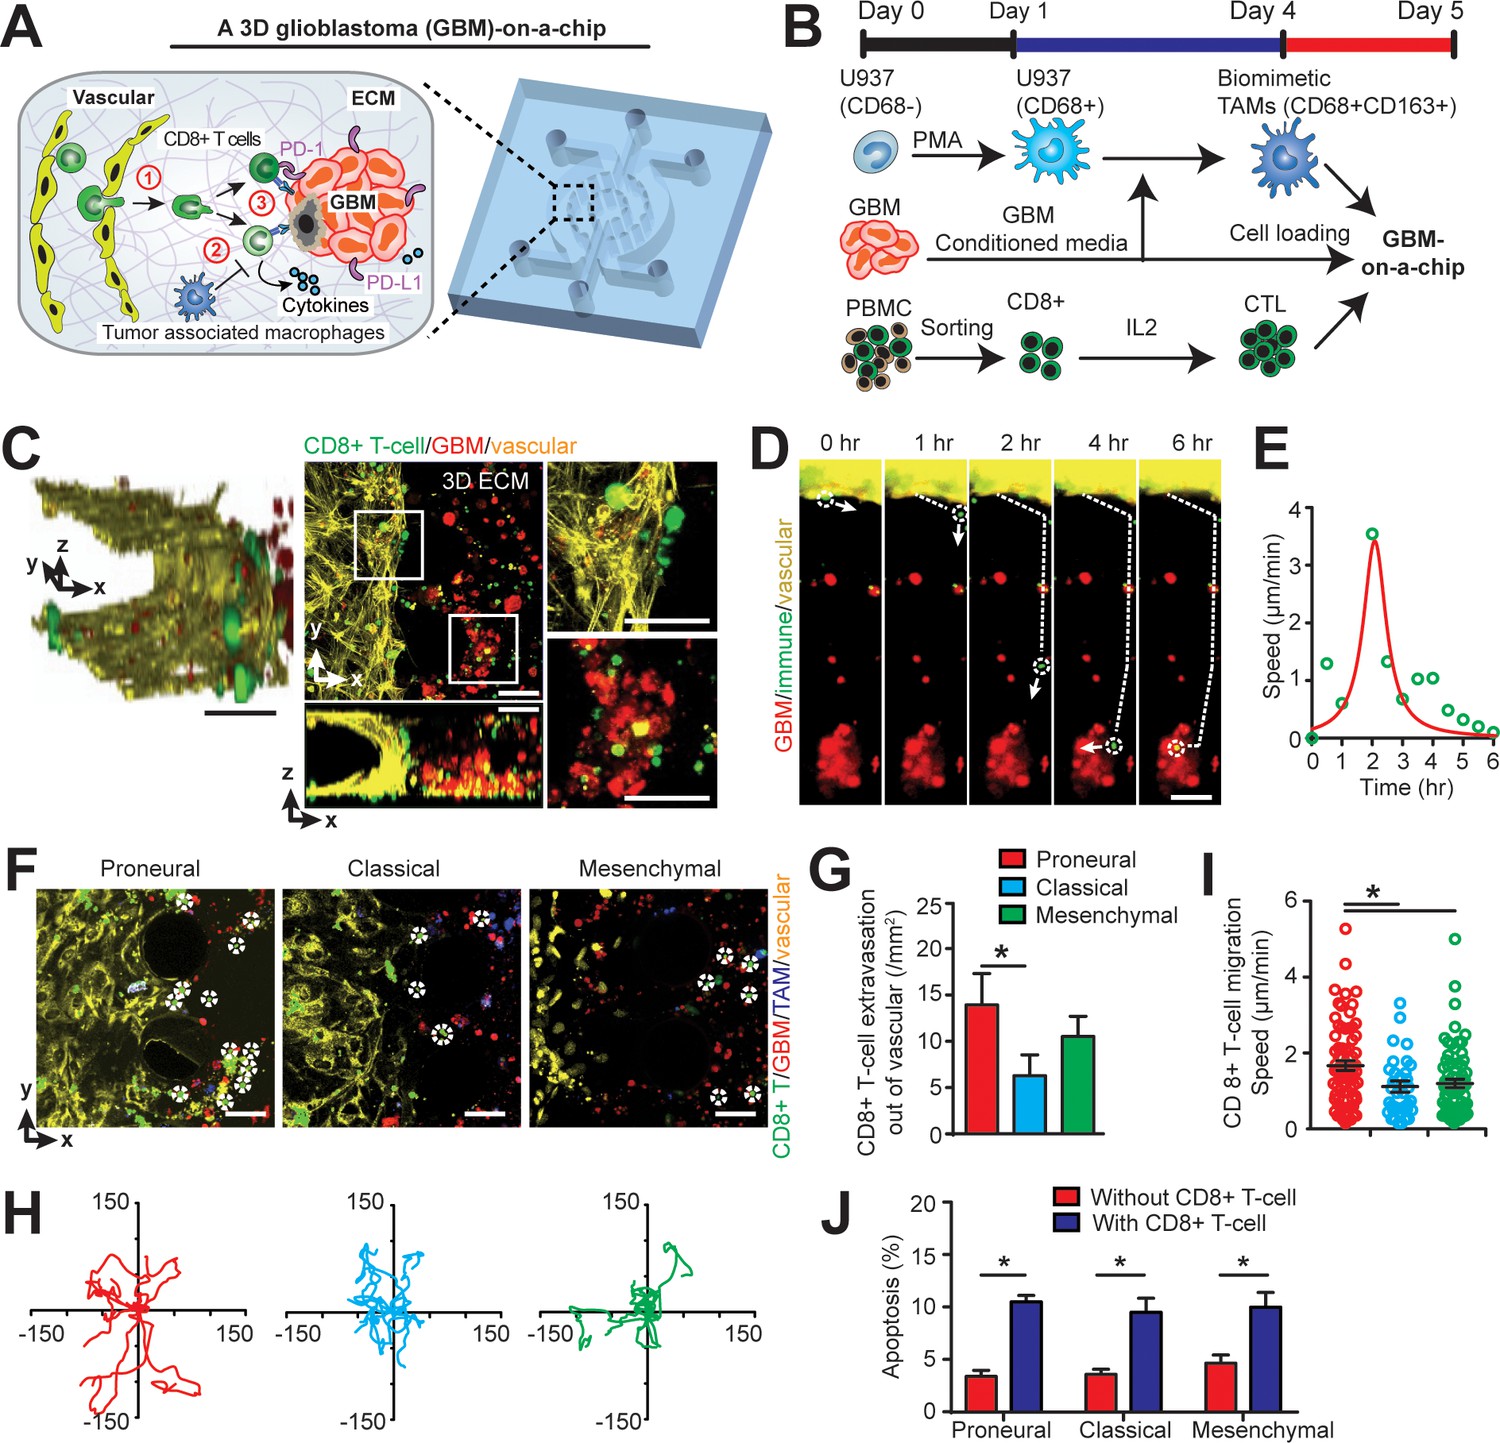
Modelling the in vivo GBM tumor niche in a ‘GBM-a-on-Chip’ microphysiological system.
(A) A schematic diagram illustrating a microfluidics-based GBM-on-a-Chip model to investigate ① the interactions of immune cell (CD8+ T-cells) with brain microvessels, ② tumor-associated macrophages (TAMs) and ③ GBM tumor cells in an engineered 3D brain-mimicking ECM. (B) A schematic illustrating the procedures of cell preparation in the microphysiological system. Biomimetic TAMs (CD68+CD163+) were prepared by differentiating monocyte-like U937 cells with 5 nM of PMA for 24 hr, followed by treatments of conditioned-media of GBM cells for 3 days. Simultaneously, fresh allogeneic CD8+ T-cells were isolated from PBMCs and activated and expanded for 3 days with IL-2. (C) Representative confocal immunofluorescence images showing a 3D brain microvessel lumen (yellow) in contact with CD8+ T-cells (green) and GBM (PN, GBML20) tumor cells (red). Scale bar is 50 µm. (D) Representative time-lapsed images showing a single CD8+ T-cell extravasating through brain microvessels (yellow, 0–1 hr), infiltrating through ECM (1–4 hr), and interacting with GBM tumor cells (red, 4–6 hr). Scale bar is 50 µm. (E) Quantified CD8+ T-cell migration speed at different time points of infiltration, indicating the relatively maximum migration speed after extravasation and before contacting with GBM cells. (F) Representative immunofluorescence images showing the distinct counts of allogeneic CD8+ T-cell infiltrate in the PN (GBML20), CL (GBML08) and MES (GBML91) GBM subtypes in GBM-on-a-Chip after 3 days’ culture. Note that CD8+ T-cells (green) were in contact with brain microvessels (yellow), TAMs (blue) and GBM tumor cells (red). Scale bar is 50 µm. (G) Quantified results showing more infiltrated allogeneic CD8+ T-cells in the PN GBM as compared to the CL and MES GBMs. (H) Migration trajectories of infiltrated CD8+ T-cell (n > 20) for 2 hr in different GBM subtypes. (I) Quantified migration speed of infiltrated CD8+ T-cell, showing faster migration speed in the PN GBM as compared to the CL and MES GBMs at the observation window. Note that the speed range (0–6 µm/min) represents different infiltration stages of different T-cells. (J) Quantified GBM cell apoptosis ratio with the presence or absence of IL-2-activated allogeneic CD8+ T-cell in different GBM niches based on caspase-3/7 activation. Error bars represent ± standard error of the mean (s.e.m.). p-Values were calculated using the Student’s paired sample t-test. *, p<0.05.
Figure 2—figure supplement 1
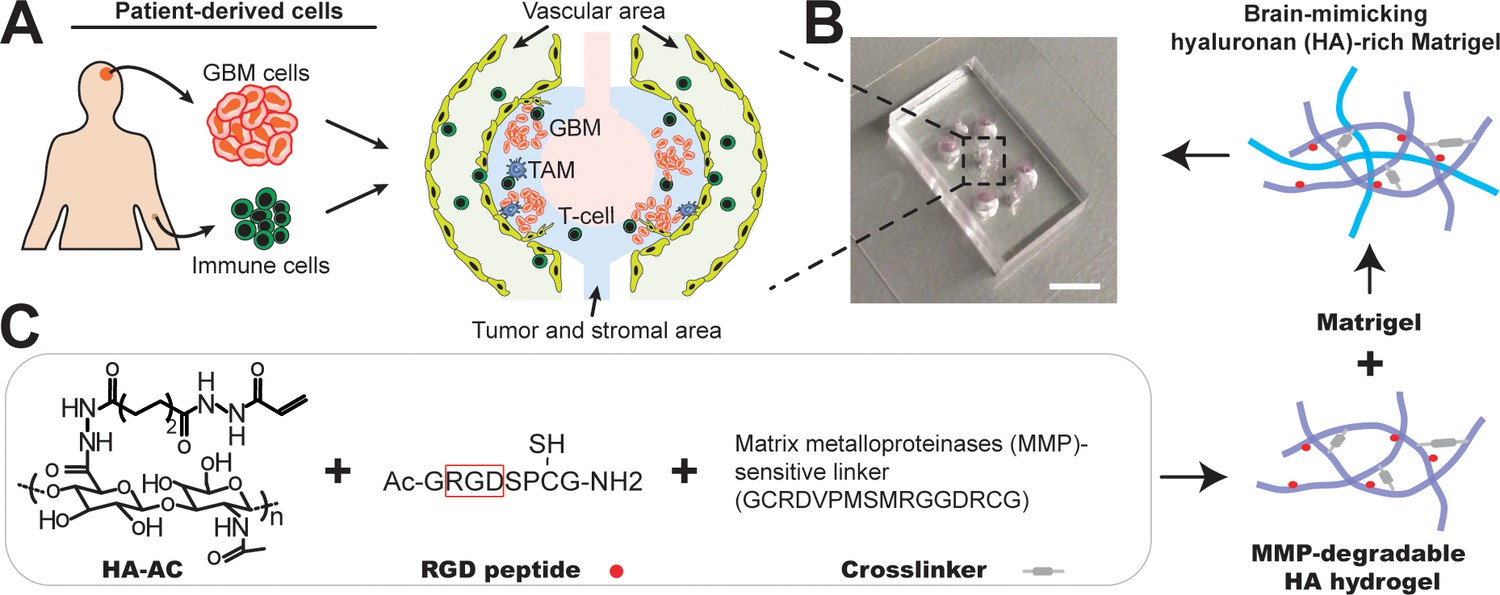
Microfabrication of the microfluidics-based ‘GBM-on-a-Chip’ microphysiological system.
(A) A schematic illustrating the layout of ex vivo microphysiological system populated by using patient-resected tumor cells and human primary immune cells. The system consists of peripheral regions (yellow) for brain vascular growth, and immune cell seeding, middle regions (blue) for tumor and stromal TAMs growth, and center region (pink) for cell culture medium infusion. (B) A photo showing the actual microfluidic chip. Scale bar is 5 mm. (C) A schematic demonstrating the synthesis of brain-mimicking HA-rich Matrigel ECM. RGD peptides are conjugated onto Acrylated hyaluronic acid (HA-AC) and crosslinked with MMP-degradable crosslinker (GCRDVPMSMRGGDRCG). To further mimic the tumor microenvironment growth-factor-reduced Matrigel matrix is interpenetrated with MMP-degradable HA hydrogel for brain tissue-mimicking ECM.
Figure 2—figure supplement 2

Sample preparation for TAMs and effector CD8+ T-cells.
(A) Representative immunofluorescence images showing CD163 expressions on PMA-treated U937 monocytes with and without treatments of GBML91’s conditioned-media. Scale bar is 50 µm. (B) Quantified results showing more CD163+ macrophages in GBML91-educated U937 cells. (C) Quantified flow results showing the purity of sorted CD8+ T-cells from PBMCs. APC represented the fluorescent intensity of CD8+ markers. (D) Quantified results showing the purity of sorted CD8+ T-cells is ~80%. p-Values were calculated using the unpaired two-tailed Student’s t-test. *, p<0.05.
Figure 2—figure supplement 3
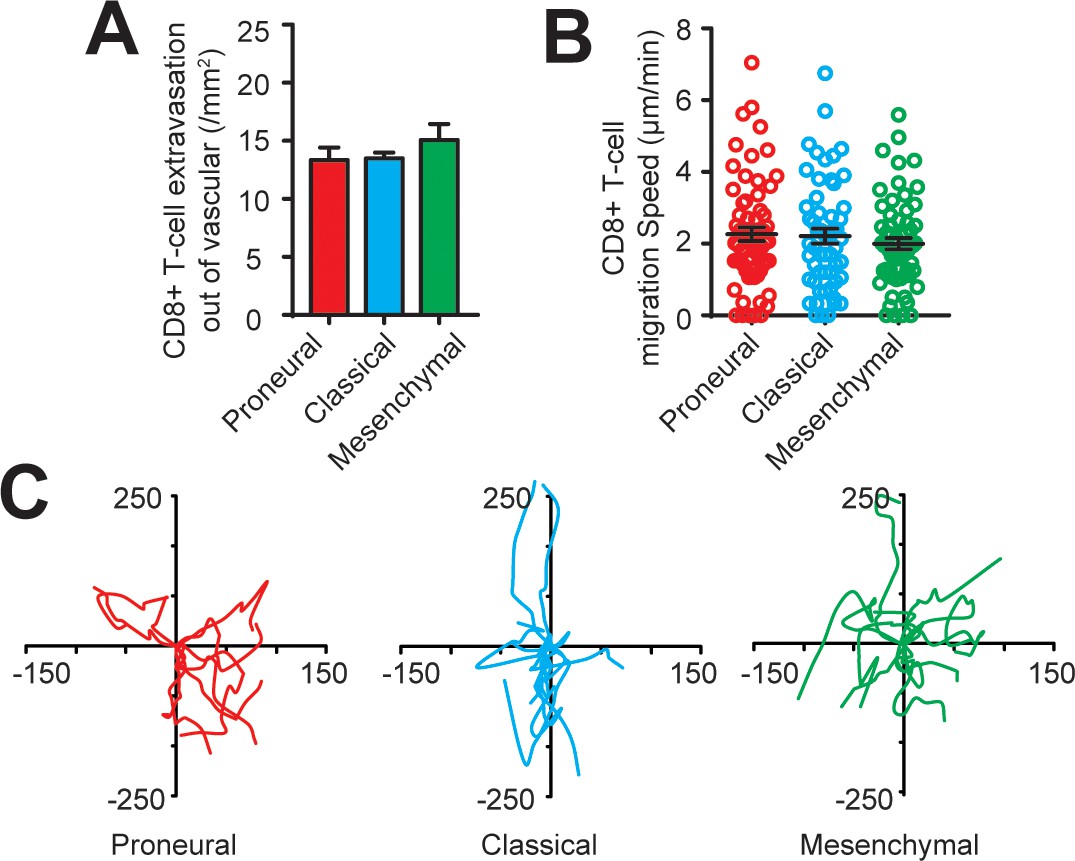
CD8+ T-cell extravasation and infiltration behaviors in the engineered GBM microenvironment without the presence of TAM.
(A) Quantified results showing similar amounts of extravasated CD8+ T-cells out of vascular in the PN (GBML20), CL (GBML08) and MES (GBML91) GBMs without the presence of TAM. (B) Quantified results showing the migration speeds of infiltrated CD8+ T-cells in all three GBM subtypes without the presence of TAM are comparable. (C) Representative trajectories of infiltrated CD8+ T-cells in the 2 hr observation window in different GBM subtypes without the presence of TAM. Error bars represent ± s.e.m.
Figure 2—figure supplement 4
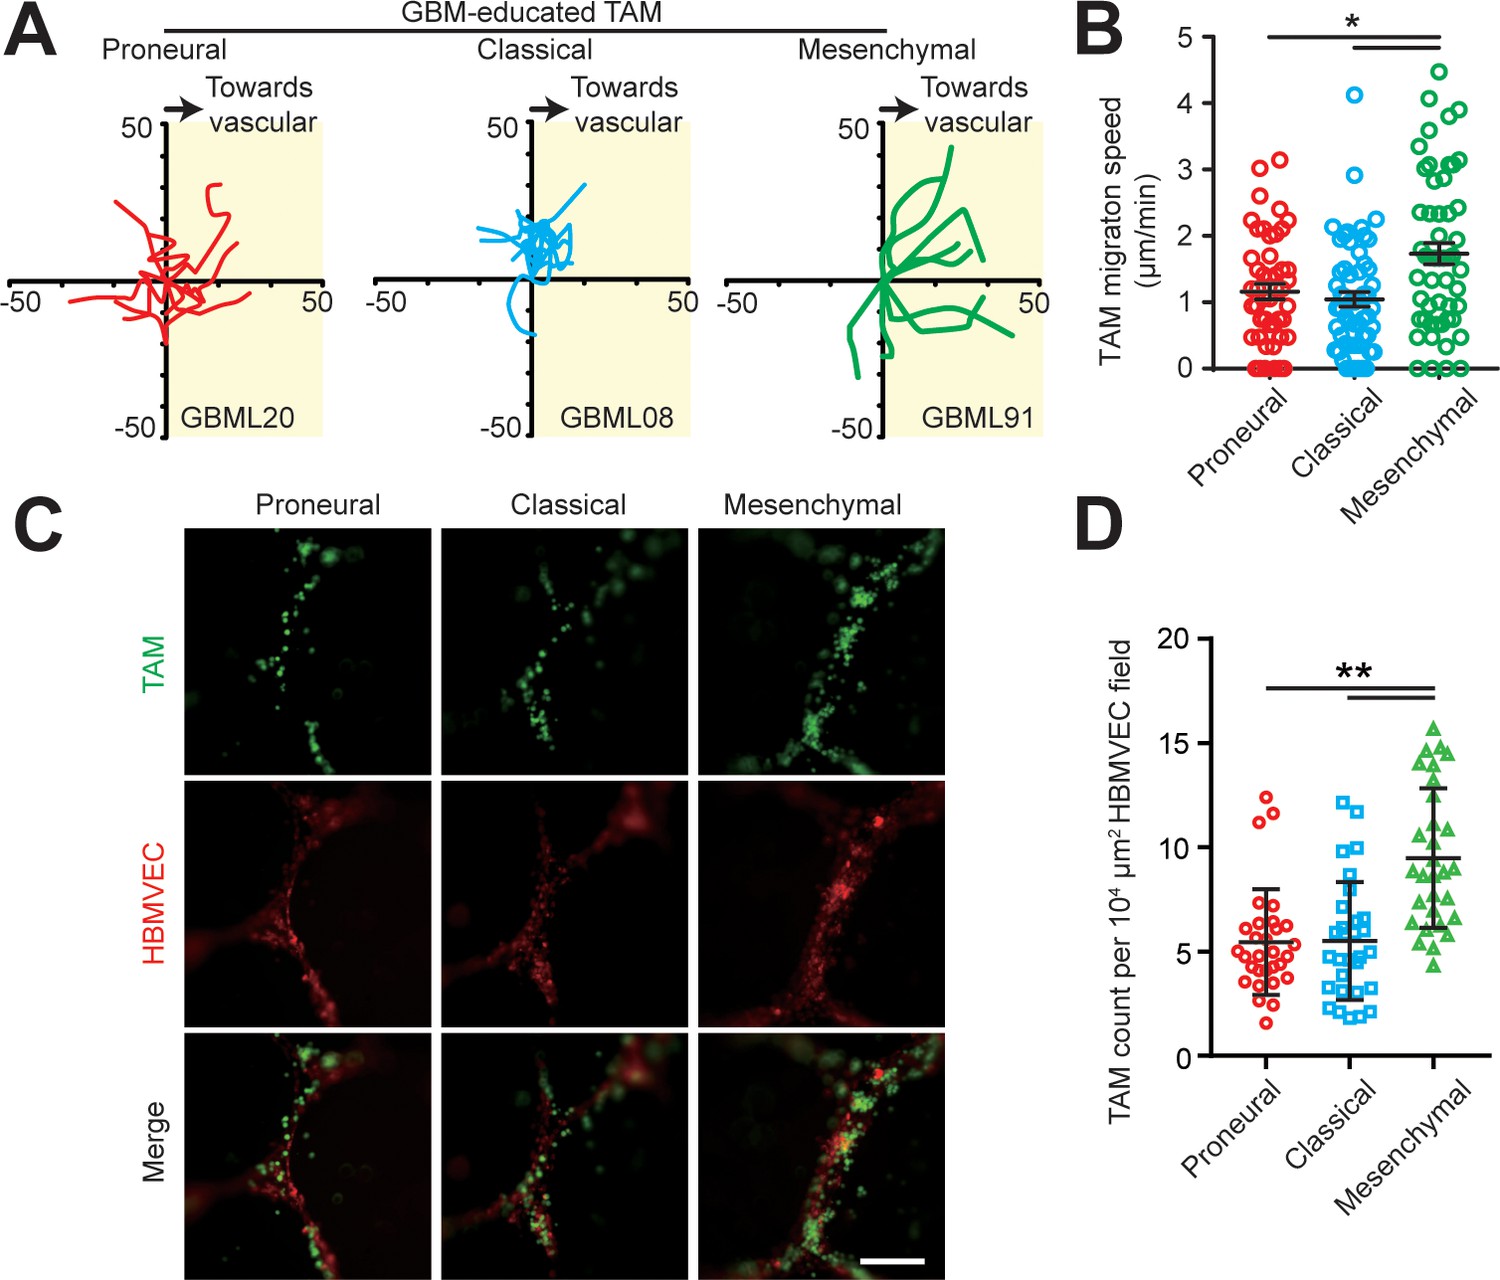
TAM motility and adherent behaviors in the engineered tumor microenvironments of different GBM subtypes.
(A) Representative trajectories of embedded TAM movements in a 2 hr observation window in different GBM subtypes. (B) Quantified results showing faster TAM movement towards the vascular side in the MES (GBML91) GBM as compared to the CL (GBML08) and PN (GBML20) GBMs. Error bars represent ± s.e.m. p-Values were calculated using one-way ANOVA. *, p<0.05. (C) Representative staining images showing different subtypes of GBM-educated TAMs adherent to HBMVECs. TAMs were plated into 24-well plate with HBMVEC monolayer and cultured for 12 hr, followed by 3 times washing with warm media. Scale bar is 200 µm. (D) Number of adherent TAMs to HBMVEC were counted and plotted as cell number per 104 μm2 HBMVEC field. p-Values were calculated using unpaired two-tailed Student’s t-test, N = 30, **p<0.01.
Figure 3 with 2 supplements
Distinct systemic immunosuppression in PN, CL and MES GBMs.
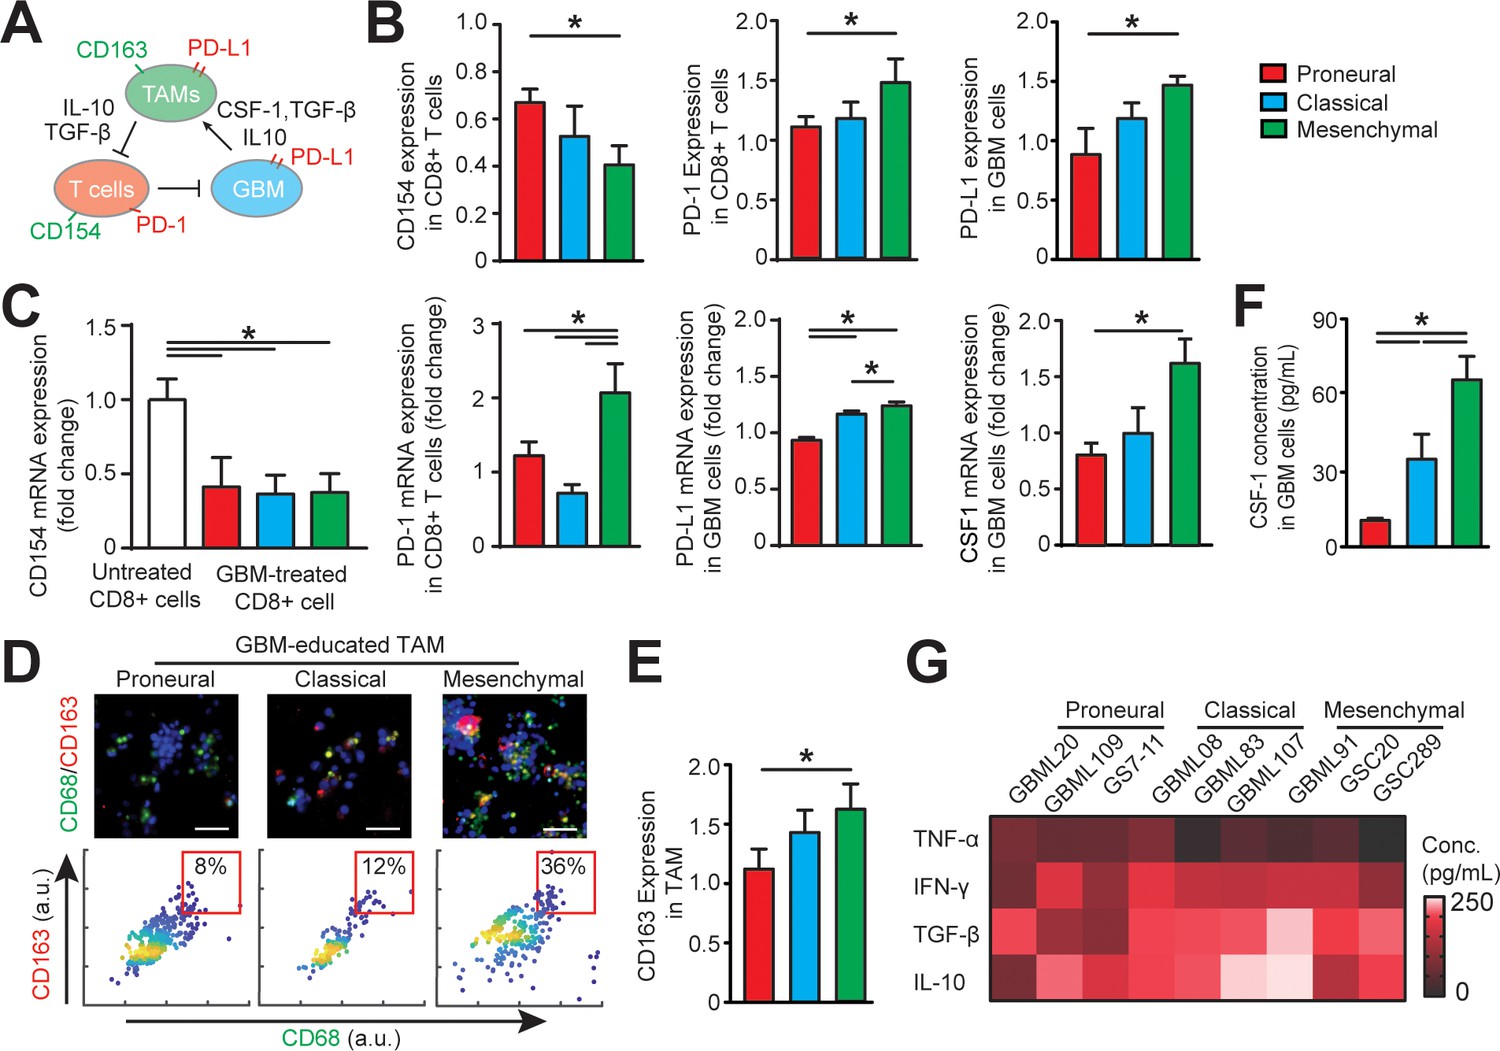
(A) A schematic highlighting the systemic immunosuppressive signaling among GBM, TAM and CD8+ T-cell via CSF-1/CSF-1R, immunosuppressive cytokines and PD-1/PD-L1. (B) Quantified CD154 and PD-1 expressions (normalized to untreated) on allogeneic CD8+ T-cell, and PD-L1 expression (normalized to untreated) on GBM cells of PN (GBML20), CL (GBML08) and MES (GBML91) subtypes, showing higher expressions of PD-1 and PD-L1 in the MES GBM niche as compared to the PN and CL GBM niches. Surface marker expression was quantified by the mean intensity of each cell. (C) qPCR analysis showing different CD154 and PD-1 expressions in CD8+ T-cell, PD-L1 and CSF-1 expressions in GBM cell. (D) Representative immunofluorescence images showing more immunosuppressive M2-like macrophages in the MES GBM (GBML91) than the PN and CL subtypes. Scale bar is 50 µm. (E) Quantified M2-like marker CD163 expression (normalized to untreated group) on TAM, in different GBM subtypes, showing higher TAM CD163 expression in MES GBM compared to PN (GBML20) and CL (GBML08) GBMs. (F) ELISA results showing high CSF-1 level expressed by MES (GBML91) GBM. (G) Quantified cytokine levels in different GBM derived niches, showing relatively higher expressions of immunosuppressive cytokine (TGF-β1 and IL-10), lower expressions of pro-inflammatory cytokines (IFN-γ and TNF-α) in MES GBM (GBML91). Error bars represent ± s.e.m., n > 80 in B, D, and F. P-values were calculated using one-way ANOVA. *, p<0.05.
Figure 3—figure supplement 1
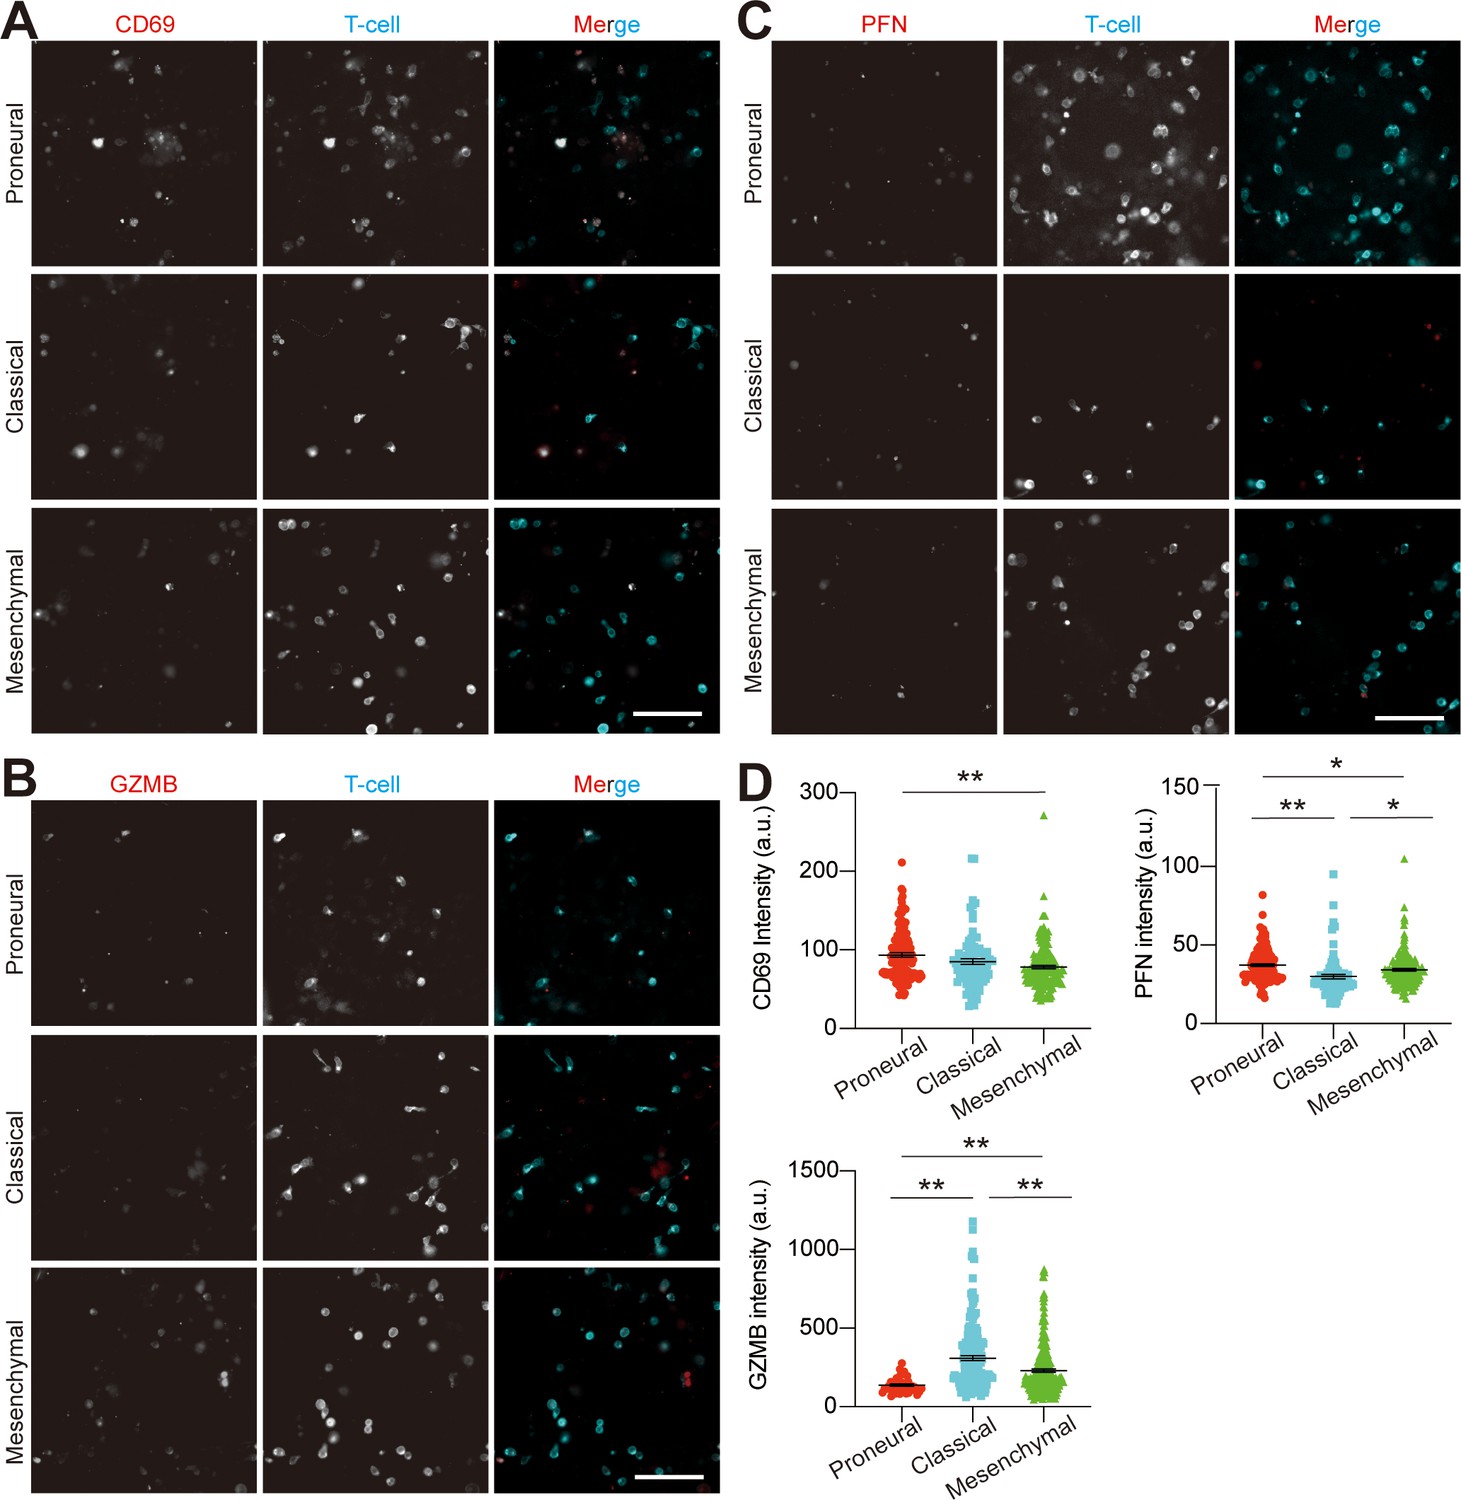
Analysis of allogeneic CD8+ T-cell activation in various GBM niches.
The representative staining images showing (A) CD69, (B) granyme B (GZMB) and (C) perforin (PFN) expressions on CD8+ T-cells in MES (GBML91), CL (GBML08) and PN (GBML20) GBM niches. Scale bar, 100 μm. The quantified expressions were shown in (D). Noted the relatively lower expressions of T-cell activation markers in the MES GBM as compared to the CL or PN GBM. Surface marker expression was quantified by the mean fluorescent intensity of each cell. Error bars represent ± s.e.m. p-Values were calculated using one-way ANOVA. *, p<0.05, **p<0.01.
Figure 3—figure supplement 2
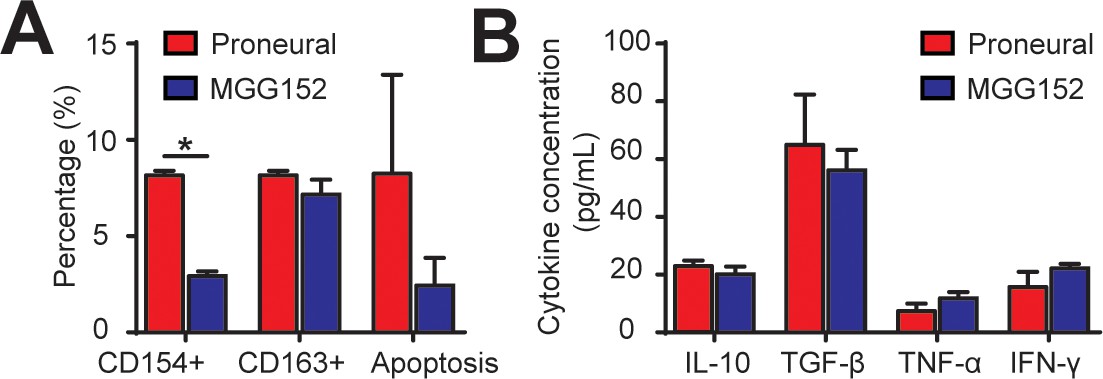
Comparison of cellular and cytokine conditions of IDH-mutant and IDH-wildtype GBM tumor cells.
(A) Quantified ratios of CD8+CD154+ cells, CD68+CD163+ cells and caspase-3/7+ apoptosis cells in MGG152 IDH-mutant and proneural GBMs. The PN GBM result represents the mean of three PN GBM cells (GBML20, GBML109, and GS7-11). Note that percentages of CD163+ and apoptosis cells were comparable between the MGG152 and PN GBMs. (B) Comparable concentrations of both pro-inflammatory (TNF-α, IFN-γ) and immunosuppressive (TGF-β and IL-10) cytokines in both cell types. Error bars represent ± s.e.m. p-Values were calculated using the unpaired two-tailed Student’s t-test. *, p<0.05.
Figure 4 with 3 supplements
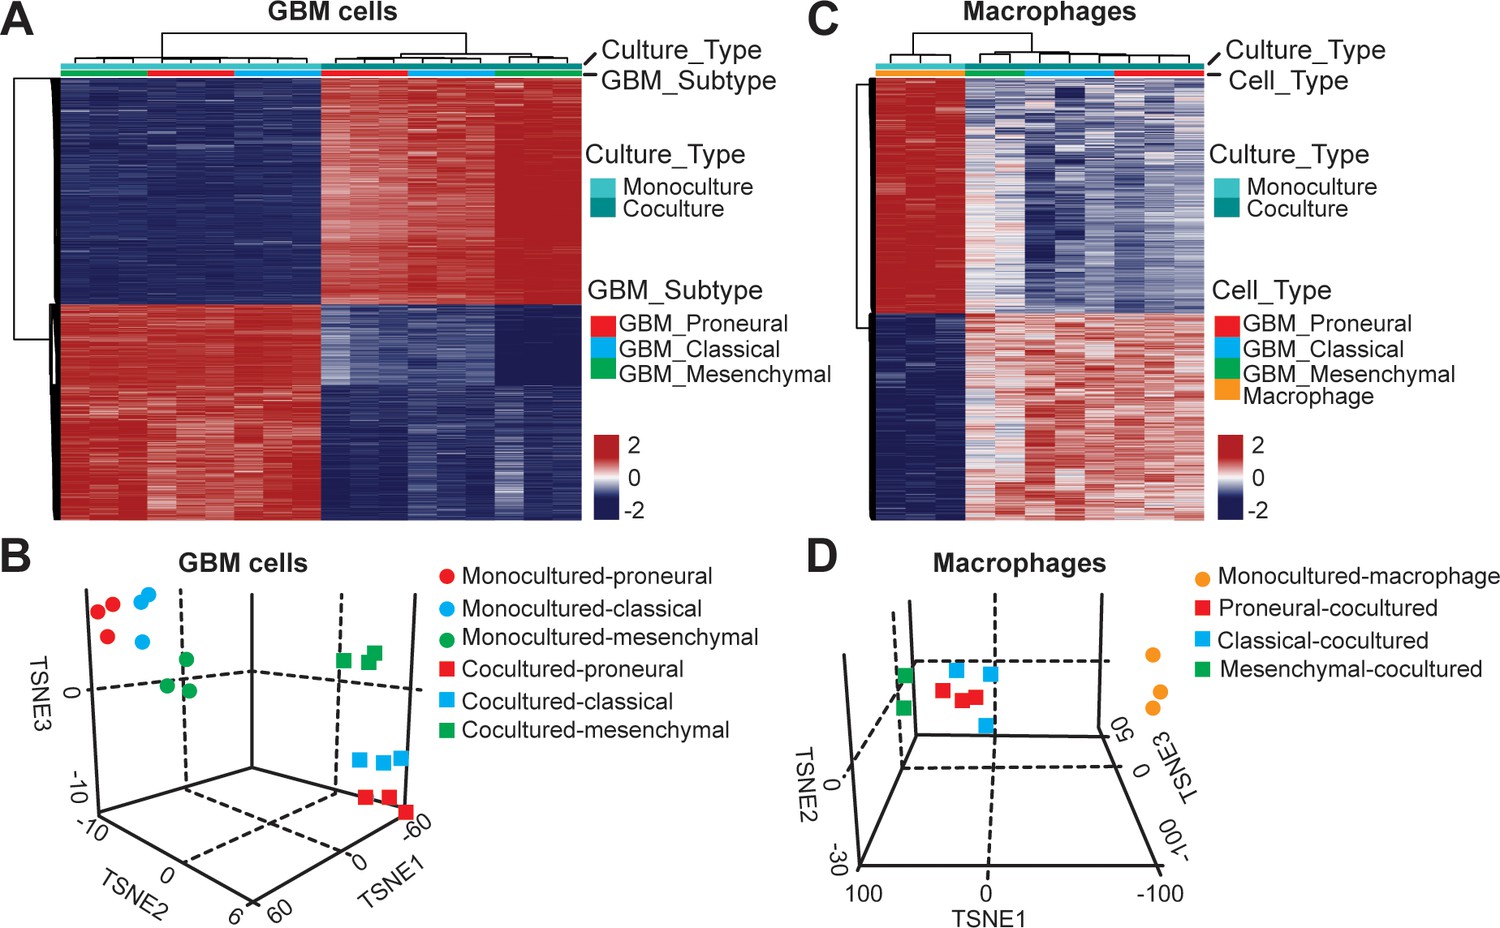
DNA methylation analysis of interactions between patient-derived GBM cell and macrophage in an engineered 3D GBM niche environment.
(A) Whole genome DNA methylation analysis showing top 10,000 differentially methylated probes of patient-derived PN (GBML20), CL (GBML08) and MES (GBML91) GBM cells cultured in a 3D brain-mimicking ECM environment with or without macrophages. (B) tSNE analysis of mono-cultured and co-cultured GBM cells showing clear separation of all molecular GBM subtypes, PN (GBML20), CL (GBML08) and MES (GBML91) (each in triplicate) in the same direction when exposed to macrophages. However, the effect appears to be different in the three molecular subtypes with PN GBM mostly affected by presence of macrophage. (C) Whole genome DNA methylation analysis showing top 10,000 differentially methylated probes of mono-cultured and GBM cell-educated macrophages. (D) tSNE analysis of mono-cultured and patient-derived GBM cell-educated macrophages showing distinct shifts in methylation in all molecular GBM subtypes. However, MES GBM cell co-cultured macrophages cluster showed a more distinct separation.
Figure 4—figure supplement 1
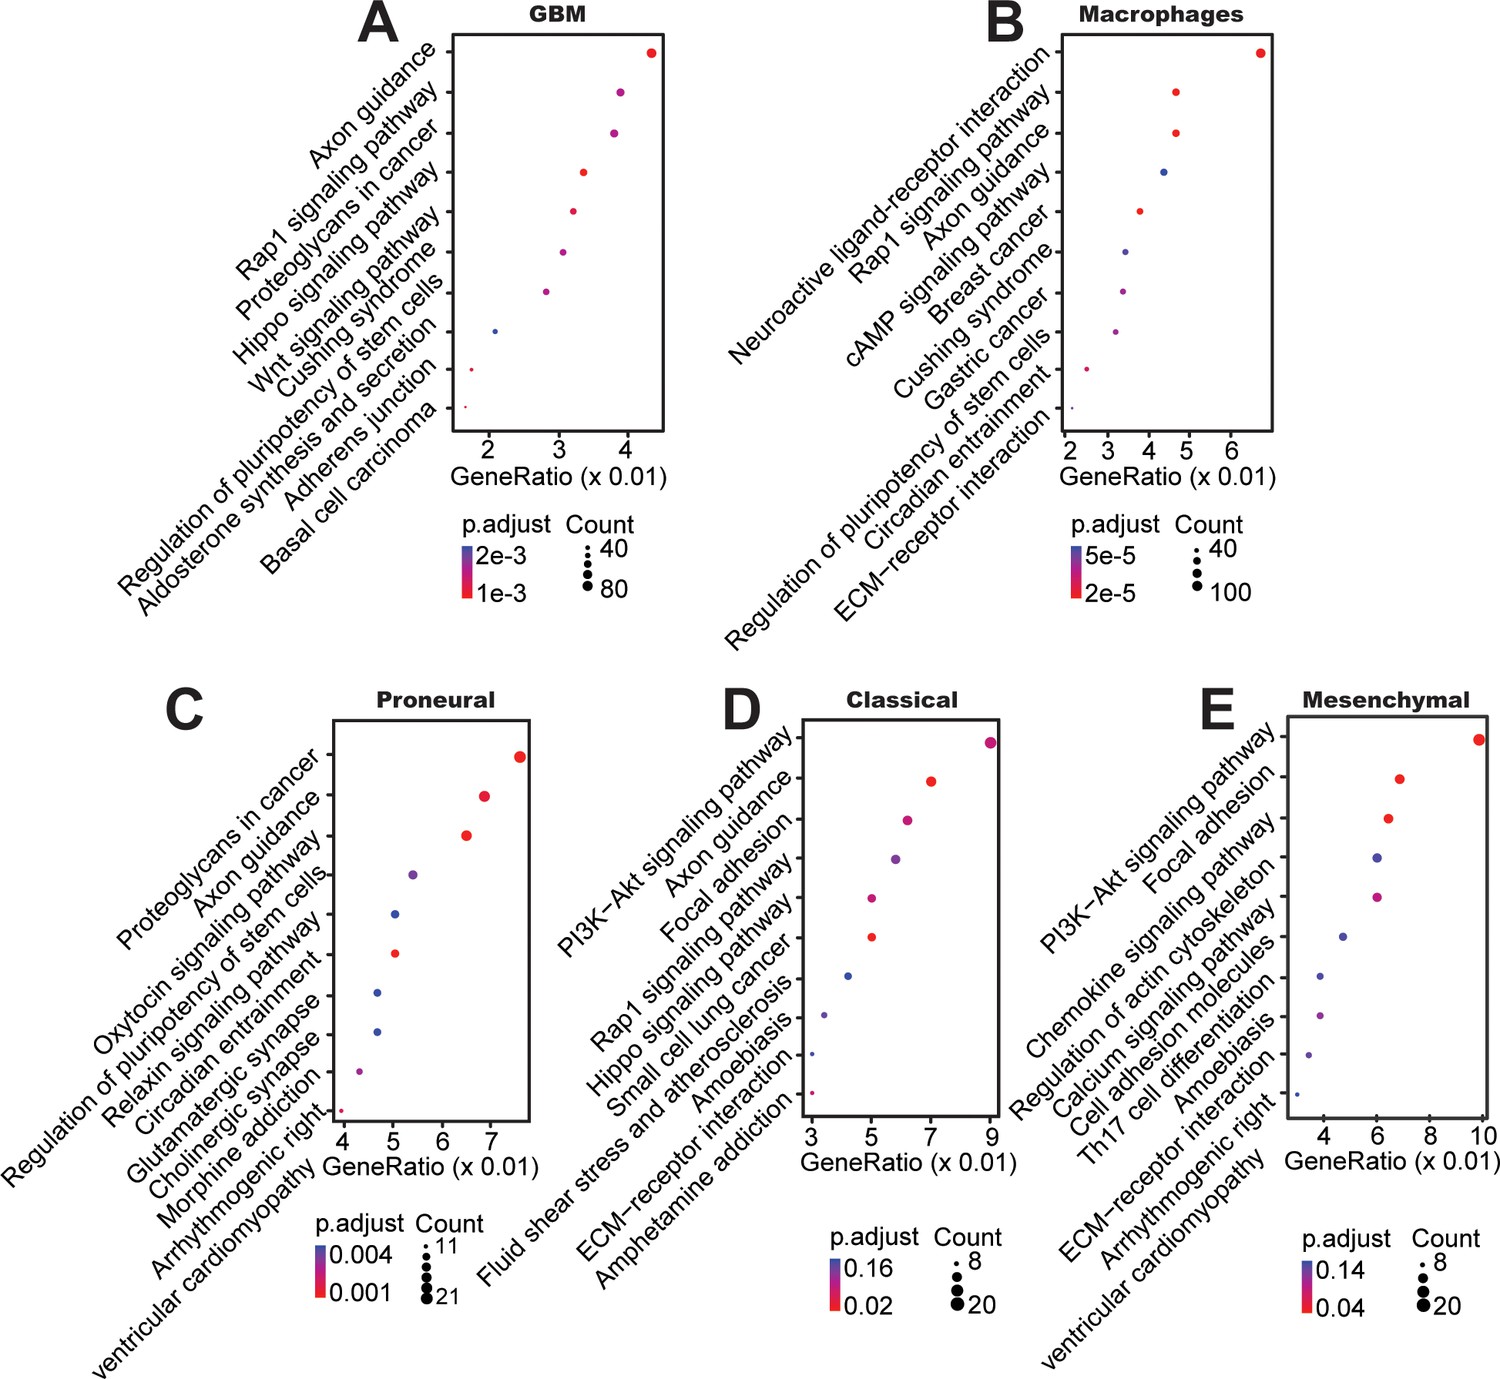
Top KEGG pathways between mono-cultured and co-cultured GBM cells in a 3D brain-mimicking ECM environment.
(A) KEGG pathway analysis from whole genome DNA methylation comparing data from all glioma subtypes co-cultured with macrophages vs all mono-cultured glioma subtypes including PN (GBML20), CL (GBML08), and MES (GBML91) showing activation of pathways involved in axon guidance, Rap1, proteoglycans, and Wnt related signaling. (B) KEGG pathway analysis of macrophages co-cultured with all different types of GBM cells compared with mono-cultured macrophages showed relatively activation of pathways in neuroactive ligand-receptor, Rap1, axon guidance, cAMP related signaling. When DNA methylation data were analyzed for each molecular subtype of GBM, (C) co-cultured PN (GBML20) GBM cells showed relatively higher ratios of genes in proteoglycans, axon guidance, oxytocin, and pluripotency of stem cell related signaling compared to mono-cultured GBM cells, (D) co-cultured CL (GBML08) GBM cells showed relatively higher ratios of genes in PI3K−Akt, axon guidance, focal adhesion, and Rap1-related signaling pathways compared to mono-cultured GBM cells, and (E) co-cultured MES (GBML91) GBM cells showed relatively higher ratios of genes in PI3K−Akt, focal adhesion, chemokine, and actin-related signaling pathways compared to mono-cultured GBM cells.
Figure 4—figure supplement 2
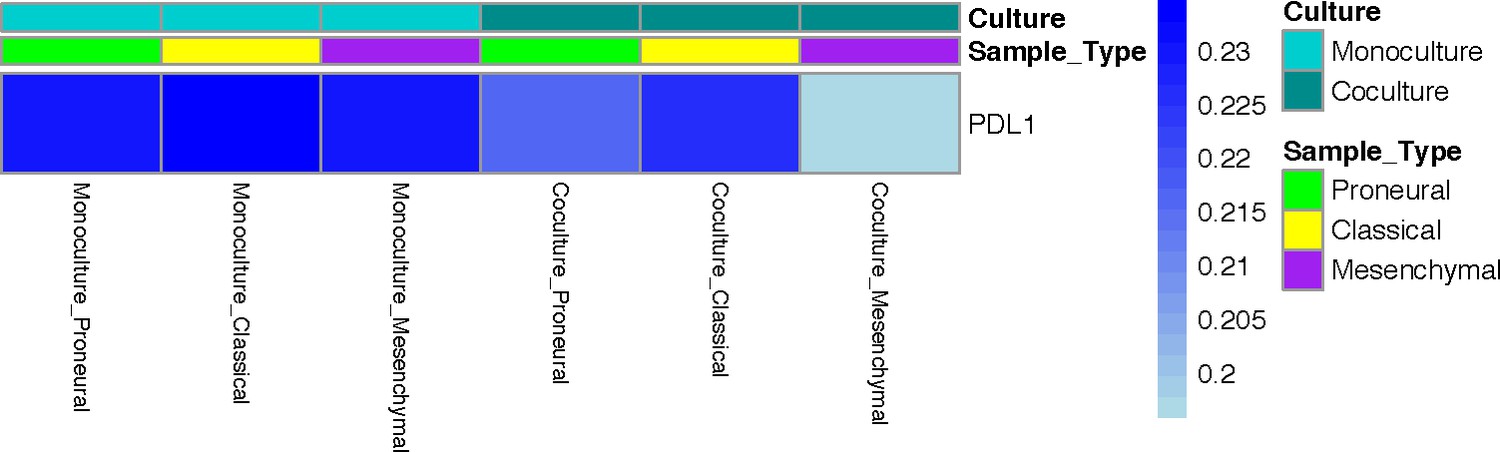
PD-L1 promoter methylation in mono-cultured and co-cultured GBM cells in a 3D brain-mimicking ECM environment.
The absence or presence of macrophages does not induce changes in methylation of the PD-L1 gene promoter.
Figure 4—figure supplement 3
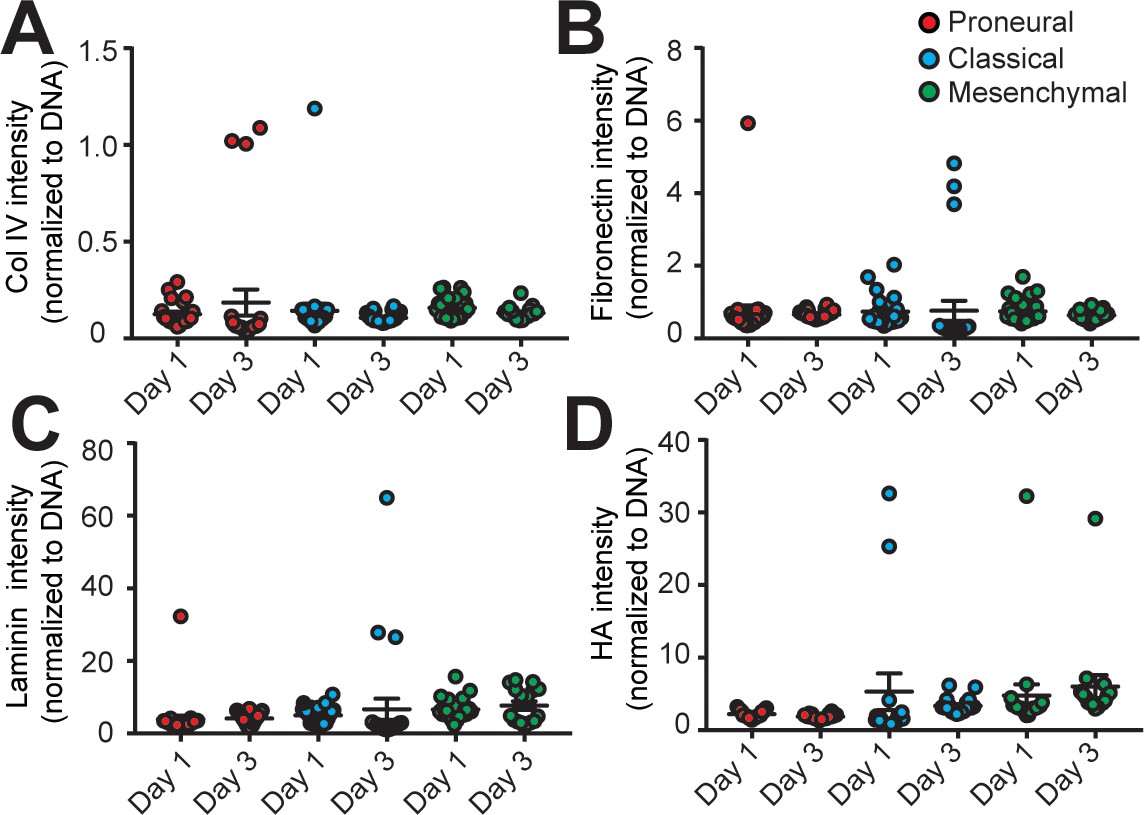
Analysis of extracellular matrix composition in different engineered GBM niches.
The quantified results of (A) Collagen IV (Col IV), (B) Fibronectin, (C) Laminin, and (D) hyaluronic acid (HA) depositions in the MES (GBML91), CL (GBML08) and PN (GBML20) GBM niches showed no significant changes in the 3-day culture period. Error bars represent ± s.e.m.
Figure 5 with 4 supplements
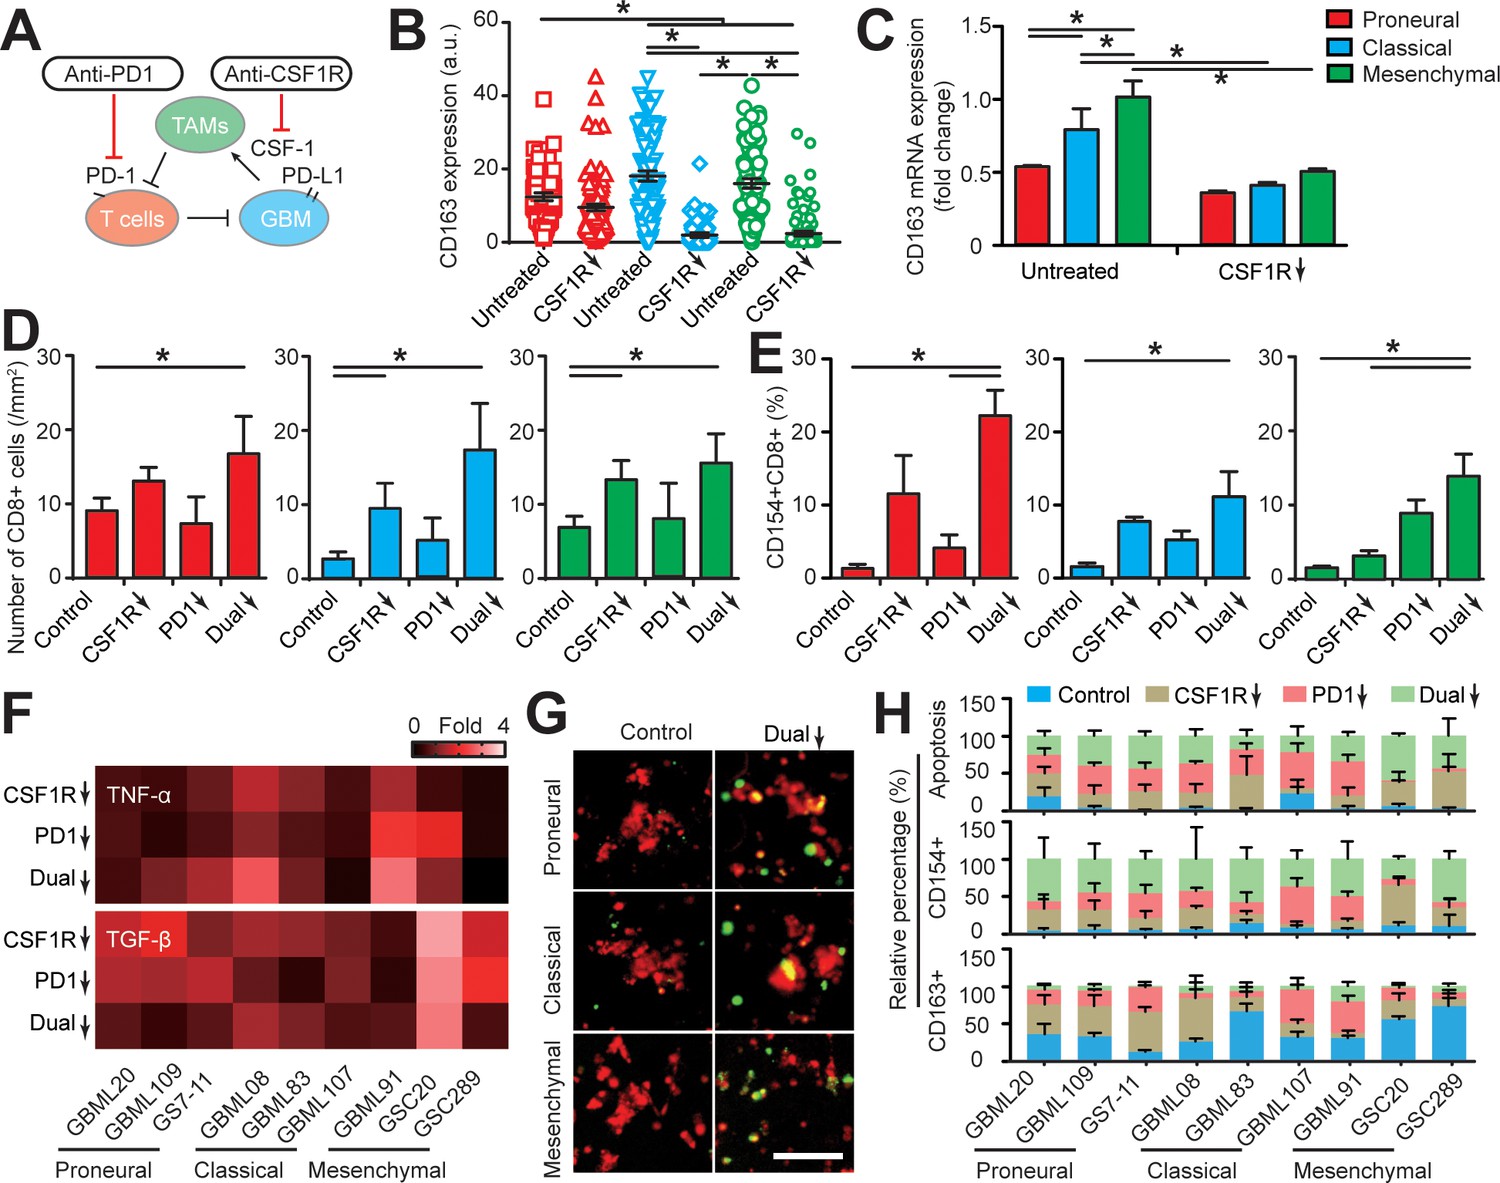
Targeting TAM with anti-CSF-1R blockade improves anti-PD-1 immunotherapy response in GBM-on-a-Chip.
(A) A schematic outlining a dual inhibition therapeutic strategy for targeting both PD-1/PD-L1 and TAM CSF/CSF-1R signaling to inhibit the systemic immunosuppression among GBM, TAM and CD8+ T-cell. (B) Quantified M2-like marker CD163 expression on TAM in response to CSF-1R inhibitor BLZ945 in different GBM subtypes (GBML20, GBML08, and GBML91), showing the limited expression of CD163 in all GBM subtypes. (C) qPCR experiment confirming the inhibition of CD163 expression in TAM with the administration of CSF-1R inhibitor BLZ945. (D) Quantified results showing more infiltrated allogeneic CD8+ T-cells in all GBM subtypes (GBML20, GBML08, and GBML91) with PD-1 and CSF-1R dual inhibition therapy as compared to Nivolumab and BLZ945 monotherapy. (E) Quantified results showing an increased influx of activated CD154+CD8+ T-cells in PD-1 and CSF-1R dual inhibition therapy as compared to Nivolumab monotherapy. (F) Quantified cytokine levels showing significantly increased expression of pro-inflammatory cytokine (TNF-α) and decreased expression of immunosuppressive cytokine (TGF-β1) in most GBM subtypes with dual inhibition therapy. Fold changes were calculated relative to control. Note the patient-specific responses with different pharmacological treatment. (G) Representative apoptosis images showing more apoptotic (green nuclei) GBM cells with co-blockade of PD-1 and CSF-1R relative to control in all GBM subtypes (GBML20, GBML08, and GBML91). Live GBM cells were stained with CellTracker Red (red color). (H) A therapeutic response summary of the heterogeneous and systemic immunosuppression in nine lines of GBM patients’ derived cells using GBM-on-a-Chip for relative percentages of GBM cell apotosis, CD154+CD8+ (%) and CD163+CD68+ (%) cell populations. 100% stacked bar chart was used to show the relative difference among distinct drug treatments. CSF-1R inhibitor BLZ945 (0.1 μg/ml) and PD-1 blockade nivolumab (1 μg/ml) were used in all the monotherapy or dual inhibition treatments. All control groups were treated with fresh cell culture media supplemented with DMSO (0.01%) and human IgG4 isotype control antibody (1 µg/mL, BioLegend). Error bars represent ± s.e.m. from three independent experiments. n > 80 in (B), (D), (E), and (H). P-values were calculated using the Student’s paired sample t-test or one-way ANOVA. *, p<0.05.
Figure 5—figure supplement 1
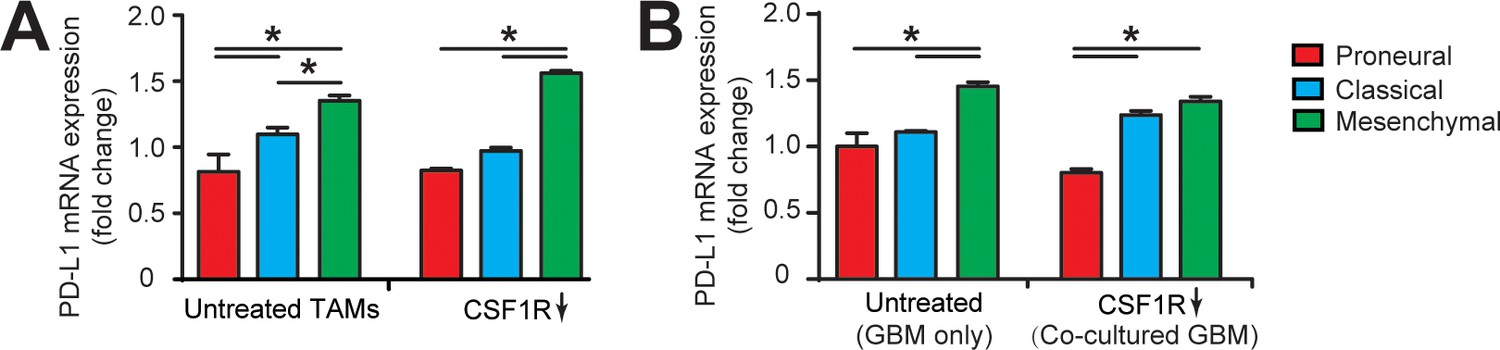
qPCR analysis showing different immunosuppression in TAM and GBM cell.
(A) mRNA expression of PD-L1 in GBM-educated TAMs with or without CSF1R inhibition using BLZ945 (0.1 μg/ml). Noted the higher expression in the MES (GBML91) educated TAM relative to the CL (GBML08) and PN (GBML20) educated TAMs. (B) mRNA expression of PD-L1 in GBM cell. Mono-cultured MES (GBML91) GBM expressed more PD-L1 as compared to CL (GBML08) and PN (GBML20) GBMs, which is consistent with the co-cultured GBMs with TAM. Note that CSF-1R inhibition using BLZ945 did not change the PD-L1 expression in GBM cells. Error bars represent ± s.e.m. p-Values were calculated using one-way ANOVA. *, p<0.05.
Figure 5—figure supplement 2
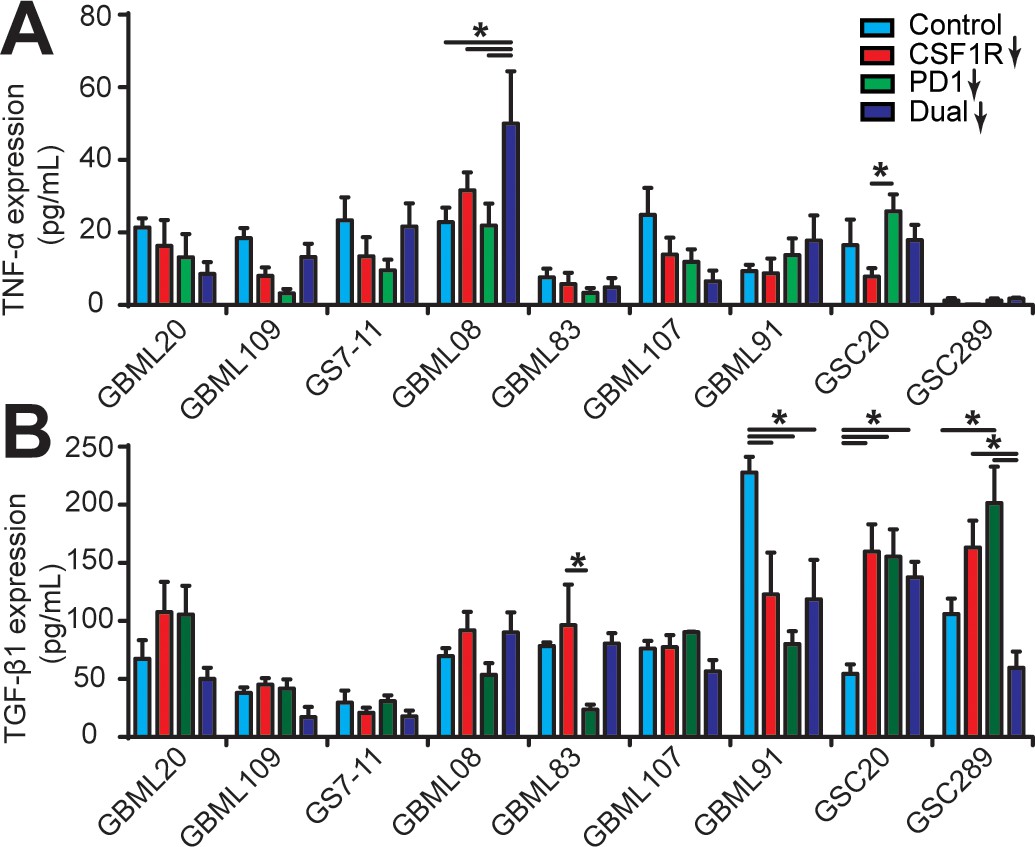
Cytokine conditions in different patient-derived GBM cell constructed microenvironments.
(A) TNF-α and (B) TGF-β1 concentrations in different GBM microenvironments with single blockade of CSF-1R, PD-1, and co-blockade of PD-1 and CSF-1R. CSF-1R inhibitor BLZ945 (0.1 μg/ml) and PD-1 blockade nivolumab (1 μg/ml) were used in the monotherapy or dual inhibition treatments. Control groups were treated with fresh cell culture media supplemented with DMSO (0.01%) and human IgG4 isotype control antibody (1 µg/mL, BioLegend). Error bars represent ± s.e.m. p-Values were calculated using two-way ANOVA. *, p<0.05.
Figure 5—figure supplement 3
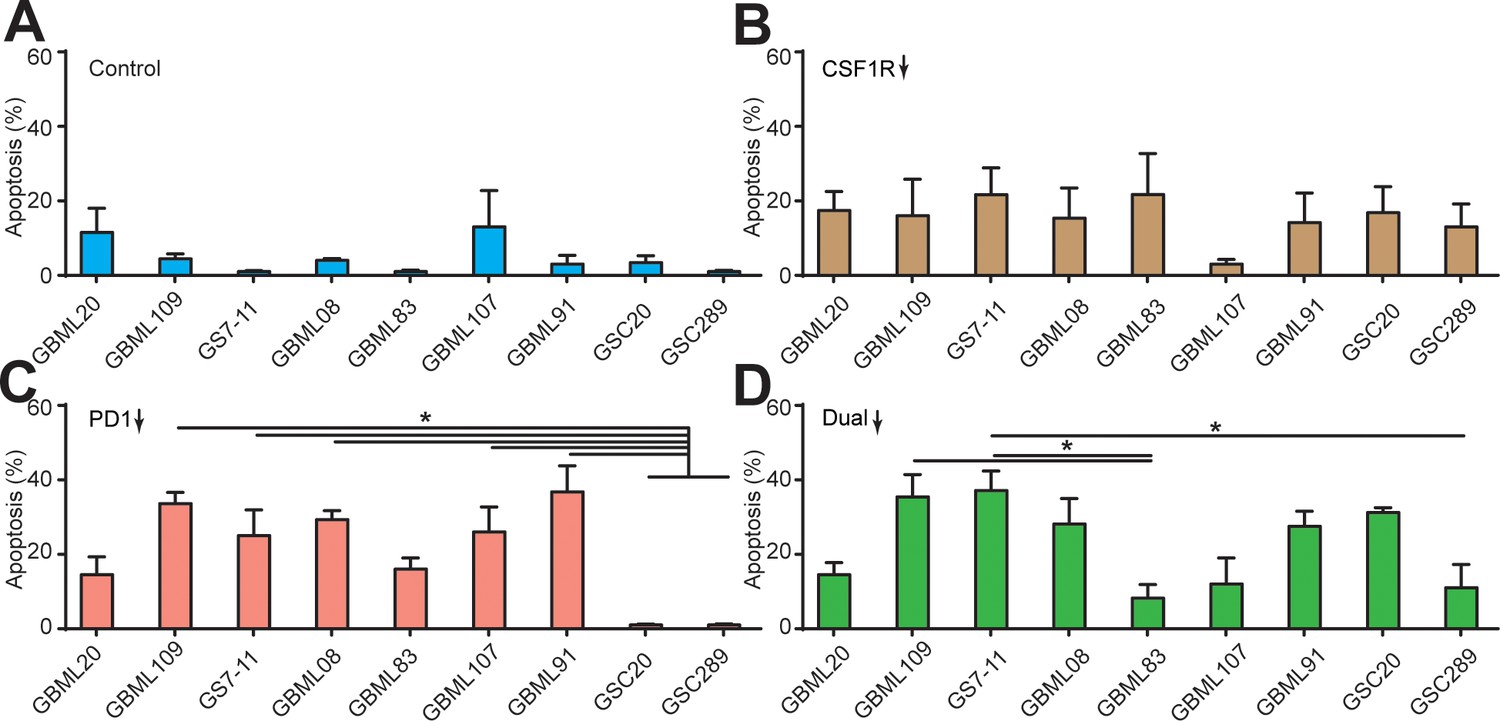
Apoptosis ratios of GBM cells under different drug treatments.
Quantified apoptosis ratios in (A) control group, (B) BLZ945-treated group, (C) PD-1 blockage group, and (D) dual inhibition therapy of nine patient-derived GBM lines. CSF-1R inhibitor BLZ945 (0.1 μg/ml) and PD-1 blockade nivolumab (1 μg/ml) were used in the monotherapy or dual inhibition treatments. Control groups were treated with fresh cell culture media supplemented with DMSO (0.01%) and human IgG4 isotype control antibody (1 µg/mL, BioLegend). Error bars represent ± s.e.m. p-Values were calculated using one-way ANOVA. *, p<0.05.
Figure 5—figure supplement 4
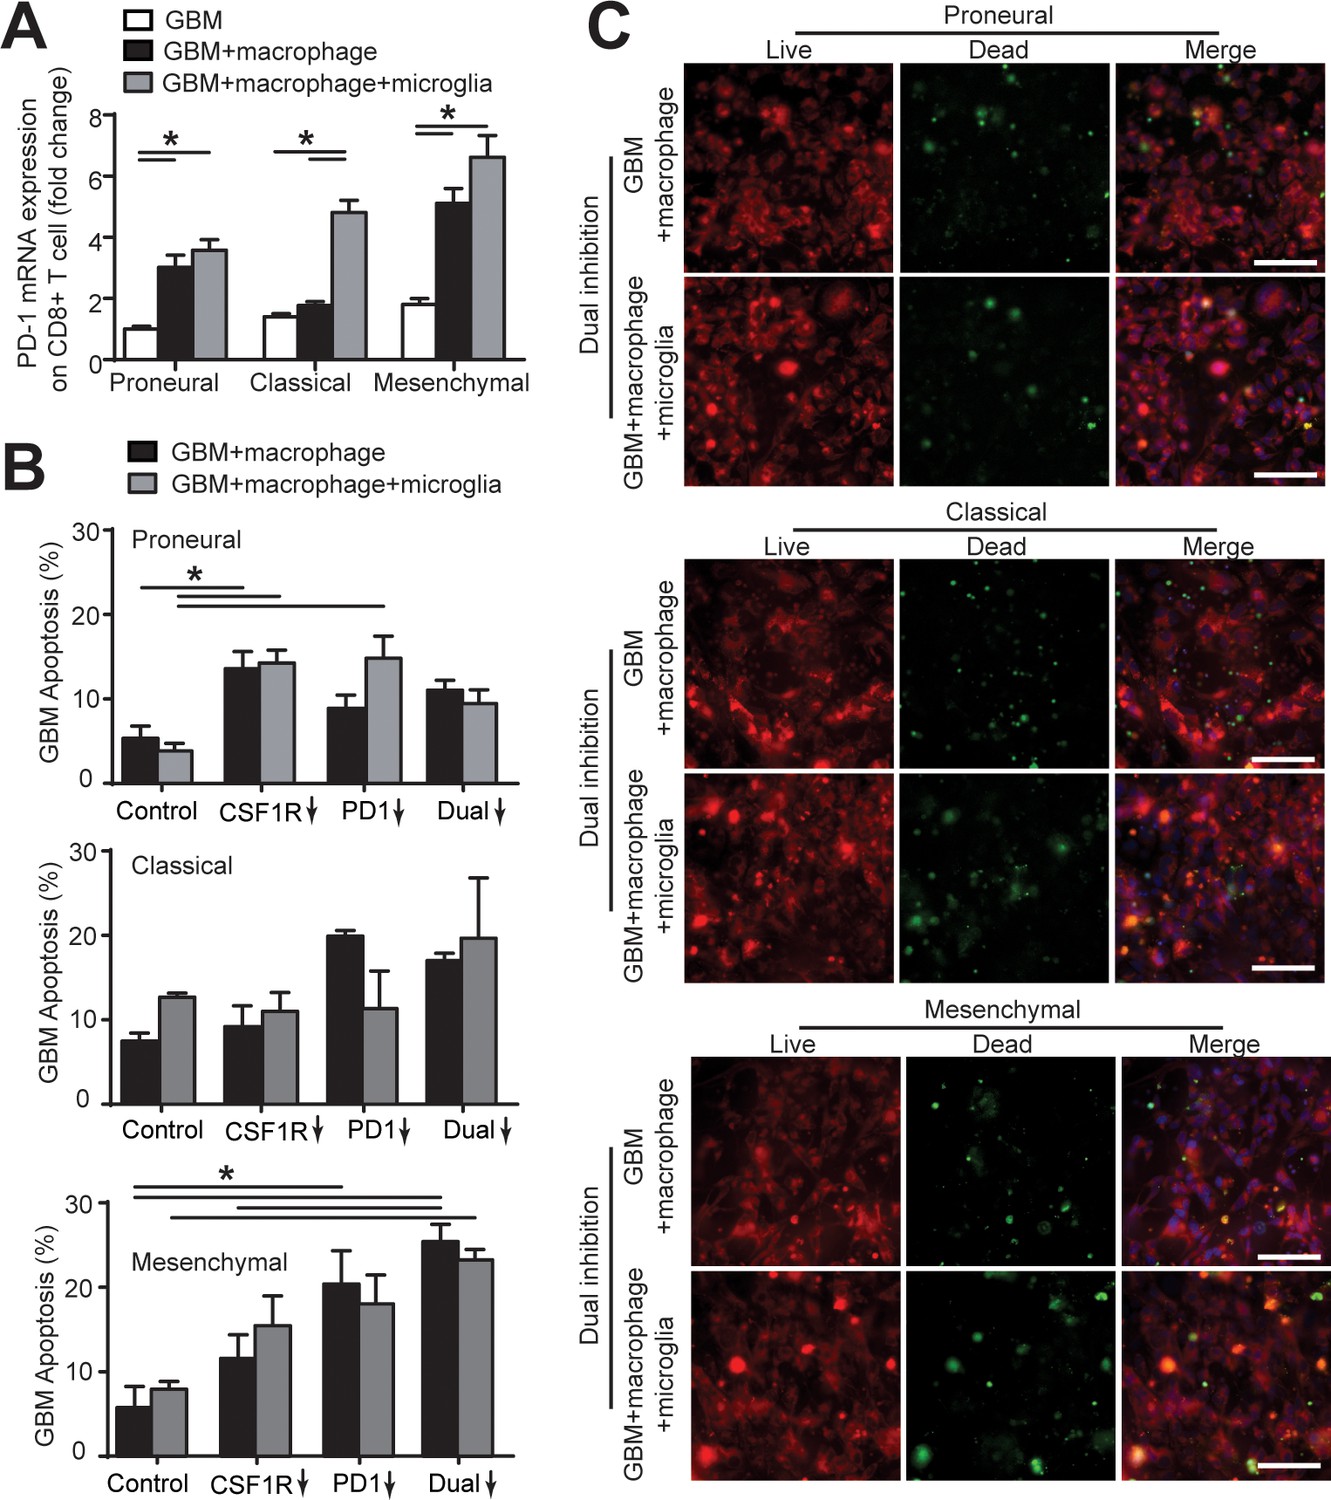
Microglia affect CD8+ T-cell PD-1 expression and GBM cell apoptosis.
(A) mRNA expression of PD-1 in CD8+ T-cell in the PN (GBML20), CL (GBML08), and MES (GBML91) GBM niches. Of note, PD-1 expression in CD8+ T-cell co-cultured with GBM, PBMC-derived macrophages and brain-resident microglia was higher than that of those CD8+ T-cells co-cultured with GBM only or GBM and macrophages. (B) Quantified GBM cell apoptosis with the presence or absence of microglia cells in the PN (GBML20), CL (GBML08), and MES (GBML91) GBM microenvironments with CSF-1R inhibitor BLZ945 (0.1 μg/ml), PD-1 blockade nivolumab (1 μg/ml) monotherapy or dual inhibition treatment. Control groups were treated with fresh cell culture media supplemented with DMSO (0.01%) and human IgG4 isotype control antibody (1 µg/mL, BioLegend). These results with the presence of microglia showed no significant difference with the GBM and macrophage only condition. (C) Representative images showing GBM cell apoptosis (green) with or without the presence of microglia cells in the PN (GBML20), CL (GBML08), and MES (GBML91) GBM microenvironments under dual blockages of CSF-1R and PD-1. Scale bar is 100 μm. Error bars represent ± s.e.m. p-Values were calculated using one-way ANOVA. *, p<0.05.
Additional files
-
Supplementary file 1
Supplementary tables.
- https://cdn.elifesciences.org/articles/52253/elife-52253-supp1-v1.docx
-
Transparent reporting form
- https://cdn.elifesciences.org/articles/52253/elife-52253-transrepform-v1.docx
Download links
A two-part list of links to download the article, or parts of the article, in various formats.
Downloads (link to download the article as PDF)
Open citations (links to open the citations from this article in various online reference manager services)
Cite this article (links to download the citations from this article in formats compatible with various reference manager tools)
Dissecting the immunosuppressive tumor microenvironments in Glioblastoma-on-a-Chip for optimized PD-1 immunotherapy
eLife 9:e52253.
https://doi.org/10.7554/eLife.52253


