Small-molecule G-quadruplex stabilizers reveal a novel pathway of autophagy regulation in neurons
- The University of Texas McGovern Medical School at Houston, United States
- Institut de Chimie Moléculaire (ICMUB), UBFC Dijon, CNRS UMR6302, France
- Baylor College of Medicine, United States
- The University of Texas Graduate School of Biomedical Sciences, United States
Figures
Figure 1
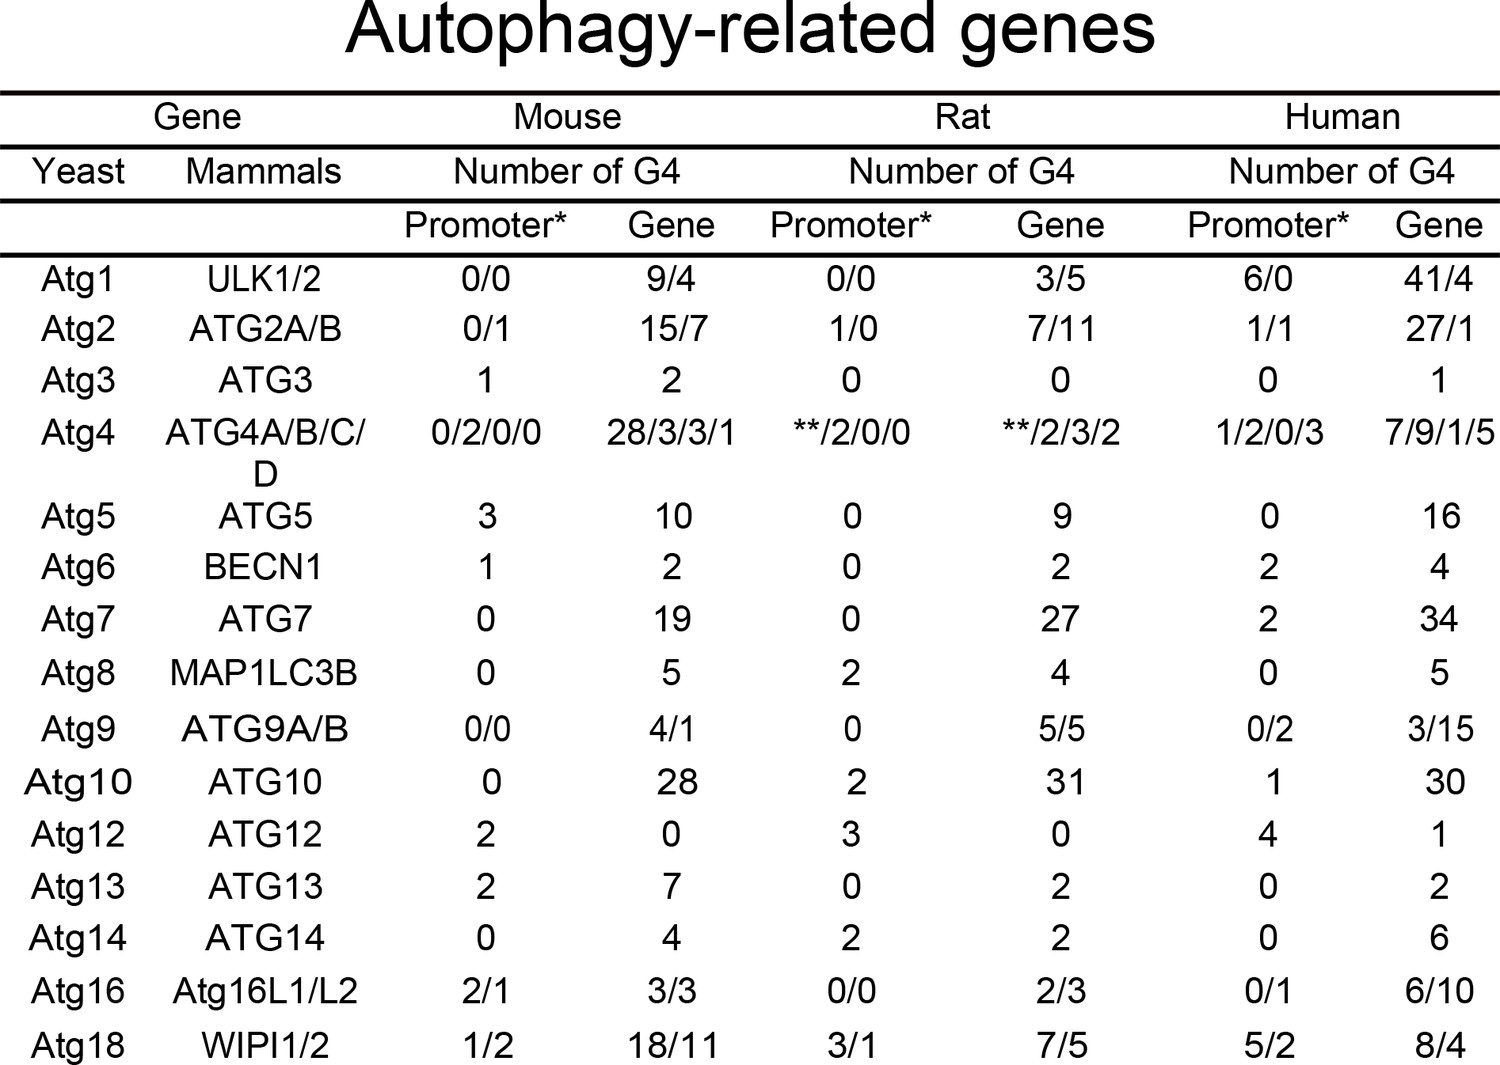
PQFS in the gene and the promoter sequence of autophagy genes.
The number of PQFS in the listed genes and their promoter were analyzed by using the QGRS mapper (http://bioinformatics.ramapo.edu/QGRS/index.php). * 5000 nucleotides upstream the gene were considered as the promoter sequence; ** Data not available.
-
Figure 1—source data 1
PQFS in the gene and the promoter sequence of autophagy genes.
- https://cdn.elifesciences.org/articles/52283/elife-52283-fig1-data1-v1.docx
Figure 2
PDS downregulates ATG7 levels in primary neurons.
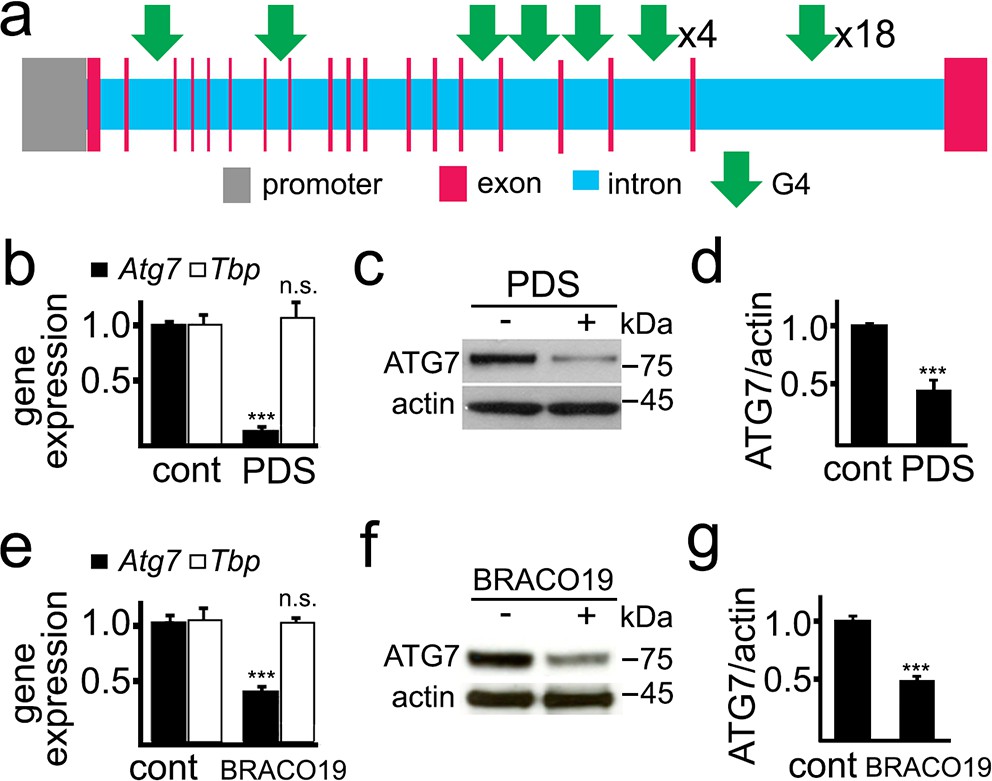
(a) A scheme of the rat Atg7 gene and its promoter showing putative G4-DNA locations. (b–d) Cultured primary neurons were treated with a vehicle (control, cont) or with PDS (2 μM) overnight. Neurons were collected and processed to measure mRNA (b) and levels of ATG7 (c,d). (b) Expression levels of Atg7 and Tbp (housekeeping protein as control) were determined by qRT-PCR. ***p(Atg7)=0.0001 (t-test). n.s., non-significant, p(Tbp)=0.426. Results were pooled from three independent experiments. (c) The protein levels of ATG7 were determined by western blotting. Actin was used as a loading control. (d) Quantification of ATG7 protein levels normalized to actin from (c). ***p=0.0001 (t-test). Results were pooled from four independent experiments. (e–g) Cultured primary neurons were treated with a vehicle (control, cont) or with BRACO19 (2 μM) overnight. Neurons were collected and processed to measure mRNA (e) and levels of ATG7 (f,g). (e) The expression of Atg7 and Tbp was determined by qRT-PCR. ***p(Atg7)=0.0001 (t-test). n.s., non-significant, p(Tbp)=0.662. Results were pooled from three independent experiments. (f) Levels of ATG7 were determined by western blotting. Actin was used as a loading control. (g) Quantification of ATG7 protein was normalized to actin from (f). ***p=0.0001 (t-test). Results were pooled from four independent experiments.
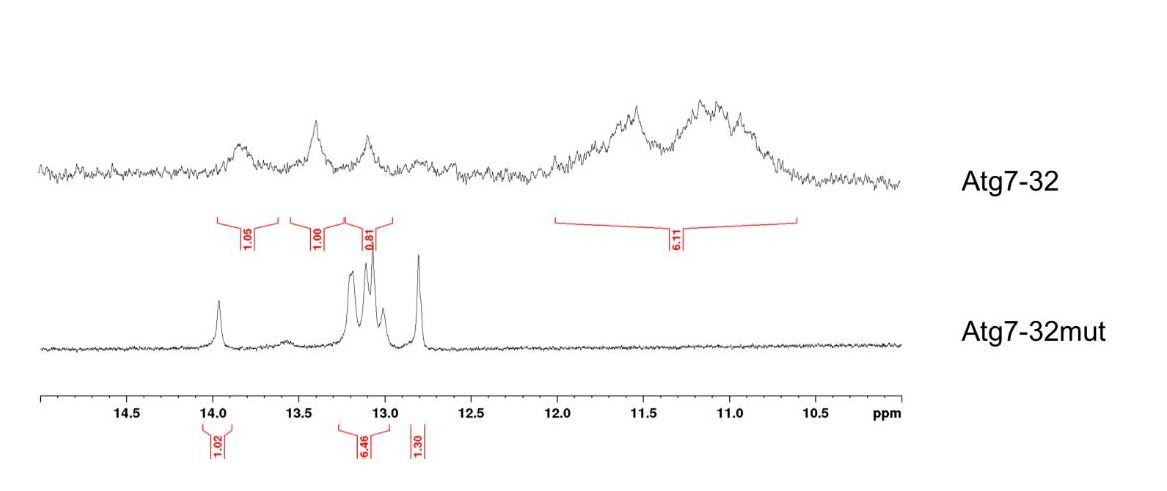
Figure 3
A PQFS in the Atg7 gene folds into a G4 structure in vitro.
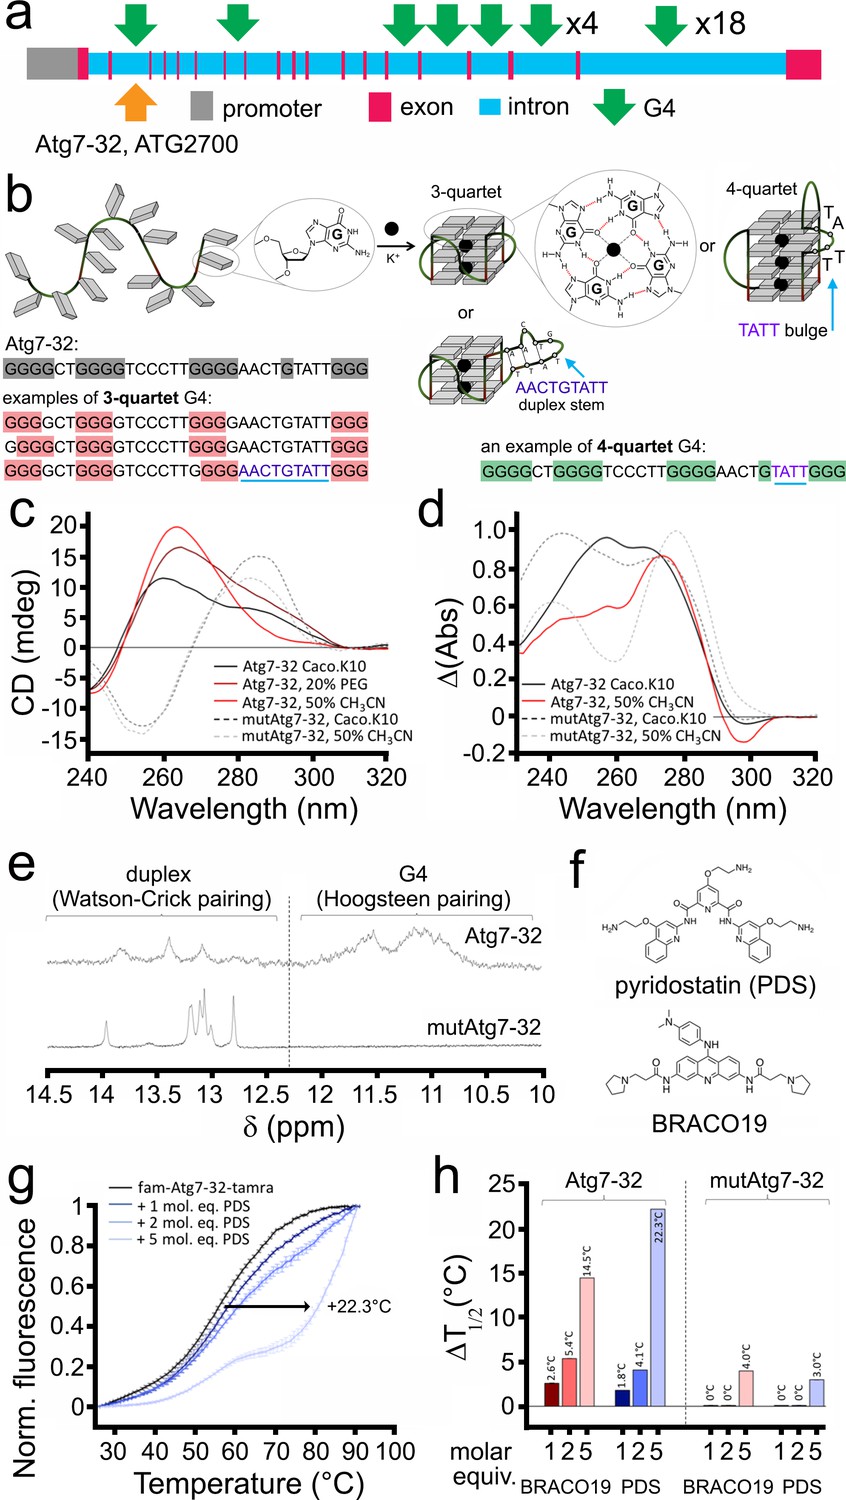
(a) Scheme of the rat Atg7 gene and its promoter showing the sequence of the Atg7-32 and ATG2700 oligonucleotides that corresponds to a putative G4-forming sequence. (b) Scheme of the G-rich sequence under its unfolded (left) and folded structures (G4-DNA, right); guanines are shown as gray squares, with detailed chemical structures of guanine (left) and G-quartets (right). Atg7-32 may fold into multiple conformations that include both 3- and 4-G-quartet G4s with both short (2-nt) and long (9-nt) hairpin-forming loops. An equilibrium between all these various topologies is illustrated by the complex signatures generated with CD, TDS and NMR (see c–e). (c) Circular dichroism (CD) generated from 3 μM Atg7-32 (plain lines) and mutAtg7-32 (dotted lines) in 10 mM lithium cacodylate buffer plus 10 mM KCl and 90 mM LiCl (Caco.K10) in absence (black lines) or presence dehydrating agent (PEG200, 20% v/v, brown line, or acetonitrile, 50% v/v, red plain line and gray dotted line for Atg7-32 and mutAtg7-32, respectively). (d) Thermal difference spectra (TDS) generated from 3 μM Atg7-32 (plain lines) and mutAtg7-32 (dotted lines) in Caco.K10 in absence (black lines) or presence of acetonitrile (50% v/v, red plain line and gray dotted line for Atg7-32 and mutAtg7-32, respectively). (e) Nuclear magnetic resonance (NMR) of 200 μM Atg7-32 (upper panel) and mutAtg7-32 (lower panel) in Caco.K10. (f) Chemical structures of PDS and BRACO19. (g–h) FRET-melting curves (g) and results (h) for experiments performed with 0.2 μM fam-Atg7-32-tamra (g,h) and fam-mutAtg7-32-tamra (h) in absence (black line) or presence of increasing concentrations of PDS (0.2–1.0 μM, blue lines), (g,h) and BRACO19 (h) in CacoK.10.
Figure 4 with 1 supplement
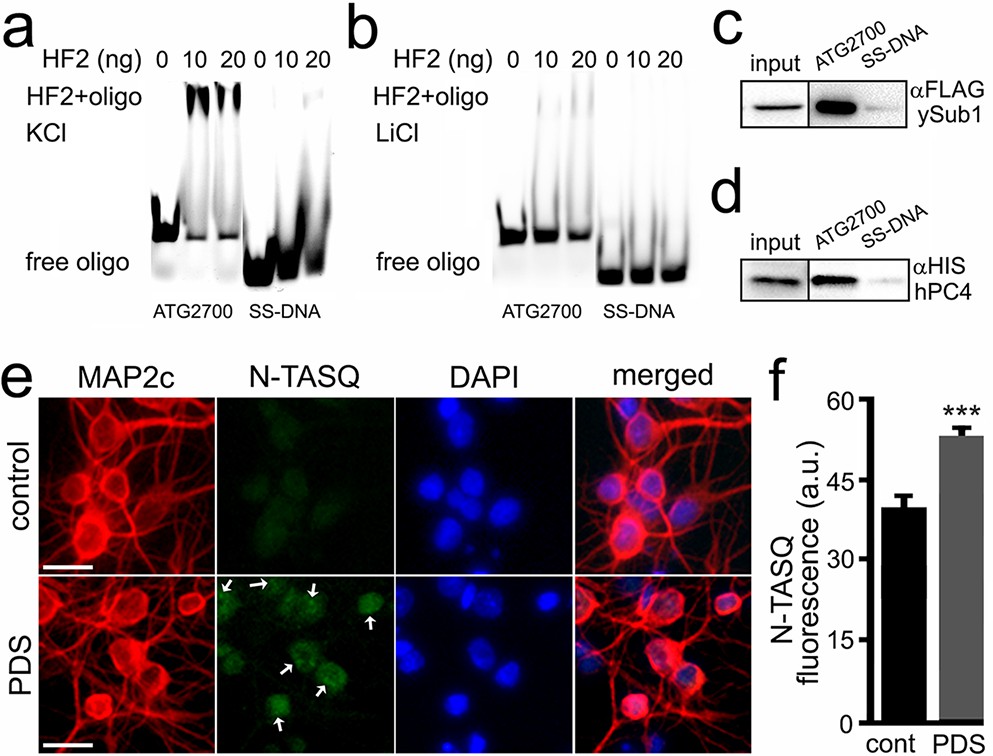
The HF2 antibody and PC4 bind to the ATG2700 oligonucleotide in vitro, and the N-TASQ probe detects G4-DNA in vivo.
(a–b) Cy5-conjugated ATG2700 and SS-DNA (a negative control) oligonucleotides were heat-denatured and then slow-cooled in the presence of K+ (KCl) or Li+ (LiCl) to allow the formation of a secondary structure. 1.5 pmoles of each oligonucleotides (oligo) and 0 (a buffer alone), 10 or 20 ng of the HF2 antibody were incubated in a buffer, which contained 100 mM KCl (a) or 100 mM LiCl (b). Note in (a) that the bands at the top of the gel correspond to the ATG2700 oligonucleotide bound to the HF2 antibody in samples incubated with a buffer containing KCl. However, note in (b) that the gel lacks of bands at the top. (c–d) Yeast were transformed with a DNA construct that express yeast Sub1-FLAG (c) or with a DNA construct that express human PC4-HIS (d). Yeast were collected and lysed, and extracts were incubated with ATG2700 or SS-DNA (negative control) oligonucleotides. Immunoprecipitates were immobilized with agarose beads, and protein complexes were then run in a gel and analyzed by western blotting with antibodies against FLAG (c) or antibodies against HIS (d). (e) Cultured primary neurons were treated with a vehicle (control, cont) or with PDS (2 μM) overnight. Cells were fixed and stained with N-TASQ (50 μM), with antibodies against MAP2c, and with the nuclear dye Hoechst (DAPI). White arrows depict N-TASQ-positive puncta. Scale bar, 10 µm (f) N-TASQ fluorescence intensities were analyzed from (e). ***p(cont vs PDS)=0.0001 (t-test). For each experiment, 200 neurons were analyzed, and results were pooled from three independent experiments.
Figure 4—figure supplement 1
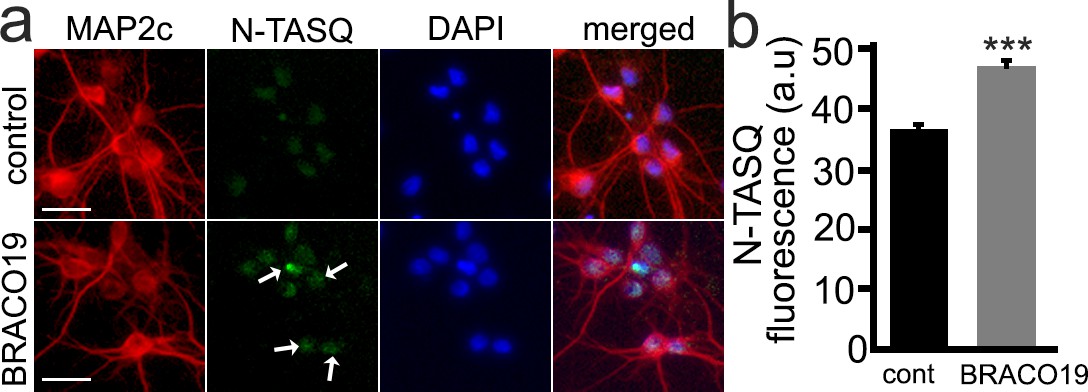
BRACO19 changes a G4 landscape in cultured primary neurons.
(a) Cultured primary cortical neurons were treated with a vehicle (control, cont) or with BRACO19 (2 μM) overnight. Cells were fixed and stained with N-TASQ (50 μM) with antibodies against MAP2c, and the nuclear dye Hoechst (DAPI). White arrows depict N-TASQ-positive puncta in neurons treated with BRACO19. Scale bar, 20 µm. (b) N-TASQ fluorescence intensity was analyzed from (a). For each experiment, 200 neurons were analyzed, and results were pooled from three independent experiments. ***p=0.0001 (t-test).
Figure 5 with 3 supplements

PDS inhibits autophagy in cultured primary neurons.
(a) The photoswitchable protein Dendra2 is commonly used to measure the half-life of a protein of interest. A brief irradiation with short-wavelength visible light induces an irreversible conformational change (‘photoswitch’, indicated by a blue arrow) in Dendra2. Photoswitched Dendra2 emits red fluorescence that can be tracked overtime with an automated microscope. Scale bar, 10 µm. (b) Dendra2 was fused to LC3, an autophagy marker, to measure autophagy flux. Two cohorts of primary neurons were co-transfected with Dendra2-LC3 and an empty plasmid, or with Dendra2-LC3 and untagged beclin1 (Becn1, as a positive control). Neurons co-transfected with Dendra2-LC3 and an empty plasmid were treated with a vehicle (control, cont), or with 0.1 µM PDS overnight. After treatment, neurons were longitudinally imaged, and the decay of the red fluorescence over time was used to calculate the half-life of Dendra2-LC3. The half-life of Dendra2-LC3 is normalized to one with respect to control neurons. *p(cont vs Becn1)=0.02, **p(cont vs PDS)=0.001, **p(Becn1 vs PDS)=0.001 (one-way ANOVA). One hundred neurons per group were analyzed from two independent experiments. (c) Cultured primary neurons were treated with a vehicle or with PDS (2 µM), in combination with the autophagy enhancer 10-NCP (NCP, 1 µM) overnight. Neurons were collected, and pellets were lysed and analyzed by western blotting with antibodies against LC3-II and against actin. (d) Quantification of LC3-II levels normalized to actin from (c). **p(cont vs NCP+PDS)=0.008, ***p(cont vs NCP)=0.0001, ***p(NCP vs NCP+PDS)=0.0002 (one-way ANOVA). Results were pooled from four independent experiments. (e) Dendra2 was fused to Httex1-Q46, an autophagy substrate, to measure autophagy flux. Two cohorts of primary neurons were transfected with Dendra2- Httex1-Q46. 24 hr after transfection, neurons were treated with a vehicle (control, cont), or with PDS (0.1 µM), and longitudinally imaged. The decay of the red fluorescence over time was used to calculate the half-life of Dendra2- Httex1-Q46. The half-life of Dendra2- Httex1-Q46 is normalized to one with respect to control neurons. **p(cont vs PDS)=0.0064 (t-test). Fifty neurons per group were analyzed from two independent experiments. (f) Fluorescence images of a neuron co-transfected with the DNA constructs TagBFP and mito-Keima. Keima is a fluorescent pH-sensitive protein used as a reporter of subcellular acidic environments. Keima emits green fluorescence in neutral environments, and emits red light in acidic environments, such as lysosomes or autolysosomes. Targeting Keima to mitochondria has been used to study a specific form of autophagy, mitophagy. Note that a white arrow depicts mitochondria in acidic compartment (red channel). (g) Two cohorts of primary neurons were transfected with mito-Keima. 24 hr after transfection, neurons were treated with a vehicle (control, cont) or with 0.1 µM PDS, and imaged 48 hr after treatment. Quantification of red fluorescence intensity of mito-Keima indicates that mitophagy is reduced in PDS-treated neurons. ***p(cont vs PDS)=0.0001, (t-test). One hundred neurons per group were analyzed from three independent experiments.
Figure 5—figure supplement 1

BRACO19 inhibits autophagy in cultured primary neurons.
(a) Cultured primary cortical neurons were treated with a vehicle or with BRACO19 (2 µM), in combination with the autophagy enhancer 10-NCP (NCP, 1 µM) overnight. Neurons were harvested and lysed, and lysates were analyzed by western blotting with antibodies raised against LC3-II and actin. (b) Quantification of LC3-II levels normalized to actin from (a). **p(cont vs NCP)=0.001, *p(NCP vs NCP+BRACO19)=0.017, n.s., non-significant, p(cont vs NCP+PDS)=0.186 (one-way ANOVA). Results were pooled from three independent experiments. (c) Two cohorts of primary neurons were transfected with the mito-Keima construct. At 24 hr after transfection, neurons were treated with vehicle (control, cont) or 0.1 µM BRACO19, and imaged 48 hr after treatment. Note that mitophagy is reduced in neurons treated with BRACO19. ***p(cont vs BRACO19)=0.0001 (t-test). For each experiments, 100 neurons per group were analyzed. Results were pooled from three independent experiments.
Figure 5—figure supplement 2
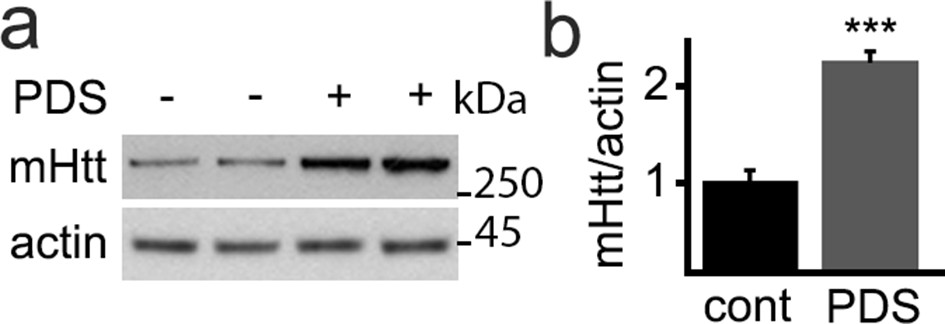
PDS induces accumulation of mutant huntingtin in cultured primary neurons from Huntington disease mice.
(a) Primary cortical neurons from newborn BACHD mouse pups were cultured and treated with a vehicle or with PDS (2 µM) overnight. Neurons were collected and analyzed by western blotting with antibodies against mutant huntingtin and actin. (b) Quantification of mutant huntingtin levels normalized to actin from (a). **p(cont vs PDS)=0.001 (t-test).
Figure 5—figure supplement 3
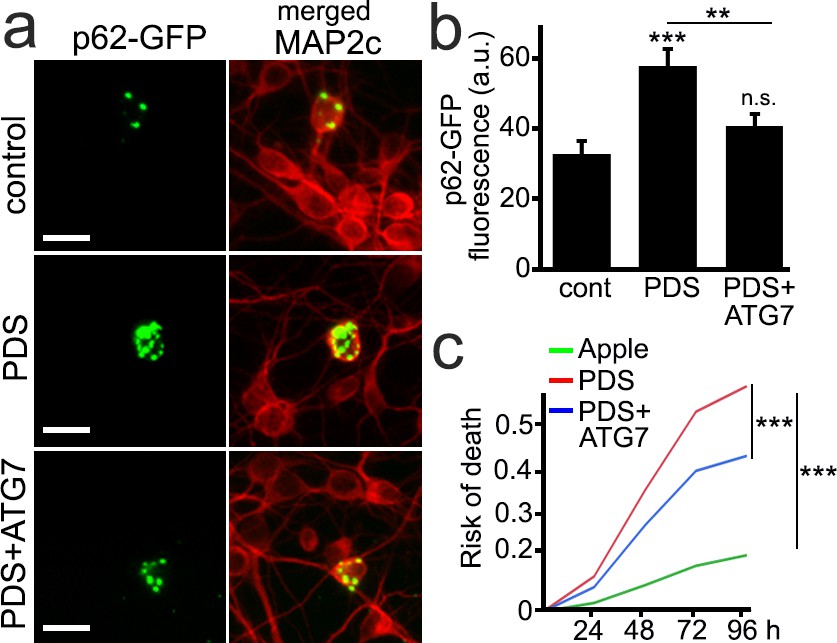
ATG7 mitigates autophagy impairment and neurotoxicity associated with PDS treatment in neurons.
(a) А cohort of primary cortical neurons was transfected with the p62-GFP and mApple constructs. Two cohorts of neurons were transfected with the p62-GFP and ATG7-mApple constructs. One cohort was treated with a vehicle, and the other cohort was treated with PDS (0.1 µM) overnight. Cells were then fixed and stained with antibodies against MAP2c (a neuronal marker). Neurons were imaged using the GFP channel to visualize p62-GFP and with the TxRed channel to visualize MAP2c. Scale bar, 10 µm. (b) Quantification of p62-GFP fluorescence intensity from (a). **p(cont vs PDS)=0.001, **p(PDS vs ATG7+PDS)=0.008, n.s., non-significant, p(cont vs ATG7+PDS)=0.15 (one-way ANOVA). 50 neurons per group were analyzed per experiment. Results were pooled from three independent experiments. (c) Two cohorts of cultured primary neurons were co-transfected with mApple (as a control construct) and GFP (as a morphology and survival marker), and the third neuronal cohort was co-transfected with ATG7-mApple (the Atg7 gene with no introns) and GFP. One cohort of neurons co-transfected with mApple and GFP (red) and the cohort expressing ATG7-mApple and GFP (blue) were treated with 0.5 μM PDS. Another cohort of neurons co-transfected with mApple and GFP was treated with a vehicle (green). Neurons were longitudinally imaged for 4 days, and risk of death was analyzed. ***p<0.001 (log-rank test). Results were pooled from three independent experiments.
Figure 6
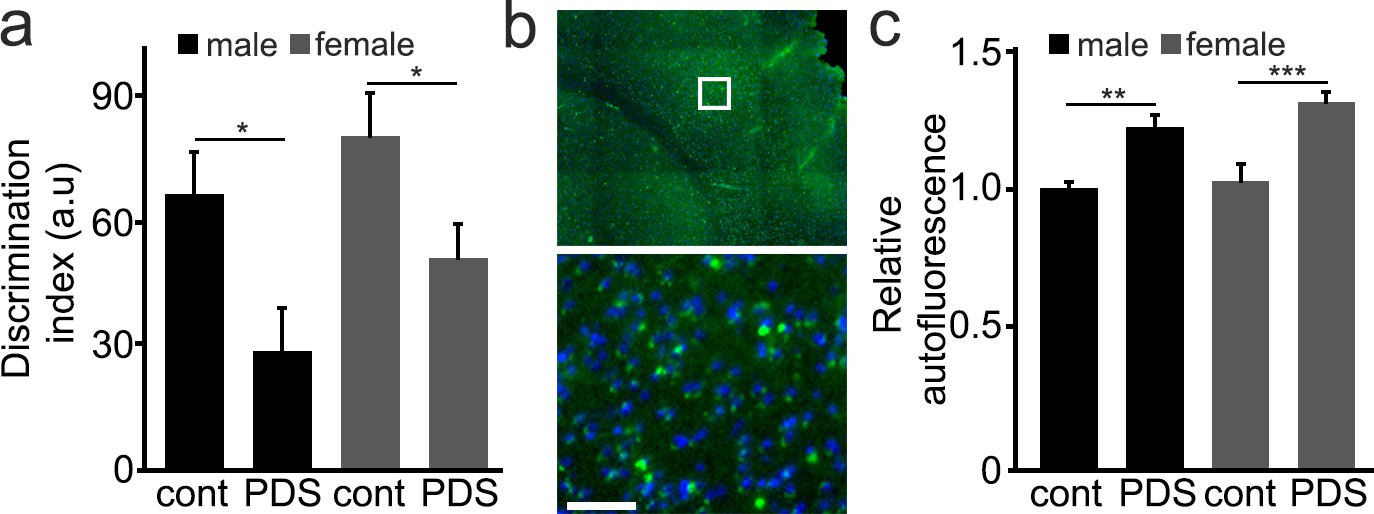
Mice treated with PDS develop memory deficits and aged-related symptoms.
(a) 25-month-old male and female mice were intraperitoneally injected with a solution of a vehicle in PBS (control, cont) or with a solution of PDS in PBS (5 mg/kg, PDS) once a week for 8 weeks. After treatment, mice were tested for short-term memory in the novel object recognition test and discrimination index (DI) was calculated. *p-value(male-cont vs PDS)=0.0265, *p-value(female-cont vs PDS)=0.0382, p-value(male vs female)=0.1029 (two-way ANOVA). Six mice per group were analyzed. (b) Mice were sacrificed, and their brains were analyzed for the lipofuscin autofluorescent age pigment. (c) Quantification of autofluorescence from (c). **p-value(male-cont vs PDS)=0.0043, ***p-value(female-cont vs PDS)=0.0007, p-value(male vs female)=0.2121 (two-way ANOVA). Six mice per group were analyzed.
Figure 7
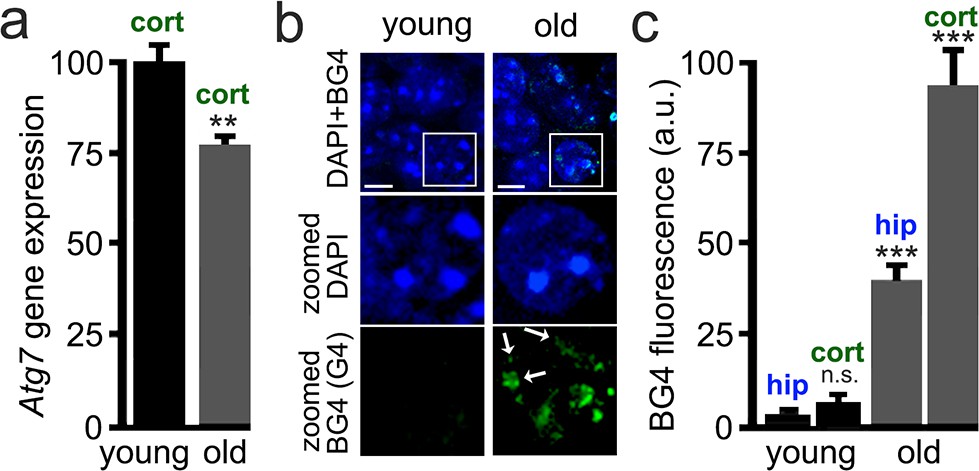
Brain samples from aged mice exhibit elevated levels of G4-DNA.
3-month-old (young) and 25-month-old (old) mice were sacrificed, and their brains were processed for RT-qPCR and immunohistochemistry analysis. (a) Cortical brain samples from young and old mice were lysed, and mRNA was extracted. mRNA samples were retro-transcribed and analyzed for expression of the Atg7 gene. **p(young vs old)=0.0011 (t-test). Six mice per group were analyzed. (b) Brain samples from young and old mice were stained with antibodies against BG4 (green channel) and the Hoechst dye (nuclei marker, blue channel), and imaged with a fluorescent microscope. In the zoomed image, white arrows depict some G-quadruplex-positive structures in the nuclei. (c) Quantification of BG4 fluorescence intensity in the hippocampus (hip) and the cortex (cort) of young and old mice. ***p(hip-young vs old)=0.0001; ***p(cor-young vs old)=0.0001. n.s., non-significant, p(young-hip vs cor)=0.35 (one-way ANOVA). Six mice per group were analyzed.
Figure 8
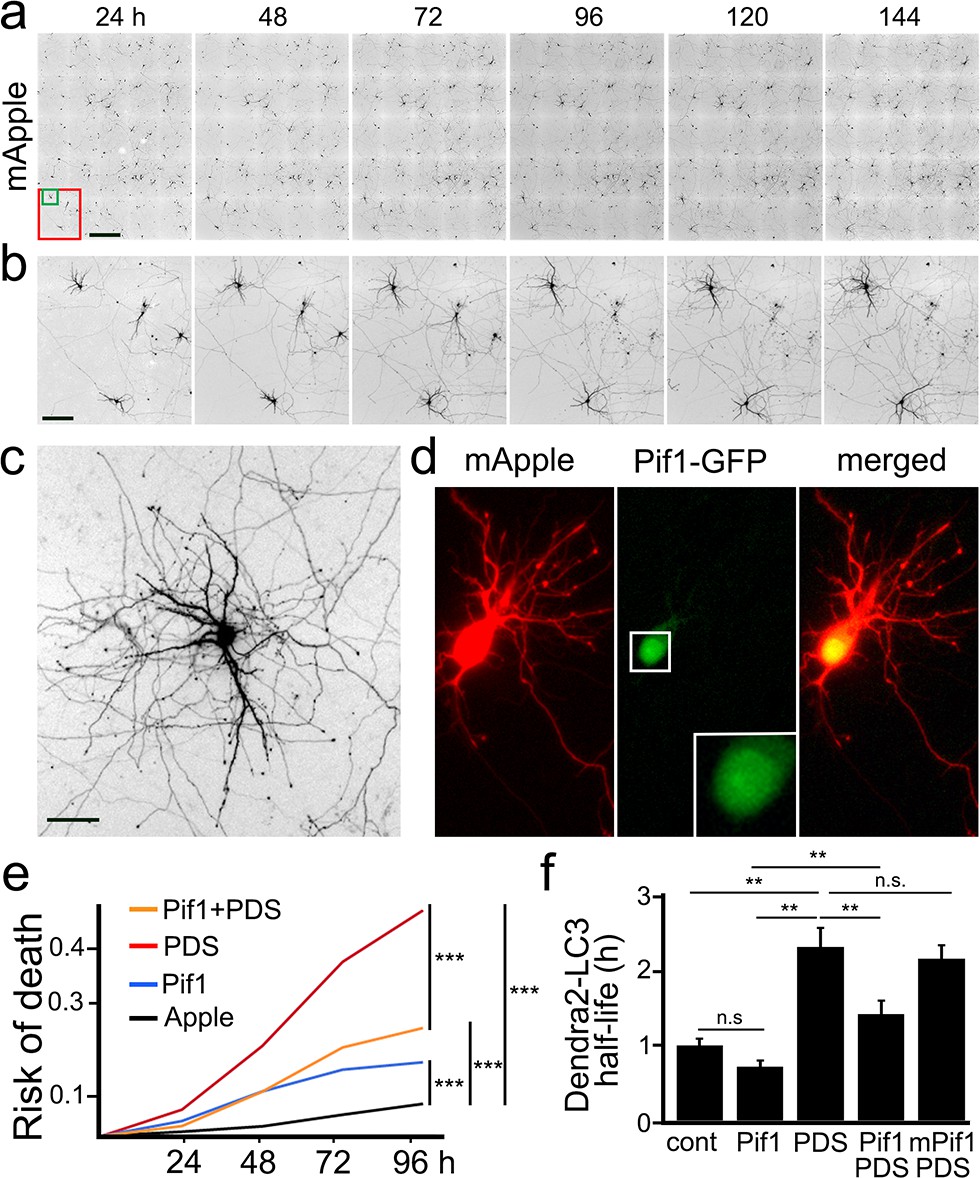
The helicase Pif1 restores autophagy in PDS-treated neurons.
(a) An example of survival analysis. Cultured primary neurons were transfected with the red fluorescent protein mApple as a marker of cell morphology and viability. Neurons were longitudinally imaged each 24 hr for 6 days with an automated microscope. Each image is a montage of 25 individual non-overlapping images. Scale bar is 400 µm. (b) Zoomed images from (a) at each time point. Images demonstrate the ability to track the same group of neurons over time, and they show the progression of neuron development (note how neurites grow in the top-left neuron), and neurodegeneration (two neurons to the right side of the images gradually lose their neurites until they die). Scale bar is 40 µm. (c) Zoomed image that shows the complex neurite arborization of a depicted neuron from (b) 144 hr after transfection. Scale bar is 20 µm. (d) An example of a neuron co-transfected with mApple (red) and Pif1-GFP (green). Note that Pif1-GFP is mostly nuclear. (e) Two cohorts of cultured primary neurons were co-transfected with mApple (as a morphology and survival marker) and GFP (as a control construct), and other two cohorts of neurons were co-transfected with mApple and Pif1-GFP. One cohort of neurons co-transfected with mApple and GFP was treated with a vehicle (Apple), and the second one with 0.5 μM PDS. Another cohort of neurons co-transfected with mApple and Pif1-GFP was treated with a vehicle (Pif1), and the second one with 0.5 μM PDS (Pif1+PDS). Neurons were longitudinally imaged during 4 days, and risks of death were analyzed. ***p=0.0001 (log-rank test). Results were pooled from three independent experiments. (f) Two cohorts of cultured primary neurons were co-transfected with Dendra2-LC3 and GFP (as a control construct), and other two cohorts of neurons were co-transfected with Dendra2-LC3 and Pif1-GFP. One cohort of neurons co-transfected with Dendra2-LC3 and GFP was treated with a vehicle (control, cont), and the second one with 0.1 μM PDS (PDS). Also, one cohort of neurons co-transfected with mApple and Pif1-GFP was treated with a vehicle (Pif1), and the second one with 0.1 μM PDS (Pif1+PDS). One last cohort of neurons was transfected with mApple and mutant Pif1-GFP and treated with PDS (mPif1+PDS). Neurons were longitudinally imaged, and the half-life of Dendra2-LC3 of each group was analyzed, and normalized to one with respect to the control group. **p(cont vs PDS)=0.001, **p(PDS vs Pif1+PDS)=0.001, p(Pif1 vs Pif1+PDS)=0.001. n.s., non-significant, p(cont vs Pif1)=0.1726, p(cont vs Pif1+PDS)=0.3239, p(PDS vs mPif+PDS)=0.4267 (one-way ANOVA). One hundred neurons per group were analyzed from two independent experiments.
Author response image 1

Two-way ANOVA, p value for control/PDS main effect is significant, p=0.0203, and the effects on male vs female is also significant, p=0.0326.
Author response image 2
Tables
Key resources table
| Reagent type (species) or resource | Designation | Source or reference | Identifiers | Additional information |
|---|---|---|---|---|
| Gene (Rattus norvegicus) | ATG7 | N/A | Gene-NCBI: ID: NC_005103.4 | |
| Strain, strain background (Mus musculus) | C57BL/6 | Jackson Laboratoy | 664 | female and male |
| Strain, strain background (Rattus norvegicus) | Long Evans | Charles River | 6 | N/A |
| Cell line (Rattus norvegicus) | primary cortical neurons | Neurons isolated from Long-Evans rat embryos (E17–18) cortices | ||
| Antibody | anti-microubule-associated protein 1 light chain three alpha (LC3; rabbit polyclonal) | MBL | #PD014 | (1:1000), overnight 4°C |
| Antibody | anti-atg7 (clone D12B11; rabbit monoclonal) | Cell Signaling | #8558 | (1:1000), overnight 4°C |
| Antibody | anti-beta actin (clone 8H10D10; mouse monoclonal) | Cell Signaling | #3700 | (1:2000), overnight 4°C |
| Antibody | anti-DYKDDDDK Tag (FLAG; clone D6W5B; rabbit polyclonal) | Cell Signaling | #2368 | (1:500), overnight 4°C |
| Antibody | anti-microtubule-associated protein-2 (MAP-2; clone A-4; mouse monoclonal) | Santa Cruz Biotechnology | #sc-74421 | (1:500), overnight 4°C |
| Antibody | anti-rabbit-HRP | EMD Millipore | #AP307P | (1:2000), overnight 4°C |
| Antibody | anti-mouse-HRP | EMD Millipore | #AP308P | (1:2000), overnight 4°C |
| Antibody | anti-mouse Alexa Fluor-488 | Life Technologies | #A11001 | (1:500), overnight 4°C |
| Antibody | anti-Huntingtin protein (Htt; clone mEM48; mouse monoclonal) | EMD Millipore | #MAB5374 | (1:1000), overnight 4°C |
| Antibody | anti-rabbit Alexa Fluor-546 | Life Technologies | #A11010 | (1:500), overnight 4°C |
| Antibody | anti-HF2 | (Lopez et al., 2017) | (1:100), overnight 4°C, prepared in Nayun Kim’s lab | |
| Antibody | anti-BG4 | (Biffi et al., 2013) | (1:100), overnight 4°C, prepared in Nayun Kim’s lab | |
| Recombinant DNA reagent | lipofectamine 2000 | Thermo Fisher Scientific | 12566014 | |
| Recombinant DNA reagent | pCAG-TagBFP | VectorBuilder | pRP[Exp]-CAG > TagBFP | |
| Recombinant DNA reagent | pCAG-EGFP-hPIF1 | VectorBuilder | pRP[Exp]-CAG > EGFP(ns): hPIF1[ORF026999] | |
| Recombinant DNA reagent | pCAG-EGFP-mutant hPIF1 | VectorBuilder | pRP[Exp]-CAG > EGFP(ns):{hPIF1[ORF026999]*(E307Q)} | |
| Recombinant DNA reagent | EF1A-mApple-ATG7 | VectorBuilder | pRFP[Exp]-EF1A > mApple(ns):mAtg7[NM_001253717.1] | |
| Recombinant DNA reagent | pSANG10-3F-BG4 | Addgene | #55756; deposited by Dr. Shankar Balasubramanian, the University of Cambridge | |
| Recombinant DNA reagent | pGW1-Dendra2-LC3 | (Tsvetkov et al., 2013b) | ||
| Recombinant DNA reagent | Httex1-Q46-Dendra2 | (Tsvetkov et al., 2013b) | ||
| Recombinant DNA reagent | pGW1-mito-Keima | other | It was cloned from the mt-mKeima/pIND(SP1) construct that we kindly received from Dr. Atsushi Miyawaki (RIKEN Brain Science Institute, Japan) | |
| Sequence-based reagent | ATG7, forward | Lone Star laboratories | 5’-TCCTGAGAGCATCCCTCTAATC-3’ | |
| Sequence-based reagent | ATG7, reverse | Lone Star laboratories | 5’- CTTCAGTTCGACACAGGTCATC-3’ | |
| Sequence-based reagent | TBP, forward | Lone Star laboratories | 5’-AGTGCCCAGCATCACTGTTT-3’ | |
| Sequence-based reagent | TBP, reverse | Lone Star laboratories | 5’-GGTCCATGACTCTCACTTTCTT-3’ | |
| Sequence-based reagent | ATG2700 | Dr. Monchaud lab. | ATTCTTGGGGCTGGGGTCCCT TGGGGAACTGTATTGGGTGAACC | |
| Sequence-based reagent | SS-DNA | Dr. Monchaud lab. | GCACGCGTATCTTTTTGGCGCAGGTG | |
| Commercial assay or kit | RNeasy Mini kit | Qiagen | 74104 | |
| Commercial assay or kit | iScript Reverse Transcription SuperMix | BioRad | 1708840 | |
| Chemical compound, drug | Pyridostatin (PDS) | Cayman Chemical | 18013 | |
| Chemical compound, drug | 10-(4′-(N-diethylamino)butyl)−2-chlorophenoxazine (10-NCP) | EMD Millipore | 925681–41 | |
| Chemical compound, drug | N-TASQ | (Laguerre et al., 2015; Laguerre et al., 2016) | synthesized by Dr. David Monchaud | |
| Software, algorithm | JMP software | SAS Institute, Houston, TX | ||
| Other | Hoechst dye | Santa Cruz Biotechnology | sc-394039 | |
| Other | poly-D-lysine | Millipore | A-003-E | |
| Other | Neurobasal Medium | Life Technologies | 21103–049 | |
| Other | B-27 | Life Technologies | 17504–044 | |
| Other | GlutaMAX | Life Technologies | 35050–061 | |
| Other | penicillin-streptomycin | Life Technologies | 15240.062 | |
| Other | HisPur Ni-NTA resin | Thermo Scientific | 88221 | |
| Other | Dynabeads | ThermoFisher Scientific | 10002D |
Additional files
Download links
A two-part list of links to download the article, or parts of the article, in various formats.
Downloads (link to download the article as PDF)
Open citations (links to open the citations from this article in various online reference manager services)
Cite this article (links to download the citations from this article in formats compatible with various reference manager tools)
Small-molecule G-quadruplex stabilizers reveal a novel pathway of autophagy regulation in neurons
eLife 9:e52283.
https://doi.org/10.7554/eLife.52283


