Fully automated, sequential focused ion beam milling for cryo-electron tomography
- Institute of Molecular Biology and Biophysics, Eidgenössische Technische Hochschule Zürich, Switzerland
- Carl Zeiss Microscopy GmbH, Zeiss Customer Center Europe, Germany
- Institute of Biochemistry, Eidgenössische Technische Hochschule Zürich, Switzerland
Figures
Figure 1 with 1 supplement

Schematic of the automated sequential cryoFIB milling workflow.
(A) FIB currents are aligned and calibrated, and the sample is loaded into the FIB-SEM instrument. (B) A target cell is identified on the grid with the SEM and FIB. (C) To correct for errors in mechanical stage movements, backlash correction of the stage is performed. The resulting stage location is saved in the stage navigator. (D) The stage is randomly moved out of position by the user. Using the saved coordinates in the stage navigator, the stage is autonomously moved back to the target. (E) The accuracy of this autonomous stage movement is determined by the user. If the target is not centered in the FIB image, backlash correction is repeated until accurate targeting is achieved (C–E). (F/F’) Rough milling, polishing and drift correction patterns are placed onto the image. Rough milling and polishing patterns are saved separately to the queue. The procedure (B–F’) is repeated to select additional targets. (G/H) Rough milling and lamellae polishing are executed automatically. (I) The grids with milled lamellae are removed and stored.
Figure 1—figure supplement 1
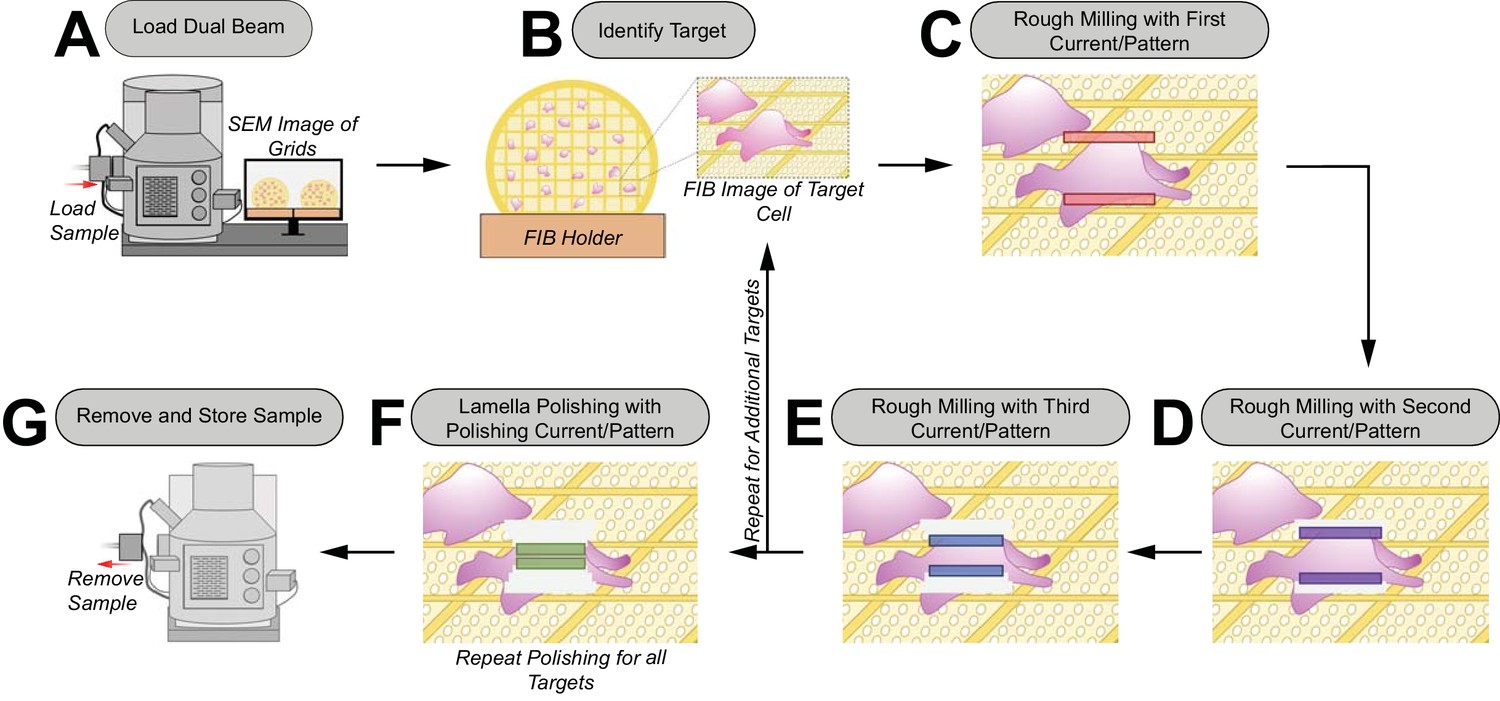
Schematic of the manual cryoFIB milling workflow.
(A) The sample is loaded into the FIB-SEM instrument. (B) A target is centered in the FIB image. (C–E ) The first pair of rough milling patterns is placed on the target and milling is executed (C). Lamellae milling is observed via a live FIB view to determine when a milling step is completed. The same procedure is repeated for the second (D) and third (E) rough milling patterns. After rough milling of the target is completed, additional targets can be milled by repeating steps (B–E). (F) Rough-milled lamellae are polished with a fourth set of milling patterns. Polishing is repeated for all rough-milled lamellae. (G) The grids with milled lamellae are removed and stored.
Figure 2 with 2 supplements
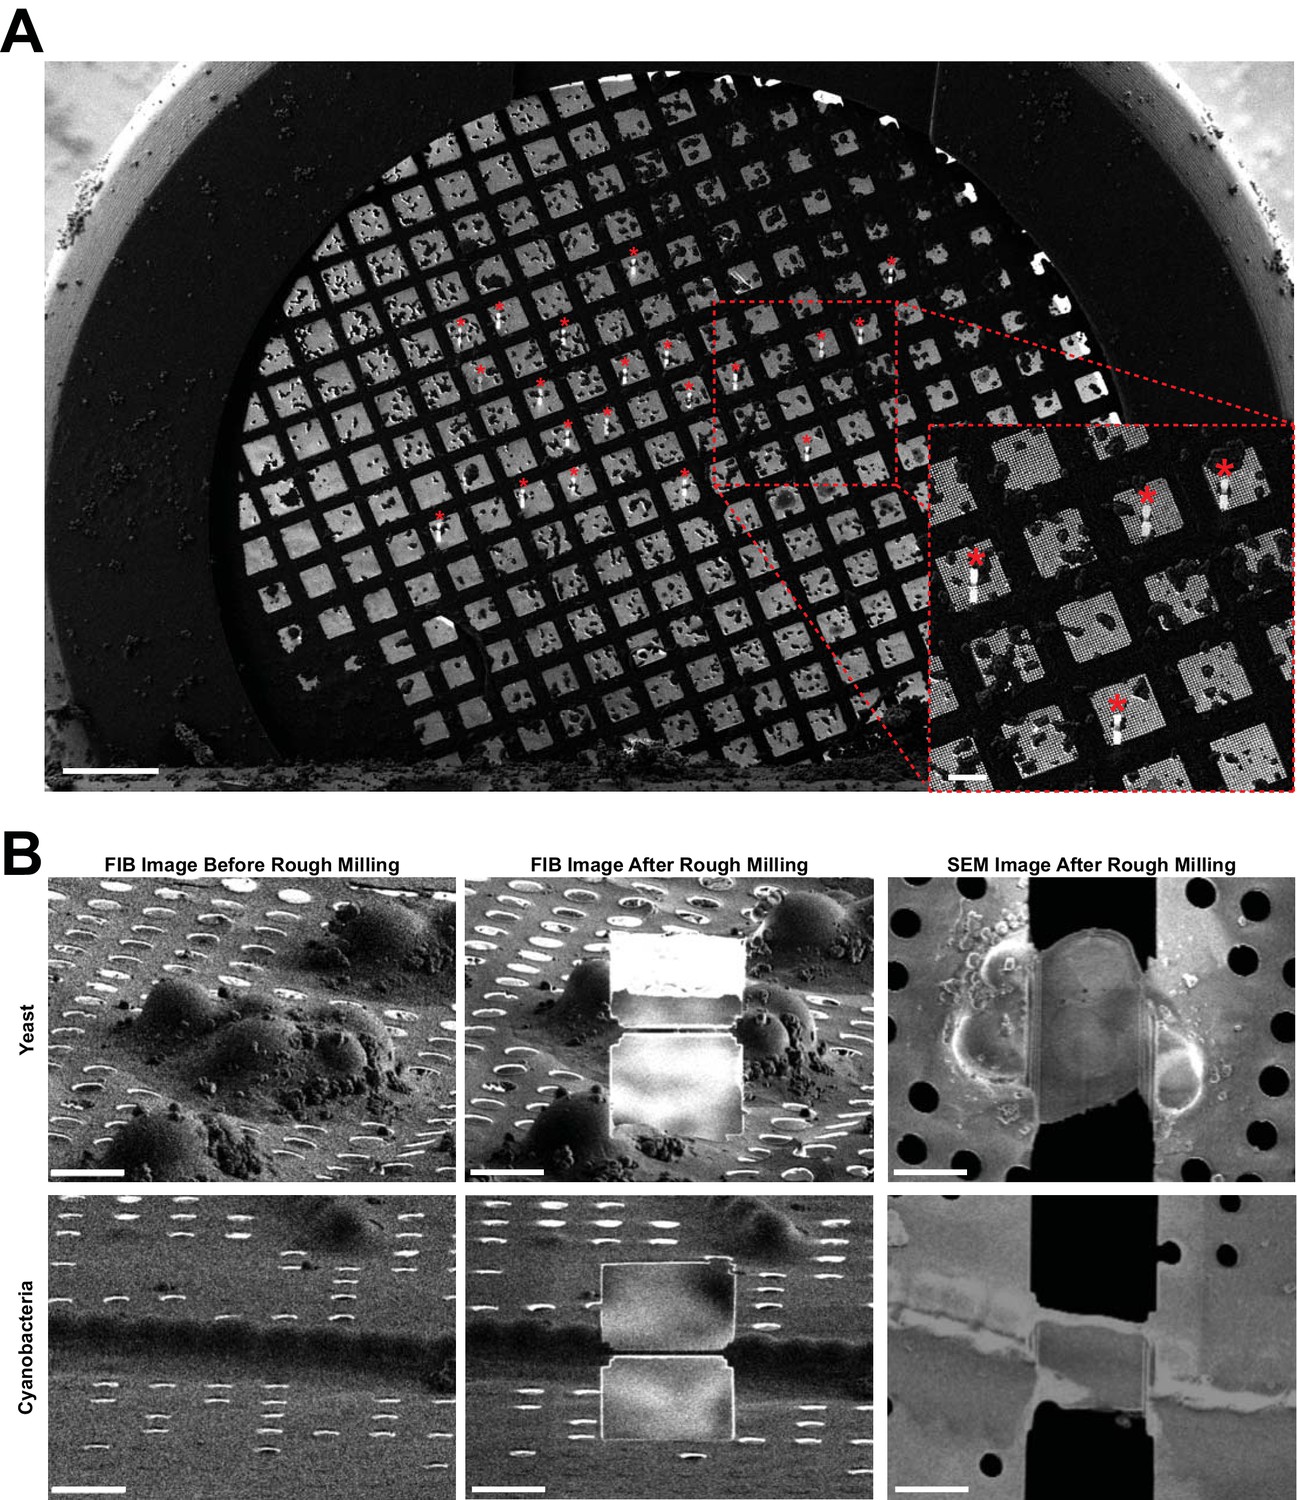
Representative images of lamellae generated by automated sequential rough milling.
(A) SEM grid overview image including 20 yeast targets (asterisks) on which rough milling was performed in an automated sequential manner (session C). Bars, 200 µm. (B) Representative SEM and FIB images of yeast and cyanobacteria cells captured before and after fully automated sequential rough milling (session B.1 and B.2). Bars, 5 µm.
Figure 2—figure supplement 1

Further examples of lamellae generated in a fully automated manner.
Images of lamellae from yeast cells at three different stages of the workflow. The left column shows SEM images of five polished lamellae (A–E). The middle column shows TEM images of the same lamellae. The right column shows images of 4.57 nm thick slices through tomogram collected on each lamella. Bars are 10 µm in left/middle columns and 1 µm in right column.
Figure 2—figure supplement 2
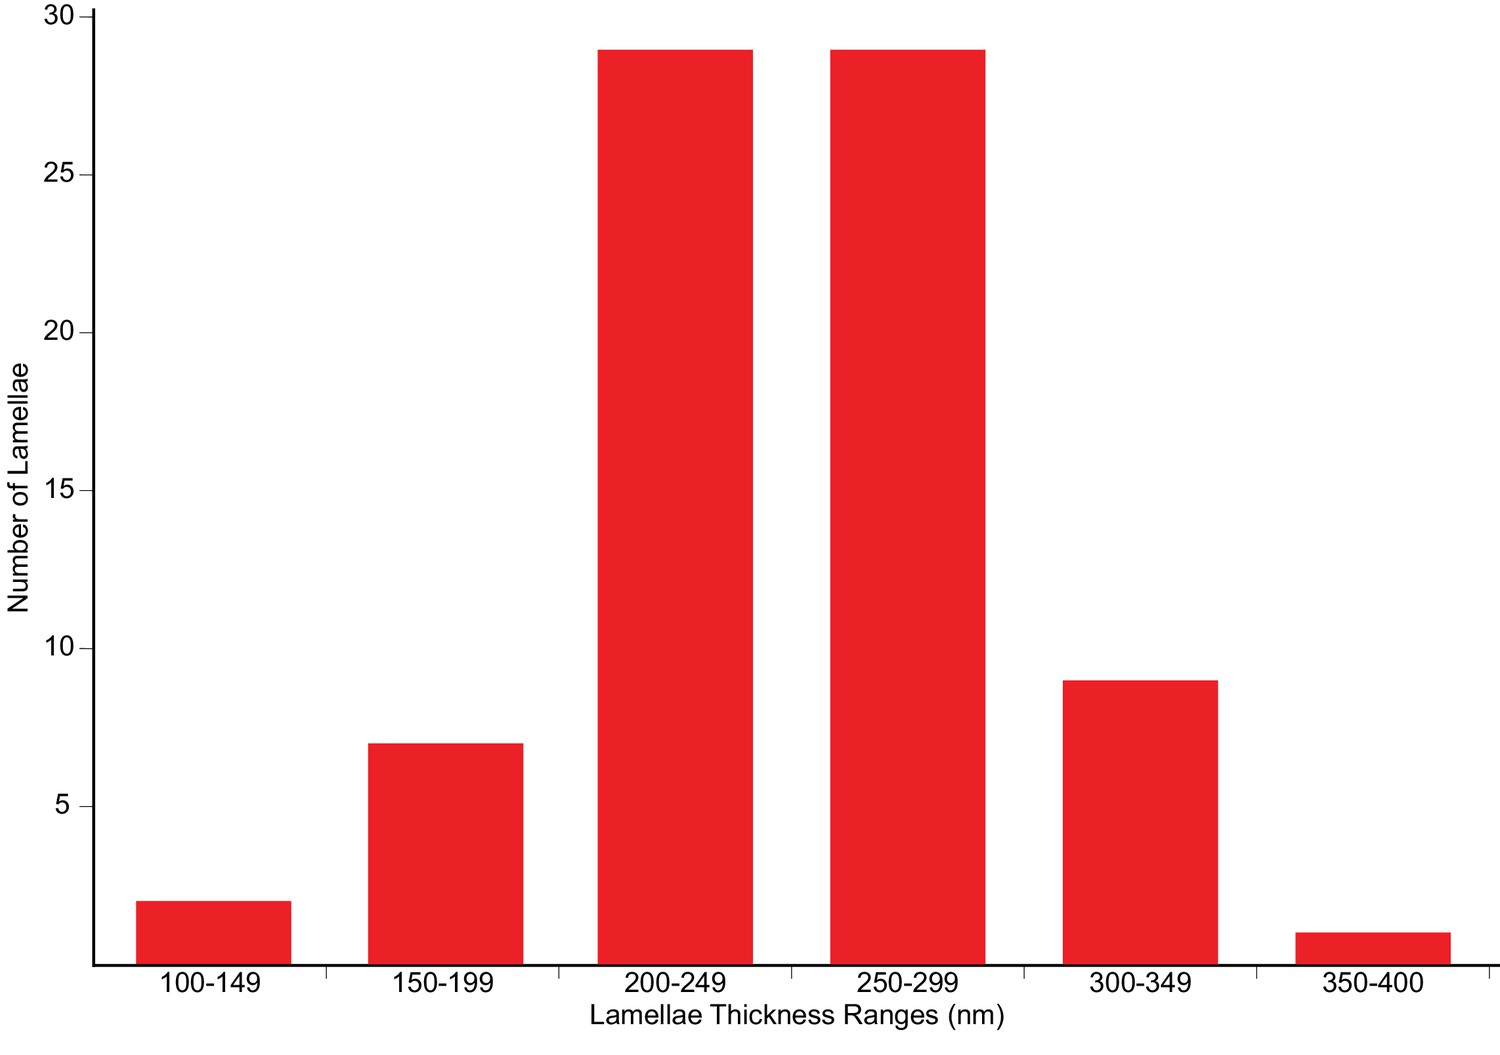
Distribution of lamellae thicknesses.
The plot shows the distribution of the thickness values of fully automated sequential FIB-milled lamellae, as determined by cryoET imaging. The final polishing milling patterns were spaced 300 nm apart.
-
Figure 2—figure supplement 2—source data 1
Source data for Figure 2—figure supplement 2.
- https://cdn.elifesciences.org/articles/52286/elife-52286-fig2-figsupp2-data1-v2.xlsx
Figure 3 with 1 supplement
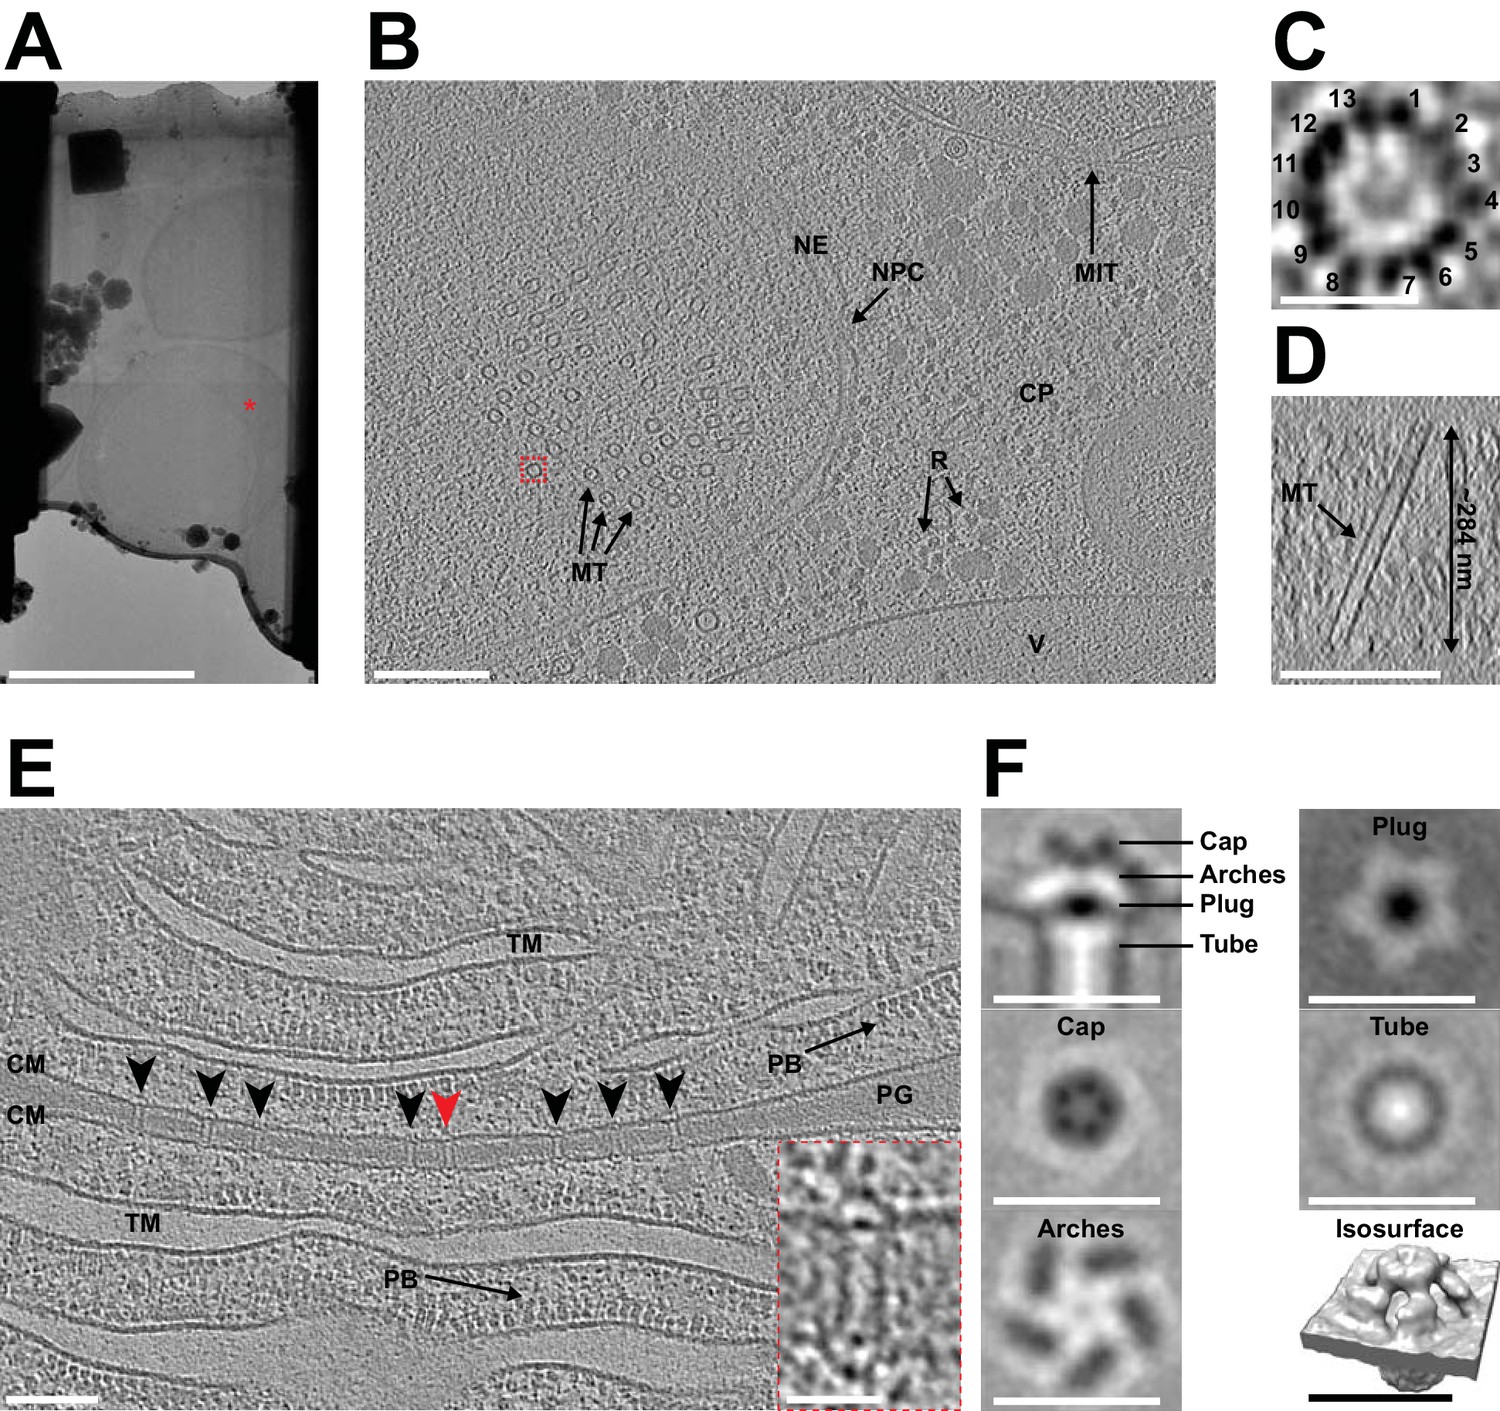
Automated sequential cryoFIB milling results in high-quality lamellae and cryotomograms.
(A) CryoTEM overview image of a lamella (session H) containing three yeast cells. Red mark indicates the area imaged in (B). Bar, 5 µm. (B) A 22.85 nm thick slice through a cryo-tomogram of a yeast cell (session H) [indicated by red mark in (A)]. The tomogram shows a nuclear pore complex (NPC), nuclear envelope (NE), microtubules (MT), cytoplasm (CP), cytoplasmic ribosomes (R), mitochondria (MIT) and a putative vacuole (V). Bar, 200 nm. (C) Top view of the microtubule indicated by dashed red box in (B). From a single slice through the tomogram it is possible to identify 13 protofilaments that make up the microtubule. (D) Cross-section of the tomogram showing the microtubule in (C) inside the generated lamella. From this view, we also determined the lamella thickness to be ~284 nm. (E) Shown is a 14 nm thick slice through a cryo-tomogram of a septum between two cyanobacteria cells (session F). The thickness of the lamella was determined to be ~208 nm. Arrowheads indicate septal junctions. The inset shows a magnified view of the septal junction indicated by a red arrowhead. Other cellular features include cytoplasmic membranes (CM), phycobilisomes (PB), thylakoid membranes (TM) and septal peptidoglycan (PG). Bars, 100 nm and 25 nm (inset). (F) Subtomogram average generated by extracting 343 septal junction particles from nine tomograms and performing fivefold symmetrization. Shown are longitudinal and perpendicular slices (thickness 0.68 nm) and a surface rendering of the symmetrized average. The observed characteristic structural modules were similar to a recent study that applied manual cryoFIB milling (Weiss et al., 2019) (also see Figure 3—figure supplement 1). Bars, 25 nm.
Figure 3—figure supplement 1
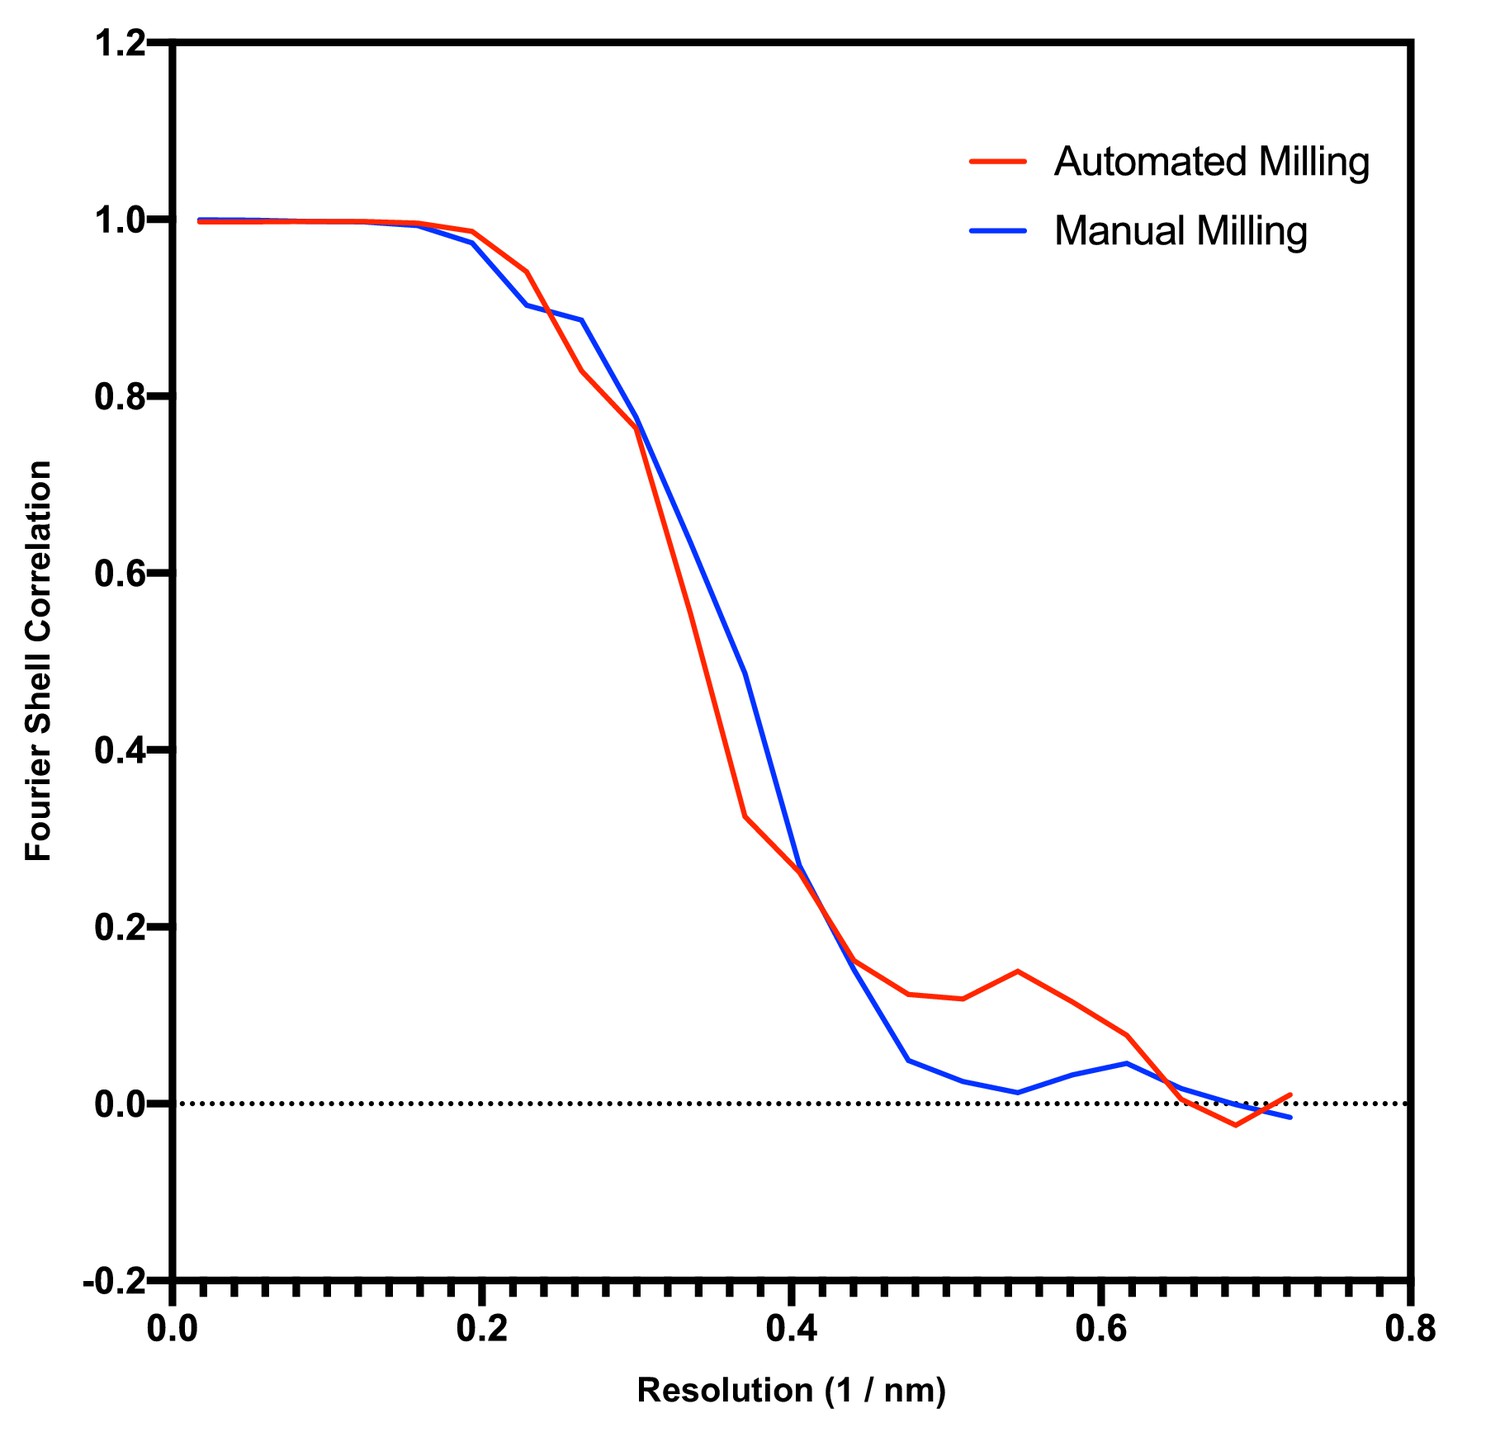
Comparison of data quality between manual and automated milling.
Shown is a Fourier Shell Correlation (FSC) curve (red) for the septal junction subtomogram average shown in Figure 3F (resulting from automated milling). The second curve (blue) results from a dataset published previously (Weiss et al., 2019) (resulting from manual milling) and was calculated with the same number of randomly selected subvolumes after fivefold symmetrization (n = 1715). Both approaches result in a comparable resolution estimate.
-
Figure 3—figure supplement 1—source data 1
Source data for Figure 3—figure supplement 1.
- https://cdn.elifesciences.org/articles/52286/elife-52286-fig3-figsupp1-data1-v2.xlsx
Tables
Table 1
Overview and success rates of milling sessions.
| Session | Sample Type | Rough Milling | Rough Milling Success | Polishing | Polishing Success | Instrument # |
|---|---|---|---|---|---|---|
| A | Cyanobacteria | Automated | 10/10 | Manual | 10/10 | 1 |
| B.1 | Yeast | Automated | 5/5 | Manual | 5/5* | 1 |
| B.2 | Cyanobacteria | Automated | 5/5 | Automated | 5/5* | |
| C | Yeast | Automated | 20/20 | Automated | 11/20† | 1 |
| D | Cyanobacteria | Automated | 7/7 | Automated | 7/7 | 1 |
| E | Cyanobacteria | Automated | 7/7 | Automated | 7/7 | 1 |
| F | Cyanobacteria | Automated | 18/19‡ | Automated | 16/18 | 1 |
| G | Yeast | Automated | 10/10 | Automated | 10/10 | 2 |
| H | Yeast | Automated | 20/20 | Automated | 18/20 | 2 |
| I | Yeast | Automated | 19/20§ | Automated | 19/19 | 2 |
| Total Automated | 121/123 (98%) | Total Automated | 93/106 (88%) |
-
* Rough milling of both B.1 and B.2 was performed in the same session.
† Lamellae were left in the instrument for 10h beore polishing, leading to lamellae bending and a lower success rate.
-
‡ User selected one target twice for rough milling, leading to a failure in rough milling.
§ User accidentally milled a target on the grid bar rendering it unusable.
Table 2
Strains used in this work.
| Strain | Identifier | Genotype | Source or reference |
|---|---|---|---|
| Anabaena sp. PCC7120 | Cyanobacteria | Wild Type | Rippka et al. (1979) |
| Saccharomyces cerevisiae SK1 | Yeast | diploid, homozygous for ndt80∆::HIS3 ho::LYS2 ura3 leu2::hisG trp1::hisG his3::hisG | This study |
Table 3
Dimensions and currents used for each milling pattern during automated sequential lamellae preparation.
| Milling Pattern # | Pattern Attributes |
|---|---|
| Milling pattern 1 and 2 (Rough Milling 1) | 30 kV 700 pA 9 × 5 µm rectangle Generates 2 µm thick lamella |
| Milling Pattern 3 and 4 (Rough Milling 2) | 30 kV 300 pA 8 × 2 µm rectangle Generates 1 µm thick lamella |
| Milling Pattern 5 and 6 (Rough Milling 3) | 30 kV 100 pA 7.5 × 1 µm rectangle Generates 500 nm thick lamella |
| Milling Pattern 7 and 8 (Lamella Polishing) | 30 kV 50 pA 7 × 0.5 µm rectangle Generates 300 nm thick lamella |
| Drift Correction Pattern (Rough Milling and Polishing) | 3 × 3 µm rectangle |
Additional files
Download links
A two-part list of links to download the article, or parts of the article, in various formats.
Downloads (link to download the article as PDF)
Open citations (links to open the citations from this article in various online reference manager services)
Cite this article (links to download the citations from this article in formats compatible with various reference manager tools)
Fully automated, sequential focused ion beam milling for cryo-electron tomography
eLife 9:e52286.
https://doi.org/10.7554/eLife.52286


