Medial entorhinal cortex activates in a traveling wave in the rat
- Department of Psychological and Brain Sciences, Indiana University Bloomington, United States
Figures
Figure 1 with 1 supplement
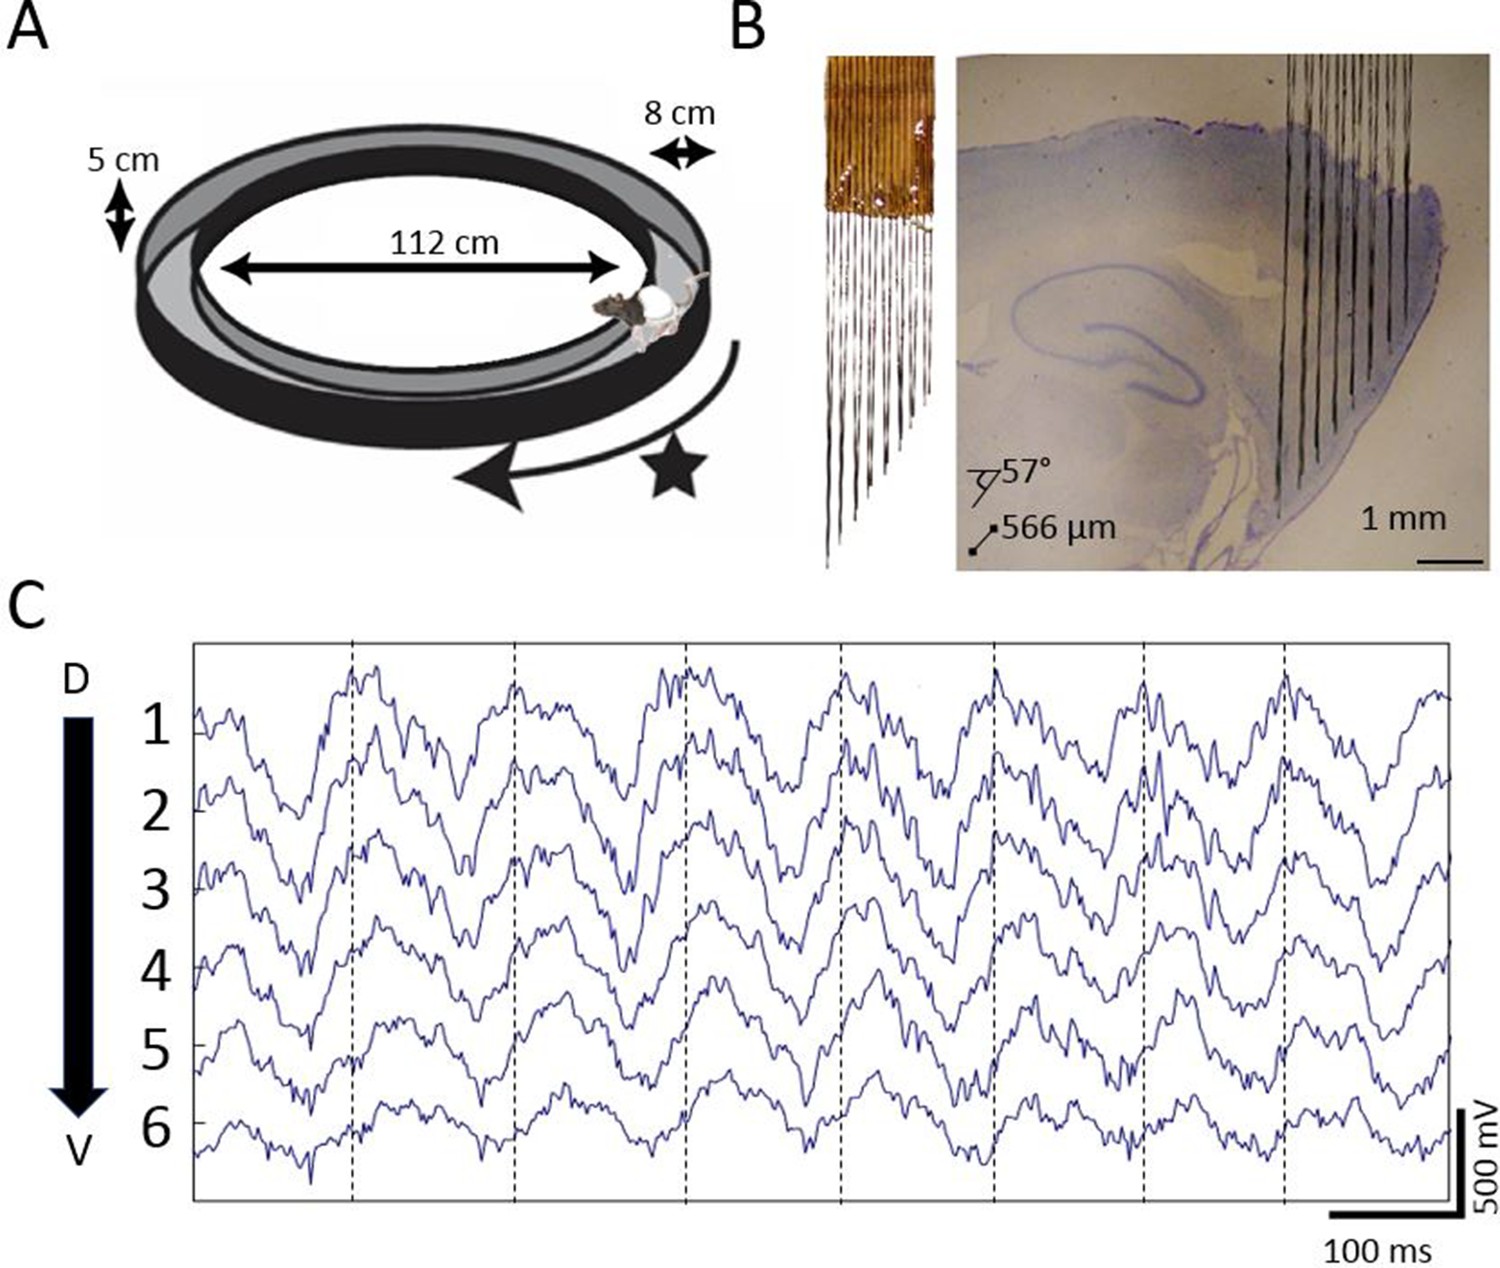
Extracellular field potential recordings along ~3 mm of the dorsal-ventral axis of the MEC in behaving rats reveals a gradual phase shift of theta.
(A) Rats completed laps on a circular track for food rewards delivered at a fixed location marked by the star. (B) Custom electrode arrays with fixed interelectrode spacing (566 μm and 57° orientation relative to horizontal plane) were used to sample the field potential along ~3 mm of the long axis of the MEC. Array depth was controlled by a micro-drive (not shown). (C) Example broadband LFP traces from adjacent electrodes in MEC reveal regular phase shifts. Vertical lines mark the theta peaks from the dorsal-most channel to facilitate visual comparison of phase shifts across channels.
Figure 1—figure supplement 1

Histological micrographs for the six rats implanted for this study, marking estimated electrode placement at the time of sacrifice (orange and blue stars) and inferred positions at the time of the recording analyzed and described in the main text (green squares).
Black lines were added to indicate the inferred electrode track. Stars were added to indicate the inferred final electrode position. Blue reflects electrodes that were found to be outside of the medial entorhinal cortex at the time of the key recording. Orange reflects electrodes that were found to target the medial entorhinal cortex at the time of recording. Note that, in most cases, key recordings upon which analyses were performed are relatively dorsal from the final termination sites shown here, because electrodes were often stepped deeper in an effort to achieve subsequent recordings of unit activity in layer II.
Figure 2
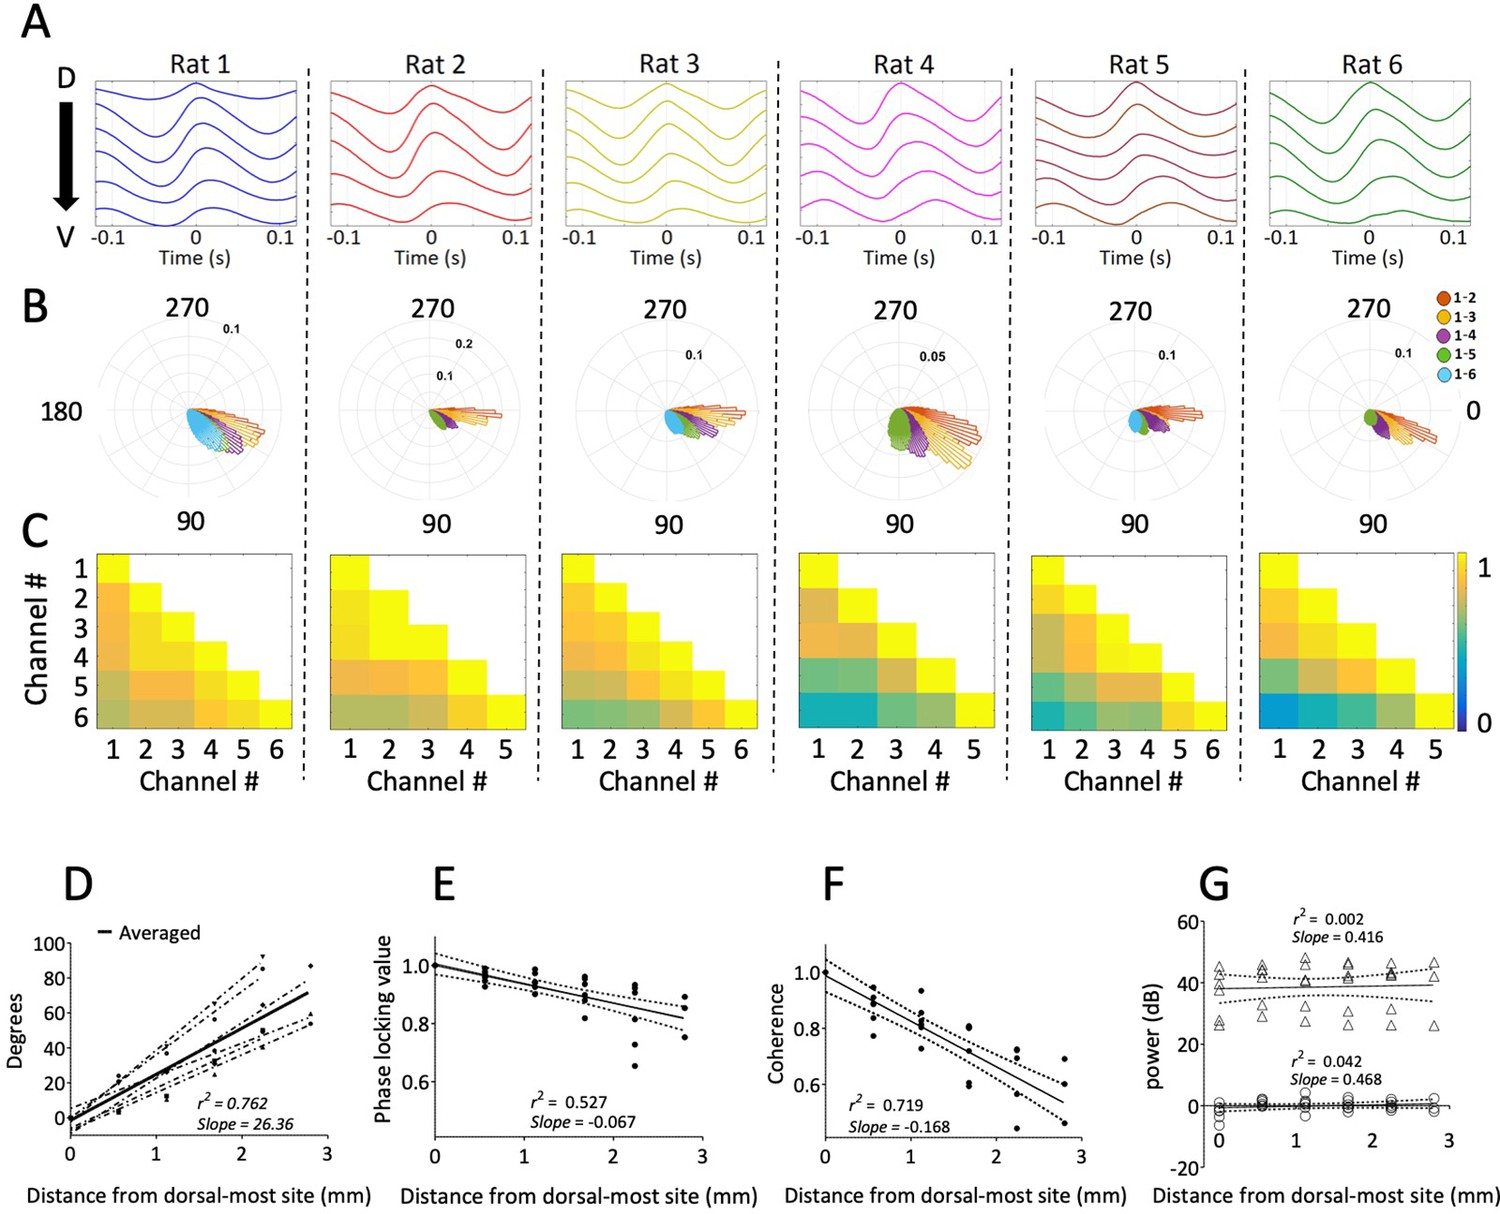
Consistent gradual phase shifts were observed along the long axis of MEC in all animals.
(A) Average theta waves across channels, computed as an event-related average of the raw LFP triggered on the peak of theta for the dorsal-most channel, show similar theta phase shifts across channels for each rat. (B) Histogram of theta phase differences for each electrode relative to the dorsal-most electrode for each rat. (C) Theta-band coherence between all electrode pairs for each rat. Electrode 1 corresponds to the most dorsal position. (D) Summary of theta phase shifts of each electrode relative to the dorsal-most electrode as a function of the distance between the electrodes. See also Figure 3. (E) Phase locking (mean resultant length) between each electrode and the dorsal-most electrode, plotted as a function of inter-electrode distance, shows consistently high phase-locking across the dorsal-ventral axis. (F) Summary of theta-band coherence changes between each electrode and the dorsal-most electrode (corresponding to left-most column of the matrices shown in C) plotted as a function of inter-electrode distance. (G) Spectral power of theta as a function of distance from the dorsal-most-site. Triangles indicate raw power. Circles indicate power relative to each animal’s across-electrode mean power. Solid lines in panels (E), (F), and (G) reflect regression trendlines across rats, and the dashed lines reflect 95% confidence intervals on the regression coefficients.
Figure 3
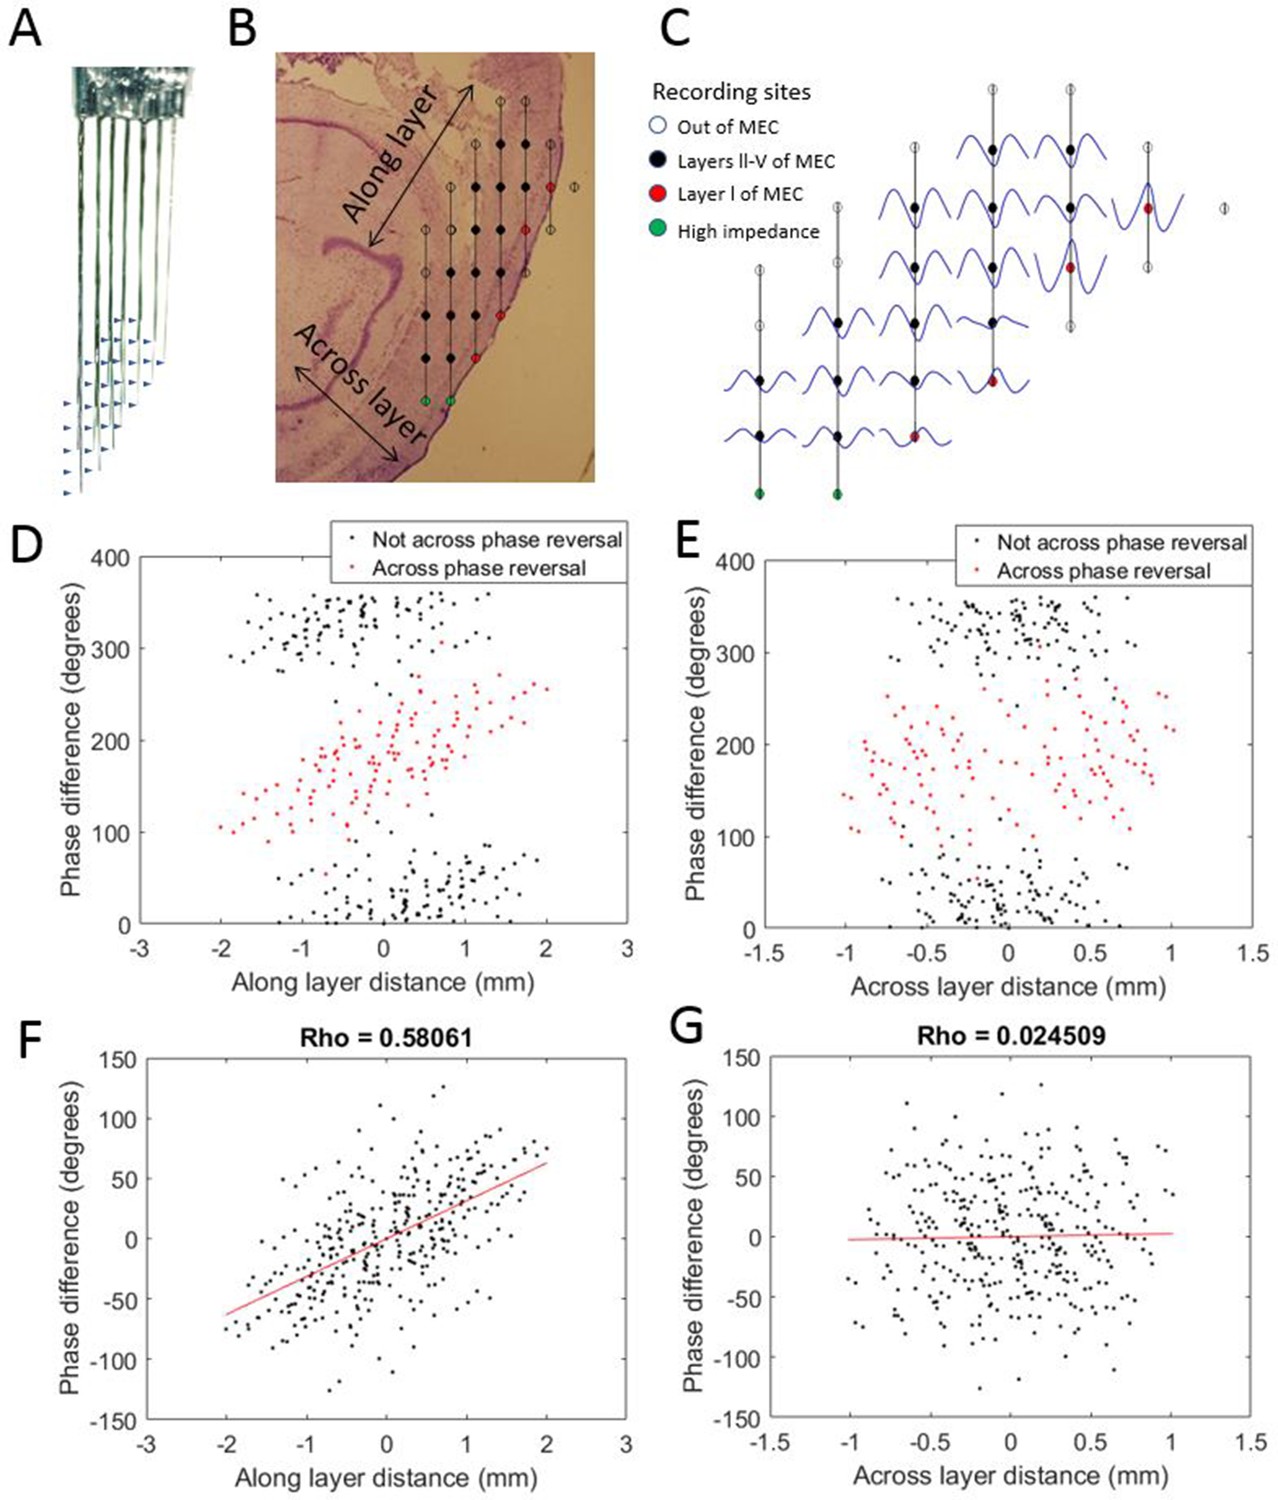
Progressive theta phase shift expressed along layers but not across layers in MEC.
(A) Custom multi-shank electrode array with tips positioned to allow simultaneous recording along and across the cortical layers of the MEC. Arrow heads indicate the positions of recording sites on the adjacent shank. (B) Reconstructed position of the electrode array based on histology, probe geometry, and electrophysiological markers. Color coding of individual sites indicates whether they were excluded for either being beyond the bounds of the MEC (white) or having high impedance (green), and whether they were found to have a phase reversal (red) relative to the remaining sites (black). (C) Cycle-average theta waves for all electrodes, triggered off of peaks on the most dorsal electrode of layer l. The progressive theta phase shift is observed along the same layer, but not across the layer, note the phase inversion of 180° between layer I and layers III–V. (D) The theta phase difference for each electrode pair plotted as a function of the distance between the corresponding electrodes along the cortical layers (as shown in panel [B]) reveals a bimodal distribution that separated cleanly based upon whether the electrode pair spans the phase reversal expected between layers II and I (red) or not (black). (E) Same as panel (D) but phase differences were plotted as a function of distance across the cortical layers (as shown in panel B). (F) Applying a 180° offset to the red dots shown in panel (D) collapses the multi-modal distribution into a single modal distribution with a strong positive correlation between distance along the cortical layer and phase difference. (G) Applying a 180° offset to the red dots shown in panel (E) also collapses the multi-modal distribution into a single modal distribution but with no notable correlation between distance across layers and phase difference.
Figure 4
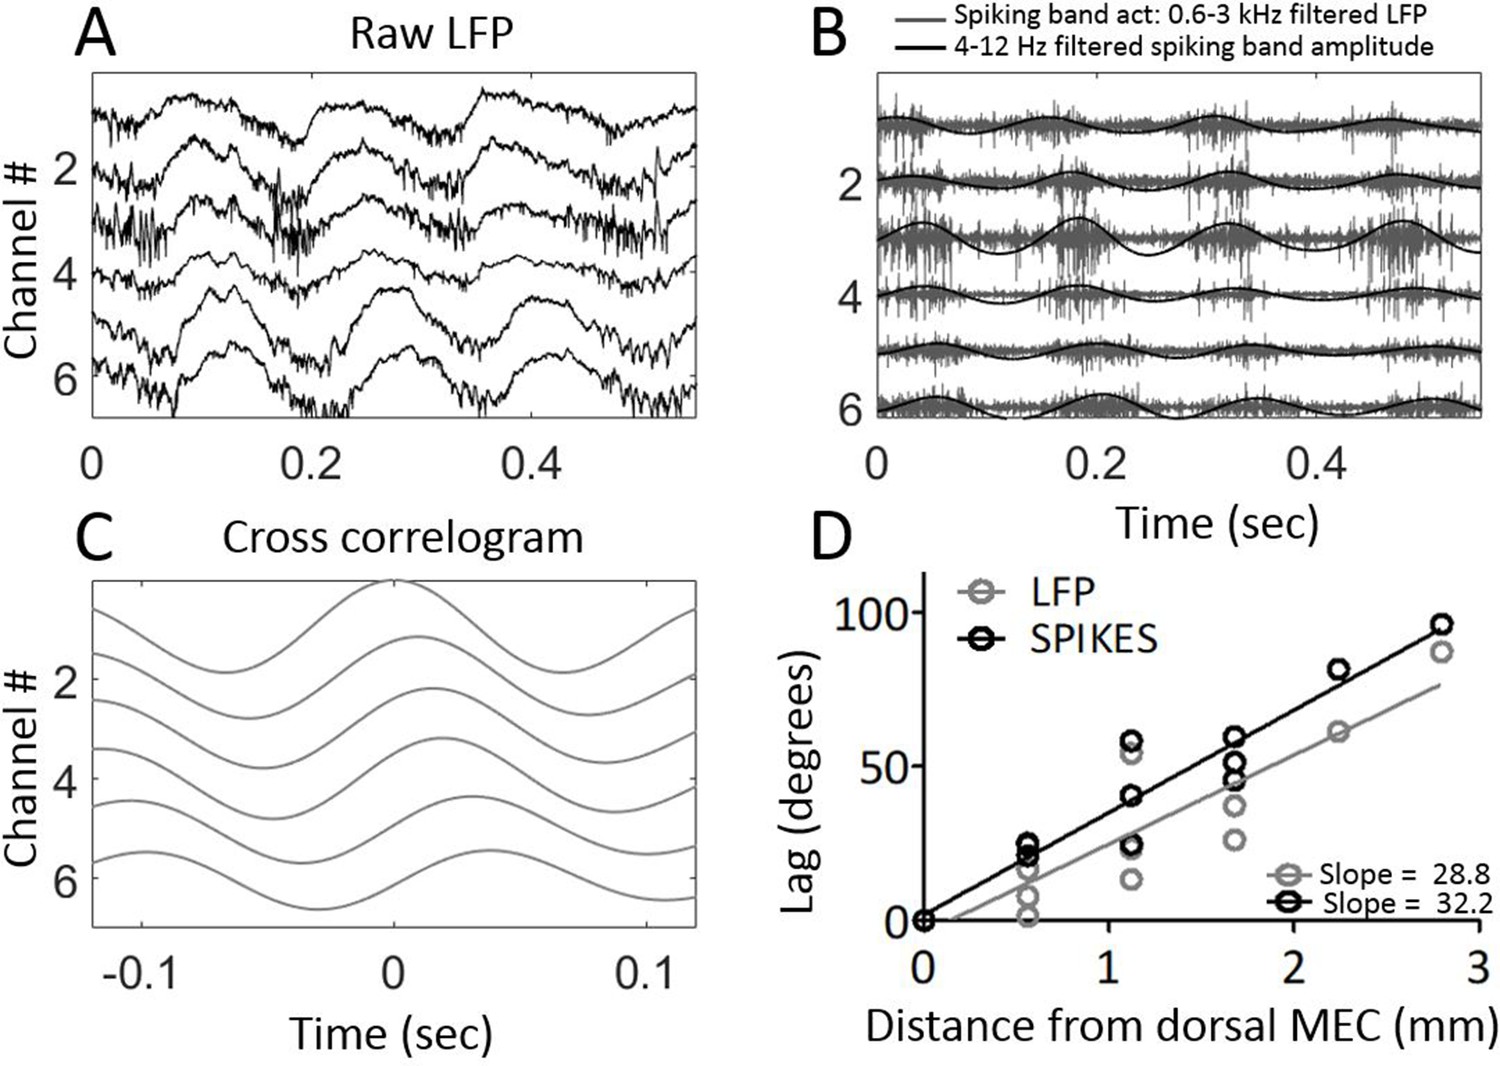
Multi-unit activity exhibited traveling waves along the dorsal-ventral axis.
(A) Representative example of multi-unit activity locked to the trough of the local theta that was observable in the broadband LFP when the electrode arrays were lowered into MEC layer II. (B) Bandpass filtering the broadband signal to 600–3000 Hz to focus on the ‘spiking-band,’ shown in gray, shows that the timing of these theta-rhythmic fluctuations in multi-unit activity varied across the dorsal-ventral axis of the MEC in this representative example. Low-pass filtering of the spiking-band amplitude, shown in black, highlights the theta rhythmic structure of the spiking activity. (C) Cross-correlations of the spiking-band amplitude between the dorsal-most channel and each of the other channels from the same trial, as shown in panels (A) and (B), resemble the traveling LFP theta waves. (D) A consistent pattern of increasing lags was observed across the three rats that had multiunit activity on four or more channels simultaneously. The lag to the cross-correlation peaks (black points and best-fit line) increases as a function of distance from the dorsal-most electrode (n=3 animals with four or more electrodes spiking simultaneously). The slope closely mirrors the slope in LFP theta phase offsets (gray points and best-fit line from the same three animals). The linearly increasing lags confirm that multi-unit activity activates at progressively longer delays along the dorsal-ventral axis.
Figure 5
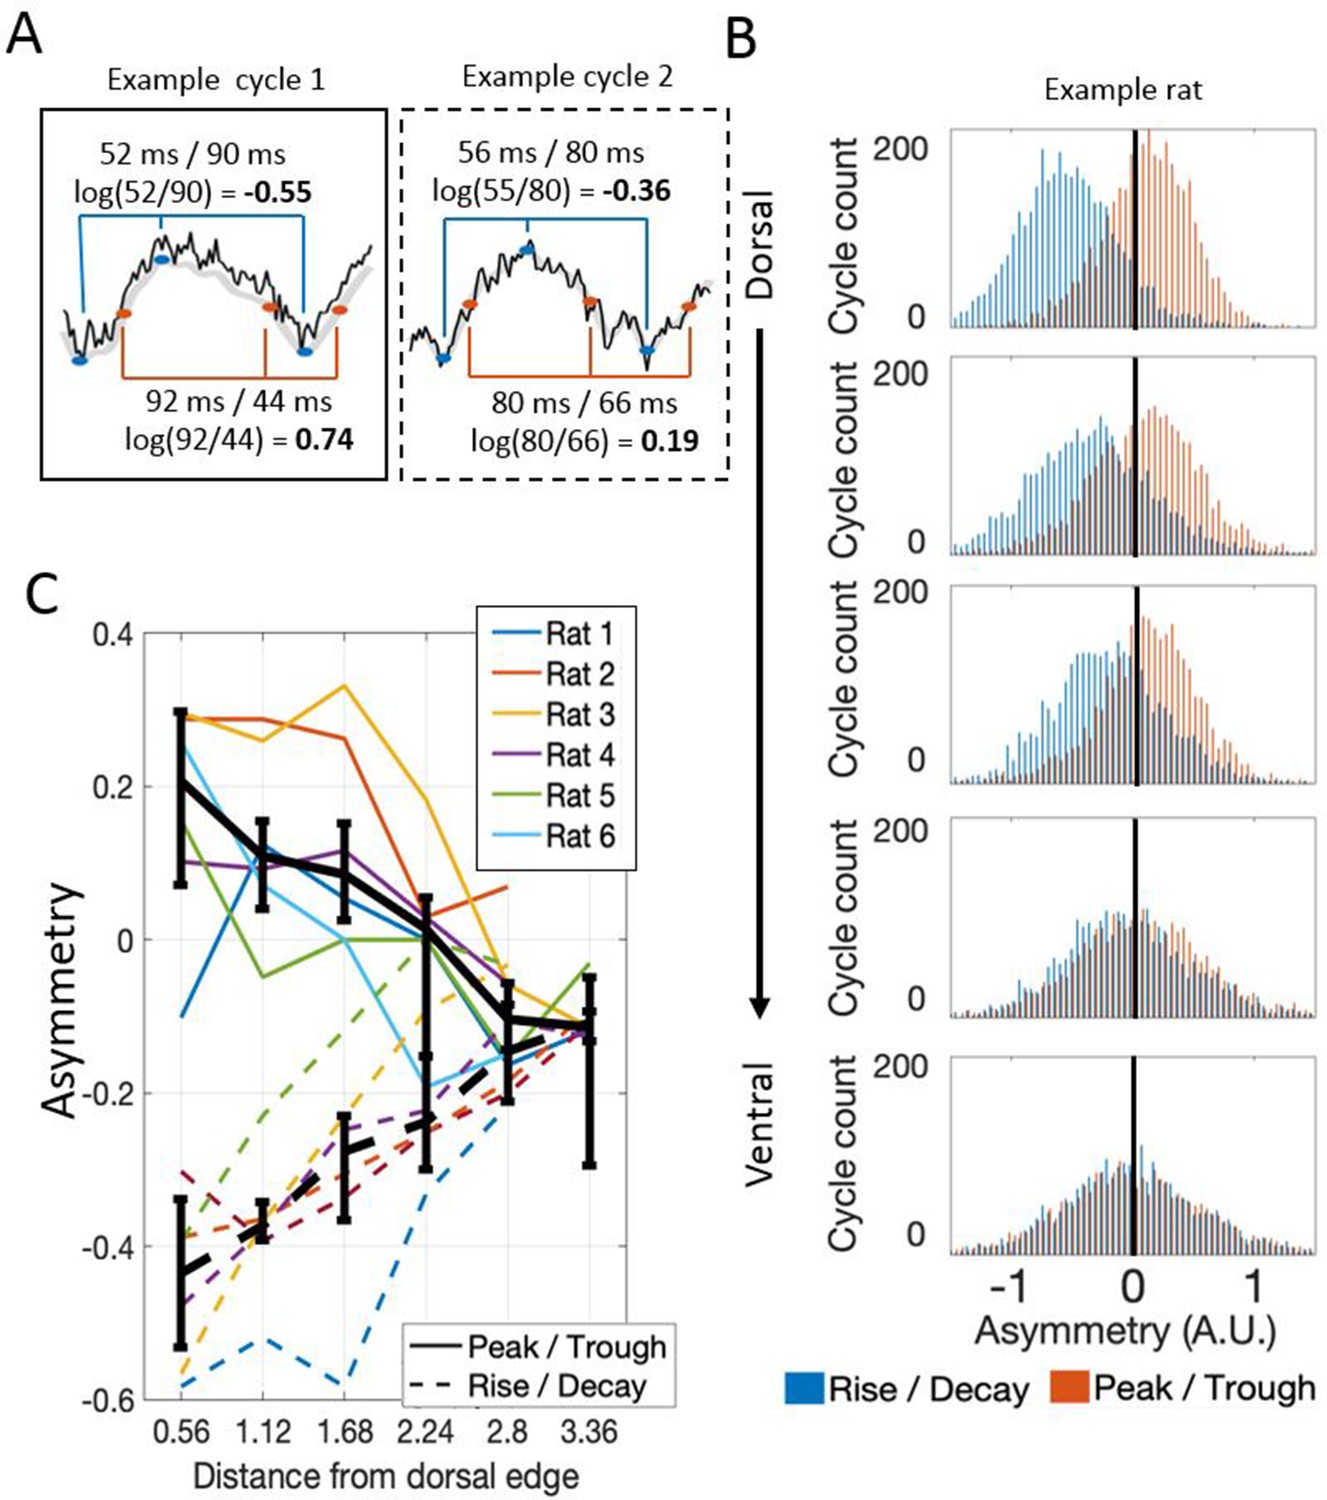
Theta waveform asymmetry varies along the dorsal-ventral axis of the MEC.
(A) Schematic showing how waveform asymmetry was analyzed. Raw recordings (black) were filtered to 1–25 Hz (gray), theta troughs and peaks were identified as local minima and maxima, and rising and decaying phases were identified as the mid-points between the nearest local minima and maxima. The rise/decay asymmetry was calculated as the log of the ratio between the duration of the rising and decaying phases (marked with blue lines). The peak/trough asymmetry was calculated as the log of the ratio of the peak and trough durations (marked with red lines). (B) Representative example of rise/decay asymmetry and peak/trough asymmetry distributions observed over all theta cycles recorded across channels in a single trial from Rat 4. The histogram of rise/decay asymmetry values over theta cycles (blue bars) at dorsal sites was dominantly negative, indicating a fast rise and slow decay sawtooth waveform. Ventral sites were less negative, indicating more symmetric rise and decay times. The histogram of peak/trough asymmetry values over all theta cycles (orange bars) at dorsal sites was mostly positive, indicating that peaks were longer than troughs. Ventral sites were less positive, indicating more symmetric peak and trough durations. (C) Summary for all rats in the study. Colored lines show the median asymmetry values for individual rats. Black lines show the median across rats with 95% bootstrap confidence intervals on the within- subject effect of electrode position.
Figure 6
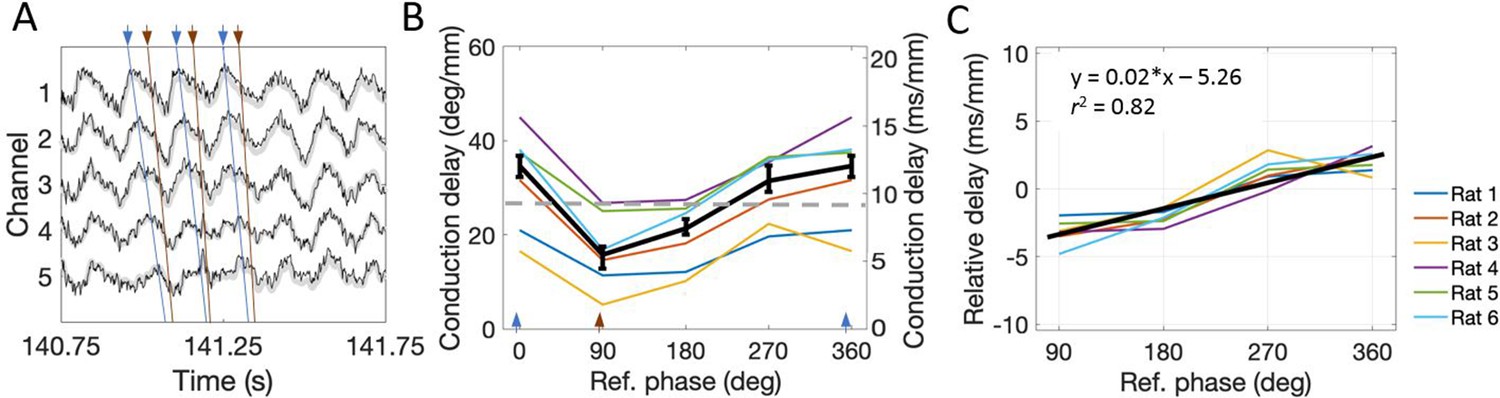
The conduction delay for theta to travel along the dorsal-ventral axis depends upon which phase is used as a reference point.
(A) Representative example of LFP. Blue lines connect the peaks across channels and orange lines connect falling phases across channels. The orange lines appear steeper than the blue lines, indicating shorter conduction delays. (B) Across rats, the conduction delay is longest for theta peaks (0° or 360°, marked with blue arrowheads), shortest for falling phases (90°, marked with orange arrowhead), and increase progressively between 90° and 360°. Medians across rats are shown in black with 95% bootstrap confidence intervals on the within-rat effect of reference phase. (C) Subtracting the mean delay for each rat from the lines shown in panel (B) to focus on the within-rat effect of reference phase on delay shows a reliable positive correlation between reference phase and conduction delay. The black line shown the best-fit trendline (R2 = 0.82) corresponding to the shown equation. Across panels, data from individual rats are shown as colored lines. Ref. = reference.
Figure 7
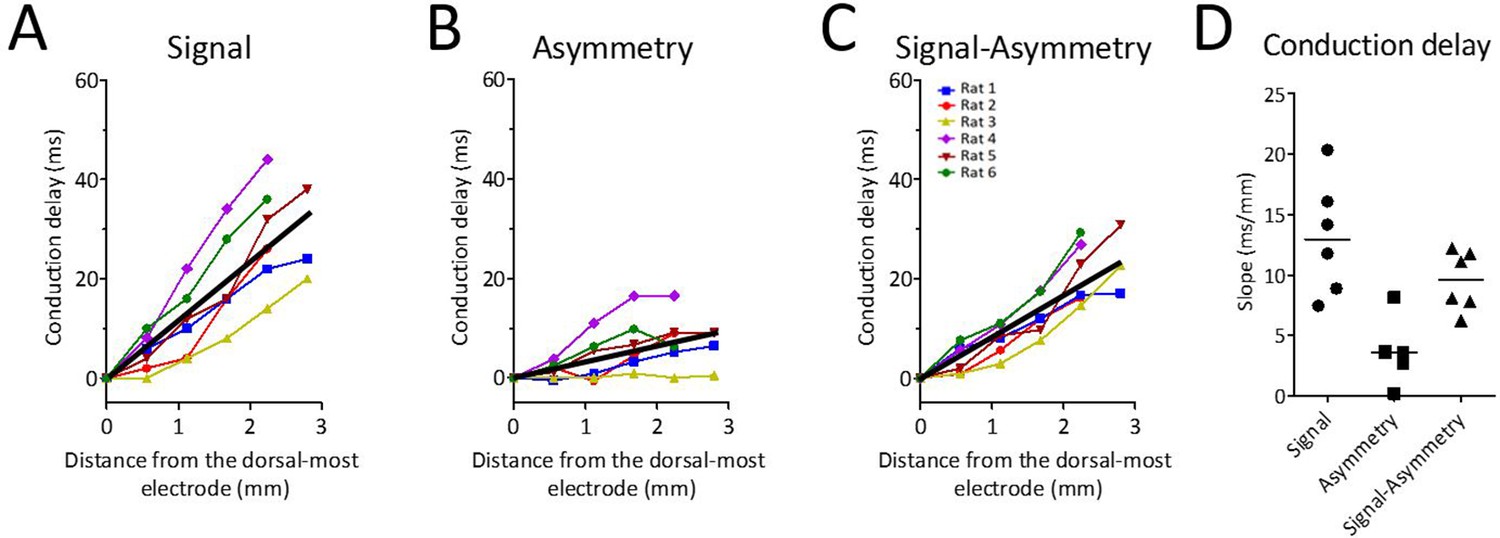
Theta waveform changes are a source of phase shift along the long axis of the MEC.
(A) Observed phase shifts across channels (i.e., theta-phase-shifts) replotted from Figure 2D for ease of comparison. (B) Phase shifts expected given the changes in waveform asymmetry between sites (i.e., waveform-related-shifts). (C) Subtraction of waveform-related-shifts from theta-phase-shifts across electrode positions shows that the remaining phase shifts are relatively flat with respect to distance along the dorsal-ventral axis. (D) Comparison of the average phase shifts (degrees/mm) shown in panels (A–C) reveals significantly reduced phase shifts after subtracting waveform-related-shifts from the theta-phase-shifts.
Figure 8
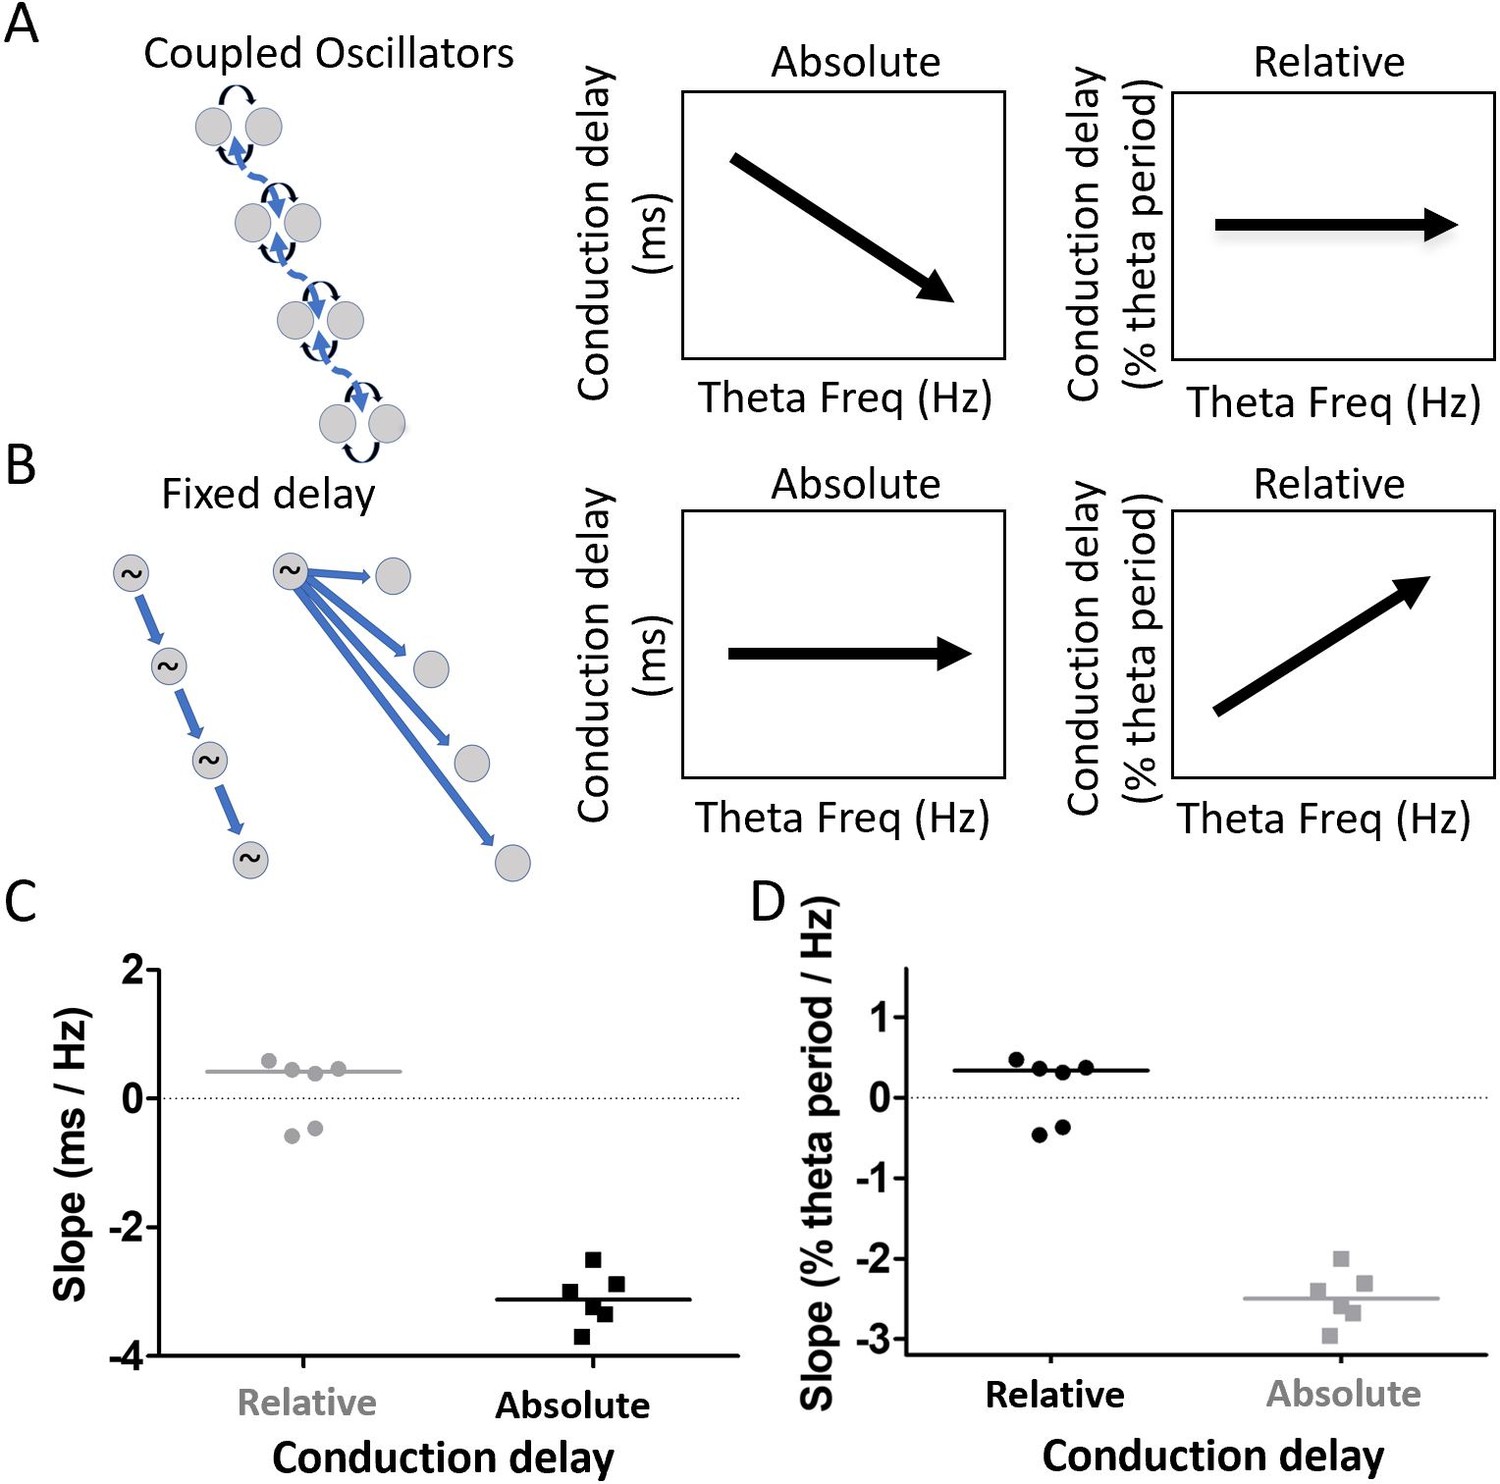
Residual phase shifts after accounting for varying waveform asymmetries are consistent with the pattern of effects that would be generated by a coupled-oscillator-based mechanism.
(A) Schematic representation of a coupled oscillator mechanism for generating a traveling wave and the associated relationships between theta frequency and either absolute conduction delay or relative conduction delay. The phase locking between oscillators enforces a stable relative conduction delay across varying theta frequencies. These stable relative conduction delays correspond to decreasing absolute conduction delay as theta frequency increases. (B) Schematic representation of two fixed-delay mechanisms for generating a traveling wave and the associated relationships between theta frequency and either absolute conduction delay or relative conduction delay. Propagating excitatory pulses (left) and delayed excitations (right) can generate fixed-delay traveling waves. The fixed delay, by definition, creates fixed absolute conduction delays independent of theta frequency. These fixed delays, however, correspond to increasing relative conduction delays as theta frequency increases. (C) Slope relating relative conduction delay to theta frequency in terms of percent of period (%) per change in frequency (Hz) is shown in black. (D) Slope relating absolute conduction delay to theta frequency in terms of milliseconds (ms) per Hz is shown in black. To facilitate direct comparison of the slopes shown in panels (C) and (D), the data from each panel were converted on the basis of an assumed theta frequency of 8 Hz and plotted on the other panel in gray.
Author response image 1
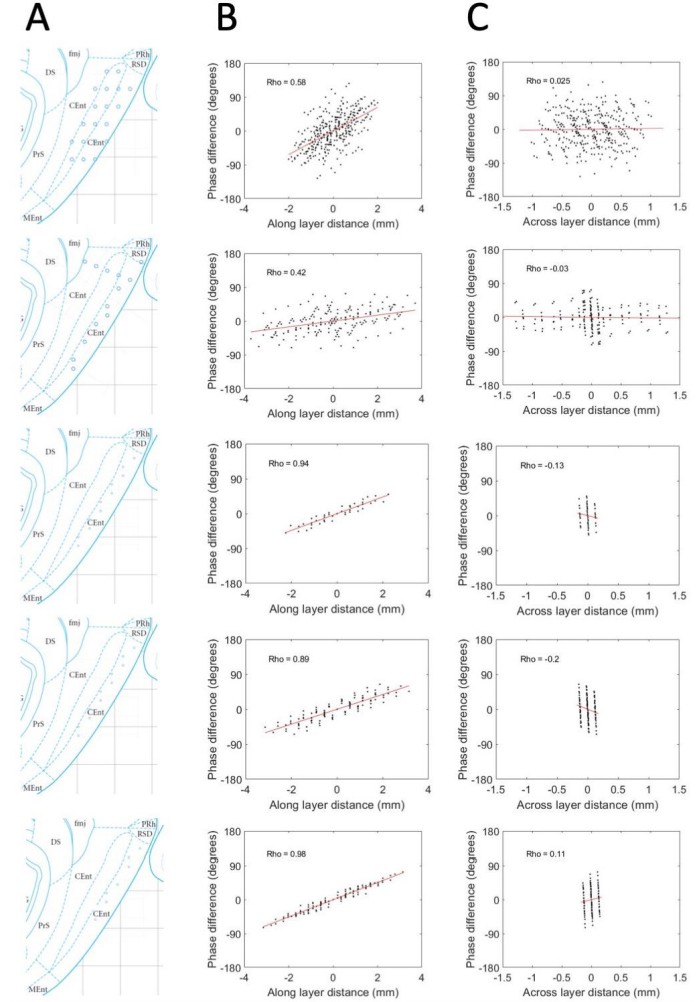
Phase shifts are reliably positive and strongly associated with electrode position along the MEC layers and unreliably / not related to positioning across the MEC layers.
(A) Reconstructed electrode positioning in the MEC based on analysis of physiological markers observed at the time of recording and by comparing the changes in physiological markers and electrode movements over days. (B) Phase differences between pairs of electrodes are plotted as a function of the spatial offset of the electrodes between recording sites along the MEC layers. (C) Same as B but phase offsets are plotted as a function of the spatial offset across the MEC layers. Across these five rats (shown across the rows), a consistent positive relationship is observed when phase offsets are plotted as a function of the spatial offsets along the MEC layer but not when plotted as a function of the spatial offset across the MEC layers.
Additional files
Download links
A two-part list of links to download the article, or parts of the article, in various formats.
Downloads (link to download the article as PDF)
Open citations (links to open the citations from this article in various online reference manager services)
Cite this article (links to download the citations from this article in formats compatible with various reference manager tools)
Medial entorhinal cortex activates in a traveling wave in the rat
eLife 9:e52289.
https://doi.org/10.7554/eLife.52289


