Misfolded proteins bind and activate death receptor 5 to trigger apoptosis during unresolved endoplasmic reticulum stress
- Howard Hughes Medical Institute, University of California, San Francisco, United States
- University of California, San Francisco, United States
- Genentech, Inc, United States
Figures
Figure 1 with 5 supplements
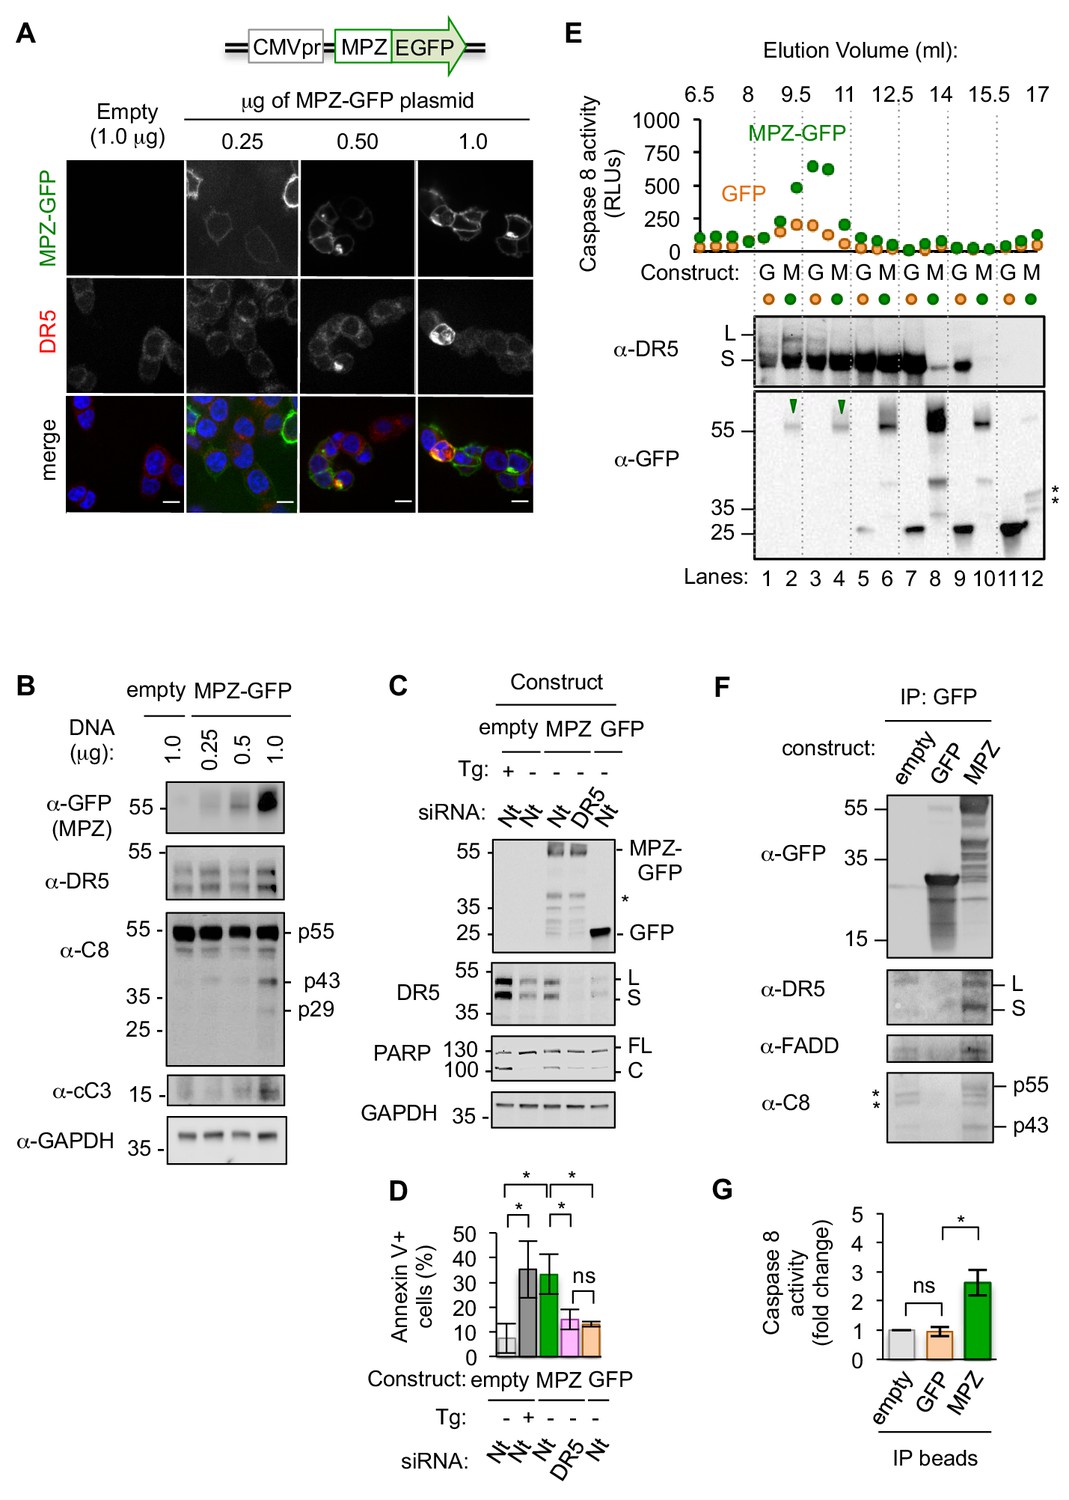
Misfolded proteins induce DR5-dependent apoptosis and assemble DR5-caspase 8 signaling complexes.
(A) Confocal images of epithelial cells HCT116 fixed 24 hr post-transfection with 0.25–1.0 μg of a plasmid containing myelin protein zero (MPZ) tagged with a C-terminal monomeric EGFP or 1.0 μg of the empty vector showing MPZ-GFP fluorescence (green) and immunofluorescence with an antibody against DR5 (red) (scale bar = 5 μm). (B) Western blot of HCT116 cell lysates harvested 24 hr post-transfection with a titration of MPZ-GFP plasmid or the empty vector (C8 = caspase 8, cC3 = cleaved caspase 3). p55 represents full-length, inactive C8; p43 indicates a C8 intermediate after release of the active p10 subunit, and p29 corresponds to the released p18 and p10 subunits. (C) Western blot of HCT116 cells transfected with siRNA against a non-targeting (Nt) control or DR5 (48 hr) followed by the empty vector -/+ 100 nM thapsigargin (Tg), 1.0 μg MPZ-GFP, or cytosolic GFP (24 hr; * denotes degradation products; L and S denote the long and short isoforms of DR5, respectively; FL and C denote full-length and cleaved PARP, respectively). (D) Average percent of annexin V staining for HCT116 cells transfected as described in C) from n = 3 biological replicates (error bars = SEM; * indicates p<0.05; ns indicates p=0.46 as analyzed by unpaired t-test with equal SD). See Figure 1—figure supplement 4D for gating. (E) Top: Caspase 8 activity in size exclusion chromatography fractions from lysates of HCT116 cells transfected with MPZ-GFP or cytosolic GFP (24 hr). Bottom: Size exclusion fractions were pooled according to dotted grid lines and immunoblotted for DR5 and GFP (* denotes degradation products). (F) Immunoprecipitation of GFP-tagged proteins from lysates of HCT116 transfected with MPZ-GFP, cytosolic GFP, or the empty vector (L and S denote the long and short isoforms of DR5, respectively). The percent of total DR5 recovered has been quantified in Figure 1—figure supplement 5C. (G) Fold change in caspase 8 activity relative to the empty vector control for beads with immunoprecipitated contents shown in Figure 1F (error bars = SEM for n = 3 biological replicates; * indicates p=0.023 and ns indicates p=0.83 as calculated by unpaired t-tests with equal SD).
-
Figure 1—source data 1
Caspase glo 8 measurements for IP of MPZ-GFP vs GFP.
This zip archive contains the measured luminescent units for caspase glo 8 activity shown in Figure 1G (IP beads) and Figure 1—figure supplement 3C (input lysates). Coomassie gels used to normalize lysate concentration are included as. tif files.
- https://cdn.elifesciences.org/articles/52291/elife-52291-fig1-data1-v2.zip
-
Figure 1—source data 2
Westerns and quantification of DR5 recovered on IPs.
This zip archive contains images of the Western blots and measurements used to quantify the amount of DR5 in the IP samples relative to the input lysate.
- https://cdn.elifesciences.org/articles/52291/elife-52291-fig1-data2-v2.zip
-
Figure 1—source data 3
FCS files and quantification of annexin V staining for MPZ-GFP.
This zip archive contains FCS files from n = 3 biological replicates of HCT116 transfected with the conditions outlined in Figure 1D. The excel file contains the quantification of annexin V staining exported frow FlowJo.
- https://cdn.elifesciences.org/articles/52291/elife-52291-fig1-data3-v2.zip
-
Figure 1—source data 4
qPCR analysis of MPZ-GFP titration.
This zip archive contains the compiled excel file for qPCR data shown in Figure 1—figure supplement 1A along with the Prism 6 file used to perform multiple t-tests with Holm-Sidak correction for multiple comparisons.
- https://cdn.elifesciences.org/articles/52291/elife-52291-fig1-data4-v2.zip
-
Figure 1—source data 5
Caspase glo 8 measurements for time course of MPZ-GFP transfection.
This zip archive contains the measured luminescent units for caspase glo 8 activity shown in Figure 1—figure supplement 1E and the tif file of the Coomassie blue-stained gel used to normalize lysate concentrations.
- https://cdn.elifesciences.org/articles/52291/elife-52291-fig1-data5-v2.zip
-
Figure 1—source data 6
qPCR and cell death measurement for CHOP expression.
This zip archive contains the qPCR analysis from CHOP expression in Figure 1—figure supplement 2B, and brightfield images of Trypan Blue staining measured on the Countess II for n = 3 biological replicates, summarized in Figure 1—figure supplement 2D.
- https://cdn.elifesciences.org/articles/52291/elife-52291-fig1-data6-v2.zip
-
Figure 1—source data 7
qPCR analysis of INS and RHO-GFP expression.
This zip archive contains the compiled excel file for qPCR data shown in Figure 1—figure supplement 4A along with the Prism 6 file used to perform multiple t-tests with Holm-Sidak correction for multiple comparisons.
- https://cdn.elifesciences.org/articles/52291/elife-52291-fig1-data7-v2.zip
-
Figure 1—source data 8
FCS files and quantification of annexin V staining for INS and RHO.
This zip archive contains FCS files from n = 3 biological replicates of HCT116 transfected with the conditions outlined in Figure 1—figure supplement 4E. The excel file contains the quantification of annexin V staining exported frow FlowJo.
- https://cdn.elifesciences.org/articles/52291/elife-52291-fig1-data8-v2.zip
-
Figure 1—source data 9
Caspase glo 8 measurements for IP of INS and RHO-GFP.
This zip archive contains the measured luminescent units for caspase glo 8 activity shown in Figures 1S5B (input lysates and IP beads). Coomassie gels used to normalize lysate concentration are included as. tif files.
- https://cdn.elifesciences.org/articles/52291/elife-52291-fig1-data9-v2.zip
Figure 1—figure supplement 1
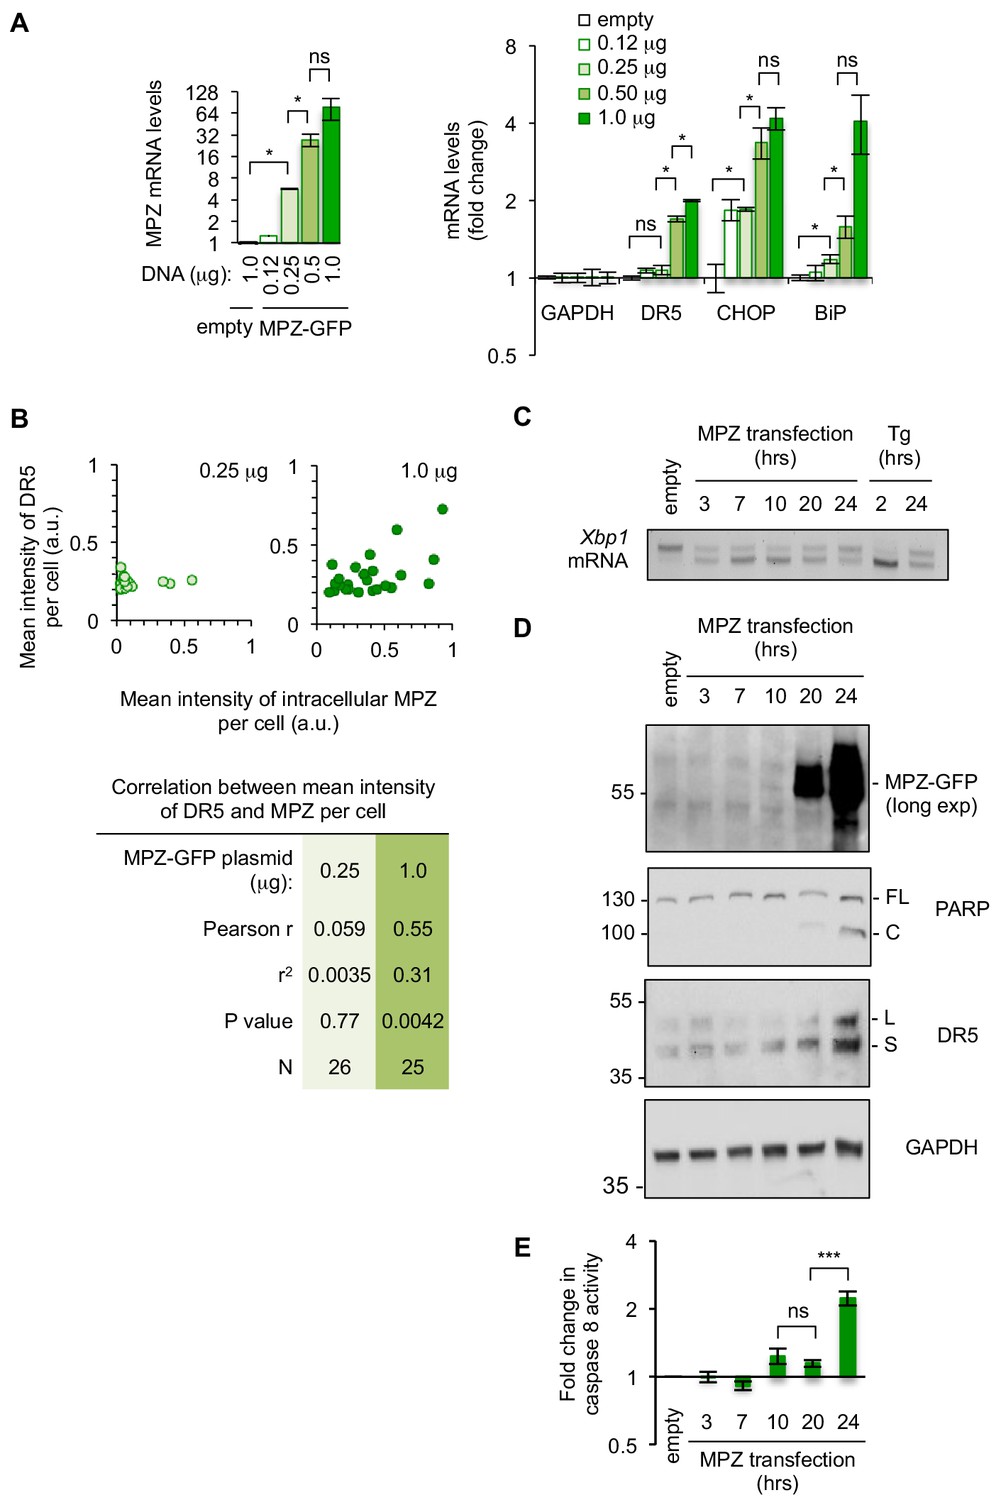
Sustained MPZ-GFP expression invokes a terminal, pro-apoptotic UPR at late time points.
(A) qPCR for reverse-transcribed transcripts harvested from HCT116 cells transfected with 0.12–1.0 μg of a plasmid containing myelin protein zero (MPZ) tagged with a C-terminal monomeric EGFP or 1.0 μg of the empty vector for 24 hr (n = 3 technical replicates, error bars = SD; * denotes p<0.05 as analyzed by multiple t-tests with Holm-Sidak correction for multiple comparisons). (B) Quantification of the mean intensity for DR5 versus the mean intensity of intracellular MPZ-GFP per cell for HCT116 transfected with 0.25 μg (left) and 1.0 μg (right) of MPZ-GFP plasmid to show the correlation between DR5 and MPZ-GFP expression levels per cell. Intensity values given by CellProfiler algorithms were normalized to 0.02 for DR5 and 0.06 for MPZ-GFP to assign arbitrary values. P values were calculated from unpaired two-tailed t-tests. (C) RT-PCR for unspliced and spliced forms of Xbp1 mRNA isolated from HCT116 cells transfected for 24 hr with the empty vector or for various time points with 1 μg MPZ-GFP, followed by cells treated with 100 nM Tg for 2 hr and 24 hr. (D) Western blot of HCT116 cell lysates harvested 24 hr post-transfection with the empty vector, or 3–24 hr post-transfection with 1 μg MPZ-GFP. (E) Fold change in caspase 8 activity, as measured by a luminescent caspase glo 8 substrate, of lysates from HCT116 harvested 3–24 hr post-transfection with 1 μg MPZ-GFP relative to cells transfected with the empty vector control (error bars represent SD of n = 3 technical replicates; *** denotes p<0.005, and ns indicates p=0.15 by unpaired t-test with equal SD).
Figure 1—figure supplement 2
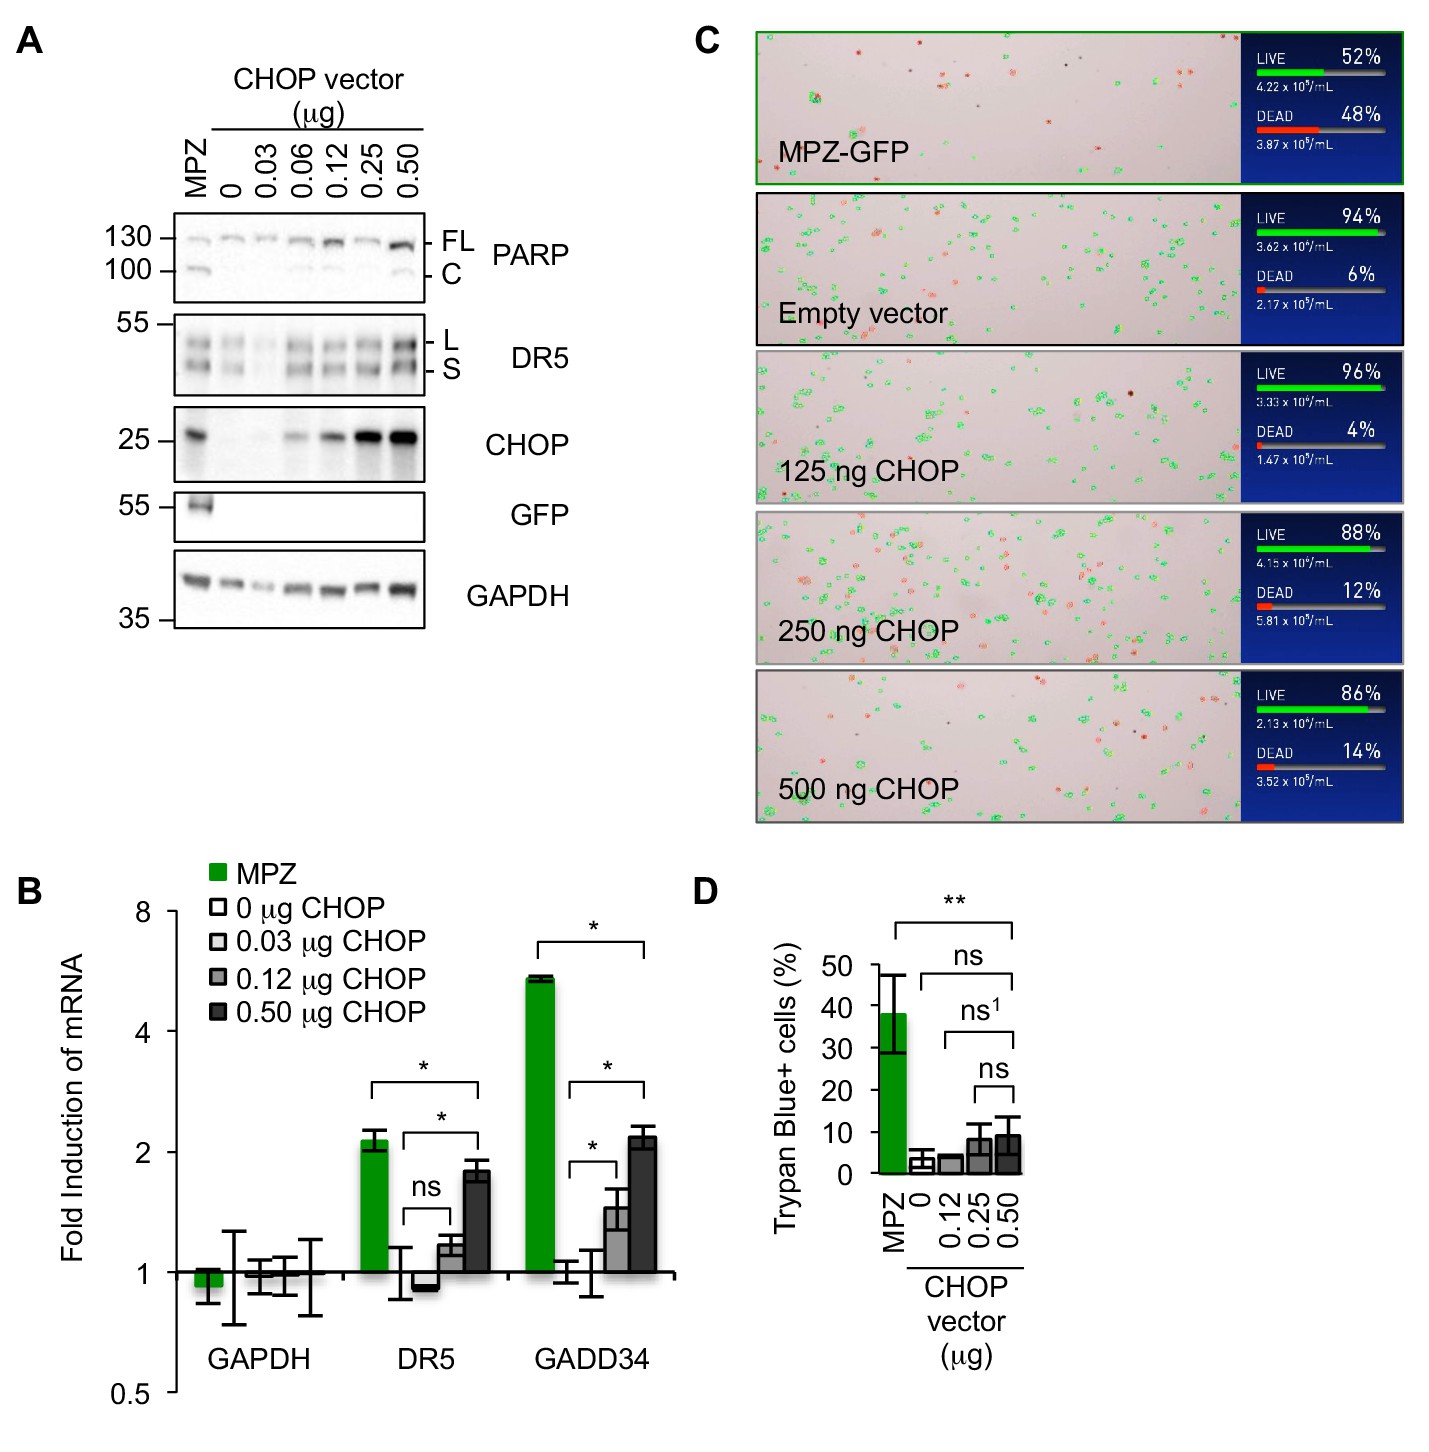
Upregulating DR5 levels in the absence of ER stress through ectopic expression of CHOP is not sufficient to induce apoptosis.
(A) Western blot of HCT116 cell lysates harvested 24 hr post-transfection with a titration of 0.03–0.50 μg of a CHOP expression vector, 1 μg MPZ-GFP plasmid, or the empty vector (FL = full length, C = cleaved). (B) qPCR for reverse-transcribed transcripts harvested from HCT116 cells transfected with 0.03–0.50 μg of a CHOP expression vector, 1.0 μg of MPZ-GFP, or 1.0 μg of the empty vector for 24 hr (n = 3 technical replicates, error bars = SD, * denotes p<0.05). (C) Representative images of automated counting for Trypan blue-stained cells, where green outlines denote non-stained (live) cells and red outlines denote stained cells (Trypan blue+, dead). (D) Average percentage of cells transfected as described in (S3A) stained with Trypan blue as quantified by automated cell counting from n = 3 biological replicates (error bars = SEM; ** denotes p=0.008 and ns = non significant for unpaired t-test with equal SD; ns1 refers to p=0.19 from unpaired t-test with Welch’s correction for variance).
Figure 1—figure supplement 3

DR5 immunoprecipitates with FADD and MPZ-GFP.
(A) Immunoprecipitation of DR5 from HCT116 transfected with MPZ-GFP or the empty vector and blotted for DR5, MPZ-GFP, and FADD. (B) Inputs for GFP pulldown performed in Figure 1F. (C) Caspase 8 activity of inputs relative to the empty vector control for the GFP pulldown performed in Figure 1F (n = 3 biological replicates, error bars = SEM, ** indicates p=0.0046, and * indicates p<0.05 from unpaired t-tests with equal SD). Source data can be found in Figure 1—source data 1.
Figure 1—figure supplement 4

Sustained overexpression of other ER-trafficked proteins induce UPR-mediated apoptosis in a DR5-dependent manner.
(A) qPCR for reverse-transcribed transcripts harvested from HCT116 cells transfected with 1.0 μg of GFP-tagged rhodopsin (RHO), proinsulin (INS), or 1.0 μg of the empty vector for 24 hr (n = 2 biological replicates, each with three technical replicates; error bars = SD; * denotes p<0.05). (B) RT-PCR for unspliced and spliced forms of Xbp1 mRNA isolated from HCT116 cells transfected for 24 hr with 1 μg of empty vector -/+ 100 nM Tg for 2 hr, MPZ-GFP, INS-GFP, or RHO-GFP. (C) Western blot of HCT116 cells transfected with siRNA against a non-targeting (Nt) control or DR5 (48 hr) followed by 1.0 μg RHO-GFP or INS-GFP (24 hr). (D) Representative flow cytometry histograms of HCT116 cells transfected with the listed siRNA and vector and stained with annexin V-AlexaFluor647. Y-axis has been scaled so that the mode = 100%. Dotted lines represent gating to distinguish staining-positive cells. Left: Histograms of fluorescence at 647 nm to measure annexin V staining. Right: Histograms of fluorescence at 488 nm to compare level and distribution of GFP-tagged protein expression. To note, GFP expression profiles for the same construct are similar between different siRNA transfected samples. (E) Average percent of annexin V-positive cells for HCT116 cells transfected with siRNA and GFP-tagged rhodopsin/proinsulin (n = 3 biological replicates, error bars = SEM, * indicates p=0.011, ** indicates p=0.005 from unpaired t-test with equal SD). Gating for annexin V-positive staining is shown in Figure 1—figure supplement 4D.
Figure 1—figure supplement 5
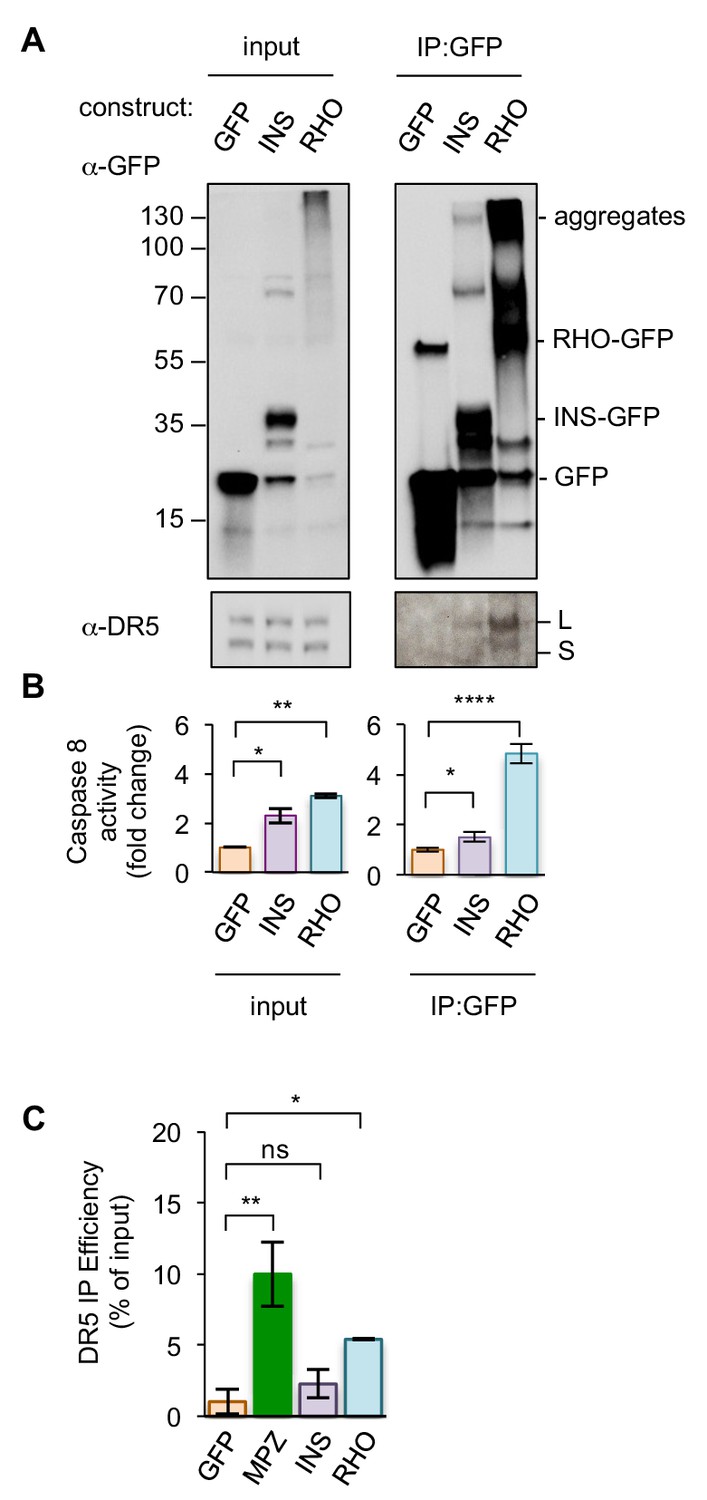
DR5 engages a selective subset of ER-trafficked client proteins upon prolonged ER stress.
(A) Pulldown of GFP-tagged proteins from HCT116 transfected with INS, RHO, or cytosolic GFP. Inputs (left) and immunoprecipitated samples (right) were immunoblotted for GFP and DR5 (L and S indicate long and short isoforms, respectively). (B) Fold change in caspase 8 activity relative to cytosolic GFP for beads with immunoprecipitated contents described in Figure 1—figure supplement 5A as measured by caspase glo 8 luminescence (n = 2 biological replicates, error bars = SEM, * indicates p<0.05, ** indicates p=0.0013, **** indicates p<0.005 from unpaired t-tests with equal SD). (C) Quantification of the percent of total DR5 recovered in the IPs of GFP-tagged proteins, shown in Figure 1G and Figure 1—figure supplement 5A. (n = 3 biological replicates for GFP and MPZ, while n = 2 biological replicates for INS and RHO. * denotes p=0.016, ** denotes p=0.0035, and ns denotes p=0.39 from unpaired t-test with equal SD) The DR5 signal of the input and IP lanes were quantified from the same exposure and then normalized to the amount loaded on the gel. Source data of blots and quantification are provided in Figure 1—source data 2.
Figure 2 with 2 supplements
Misfolded protein engages DR5 at the ER-Golgi intermediate compartment, inducing active DR5 signaling clusters.
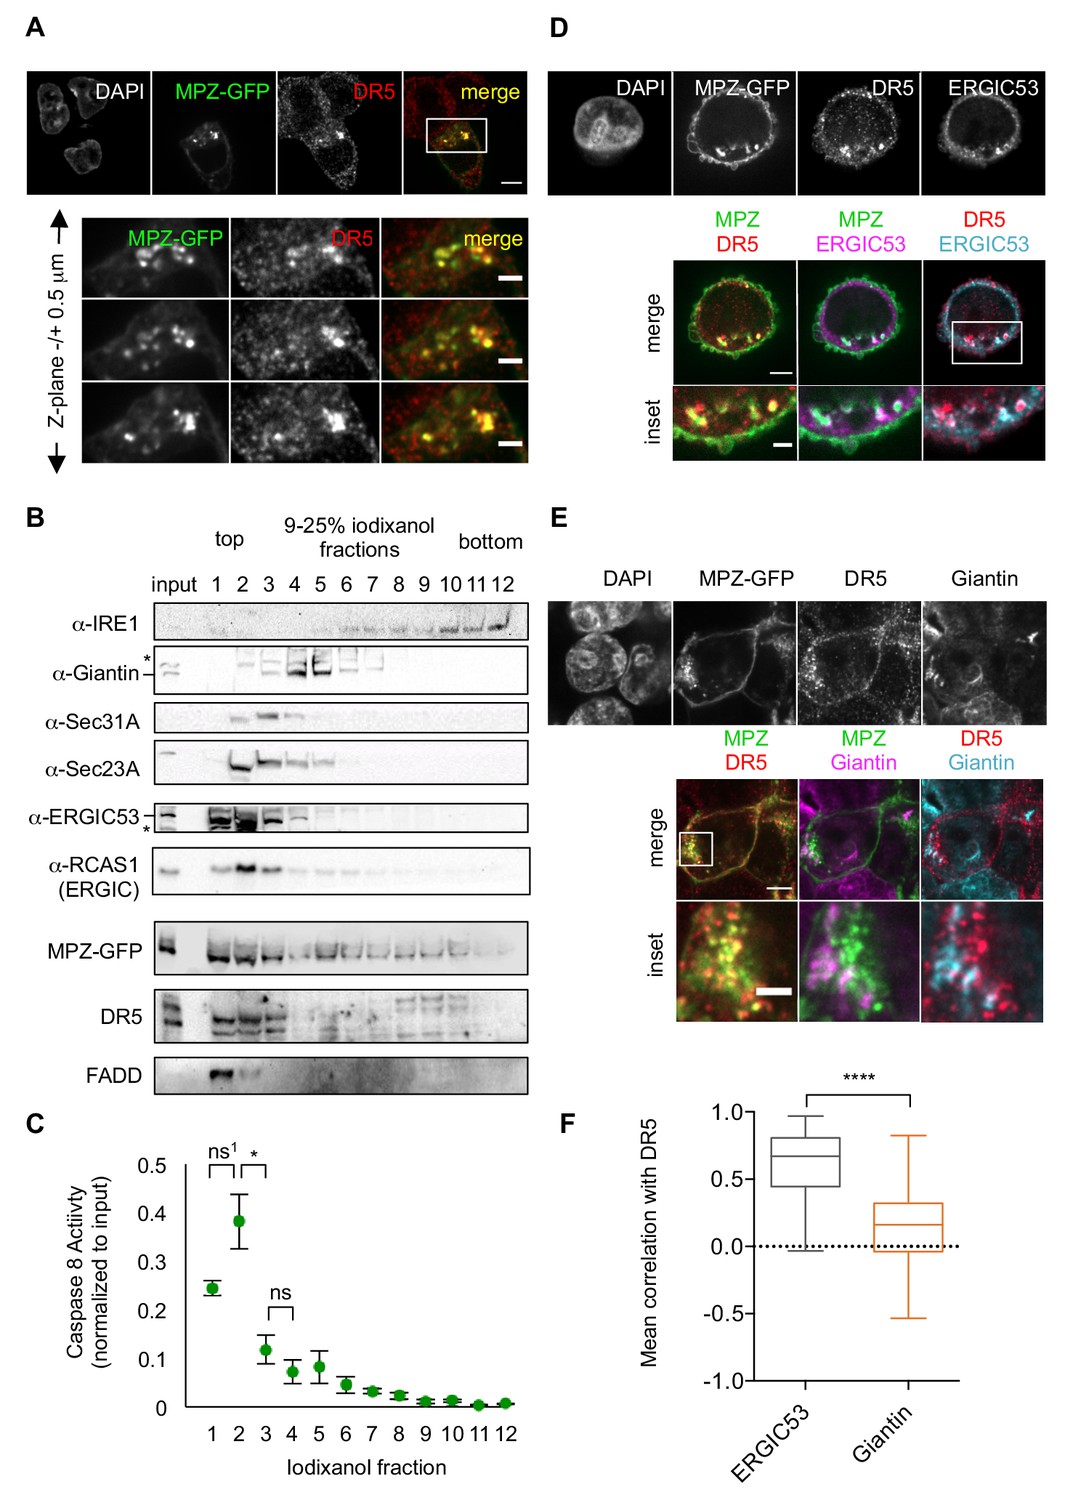
(A) Top: Immunofluorescence of HCT116 cells transfected with MPZ-GFP (green) for 24 hr and stained with anti-DR5 (red, scale bar 5 μm). Bottom: Enlargements of the inset stepping through the z-plane in 0.5 μm increments (scale bar 2 μm). (B) Subcellular fractionation of lysate expressing MPZ-GFP, where IRE1 marks the ER, Giantin marks the Golgi, Sec31A and Sec23A mark COPII vesicles, and ERGIC53 and RCAS1 correspond to ER-Golgi intermediate compartment. Bands of the expected size are indicated by “– “and bands that may represent a modified or degraded protein are indicated by *. (C) Average caspase activity of each fraction from subcellular gradient centrifugation in (B) normalized to total lysate (input) measured by caspase 8 substrate luminescence (n = 3 biological replicates, error bars = SEM; ns1 indicates p=0.079, * denotes p=0.015, and ns indicates p=0.31 from unpaired t-tests with equal SD). (D) Top: Immunostaining of DR5 and ERGIC53 in fixed HCT116 cells transfected with MPZ-GFP for 24 hr as in (A). Bottom: Merged images with ERGIC53 in magenta or cyan to depict overlapping signal as white (scale bar = 5 μm, insets scale bar = 2 μm). (E) Immunostaining of DR5 and giantin in fixed HCT116 cells expressing MPZ-GFP. Giantin is magenta in the overlay with MPZ (green) or cyan in the overlay with DR5 (red). Bottom row enlarges the inset marked in the merges images to show little overlapping signal with giantin (scale bar = 5 μm, inset scale bar = 1 μm). (F) Box-whisker plots quantifying the Pearson’s correlation per cell between DR5 and ERGIC53 (mean = 0.61 ± 0.03) or giantin (mean = 0.14 ± 0.02) within MPZ-positive cells (N > 55), where whiskers correspond to minimum and maximum values of the data (**** indicates p<0.001).
-
Figure 2—source data 1
Caspase activity for fractions of iodixanol gradient.
This excel file contains the caspase glo 8 luminescent units of the fractionation samples (n = 3 biological replicates) shown in Figure 2C.
- https://cdn.elifesciences.org/articles/52291/elife-52291-fig2-data1-v2.xlsx
Figure 2—figure supplement 1
Intracellular puncta of overexpressed MPZ and rhodopsin proteins show significant co-localization with DR5 clusters.
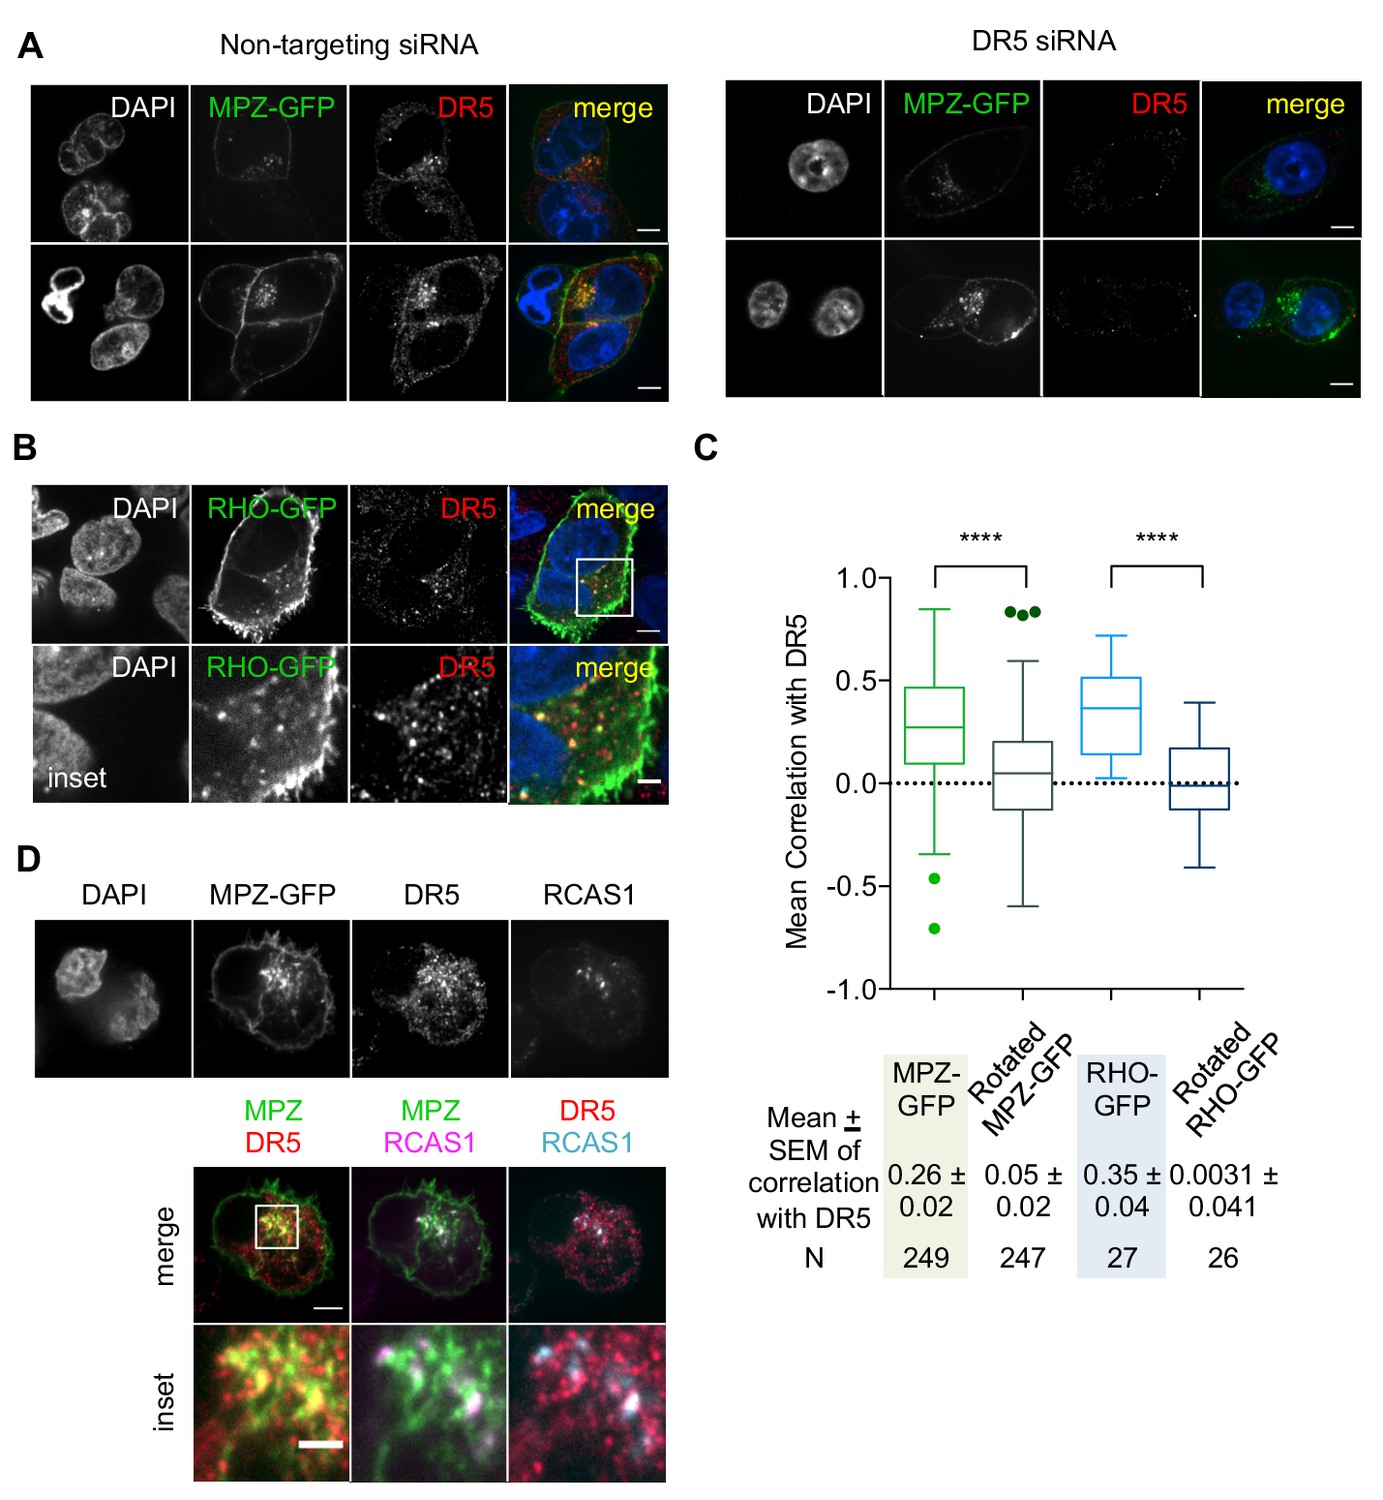
(A) Immunofluorescence of fixed HCT116 cells transfected with siRNA (left: non-targeting, right: siDR5) for 48 hr and MPZ-GFP (green in merge) for 24 hr and subsequently immunostained for anti-DR5 (red in merge). Two representative confocal images are shown for each siRNA treatment, where the scale bar corresponds to 5 μm. (B) Immunofluorescence of fixed HCT116 cells expressing RHO-GFP for 24 hr and stained for DR5 and GFP (scale bar = 5 μm, inset scale bar = 2 μm). (C) Quantification of Pearson’s correlation per cell between DR5 signal and ER-trafficked protein (MPZ and RHO) 24 hr-post transfection from original image files versus artificially rotated image files, for which the GFP channel was rotated 90o with respect to the other channel. Whisker-box plots depict the Tukey method. Statistics were performed through unpaired two-tailed t-tests, where **** indicates p<0.0001 and the variance was non-significant. (D) Immunofluorescence for DR5 and RCAS1 in fixed HCT116 cells expressing MPZ-GFP. RCAS1 is magenta in the overlay with MPZ (green) or cyan in the overlay with DR5 (red), where white puncta signify co-localized signal (scale bar = 5 μm, inset scale bar = 1 μm).
Figure 2—figure supplement 2
Misfolded protein accumulation in the ERGIC precedes DR5 retention in the ERGIC.
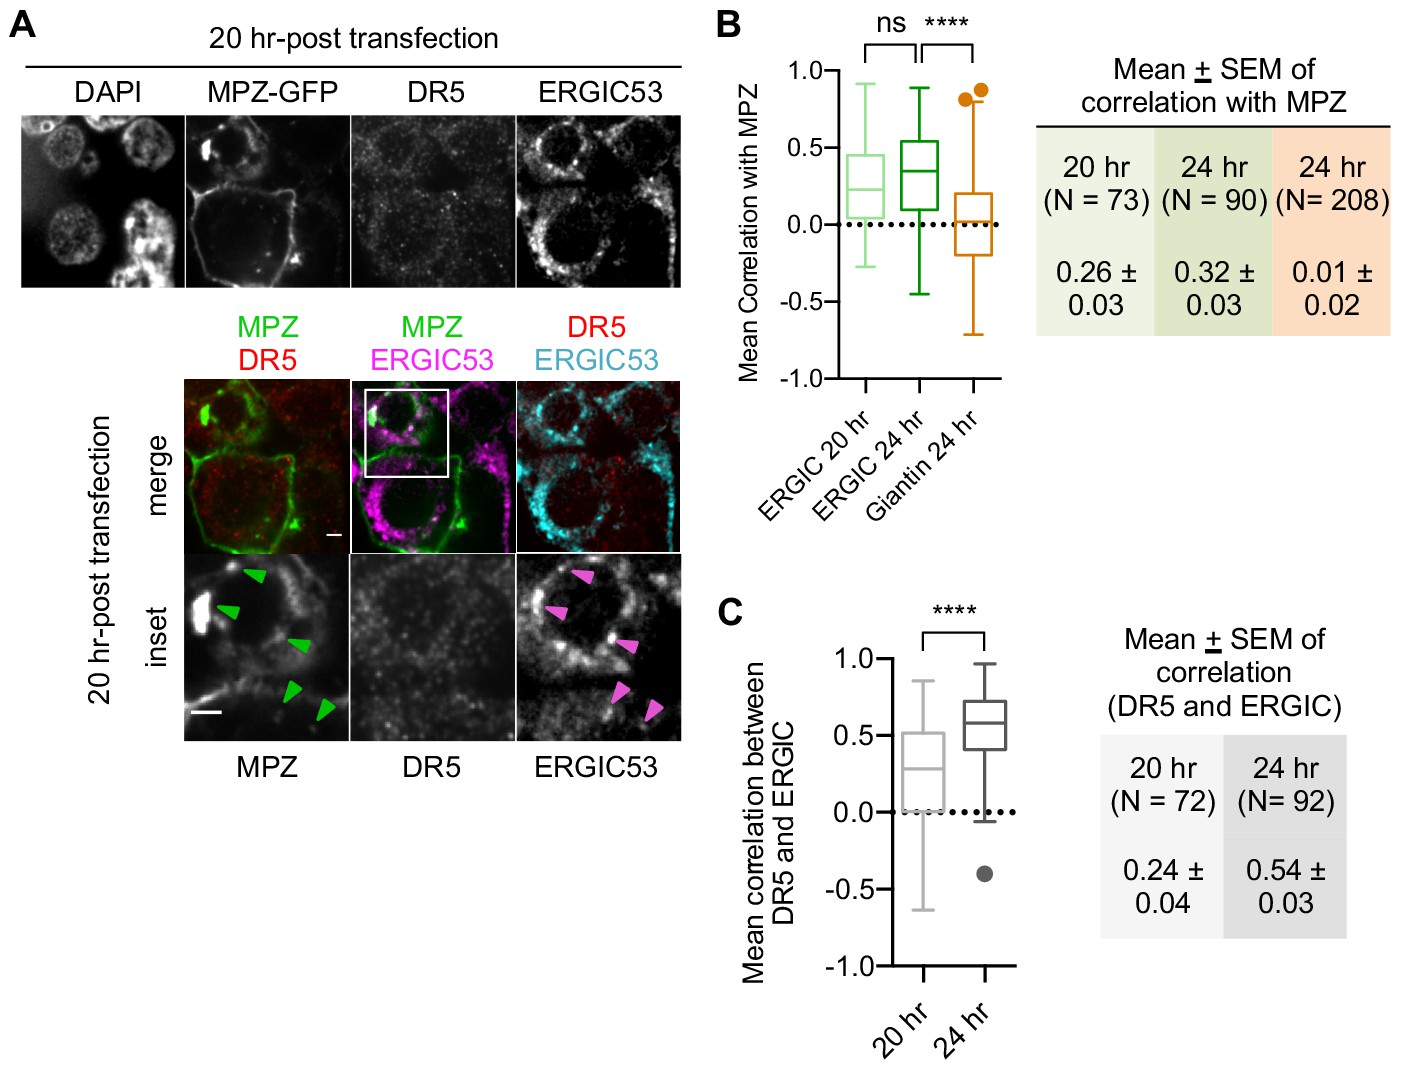
(A) Immunofluorescence for DR5 and ERGIC53 in HCT116 fixed 20 hr post-transfection. ERGIC53 is magenta in the overlay with MPZ (green) or cyan in the overlay with DR5 (red) (scale bar = 5 μm). Arrows in inset images depict regions where MPZ and ERGIC53 signal overlap (scale bar = 2 μm). (B) Quantification of Pearson’s correlation per cell between ERGIC and MPZ, or Giantin and MPZ of fixed HCT116 cells at the specified time after MPZ-GFP transfection. Whisker-box plots depict the Tukey method. Statistics were performed through unpaired two-tailed t-tests, where **** indicates p<0.001 and ns means not significant, and the variance was non-significant. (C) Quantification of Pearson’s correlation per cell between DR5 signal and ERGIC53 of fixed HCT116 cells at 20 hr and 24 hr post-transfection with MPZ-GFP. Whisker-box plots depict the Tukey method. Statistics were performed through unpaired two-tailed t-tests, where **** indicates p<0.001 and the variance was non-significant.
Figure 3 with 2 supplements
Direct binding of exposed ER-trafficked protein sequences to the DR5 ECD is sufficient to induce oligomerization.
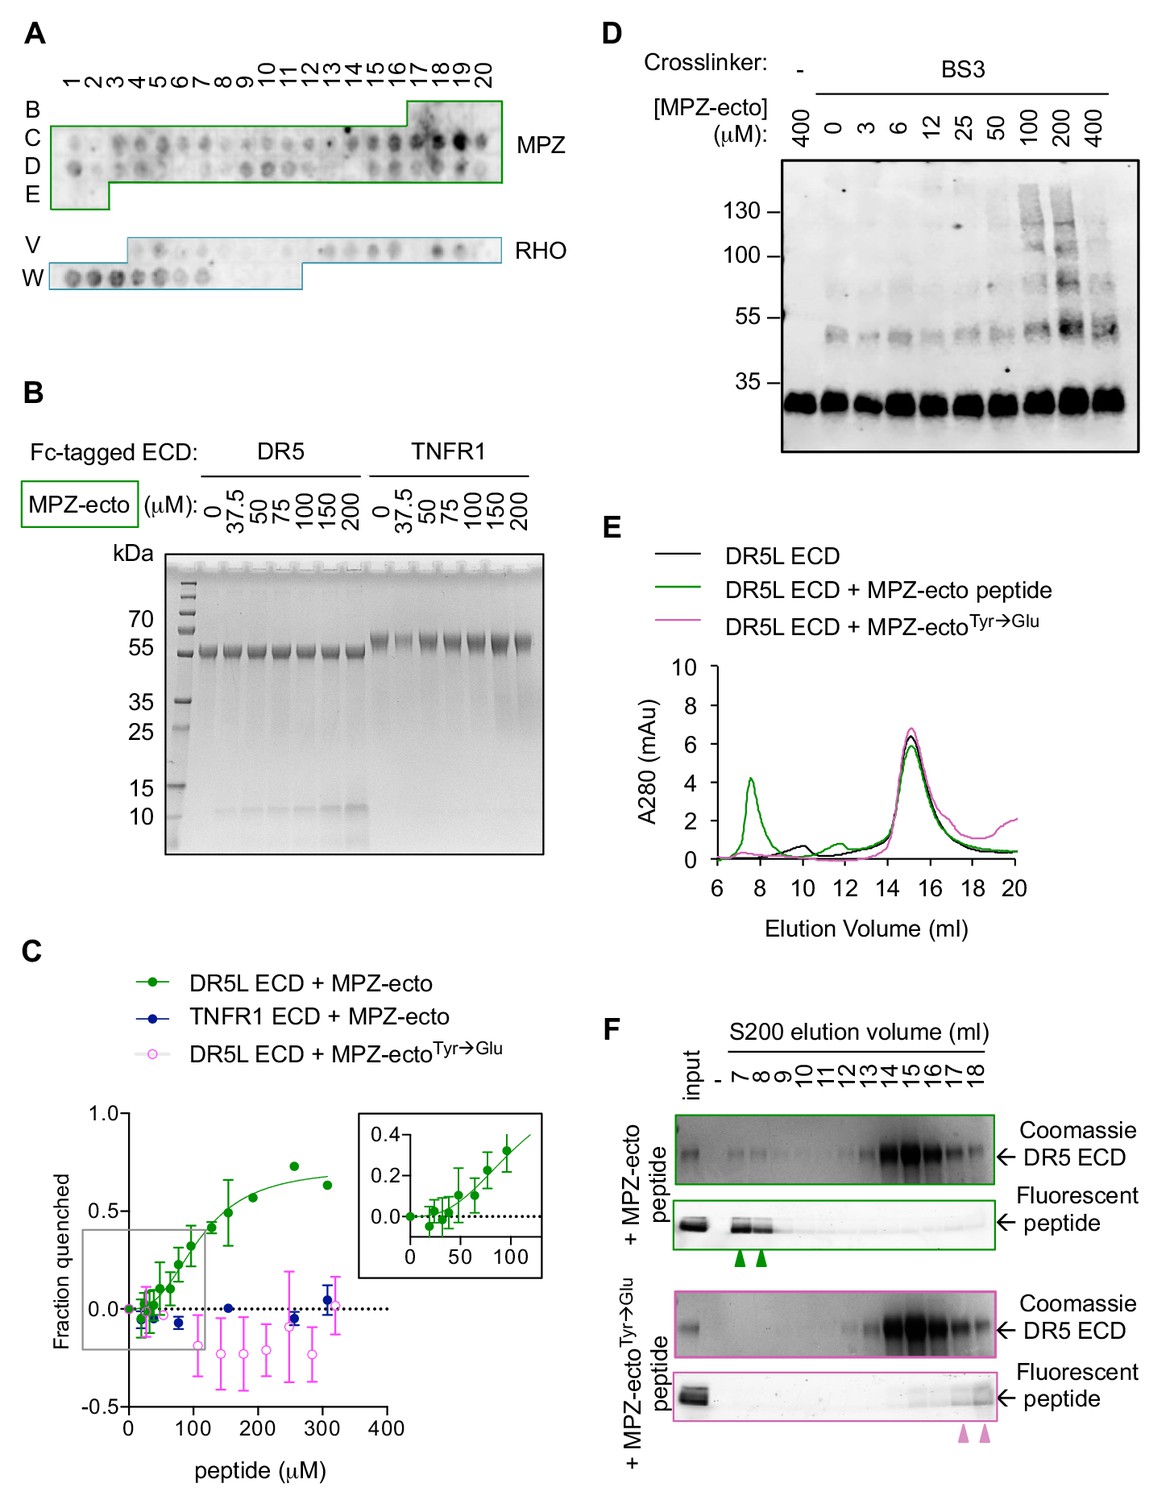
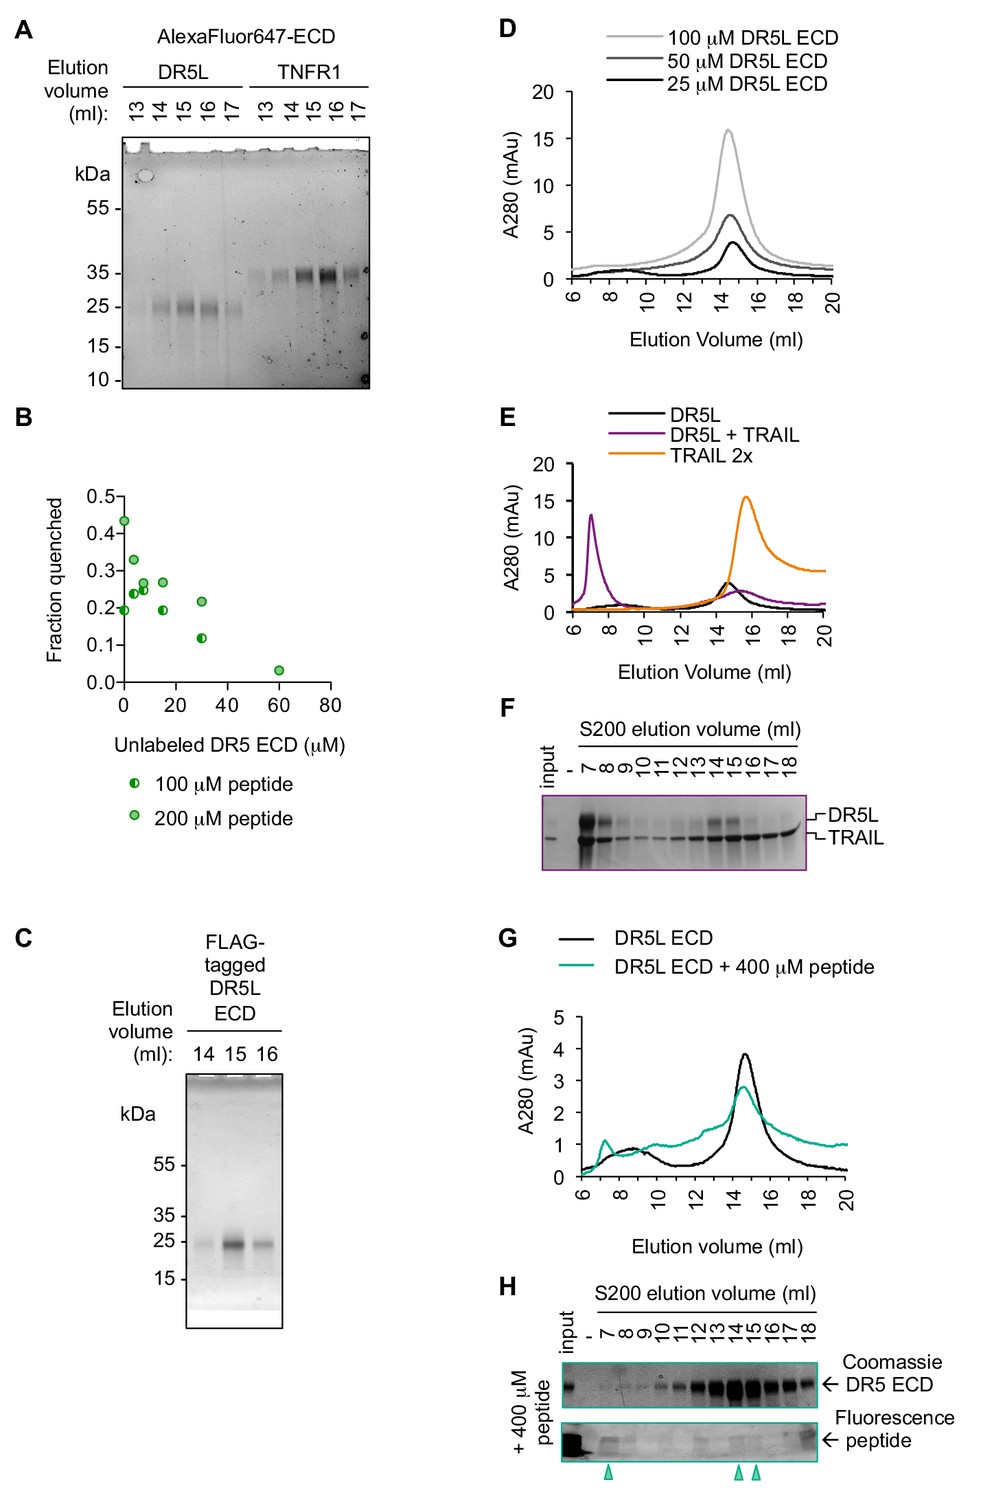
(A) A peptide array tiled with sequences from the ectodomain of myelin protein zero (MPZ) and extracellular loops from rhodopsin (RHO) was incubated with Fc-tagged DR5 ectodomain domain (long isoform, 500 nM). Signal was obtained by probing with anti-Fc. (B) Coomassie stained SDS-PAGE gel of pulldown on Fc-tagged DR5L ECD (55 kDa) or TNFR1 ECD (65 kDa) incubated with increasing concentrations of the MPZ-ectoVD peptide (apparent MW of 10 kDa, see 'Amino acid sequences of MPZ-derived peptides' for sequence). (C) Fluorescence quenching of AlexaFluor647-DR5L (green) or TNFR1 ECD (blue) was measured with increasing MPZ-ecto peptide to quantify the binding affinity, whereas quenching was not observed with the mutated MPZ-ectoTyr→Glu peptide (magenta) (N = 3, error bars are SD). DR5L ECD binds to the MPZ-ecto peptide with a K1/2 of 109 ± 11 μM with a hill coefficient of 2.6 ± 0.5. (D) SDS-PAGE of recombinant FLAG-tagged DR5L ECD (25 kDa, 10 μM) incubated with MPZ-ecto peptide at the noted concentrations and treated with the amine crosslinker BS3 (100 μM), probed with anti-FLAG. (E) Size exclusion chromatographs of absorbance at 280 nm for 25 μM recombinant DR5L ECD alone (black), pre-incubated with 100 μM fluorescein-conjugated MPZ-ecto peptide (green) or 100 μM fluorescein-conjugated MPZ-ectoTyr→Glu peptide (magenta). (F) SDS-PAGE gels scanned for fluorescence and then stained with Coomassie for eluted size exclusion fractions in (E). Green outlines (top pair) correspond to fractions from DR5L pre-incubated with MPZ-ecto peptide, and magenta outlines (bottom pair) correspond to DR5L with MPZ-ectoTyr→Glu peptide. Lane marked by “-“ denotes a blank lane between the input and 7 ml fraction to minimize spillover of signal from input sample. Arrowheads mark detectable peptide fluorescence in the indicated fractions.
-
Figure 3—source data 1
Sequences and quantification of peptides probed with Fc-DR5 ECD on the peptide array.
This excel file contains the peptide sequences of the peptide array shown in Figure 3A, the quantification of DR5 ECD detected for each spot, and the analysis for enriched amino acids in Figure 3—figure supplement 1.
- https://cdn.elifesciences.org/articles/52291/elife-52291-fig3-data1-v2.xlsx
Figure 3—figure supplement 1
DR5 ECD binds to selective subset of sequences displayed by the secretory proteome.
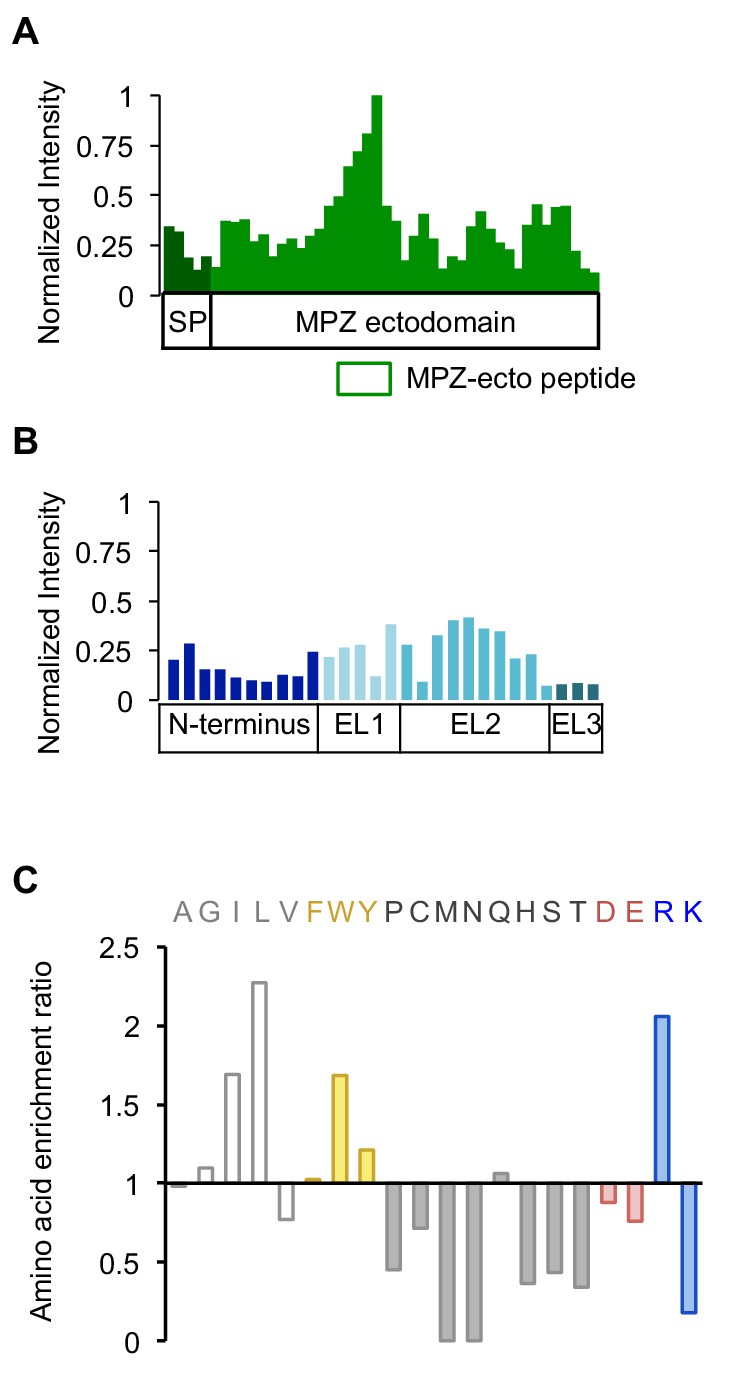
(A) Intensity values of each peptide spot in the MPZ section of the peptide array in Figure 3A were normalized to the spot of highest intensity within MPZ. Green box below denotes the peptide chosen as a candidate binder, called MPZ-ecto, shown in spots C18-C19 on the array. Sequences for the peptides are listed in Figure 3—source data 1. (B) Intensity values of the RHO peptide array section in Figure 3A normalized to the highest intensity from MPZ. Peptides were derived from the extracellular N-terminus tail and the extracellular loops (EL1-EL3) that connect the transmembrane domains of rhodopsin. (C) Quantification of enriched amino acids from peptides with an intensity value greater than one standard deviation above the average signal, noted as a preferred peptide, within the entire array. Enrichment ratio for each amino acid was calculated as the frequency of occurrence in preferred peptides divided by its total frequency on the array.
Figure 3—figure supplement 2
Purified recombinant DR5 ECD oligomerizes with peptide in a specific and reversible manner.
(A) Fluorescence scan at 647 nm of SDS-PAGE for gel filtration-purified DR5L (25 kDa) or TNFR1 ECD (35 kDa) labeled with NHS-ester AlexaFluor647. These proteins were used in the fluorescence quenching assays shown in Figure 3C. (B) Fluorescence de-quenching of AlexaFluor647-DR5L ECD (200 nM) pre-incubated with 100 μM or 200 μM of MPZ-ecto peptide in the presence of increasing concentrations of unlabeled DR5L ECD. (C) Coomassie-stained SDS-PAGE of gel filtration purified FLAG-tagged DR5L ECD proteins used for the crosslinking assay in Figure 3D and size exclusion chromatography in Figure 3E. (D) Size exclusion chromatographs of absorbance at 280 nm for recombinant DR5L ECD to show that increased concentration of DR5L alone does not yield multimers. (E) Size exclusion chromatographs of absorbance at 280 nm for recombinant DR5L ECD alone (25 μM, black) or incubated with TRAIL (25 uM, purple). Trace for TRAIL alone (50 μM) is shown in light orange. (F) SDS-PAGE gels stained with Coomassie blue for eluted size exclusion fractions in Figure 3—figure supplement 2E depicting bands for DR5L ECD and TRAIL. (G) Size exclusion chromatographs of absorbance at 280 nm for 25 μM recombinant DR5L ECD alone (black), pre-incubated with 400 μM fluorescein-conjugated MPZ-ecto peptide (teal). (H) SDS-PAGE gels scanned for fluorescence and then stained with Coomassie for eluted size exclusion fractions in Figure 3—figure supplement 2G. Lane marked by “-“ denotes a blank lane between the input and 7 ml fraction to minimize spillover of signal from input sample. Arrowheads mark detectable peptide fluorescence in the indicated fractions.
Figure 4 with 3 supplements
Disrupting misfolded protein binding to DR5 impairs ER stress-induced apoptosis.
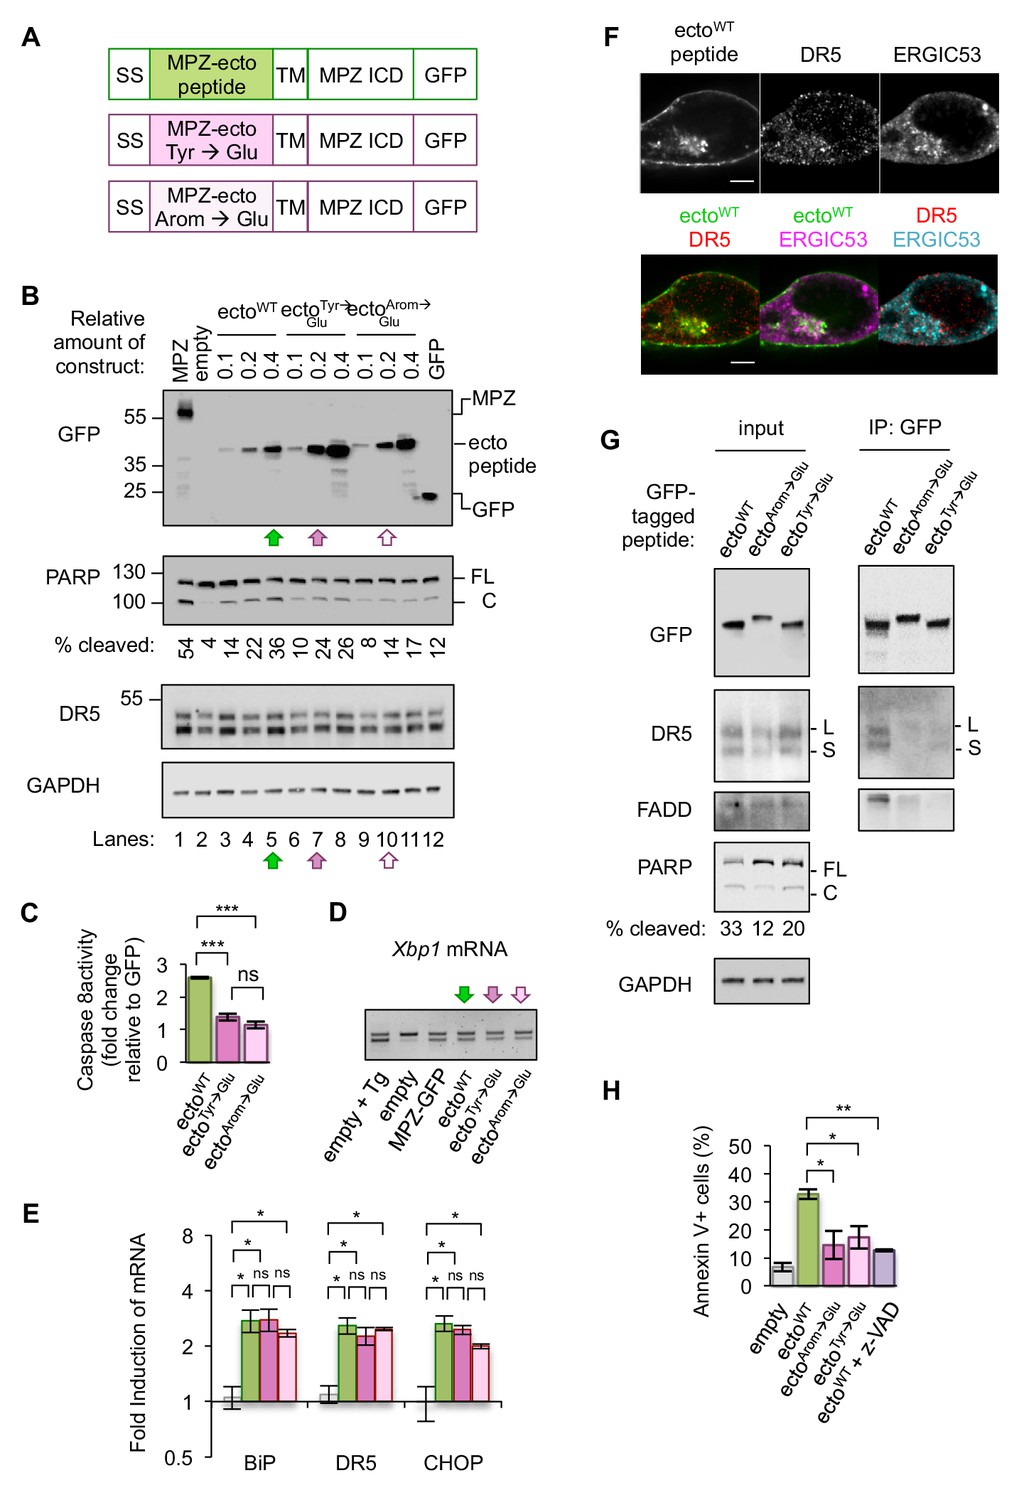
(A) Diagram of constructs generated to replace the MPZ ectodomain with the minimal DR5-binding MPZ-ecto peptide (green), the peptide harboring Tyr → Glu mutations (magenta), or the peptide with all aromatic residues (Arom) mutated to Glu (light pink). SS = signal sequence of MPZ, TM = transmembrane domain, ICD = intracellular domain. (B) Western blot of HCT116 cell lysates harvested 24 hr post-transfection with 1 μg of MPZ-GFP plasmid, empty vector, or a titration of GFP-tagged MPZ-ecto peptide variants, followed by GFP alone. FL denotes full-length PARP, while C denotes cleaved PARP. The percentage of cleaved PARP was calculated as the signal of cleaved PARP divided by total PARP (FL + C). Arrows denote conditions carried forward for normalized expression levels of the ecto peptide constructs. (C) Fold change in caspase8 activity relative to GFP expression, as measured by incubation of luminescent caspase glo 8 substrate with lysates from HCT116 transfected using conditions described in Figure 4B lanes 5, 7 and 10 (error bars represent SEM of n = 3 biological replicates; *** denotes p<0.005, and ns indicates p=0.18 from unpaired t-tests with equal SD). (D) RT-PCR for unspliced and spliced forms of Xbp1 mRNA isolated from HCT116 cells transfected for 24 hr with the empty vector + / - 100 nM Tg, or with MPZ-GFP, or MPZ-ecto peptide-GFP and its mutant variants (Tyr → Glu and Arom → Glu) using conditions from Figure 4B, lanes 5, 7, and 10. (E) qPCR for reverse-transcribed transcripts harvested from HCT116 cells transfected with the constructs described in 4A, using conditions shown in Figure 4B lanes 5, 7, and 10. (n = 3 biological replicates, * denotes p<0.05 and ns = non significant). (F) Immunofluorescence for DR5 and ERGIC53 in HCT116 transfected with the MPZ-ecto peptide for 24 hr. ERGIC53 is magenta in the overlay with MPZ (green) or cyan in the overlay with DR5 (red) (scale bar = 5 μm). (G) Left: Immunoblots of HCT116 lysate inputs expressing the constructs described in 4A, where L and S mark the long and short isoforms of DR5, respectively, and where FL and C mark the full-length and cleaved fragments of PARP, respectively. The percentage of cleaved PARP is quantified as the signal of the cleaved fragment divided by total PARP (FL + C). Right: Immunoprecipitation of GFP-tagged proteins from the lysates shown in (C), where L and S denote the long and short isoforms of DR5, respectively. (H) Average percent of annexin V staining for HCT116 cells transfected as described in C) and D) from n = 3 biological replicates (error bars = SEM, * indicates p=0.026, and ** indicates p=0.003 from unpaired t-tests with equal SD). See Figure 4—figure supplement 3 for distribution of early vs late apoptotic cells.
-
Figure 4—source data 1
Westerns and quantification of DR5 recovered on IPs.
This zip archive contains tif files of the Westerns from inputs and IPs of the MPZ-ecto peptides (n = 2 biological replicates) used to quantify the percent of DR5 recovered shown in Figure 4—figure supplement 3A.
- https://cdn.elifesciences.org/articles/52291/elife-52291-fig4-data1-v2.zip
-
Figure 4—source data 2
Caspase glo 8 measurements for MPZ-ecto peptide expression.
This zip archive contains the measured luminescent units for caspase glo 8 activity shown in Figure 4C (lysates) and the coomassie gel used to normalize lysate concentration as a.tif file.
- https://cdn.elifesciences.org/articles/52291/elife-52291-fig4-data2-v2.zip
-
Figure 4—source data 3
qPCR and statistical analysis for expression of MPZ-ecto peptides.
This zip archive contains the compiled excel file for qPCR data shown in Figure 4E along with the Prism six file used to perform multiple t-tests with Holm-Sidak correction for multiple comparisons.
- https://cdn.elifesciences.org/articles/52291/elife-52291-fig4-data3-v2.zip
-
Figure 4—source data 4
FCS files and quantification of annexin V staining for MPZ-ecto peptides.
This zip archive contains FCS files from n = 3 biological replicates of HCT116 transfected with the conditions outlined in Figure 4H. The excel file contains the quantification of annexin V staining exported frow FlowJo.
- https://cdn.elifesciences.org/articles/52291/elife-52291-fig4-data4-v2.zip
Figure 4—figure supplement 1
Introducing Glu mutations to the DR5-binding sequence of MPZ disrupts PARP cleavage in a DR5-dependent manner.
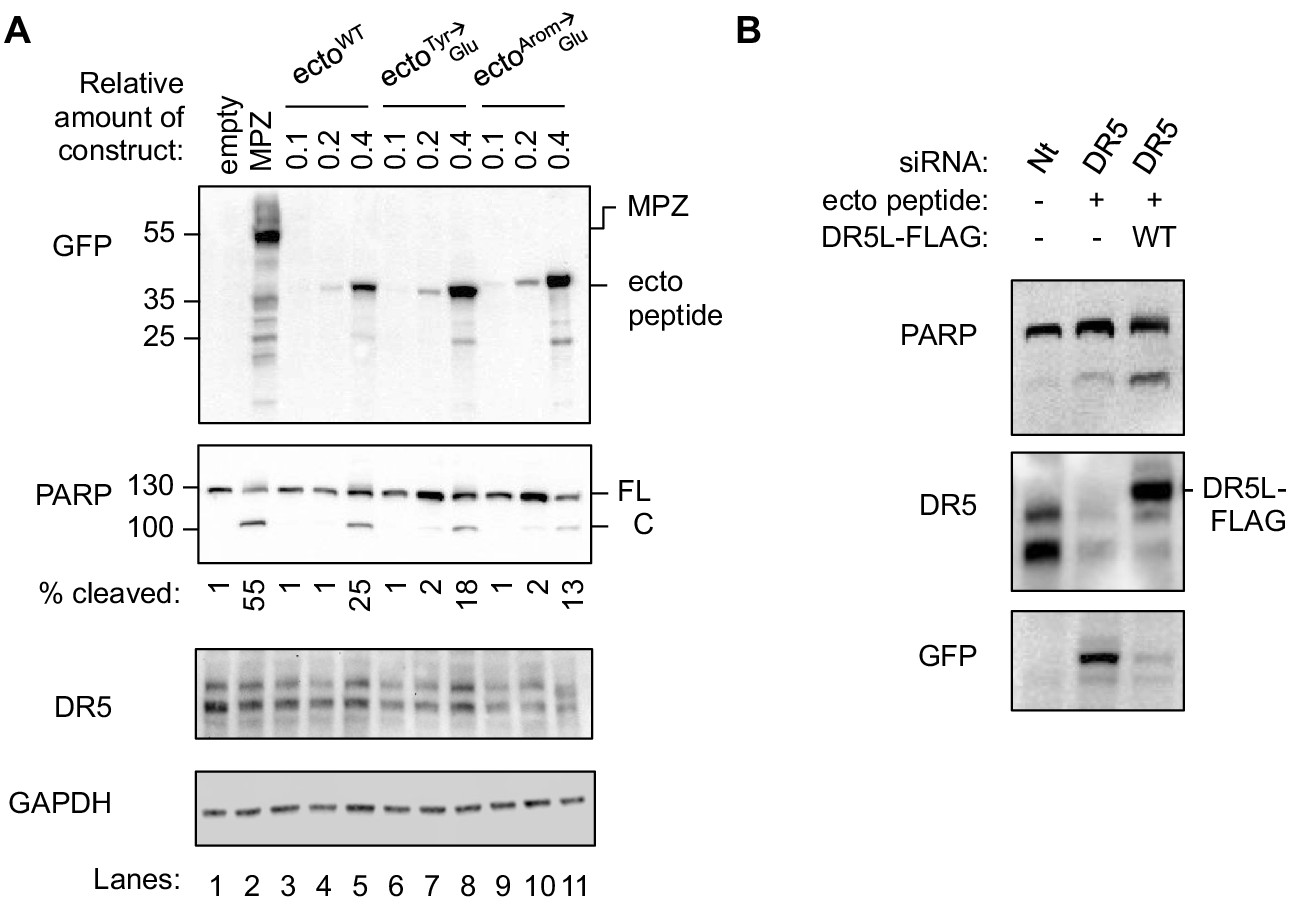
(A) Western blot of HepG2 cell lysates harvested 24 hr post-transfection with 1 μg of the empty vector, MPZ-GFP, or a titration of GFP-tagged MPZ-ecto peptide variants. FL denotes full-length PARP, while C denotes cleaved PARP. The percentage of cleaved PARP was calculated as the signal of cleaved PARP divided by total PARP (FL + C). (B) Western blot of HCT116 cell lysates transfected with siRNA against a non-targeting (Nt) sequence or DR5 (referred to as DR5-siRNA-2 in Materials and methods) for 48 hr and co-expressing FLAG-tagged DR5 long isoform and/or MPZ-ecto peptide-GFP.
Figure 4—figure supplement 2
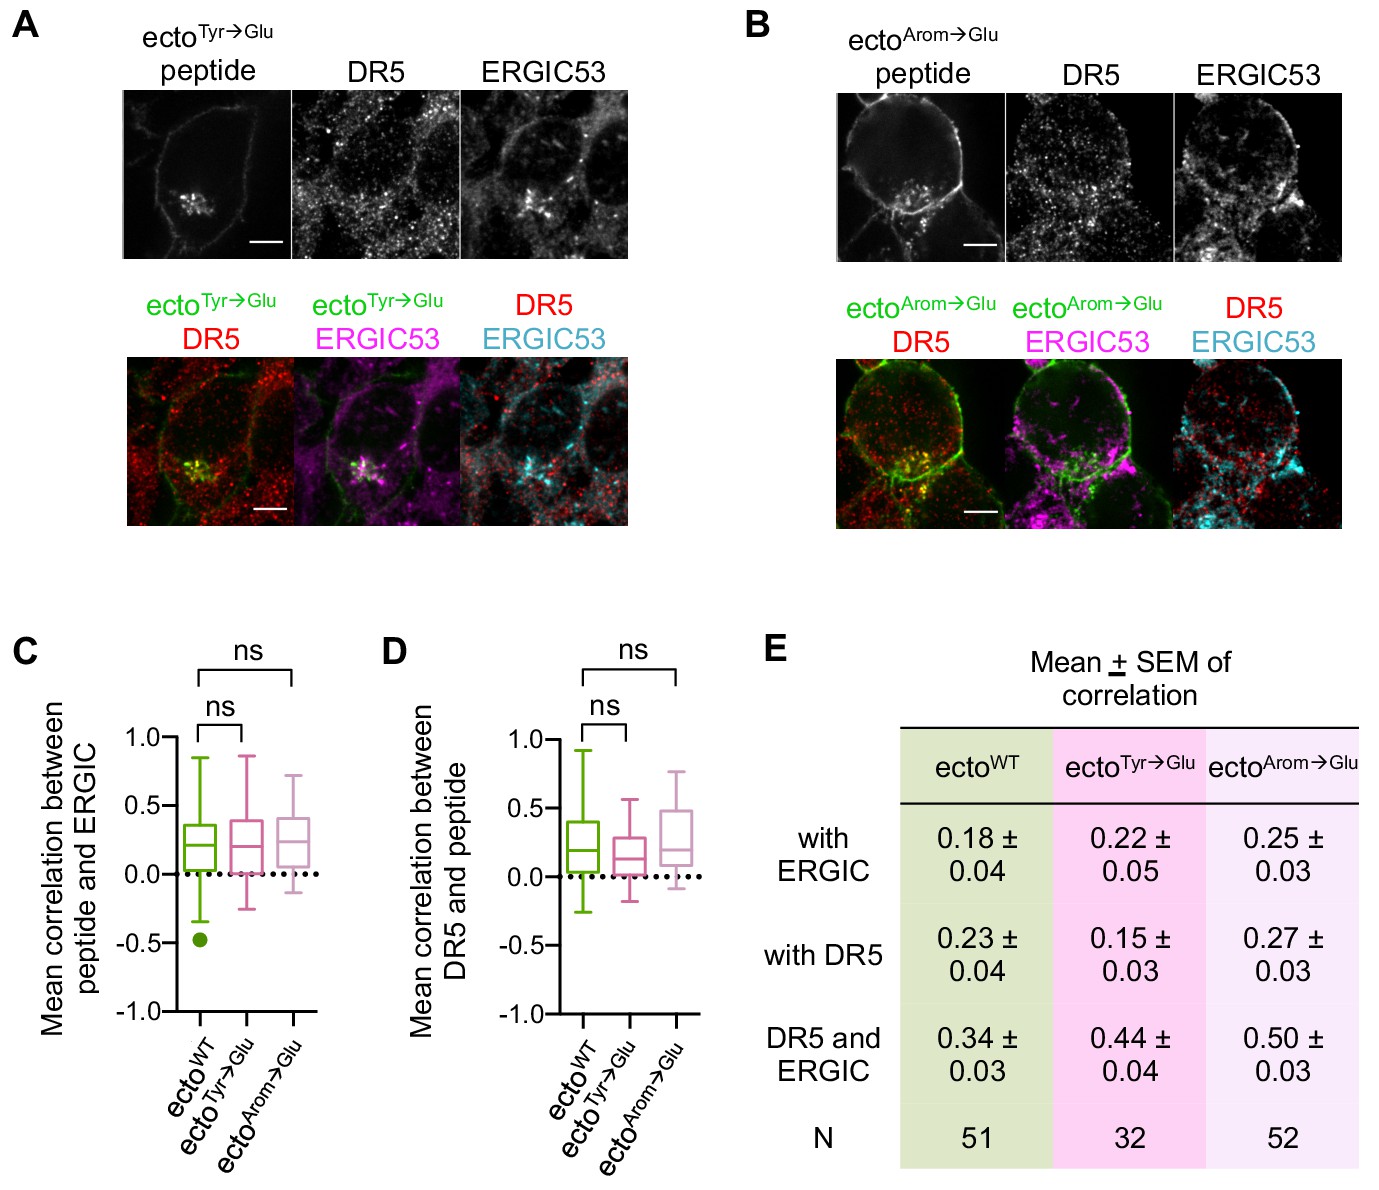
Glu-containing mutants of MPZ-ecto peptide accumulate in the ERGIC.
(A) Immunofluorescence for DR5 and ERGIC53 in HCT116 transfected with the MPZ-ecto Tyr-to-Glu peptide for 24 hr. ERGIC53 is magenta in the overlay with MPZ (green) or cyan in the overlay with DR5 (red) (scale bar = 5 μm). (B) Immunofluorescence for DR5 and ERGIC53 in HCT116 transfected with the MPZ-ecto Arom-to-Glu peptide for 24 hr. ERGIC53 is magenta in the overlay with MPZ (green) or cyan in the overlay with DR5 (red) (scale bar = 5 μm). (C) Quantification of Pearson’s correlation per cell between ERGIC53 and GFP-tagged peptides of fixed HCT116 cells at 24 hr post-transfection with MPZ-ecto peptide (green) and the Glu-containing peptide mutants (dark and light pink). Whisker-box plots depict the Tukey method. Statistics were performed through unpaired two-tailed t-tests, where ns indicates p>0.50. (D) Quantification of Pearson’s correlation per cell between DR5 and GFP-tagged peptides of fixed HCT116 cells at 24 hr post-transfection with MPZ-ecto peptide (green) and the Glu-containing peptide mutants (dark and light pink). Whisker-box plots depict the Tukey method. Statistics were performed through unpaired two-tailed t-tests with equal SD, where ns means p>0.11. (E) Table summarizing the mean ± SEM of the Pearson’s correlation per cell shown in Whisker-box plots of C-D.
Figure 4—figure supplement 3
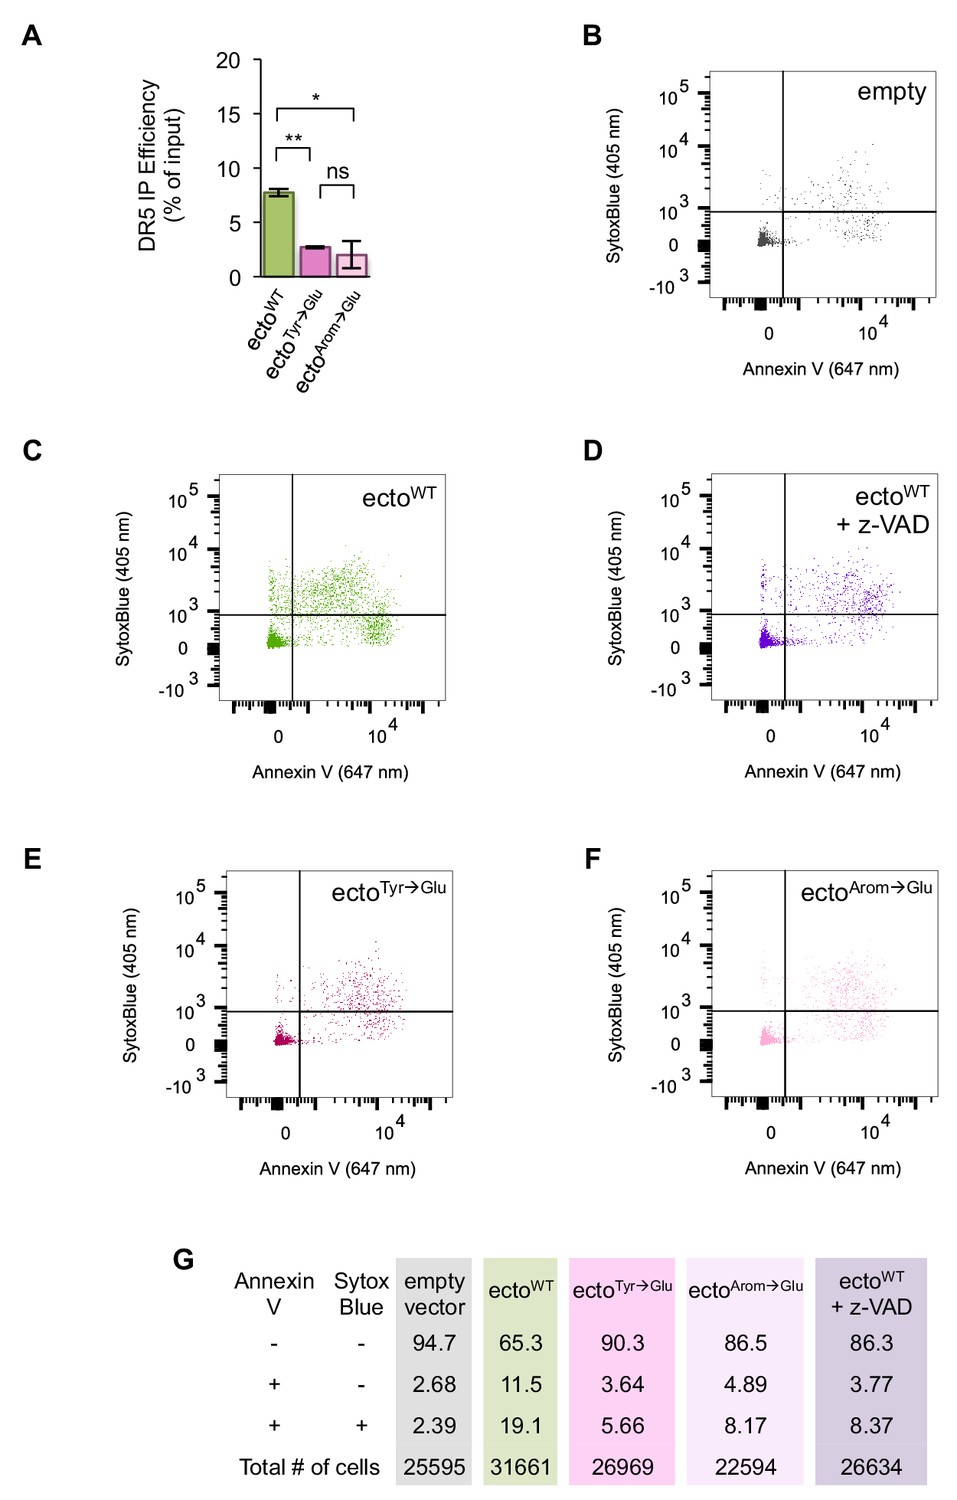
MPZ-ecto peptide engagement of DR5 in cells drives apoptotic cell death.
(A) Quantification of the percent of total DR5 recovered in the IPs of GFP-tagged MPZ-ecto peptides, shown in Figure 4G. (n = 2 biological replicates. * denotes p=0.047, ** denotes p=0.0054, and ns indicates p=0.62 from unpaired t-test with equal SD.) The DR5 signal of the input and IP lanes were quantified from the same exposure and then normalized to the amount loaded on the gel. Source data of blots and quantification are provided in Figure 4—source data 1. (B) Flow cytometry measurements of SytoxBlue (405 nm) and annexin V (647 nm) staining of HCT116 transfected with empty vector for 24 hr. (C) Flow cytometry measurements of SytoxBlue (405 nm) and annexin V (647 nm) staining of HCT116 transfected with GFP-tagged MPZ-ecto peptide for 24 hr. (D) Flow cytometry measurements of SytoxBlue (405 nm) and annexin V (647 nm) staining of HCT116 transfected with GFP-tagged MPZ-ecto peptide and co-treated with 20 μm of z-VAD for 24 hr. (E) Flow cytometry measurements of SytoxBlue (405 nm) and annexin V (647 nm) staining of HCT116 transfected with GFP-tagged MPZ-ecto Tyr→Glu peptide for 24 hr. (F) Flow cytometry measurements of SytoxBlue (405 nm) and annexin V (647 nm) staining of HCT116 transfected with GFP-tagged MPZ-ecto Arom→Glu peptide for 24 hr. (G) Table summarizing percent of cells stained in each quadrant of plots shown in B-F.
Author response image 1
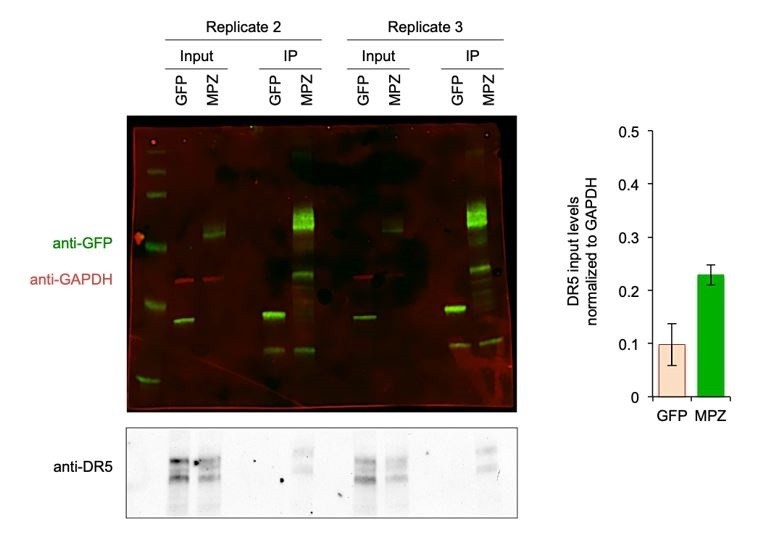
Biological Replicates for MPZ-GFP Pulldown of DR5.
(Left) Additional replicates of the MPZ-GFP IP from Figure 1G with signal for GFP and MPZ shown in green, GAPDH shown in red, and DR5 shown in grey; (Right) Quantification of DR5 signal in IP lanes normalized to GAPDH (n = 2 biological replicates, error bars are SD).
Tables
Key resources table
| Reagent type (species) or resource | Designation | Source or reference | Identifiers | Additional information |
|---|---|---|---|---|
| Gene (Homo- sapiens) | DR5 | O14763 (TR10B_HUMAN) | ||
| Gene (Homo- sapiens) | INS (proinsulin) | P01308 (INS_HUMAN) | ||
| Gene (Homo- sapiens) | MPZ (myelin protein zero) | P25189 (MYP0_HUMAN) | ||
| Gene (Homo- sapiens) | RHO (rhodopsin) | P08100 (OPSD_HUMAN) | ||
| Cell line (Homo-sapiens) | HCT116 | ATCC | CCL-247 | |
| Cell line (Homo-sapiens) | HepG2 | ATCC | CRL-10741 | |
| Transfected construct (Homo sapiens) | CHOP (canonical isoform) | this paper | expression of CHOP in absence of ER stress used in Figure 1—figure supplement 2 | |
| Transfected construct (Homo sapiens) | cytosolic GFP | this paper | expression of GFP used in Figure 1C-H | |
| Transfected construct (Homo sapiens) | DR5 long FLAG-His6x, WT with silent mutation | this paper | expression of DR5 long isoform-FLAG, harbors silent nt mutations within signal sequence to evade siRNA (AAGACCCTTGTGCTCGTTGTC à AAaACaCTTGTGCTCGTTGTC) used in Figure 4—figure supplement 1 | |
| Transfected construct (Homo sapiens) | DR5siRNA-2 | Dharmacon | siRNA | AAG ACC CUU GUG CUC GUU GUC UU, knockdown in Fig S9B |
| Transfected construct (Homo sapiens) | empty vector (no GFP) | this paper | empty vector used in Figures 1 and 4B, E | |
| Transfected construct (Homo sapiens) | MPZ-ecto peptide-eGFP | this paper | expression of MPZ-ecto peptide (FTWRYQPEGGRDAISIFHYA) used in Figure 4 | |
| Transfected construct (Homo sapiens) | MPZ-ecto peptideArom→Glu-eGFP | this paper | expression of MPZ-ectoArom->Glu peptide (ETEREQPEGGRDAISIEHEA) used in Figure 4 | |
| Transfected construct (Homo sapiens) | MPZ-ecto peptideTyr→Glu-eGFP | this paper | expression of MPZ-ectoTyr->Glu peptide (FTWREQPEGGRDAISIFHEA) used in Figure 4 | |
| Transfected construct (Homo sapiens) | MPZ-eGFP | this paper | expression of MPZ used in Figures 1 and 2, 4E | |
| Transfected construct (Homo sapiens) | Nt siRNA | Dharmacon | siRNA | AAA CCU UGC CGA CGG UCU ACC UU |
| Transfected construct (Homo sapiens) | ON-TARGETplus Human TNFRSF10B 8795 siRNA | Dharmacon | L-004448-00-0005 | Figure 1 knockdowns |
| Transfected construct (Homo sapiens) | ON-TARGETplus Non-targeting siRNA #2 | Dharmacon | D-001810-02-05 | Figure 1 knockdowns |
| Transfected construct (Homo sapiens) | proinsulin (INS) -GFP | this paper | expression of INS-GFP used in Figure 1—figure supplements 4 and 5 | |
| Transfected construct (Homo sapiens) | rhodopsin (RHO) -GFP | this paper | expression of RHO-GFP used in Figure 1—figure supplements 4 and 5, Figure 2—figure supplement 1 | |
| Antibody | anti-caspase 3 (rabbit) | Cell Signaling Technology | 9662 | 1:1000 for Westerns |
| Antibody | anti-caspase 8 5F7 (mouse) | MBL International | M032-3 | 1:1000 for Westerns |
| Antibody | anti-cleaved caspase 8 (Asp391) (18C8) (rabbit) | Cell Signaling Technology 9496 | 9496 | 1:50 for IF fixed with 4% PFA |
| Antibody | anti-DR5 (rabbit) | Cell Signaling Technology | 8074 | 1:1000 for Westerns |
| Antibody | anti-DR5 3H3 (mouse) | Genentech | 1:100 for IF fixed with 4% PFA | |
| Antibody | anti-ERGIC53 (rabbit) | Sigma Aldrich | E1031 | 1:1000 for Westerns |
| Antibody | anti-ERGIC53 (rabbit) | Sigma Aldrich E1031 | E1031 | 1:100 for IF fixed with methanol |
| Antibody | anti-FADD (mouse) | BD Biosciences | 610400 | 1:1000 for Westerns |
| Antibody | anti-Fc (mouse) | One World Lab | #603–510 | 1:1000 for Westerns |
| Antibody | anti-FLAG M2 (mouse) | Sigma | F1804 | 1:1000 for Westerns |
| Antibody | anti-GAPDH (rabbit) | Abcam | 9485 | 1:1000 for Westerns |
| Antibody | anti-GFP (mouse) | Roche | 11814460001 | 1:1000 for Westerns |
| Antibody | anti-Giantin (rabbit) | Abcam | ab24586 | 1:1000 for Westerns |
| Antibody | anti-Giantin (rabbit) | Abcam ab24586 | ab24586 | 1:1000 for IF fixed with methanol |
| Antibody | anti-His 6x (mouse) | Abcam | ab15149 | 1:1000 for Westerns |
| Antibody | anti-IRE1 14C10 (rabbit) | Cell Signaling Technology | 3294 | 1:1000 for Westerns |
| Antibody | anti-mouse-AlexaFluor546 | Invitrogen | A11030 | 1:1000 for IF, centrifuged at 15000xg for 20 mins at 4°C to remove aggregates |
| Antibody | anti-PARP (rabbit) | Cell Signaling Technology | 9542 | 1:1000 for Westerns |
| Antibody | anti-rabbit-AlexaFluor633 | Invitrogen | A21071 | 1:1000 for IF, centrifuged at 15000xg for 20 mins at 4°C to remove aggregates |
| Antibody | anti-RCAS1 D2B6N XP (rabbit) | Cell Signaling Technology | 12290 | 1:1000 for Westerns |
| Antibody | anti-RCAS1 D2B6N XP (rabbit) | Cell Signaling Technology 12290 | 12290 | 1:200 for IF fixed with methanol |
| Antibody | anti-Sec23A (rabbit) | Invitrogen | PA5-28984 | 1:1000 for Westerns |
| Antibody | anti-Sec31A (mouse) | BD Biosciences | 612350 | 1:1000 for Westerns |
| Recombinant DNA reagent | Gp64-His6x-DR5 long ECD pFastBacHT | this paper | plasmid | recombinant protein expression in SF21, used in Figure 3 |
| Recombinant DNA reagent | Gp64-His6x-DR5 long ECD-FLAG pFastBacHT | this paper | plasmid | recombinant protein expression in SF21, used in Figure 3 |
| Recombinant DNA reagent | Gp64-His6x-TNFR1 ECD pFastBacHT | this paper | plasmid | recombinant protein expression in SF21, used in Figure 3 |
| Sequence-based reagent | BiP (GRP78) | this paper | 5' primer | GTTCGTGGCGCCTTGTGAC |
| Sequence-based reagent | BiP (GRP78) | this paper | 3' primer | CATCTTGCCAGCCAGTTGGG |
| Sequence-based reagent | CHOP (DDIT3) | this paper | 5' primer | AGCCAAAATCAGAGCTGGAA |
| Sequence-based reagent | CHOP (DDIT3) | this paper | 3' primer | TGGATCAGTCTGGAAAAGCA |
| Sequence-based reagent | DR5 (TNFRSF10B) | this paper | 5' primer | TTCTGCTTGCGCTGCACCAGG |
| Sequence-based reagent | DR5 (TNFRSF10B) | this paper | 3' primer | GTGCGGCACTTCCGGCACAT |
| Sequence-based reagent | GADD34 | this paper | 5' primer | GAGGAGGCTGAAGACAGTGG |
| Sequence-based reagent | GADD34 | this paper | 3' primer | AATTGACTTCCCTGCCCTCT |
| Sequence-based reagent | GAPDH | this paper | 5' primer | AGCCACATCGCTCAGACAC |
| Sequence-based reagent | GAPDH | this paper | 3' primer | TGGAAGATGGTGATGGGATT |
| Sequence-based reagent | GFP | this paper | 5' primer | CTGACCTACGGCGTGC |
| Sequence-based reagent | GFP | this paper | 3' primer | CCTTGAAGAAGATGGTGCG |
| Sequence-based reagent | MPZ | this paper | 5' primer | GGCCATCGTGGTTTACAC |
| Sequence-based reagent | MPZ | this paper | 3' primer | GATGCGCTCTTTGAAGGTC |
| Sequence-based reagent | XBP1 splicing | 5' primer | GGAGTTAAGACAGCGCTTGG | |
| Sequence-based reagent | XBP1 splicing | 3' primer | ACTGGGTCCAAGTTGTCCAG | |
| Peptide, recombinant protein | Fc-tagged DR5 ECD | Genentech | recombinant protein | |
| Peptide, recombinant protein | Fc-tagged TNFR1 ECD | Genentech | recombinant protein | |
| Peptide, recombinant protein | MPZ-ecto | Genscript | purified peptide (>95%) | FTWRYQPEGGRDAISIFHYA |
| Peptide, recombinant protein | MPZ-ectoTyr→Glu | Genscript | purified peptide (>95%) | FTWREQPEGGRDAISIFHEA |
| Peptide, recombinant protein | MPZ-ectoVD | Genscript | purified peptide (>95%) | VSDDISFTWRYQPEGGRD |
| Chemical compound, drug | 32% paraformaldehyde | Electron Microscopy Sciences | fixed with 4% PFA diluted directly into media | |
| Chemical compound, drug | AlexaFluor647 NHS Ester (Succinimidyl Ester) | Life Technologies | A37573 | fluorescent protein labeling |
| Chemical compound, drug | Annexin V-AlexaFluor 647 conjugate | ThermoFisher | #A23204 | apoptosis assays |
| Chemical compound, drug | BS3 (bis(sulfosuccinimidyl)suberate) | ThermoFisher | 21580 | 100 μM BS3 for 20 min at RT |
| Chemical compound, drug | Cellfectin II | ThermoFisher | 10362100 | insect cell expression |
| Chemical compound, drug | Collagen IV | Sigma Aldrich | C6745 | 0.03 mg/ml in PBS incubated on glass slide for 30 min at RT, and then rinsed off with PBS x 4 |
| Chemical compound, drug | DAPI | Molecular Probes | D-1306 | 5 ug/ml |
| Chemical compound, drug | iQ SYBR Green Supermix | BioRad | #17088800 | qPCR |
| Chemical compound, drug | Lipofectamine-LTX | Life Technologies | #15338100 | |
| Chemical compound, drug | OptiPrepDensity Medium | Sigma Aldrich | D1556 | iodixanol gradient |
| Commercial assay, kit | caspase glo8 reagent | Promega | PRG8200 | |
| Software, algorithm | CellProfiler | https://cellprofiler.org/ | quantification of mean correlation | |
| Commercial assay, kit | Dynabeads Protein G | ThermoFisher | 10003D | |
| Software, algorithm | FlowJo | FlowJo, LLC | ||
| Commercial assay, kit | GFP-Trap magnetic agarose beads | Chromotek | gtma-20 | GFP pulldowns |
| Software, algorithm | Prism 6.0 | GraphPad | Kd fits, statistical analyses | |
| Other | 8-well glass bottom uSlide | Ibidi | 80827 | |
| Other | normal goat serum | Jackson Immunoresearch Laboratories | 005-000-121 | blocked with 2% goat serum diluted into PHEM buffer |
| Other | peptide array | MIT Biopolymers Laboratory | Karagöz et al., 2017 | |
| Other | premium capillaries | Nanotemper Technologies | #MO-K025 | fluorescence quenching assays |
| Other | SuperDex200 10/300 GL | GE Healthcare | 28990944 | size exclusion column for fractionation |
Additional files
Download links
A two-part list of links to download the article, or parts of the article, in various formats.
Downloads (link to download the article as PDF)
Open citations (links to open the citations from this article in various online reference manager services)
Cite this article (links to download the citations from this article in formats compatible with various reference manager tools)
Misfolded proteins bind and activate death receptor 5 to trigger apoptosis during unresolved endoplasmic reticulum stress
eLife 9:e52291.
https://doi.org/10.7554/eLife.52291


