Tumors attenuating the mitochondrial activity in T cells escape from PD-1 blockade therapy
- Department of Immunology and Genomic Medicine, Graduate School of Medicine, Kyoto University, Japan
Figures
Figure 1 with 3 supplements
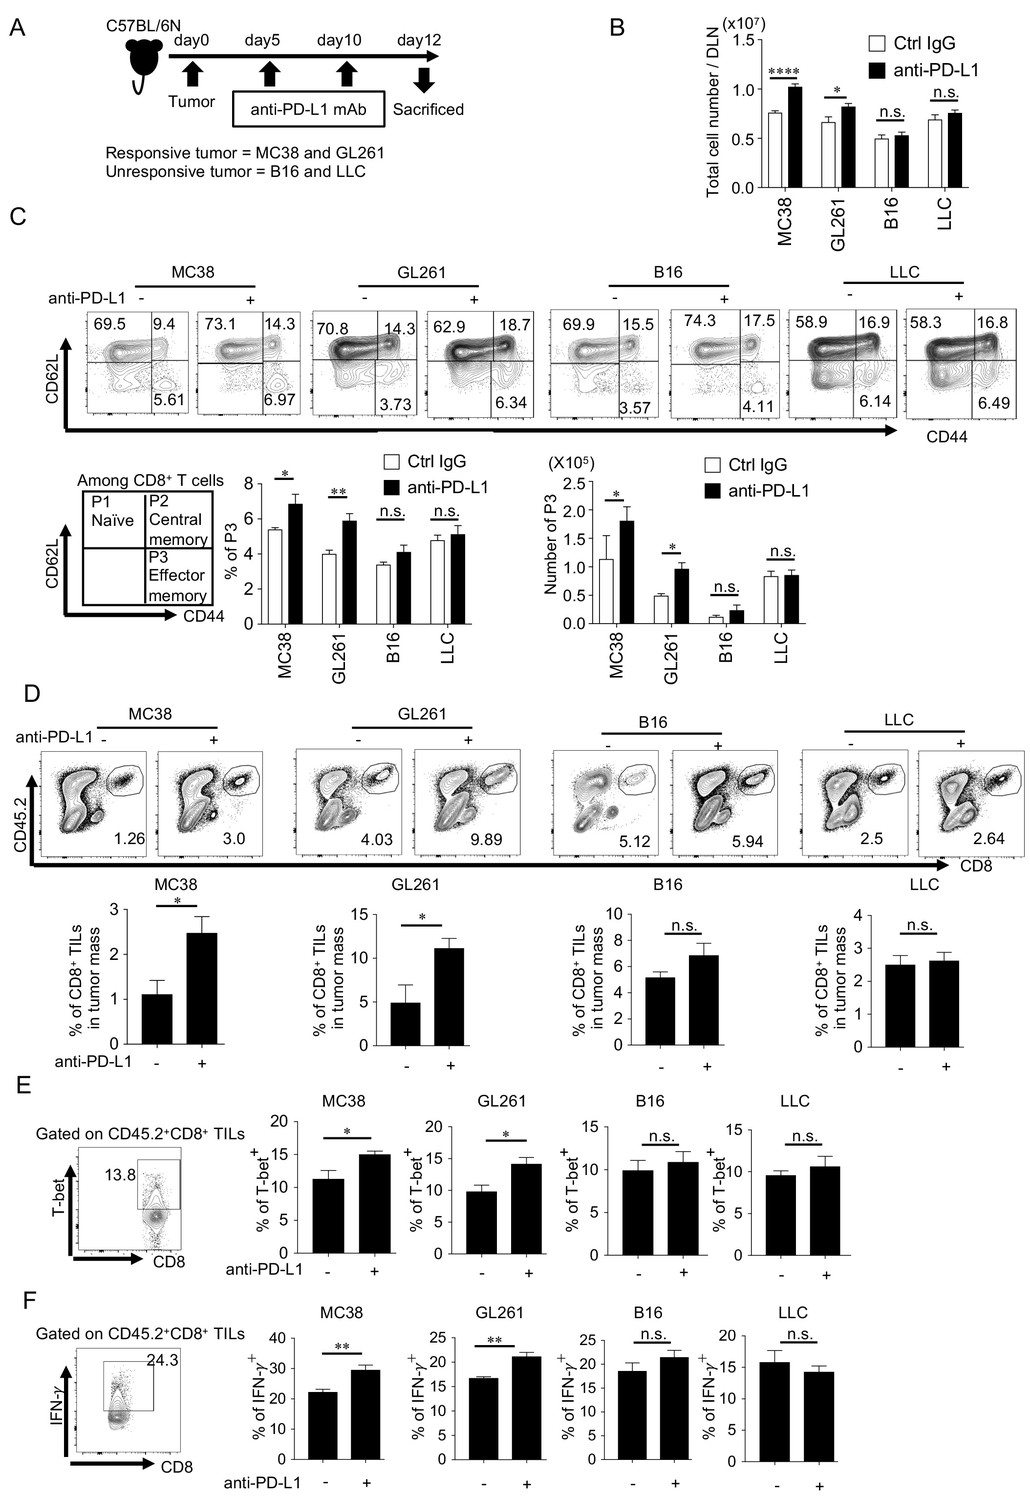
PD-1 blockade significantly enhances the number and function of effector CD8+ T cells in mice with responsive, but not in those with unresponsive tumors.
(A) Schematic diagram of the experimental schedule. (B) Absolute number of lymphocytes per draining lymph node (DLN) was calculated and compared among mice with different responsive or unresponsive tumors. (C) DLN cells were stained with anti-CD8, anti-CD62L, and anti-CD44 antibodies. Representative FACS patterns after gating on CD8+ T cells in each group with or without PD-1 blockade (top panel). Schematic representation of subpopulations among CD8+ T cells (bottom panel, left). Bar graphs of frequency and the absolute number of effector memory (CD62Llow CD44high; P3, hereinafter) population are shown (bottom panel, middle and right). (D) Cells after tumor digestion were stained with anti-CD8, and anti-CD45.2 antibodies. CD45.2+ CD8+ TIL frequency was compared between control IgG and anti-PD-L1 treated groups in responsive and unresponsive tumor-bearing hosts. Representative FACS pattern (upper panel) and the respective bar graph (lower panel) of CD45.2+ CD8+ TIL frequency are shown. (E) Harvested tumor mass cells from experimental groups were stained with anti-CD8, anti-CD45.2, and anti-T-bet antibodies. T-bet expression was plotted after gating on CD45.2+ CD8+ T cells. Representative FACS pattern from GL261 group (ctrl IgG treated) is shown (left). The frequency of T-bet among CD45.2+ CD8+ TILs of mice with the different tumor is shown. (F) IFN-γ expression was intracellularly analyzed in the same way as (E). Representative FACS pattern from GL261 group (ctrl IgG treated) is shown (left). The frequency of IFN-γ among CD45.2+ CD8+ TILs of mice with the different tumor is shown. (B–C) one-way ANOVA analysis. (D–F) two-tailed student’s t-test analysis. *p<0.05, **p<0.01, ***p<0.001, ****p<0.0001, data represent the means ± SEM of five mice. Data are representative of two independent experiments. n.s. represents ‘not significant’.
Figure 1—figure supplement 1
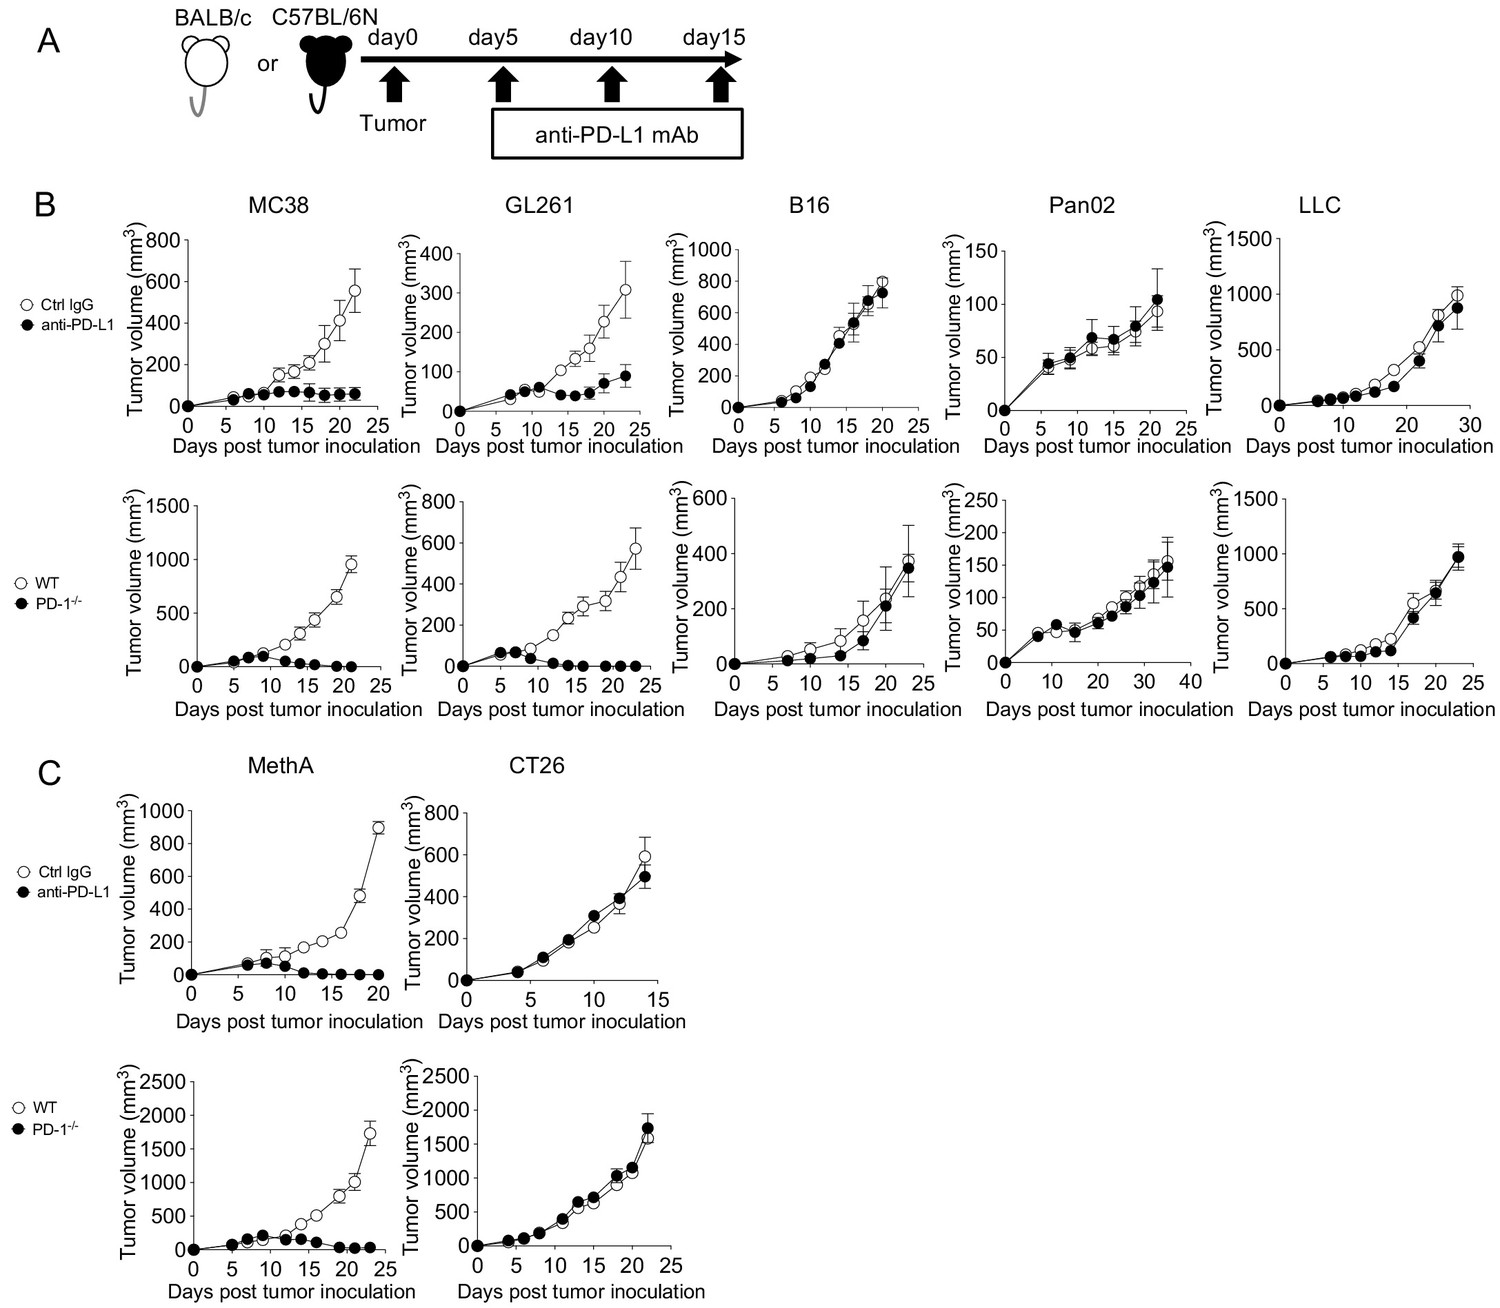
Stratification of responsive and unresponsive tumors in C57BL/6N and BALB/c genetic backgrounds.
(A) Schematic diagram of the PD-1 blockade therapy. Tumor size was measured on every alternative day. (B-C) Tumor growth was measured in anti-PD-L1 mAb treatment model (top panels) or genomic PD-1-/- model (bottom panels) in C57BL/6N (B) and BALB/c (C) background. Data represent the means ± SEM of five or six mice. Data are representative of three independent experiments.
Figure 1—figure supplement 2
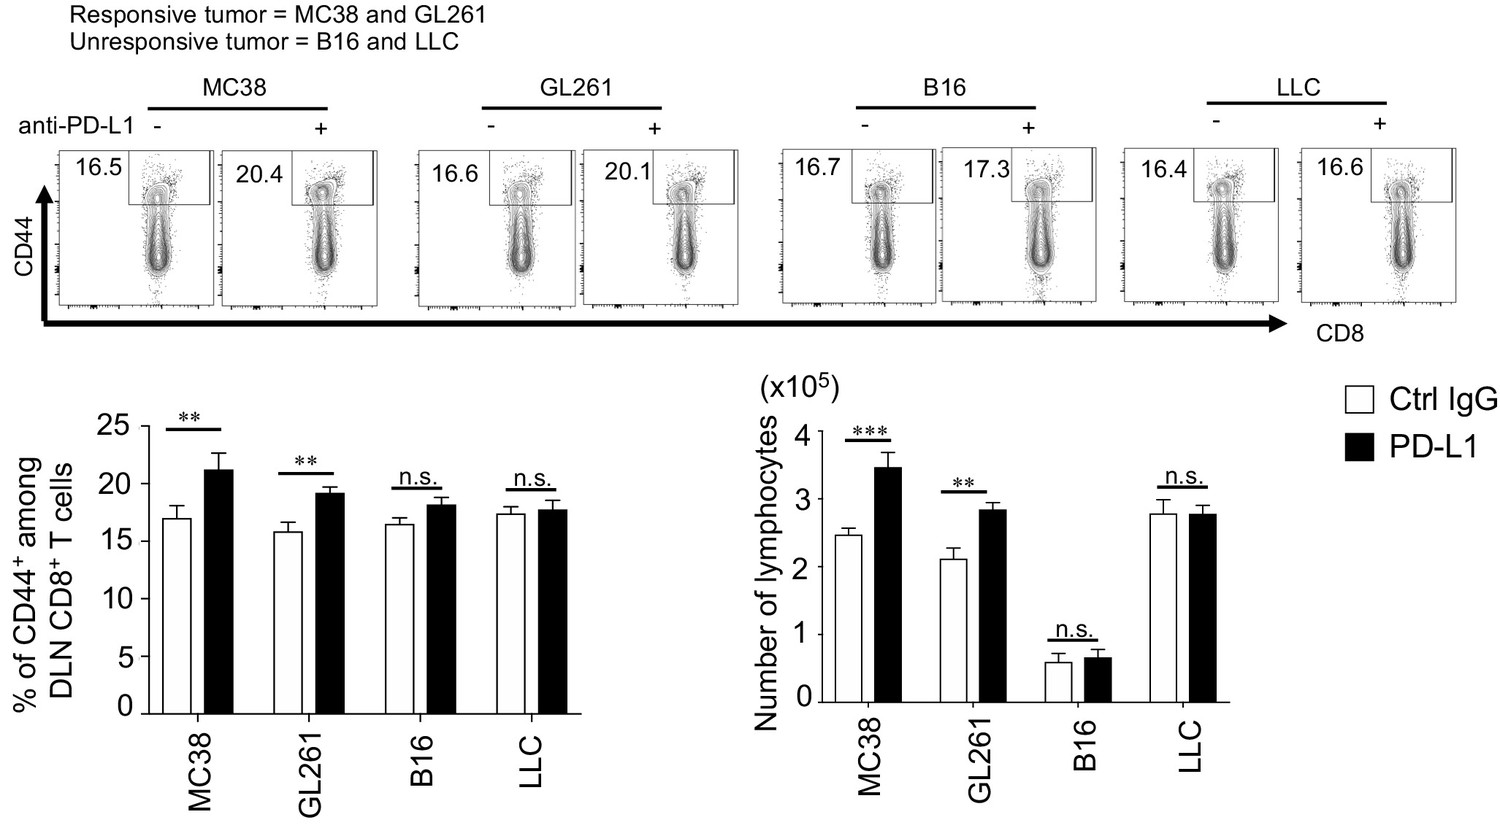
Increment of CD44+ CD8+ T cells in DLN after PD-1 blockade in the hosts with responsive tumor.
Related with Figure 1C. CD8+ DLN cells were gated for CD44+. Representative FACS pattern for each group is shown in upper panel. CD44+ frequency (lower panel, left figure) and absolute number (lower panel, right figure) were quantified. Data represent the means ± SEM of 5 mice. **p < 0.01, ***p < 0.001, one-way ANOVA analysis. Data are representative of three independent experiments. n.s. represents ‘not significant’.
Figure 1—figure supplement 3
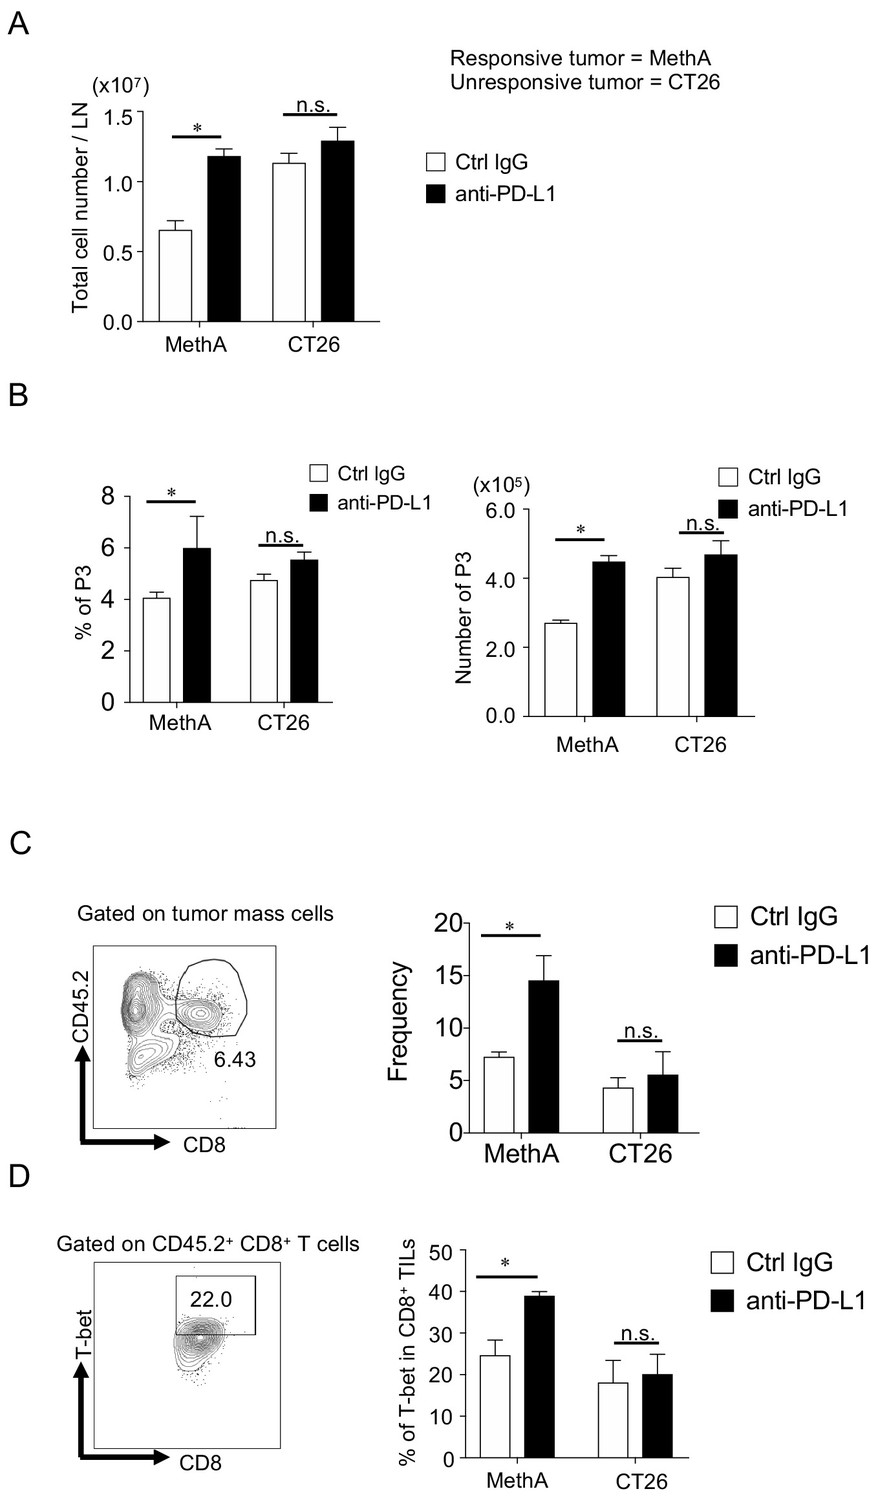
Higher immune responses in responsive tumor-bearing host after PD-1 blockade compared to unresponsive group in BALB/c background.
Following the experimental schedule as mentioned in Figure 1A, mice were sacrificed on day 12 for analysis of immune responses. (A) Absolute number of lymphocytes per LN were compared between responsive and unresponsive tumor-bearing hosts. (B) DLN cells were stained with anti-CD8, anti-CD62L, and anti-CD44 antibodies. Frequency (left) and absolute number (right) of effector memory CD8+ T cells (P3 population) were calculated. (C-D) Cells after tumor digestion were stained with anti-CD8 and anti-CD45.2 mAb. Representative FACS pattern of CD45.2+ CD8+ CTLs from MethA-bearing mice treated with ctrl IgG group is shown (left). The frequency of CD45.2+ CD8+ CTLs was compared between responsive and unresponsive tumor-bearing hosts (right) (C). Following surface staining, T-bet was stained intranuclearly. Representative FACS pattern from MethA-bearing mice treated with ctrl IgG group (left) and the bar graph of frequency (%) of T-bet expression are shown (right) (D). Data represent the means ± SEM of five or six mice. *p < 0.05, one-way ANOVA analysis. Data are representative of two independent experiments. n.s. represents ‘not significant’.
Figure 2 with 1 supplement
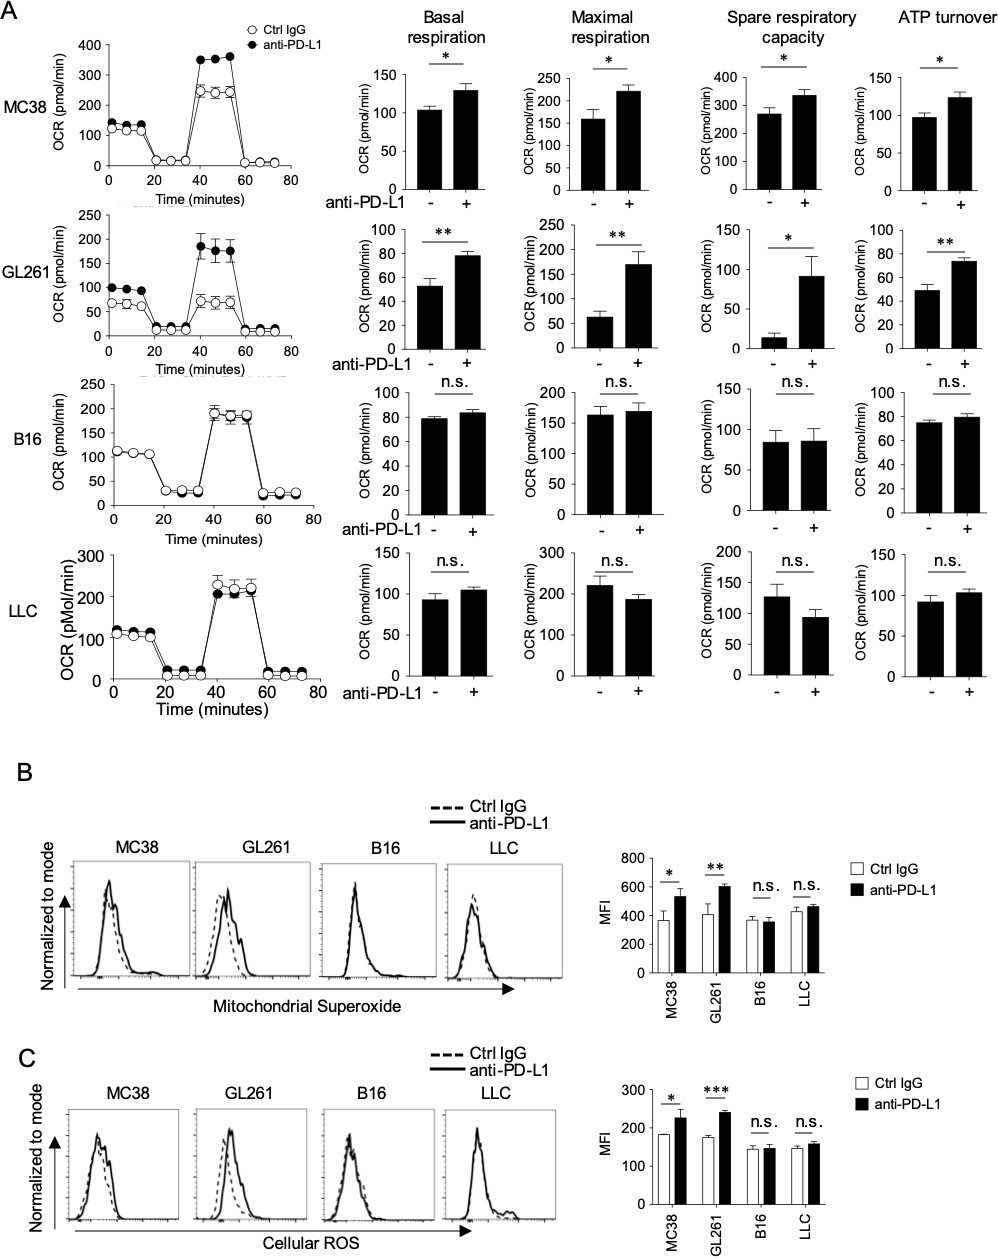
PD-1 blockade significantly enhances mitochondrial activity in CD8+ T cells in mice with responsive, but not in mice with unresponsive tumors.
(A) DLN CD8+ T cells were purified from the pool of five mice per group from the experiment of Figure 1. OCR of DLN CD8+ T cells was measured from responsive and unresponsive tumor groups (left). Other parameters associated with OCR graph (basal respiration, maximal respiration, spare respiratory capacity, and ATP turnover) were calculated and values were plotted in a bar graph for respective tumor group (right). Data represent the means ± SEM of five wells. *p<0.05, **p<0.01, ***p<0.001, two-tailed student’s t-test analysis. (B–C) Tumor mass cells, from the experimental groups of Figure 1, were stained with anti-CD8, anti-CD45.2 antibodies and mitochondrial dyes for Mitochondrial Superoxide production (B) or Cellular ROS production (C). Representative histogram (left) and MFI (right) of mitochondrial dyes after gating on CD45.2+ CD8+ T cells are shown. Data represent the means ± SEM of five mice. *p<0.05, **p<0.01, ***p<0.001, one-way ANOVA analysis. Data are representative of two independent experiments (A–C). n.s. represents ‘not significant’.
Figure 2—figure supplement 1
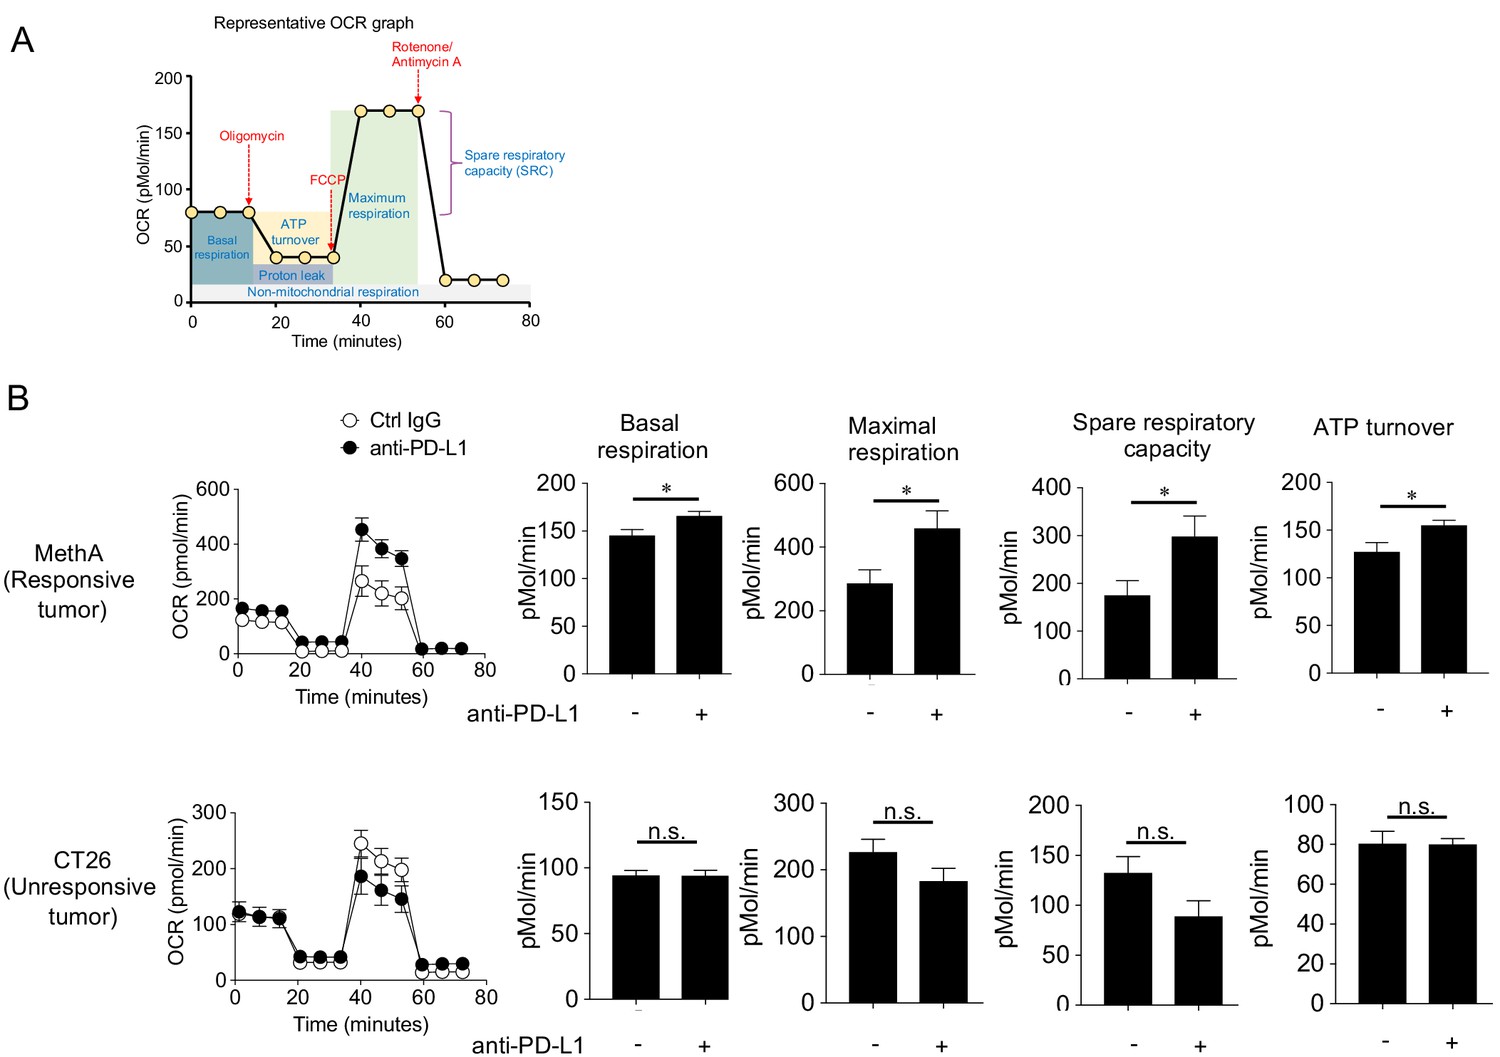
CD8+ T cells from mice with sensitive tumor have higher mitochondrial activity after PD-1 blockade than those with unresponsive tumors in BALB/c background.
(A) Representative OCR plot by Seahorse XFe analyzer, showing basal respiration, maximal respiration, spare respiratory capacity, ATP turnover, proton-leak, and non-mitochondrial respiration, is shown. (B) OCR of DLN CD8+ T cells was measured from experimental groups of Figure 1—figure supplement 3. DLN CD8+ T cells were purified from the pooled cells of each group. OCR plot (left) and its associated parameters (right) from responsive tumor (top panels) and unresponsive tumor (bottom panels) are shown. Data represent the means ± SEM of five wells. *p < 0.05, two-tailed student’s t-test analysis. Data are representative of two independent experiments. n.s. represents ‘not significant’.
Figure 3 with 1 supplement
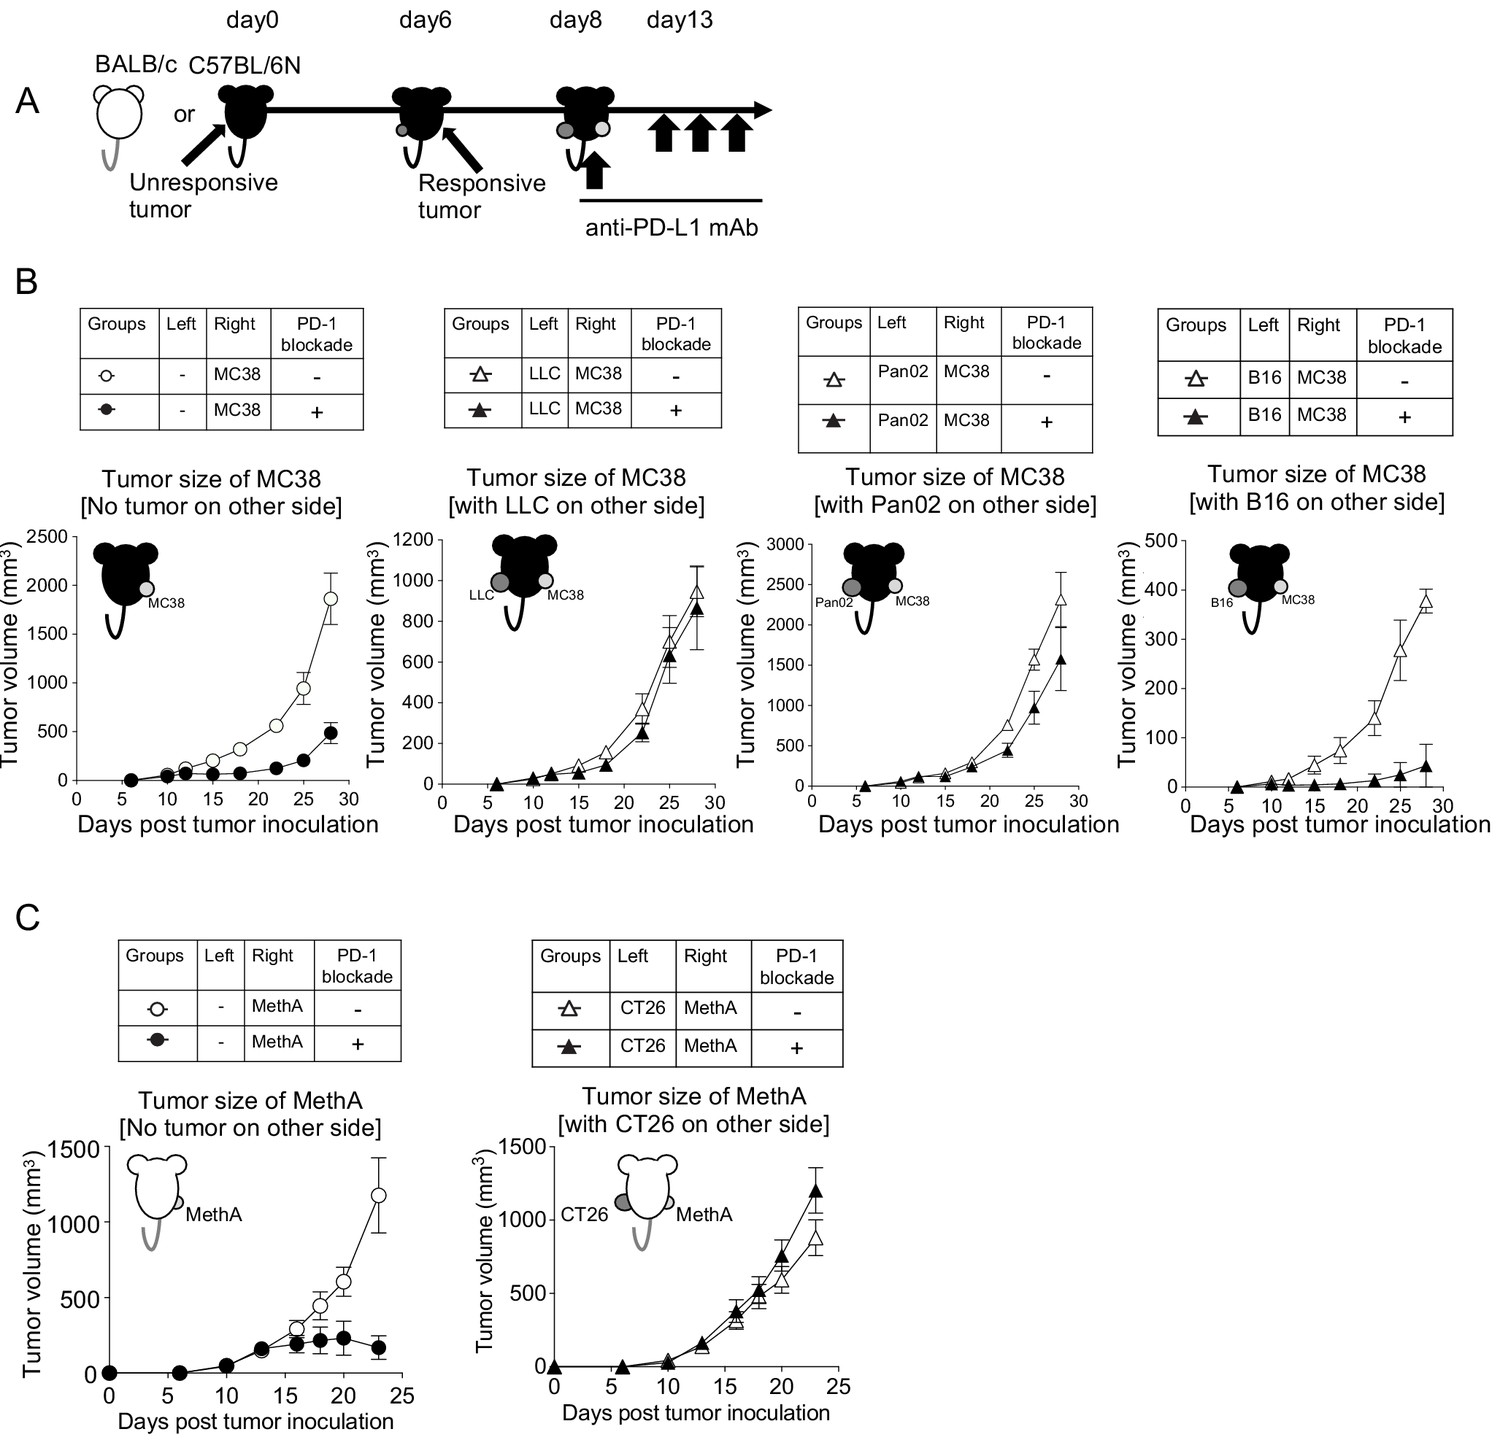
Unresponsive tumors can be classified into systemically immunosuppressive or non-immunosuppressive tumors.
(A) Unresponsive tumor cells (LLC, Pan02 and B16) were inoculated on the left flank of C57BL/6N mice. On day 6, responsive tumor (MC38) cells were inoculated on the right flank of the same mice. On day 8, anti-PD-L1 mAb (or isotype control Rat IgG2a) was injected every fifth day thereafter. (B) Tumor growth of responsive MC38 on the right side was compared with or without PD-1 blockade treatment. (C) Following the same schedule, as mentioned in (A), unresponsive tumor (CT26) cells and responsive tumor (MethA) cells were injected in BALB/c mice. Tumor growth of MethA on the right side was shown. (B–C) Data represent the means ± SEM of five mice. Data are representative of two independent experiments.
Figure 3—figure supplement 1
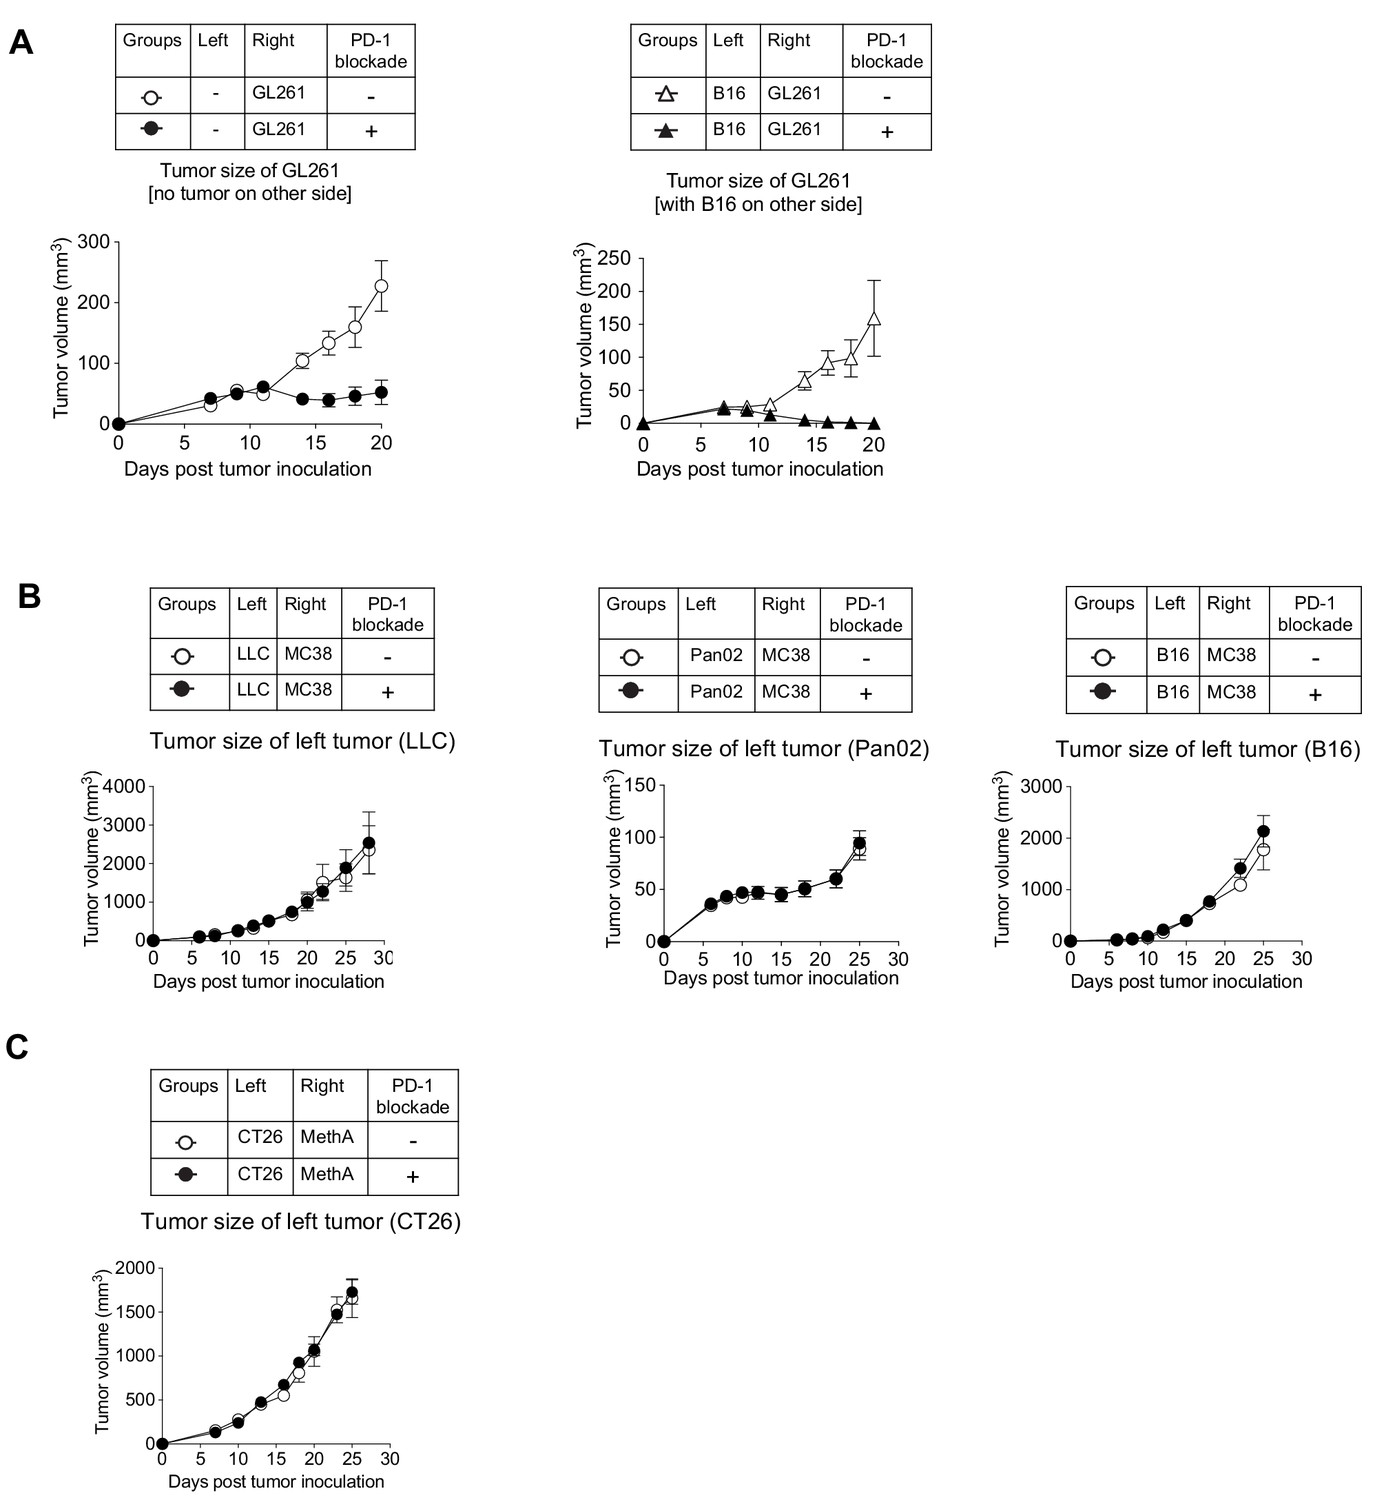
Unresponsive tumors can be classified into systemically immunosuppressive or non-immunosuppressive tumors.
(A) Unresponsive tumor (B16) and responsive tumor (GL261) were injected and therapy were given as per the schedule mentioned in Figure 3A. Tumor growth of right responsive tumor (GL261) with or without PD-1 blockade was compared when no tumor (left panel) or in the presence of B16 (right panel) on left side. (B and C) Unresponsive tumor growth on left side of hosts associated with experimental groups of Figure 3B or C are shown. Data represent the means ± SEM of five mice. Data are representative of two independent experiments.
Figure 4

Unresponsive tumor-derived immune suppressive factor inhibits the mitochondrial responses in CD8+ T cells in vivo.
(A) Mice were treated in the same way as Figure 3A and sacrificed on day 14 for the analysis of DLN CD8+ T cells. (B) Absolute number of lymphocytes per LN from the MC38 side was calculated. (C) DLN cells harvested from the MC38 side were stained with anti-CD8 mAb, MitoSox (left panels) and MitoMass (right panels). Representative FACS profiles after gating on CD8+ T cells and MFI of dye staining are shown. (D) OCR of CD8+ T cells purified from pooled DLN cells of MC38 side for different groups is shown (top). Basal respiration and ATP turnover values were calculated from the OCR graph (bottom). (E) DLN cells harvested from the unresponsive side were stained with anti-CD8 mAb, MitoSox (left) and MitoMass (right). Representative FACS profiles of DLN CD8+ T cells and the MFI of dye staining are shown. (F) OCR of CD8+ T cells purified from pooled DLN cells of B16 or LLC side is shown (left). Basal respiration and ATP turnover values were calculated from the OCR graph (right). (B, C, E) Data represent the means ± SEM of five mice. *p<0.05, **p<0.01, two-tailed student’s t-test analysis. (D, F) Data represent the means ± SEM of five wells. *p<0.05, **p<0.01, one-way ANOVA analysis. Data are representative of two independent experiments. n.s. represents ‘not significant’.
Figure 5
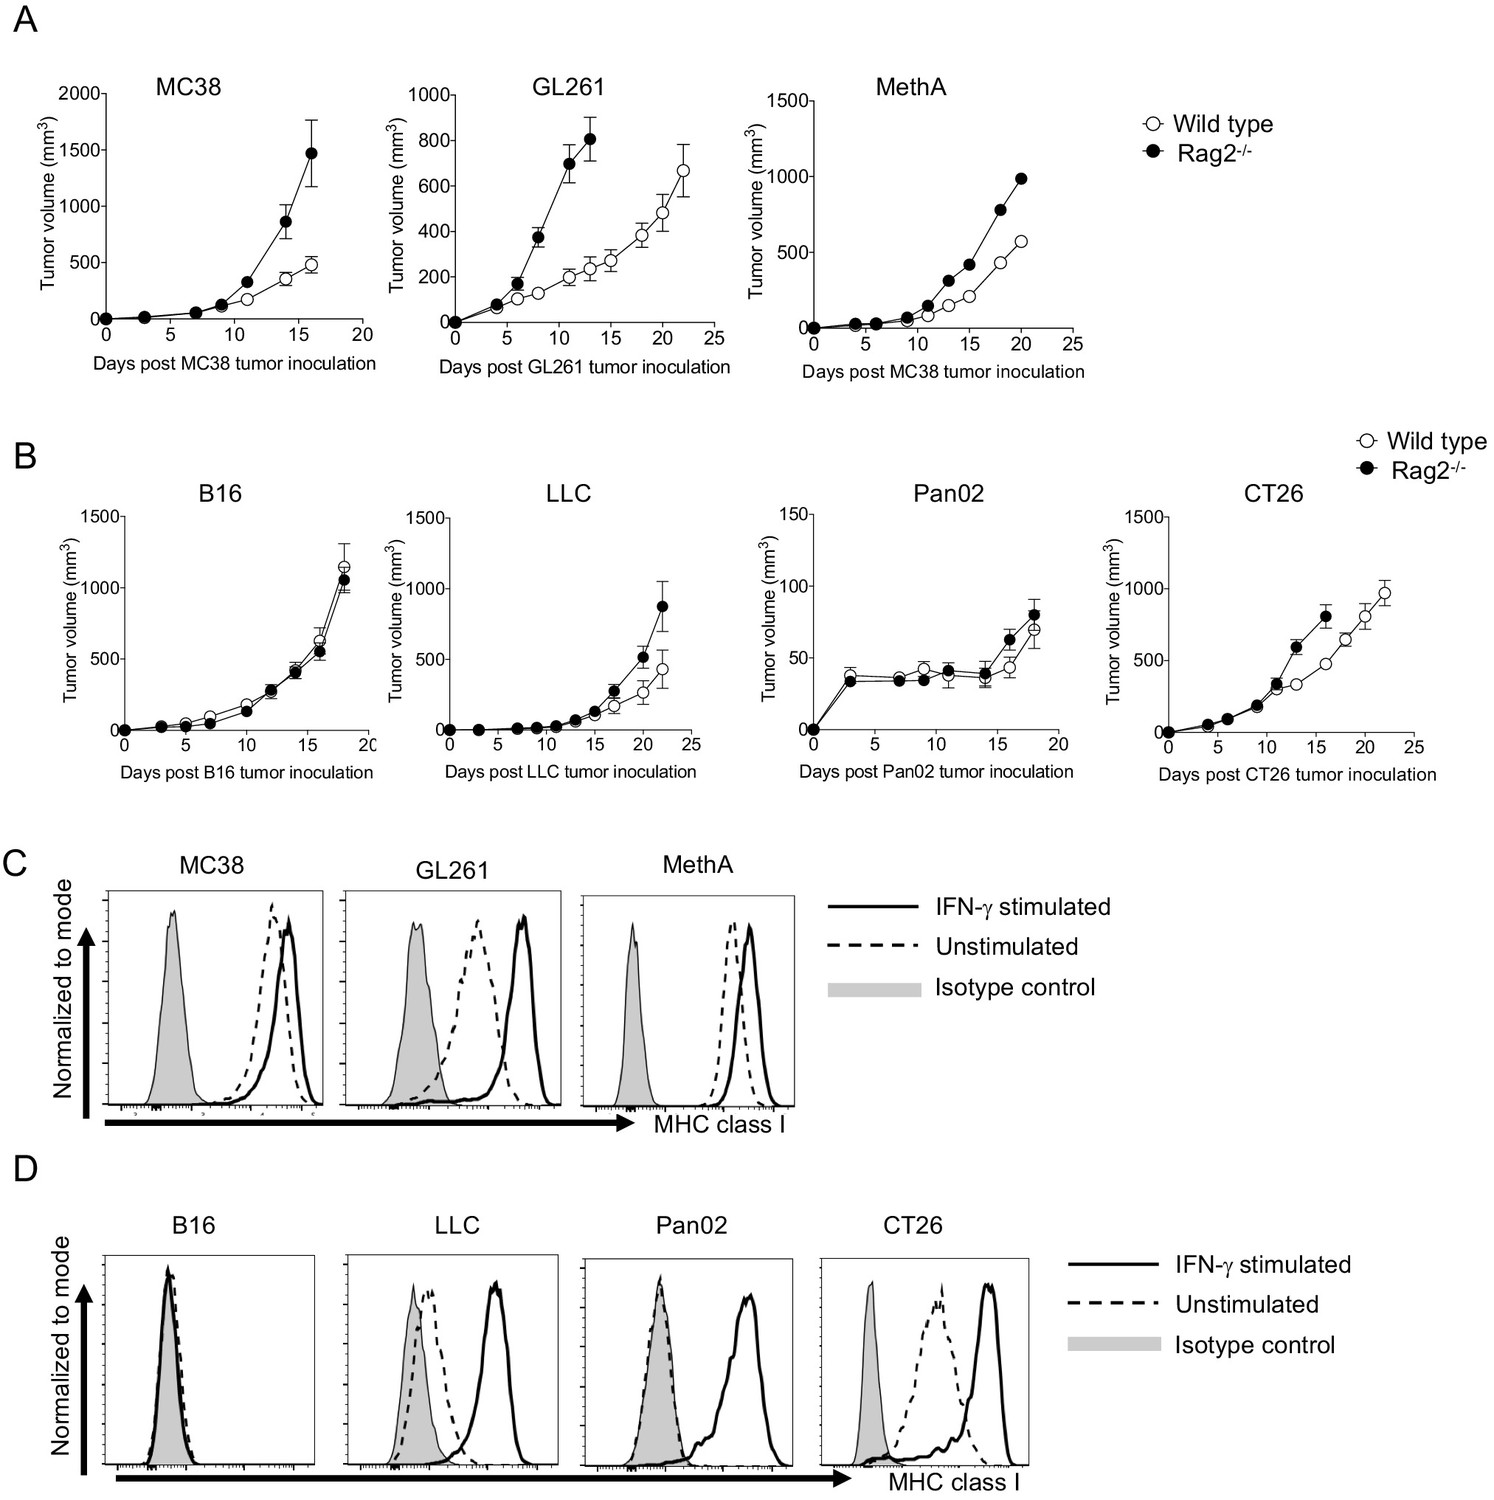
The absence of MHC class I expression in B16.
(A–B) Tumor growth of responsive and unresponsive tumors was observed in wild type or immune-compromised (Rag2-/-) mice. Tumor sizes of responsive tumors (A) and unresponsive tumor (B) are shown. Data represent the means ± SEM of 5 mice. (C–D) Responsive and unresponsive tumor cells were stimulated with IFN-γ for overnight, followed by staining with anti-H-2Kb/H-2Kd mAbs. Representative histograms of MHC class I for responsive (C) and unresponsive (D) tumor cells are shown. Data represent the means ± SEM of three wells. Data are representative of three independent experiments.
Figure 6 with 4 supplements

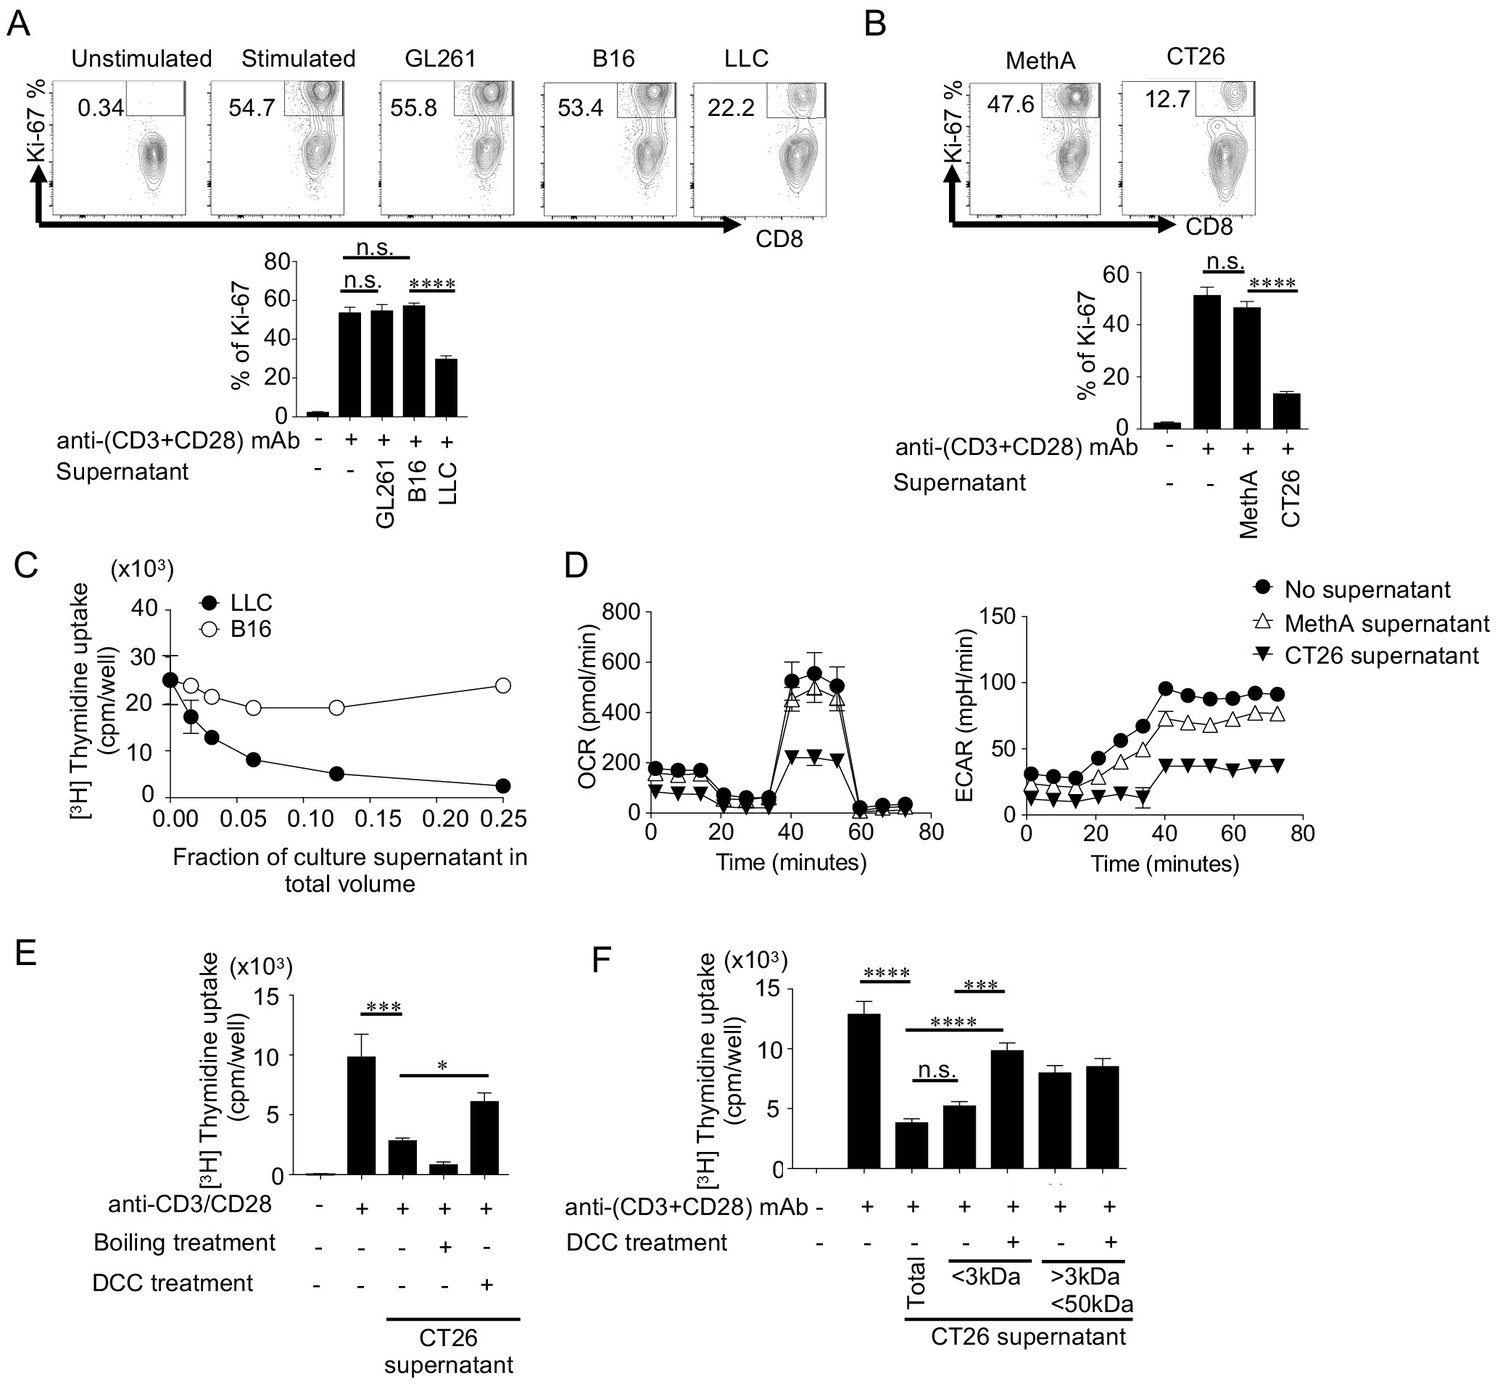
Small soluble factors released from SIP-positive tumors inhibit the T cell proliferation and mitochondrial function in vitro.
(A) Naïve CD8+ T cells (CD44- CD8+ T cells) were purified from spleen and LNs of C57BL/6N mice. Naïve CD8+ T cells were stimulated with anti-(CD3+CD28) mAbs-coated dynabeads for 48 hrs with or without culture supernatant from different tumor cell lines. (B) T-cell proliferation was measured by 3H-thymidine incorporation assay. (C) T cells were stained with anti-CD8 mAb, CellRox dye (cellular ROS, left) and MitoTracker Deep Red dye (mitochondrial potential, right) after the stimulation. The MFI of mitochondrial dyes of CD8+ T cells are shown. (D–E) OCR (D) and ECAR (E) of T cells were measured. The OCR graphs without (left) or with culture supernatants groups (right) are shown. (F) Naïve CD8+ T cells were stimulated with B16 or LLC supernatant for 2 hrs. In the control wells, fresh medium was added. Following the stimulation, cells were stained with mitochondrial dyes. Representative histogram (upper panel) and MFI (lower panel) of each dye are shown. (G) LLC supernatant was heat-inactivated to denature protein components. To remove small molecules, the supernatant was treated with dextran-coated charcoal (DCC) that adsorbs small molecules. The effects of treated supernatant on T cell proliferation was assessed. (H) Using different cut-off filters, LLC supernatant was fractionated into <3 kDa and <50 kDa fractions that were further treated with DCC. The effects of the treated fractions on naïve CD8+ T cell proliferation was assessed. Data represent the means ± SEM of three wells. *p<0.05, **p<0.01, ***p<0.001, ****p<0.0001, one-way ANOVA analysis (B–H). Data are representative of three independent experiments. n.s. represents ‘not significant’.
Figure 6—figure supplement 1
Tumor-derived suppressive factor inhibits proliferation and mitochondrial function of CD8+ T cells in vitro.
As per schedule mentioned in Figure 6A, naïve CD8+ T cells were stimulated in the presence of culture supernatant. (A-B) Naïve CD8+ T cells were stimulated in the presence of culture supernatant of tumor cells from C57BL/6N (A) or BALB/c (B) background. Ki-67 expression was analyzed intracellularly by flow cytometry. Representative FACS profile (upper panel) and frequency of CD8+ KI-67+ T cells (lower panel) are shown. Control groups are shared between A and B. (C) Naïve CD8+ T cells were stimulated in the presence of serially diluted culture supernatants from B16 and LLC. T cell proliferation was measured by 3 H-thymidine incorporation assay. (D) OCR (left) and ECAR (right) were measured of naïve CD8 + T cells that were stimulated in the presence of culture supernatant from MethA and CT26. (E) CT26 supernatant was heat-inactivated to denature protein components. To remove small molecules, supernatant was treated with DCC. The effect of treated supernatant on naïve CD8+ T cell proliferation was assessed. (F) Using different cut-off filters, CT26 supernatant was fractionated into <3kDa and <50kDa fraction that were further treated with DCC. The effect of treated fractions on naïve CD8+ T cell proliferation was assessed. Data represent the means ± SEM of triplicate wells. *p < 0.05, ***p < 0.001, ****p < 0.0001, one-way ANOVA analysis. Data are representative of three independent experiments. n.s. represents ‘not significant’.
Figure 6—figure supplement 2
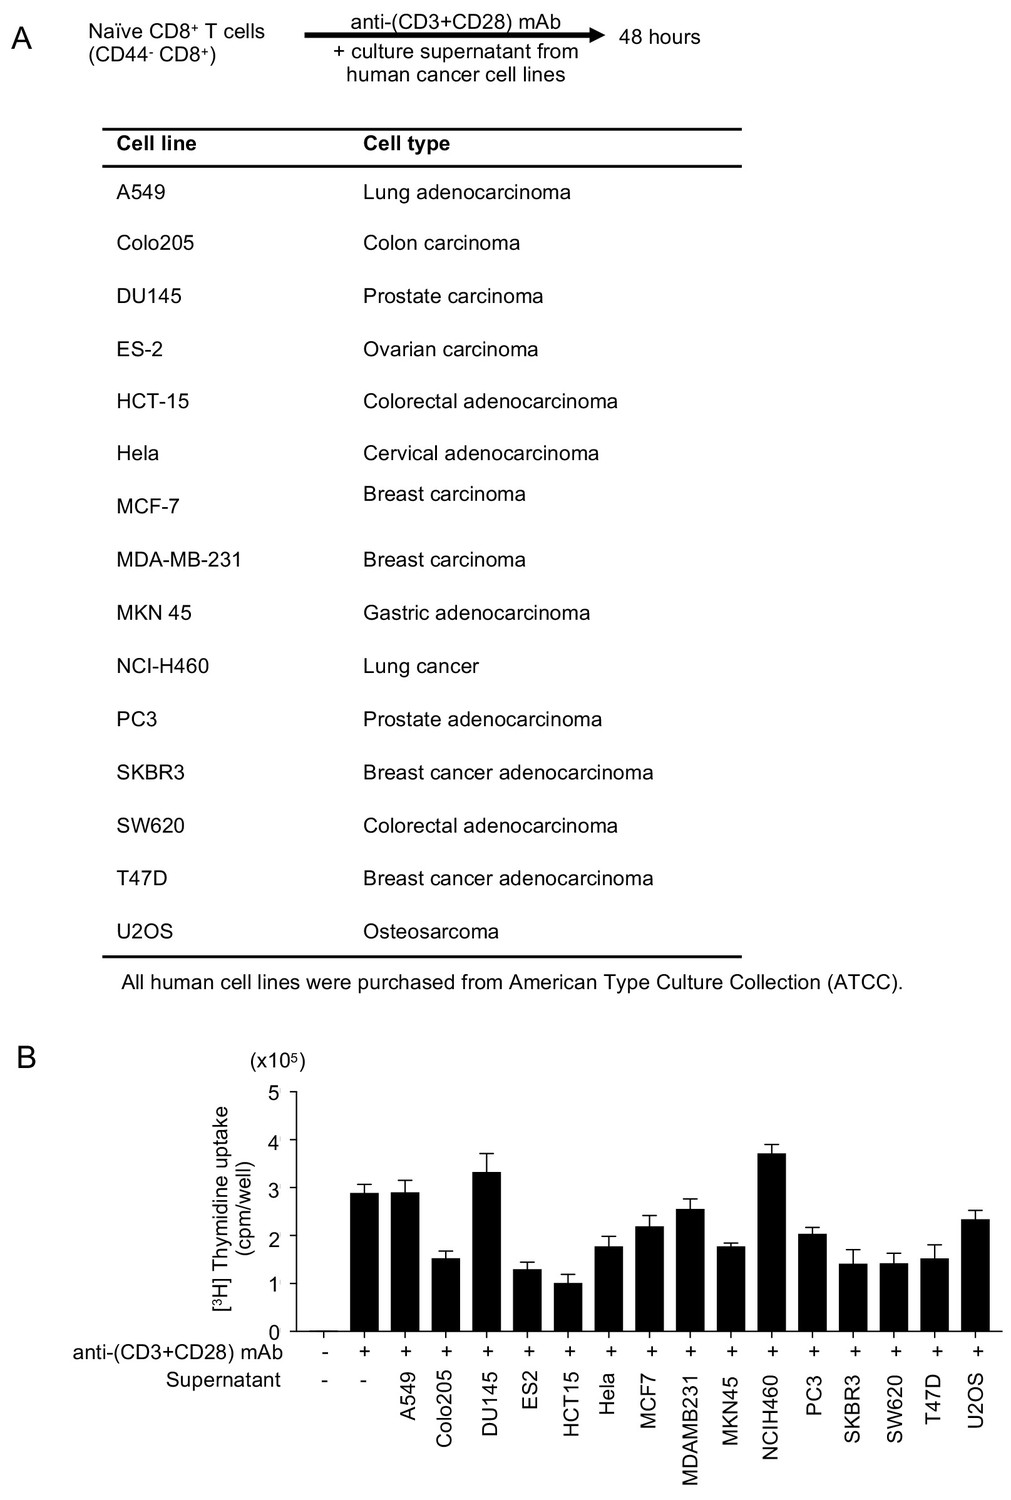
Some human cancer cell lines release suppressive factors which inhibit T cells proliferation in vitro.
(A) Schedule of in vitro T cell proliferation assay (upper panel). Murine naïve CD8+ T cells were stimulated for 48 hrs with anti-(CD3+CD28) mAbs in the presence of culture supernatants collected from different human cancer cell lines cultures. Details of different human cancer cell lines are shown (lower panel). (B) Proliferation was assessed by thymidine incorporation assay. Data represent the means ± SEM of triplicate wells. Data are representative of three independent experiments.
Figure 6—figure supplement 3
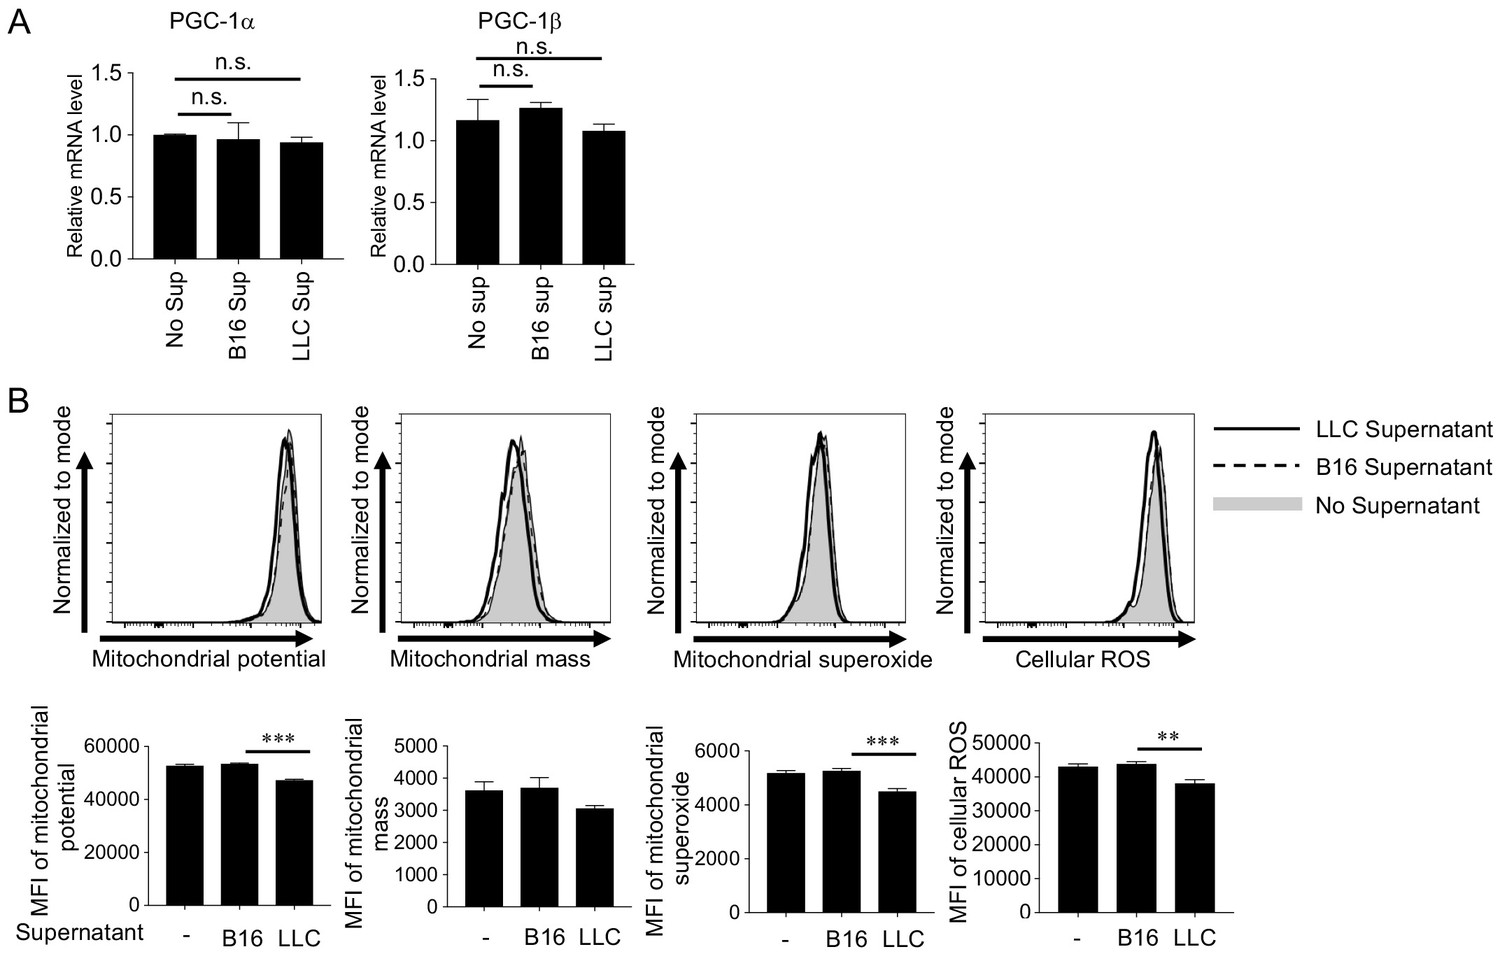
Soluble suppressive factors inhibit mitochondria.
(A) In continuation with Figure 6F, mRNA level of PGC-1α and PGC-1β were quantified in the tumor supernatant (sup) treated naïve CD8+ T cells. (B) B cells (B220+ lymphocytes) were purified from spleen of 8-weeks old C57BL/6N mice and were stimulated with B16 or LLC supernatants for 2 hrs. Following the stimulation, mitochondrial dye staining was performed. Representative histogram (upper panel) and MFI (lower panel) of each dye are shown. Data represent the means ± SEM of three wells. **p < 0.01, ***p < 0.001, one-way ANOVA analysis. Data are representative of two independent experiments. n.s. represents ‘not significant’.
Figure 6—figure supplement 4
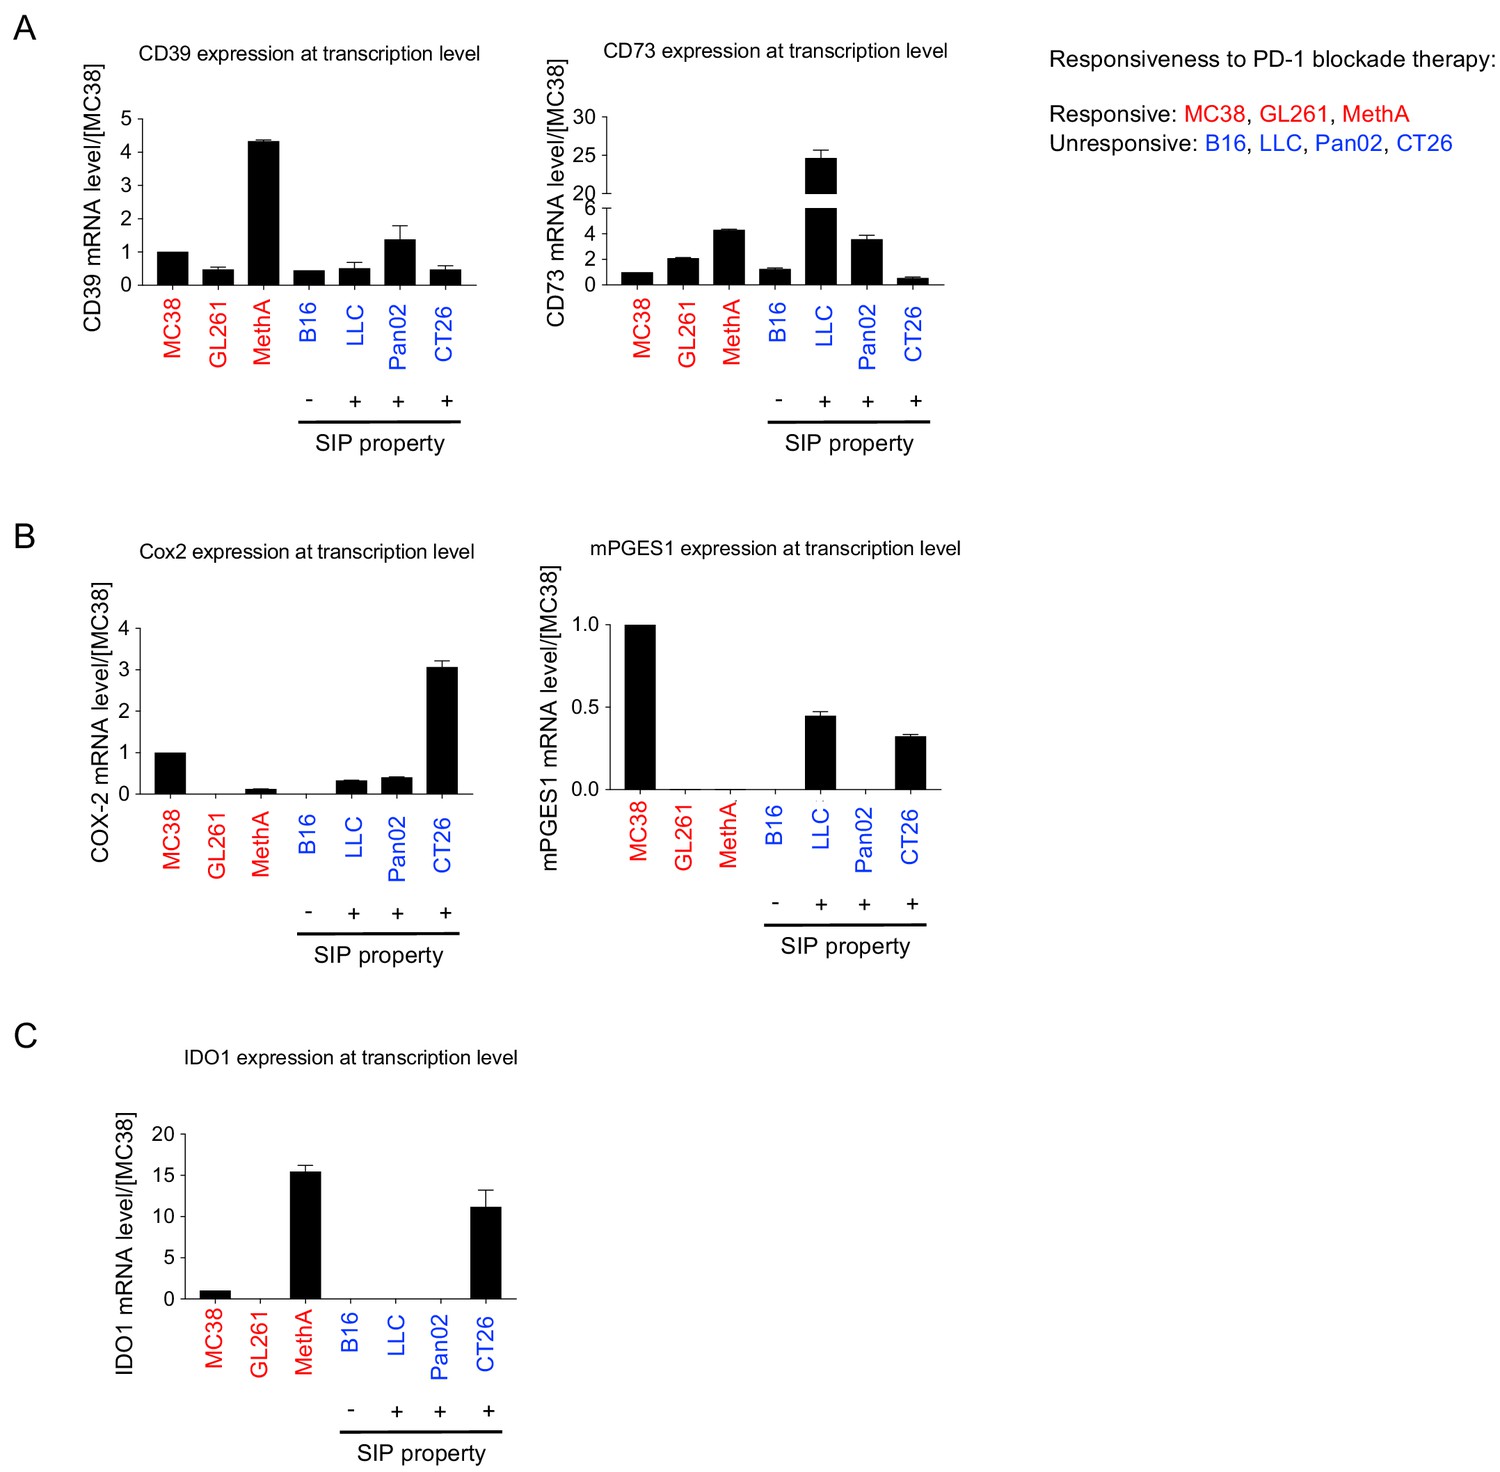
Previously reported factors are not related with the nature of SIP- positive tumors.
Expression levels of immune suppression-associated genes were examined by quantitative reverse transcription PCR (qRT-PCR) in different tumor cell lines. Tumor names in red and blue are responsive and unresponsive, respectively. (A) Expression of CD39 (left) and CD73 (right) were quantified. (B) Expression of Cox2 (left) and mPGES1 (right) were quantified. (C) Expression of IDO1 was quantified. Data represent the means ± SEM of 3 wells assuming the expression in MC38 = 1 in qRT-PCR analysis. Data are representative of 3 independent experiments. Murine b -actin was taken as internal control during qRT-PCR analysis.
Figure 7 with 1 supplement
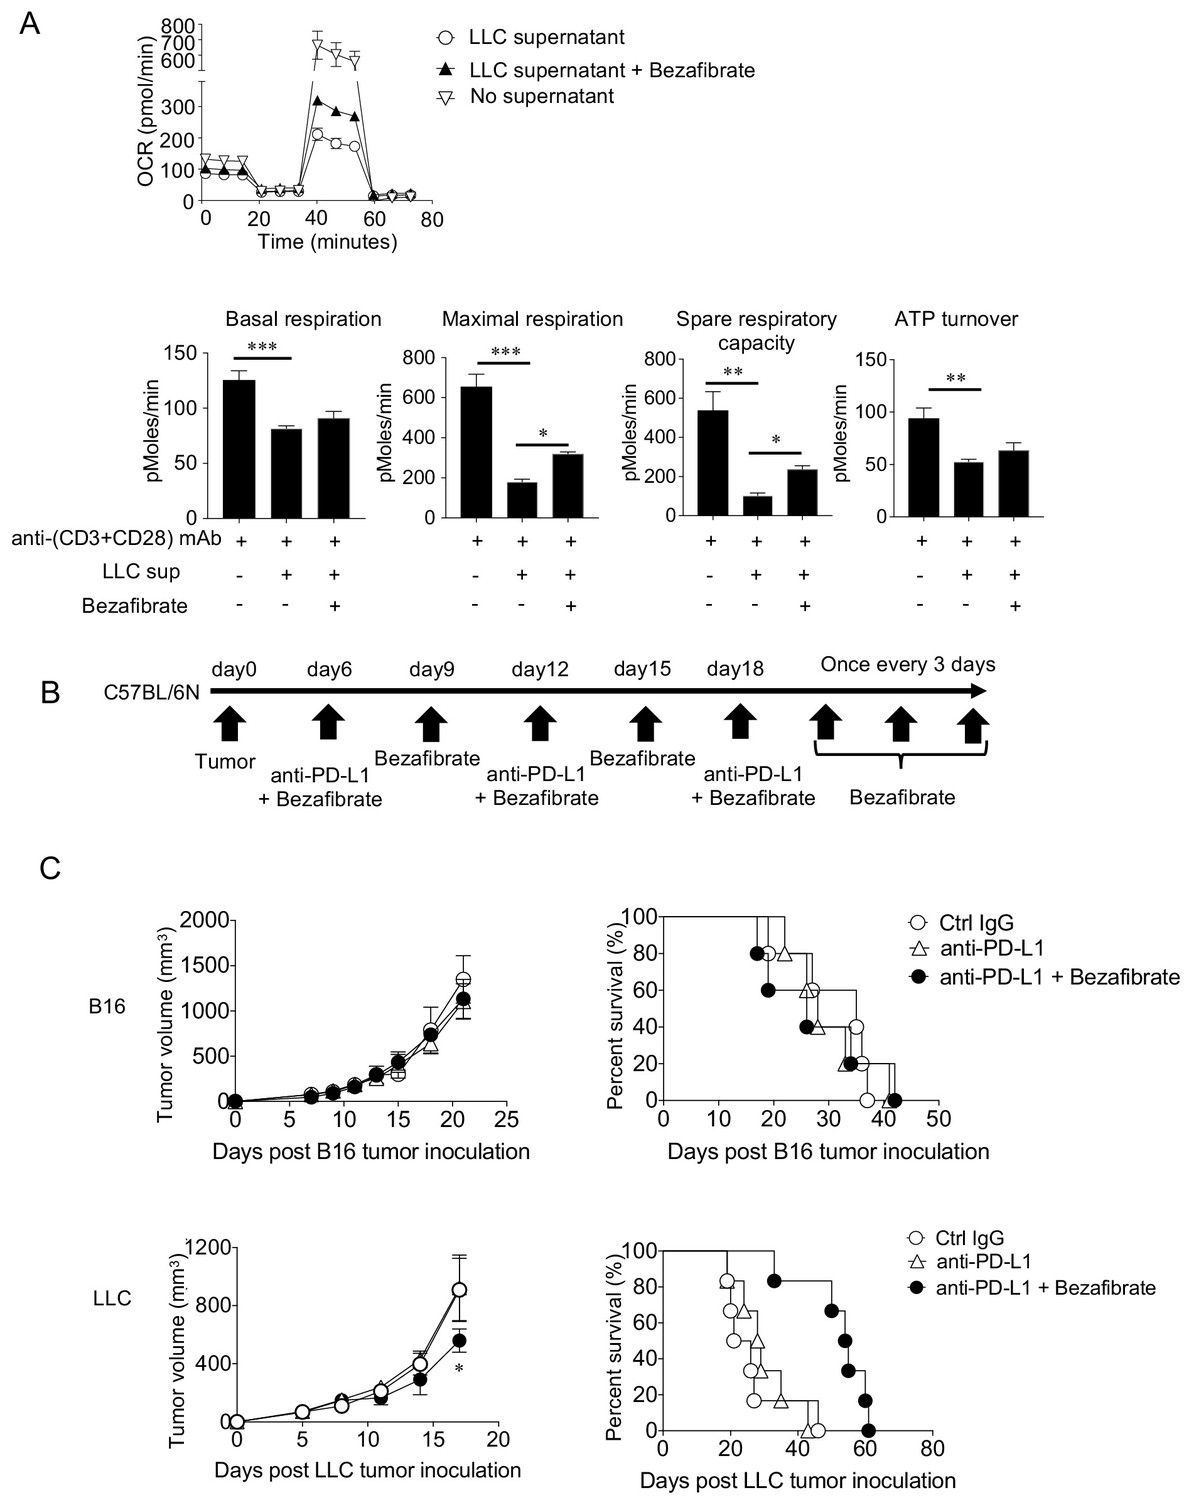
Enhancing mitochondrial activation by bezafibrate partially overcomes suppression and improves survival of SIP-positive tumor-bearing hosts in vivo.
(A) Naïve CD8+ T cells purified from spleen and LNs of C57BL/6N mice were stimulated for 48 hrs with anti-(CD3+CD28) mAb along with LLC culture supernatant and Bezafibrate (5 μM). Following incubation, OCR of T cells was measured. Data represent the means ± SEM of three wells. *p<0.05, **p<0.01, ***p<0.001, one-way ANOVA analysis. Data are representative of three independent experiments. (B) Unresponsive tumors (B16 and LLC) were injected and the mice were treated with anti-PD-L1 mAb along with Bezafibrate (5 mg/kg). Schematic diagram of the combination therapy schedule is shown. (C) Tumor graph (left) and survival curve (right) are shown for the B16 (upper panel) and LLC (lower panel) tumor-bearing host treated with Bezafibrate combination therapy. Data represent the means ± SEM of five mice. *p<0.05, one-way ANOVA analysis. Data are representative of three independent experiments.
Figure 7—figure supplement 1
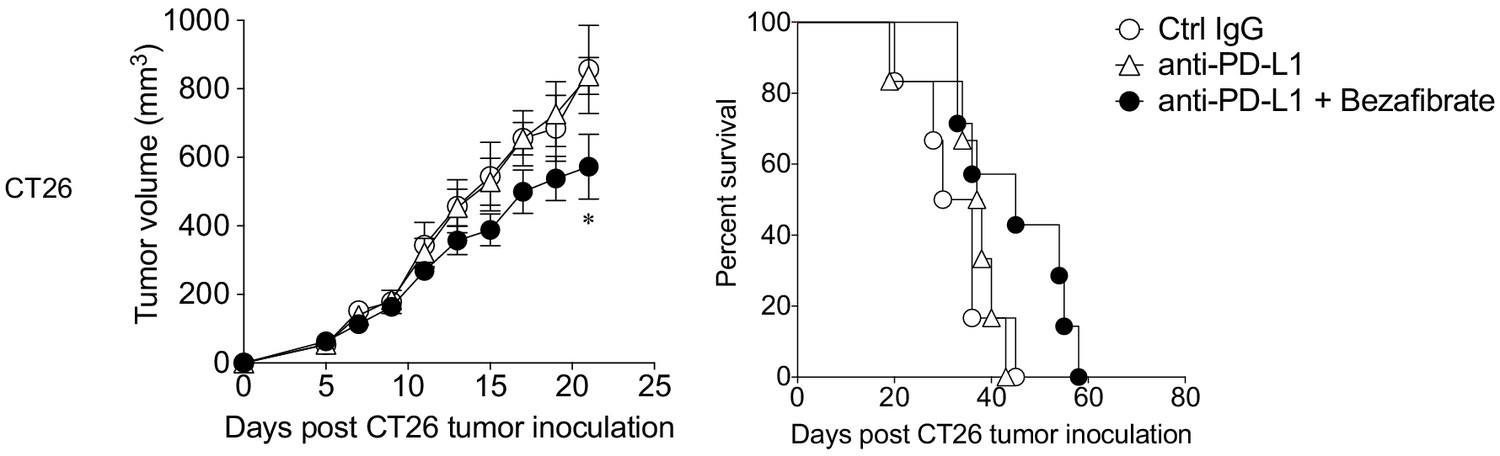
Enhancing mitochondrial activation by bezafibrate chemicals improves the anti-tumor effect for SIP-positive tumor in BALB/c background.
SIP-positive CT26 tumor was injected in mice and therapy was given as per schedule mentioned in Figure 7B. Tumor size (left) and survival (right) of CT26 tumor-bearing host are shown. Data represent the means ± SEM of five mice. *p < 0.05, one-way ANOVA analysis. Data are representative of three independent experiments.
Tables
Table 1
List of mouse cell lines from different genetic backgrounds used in this study.
| Cell line | Background | Response to PD-1 blockade therapy | Particulars | Source |
|---|---|---|---|---|
| GL261 | C57BL/6N | Responsive | Glioblastoma cell line | As a gift from Dr. Toda, Keio University, Japan |
| MC38 | C57BL/6N | Responsive | Colon carcinoma cell line | As a gift from Dr. James P. Allison, Memorial Sloan-Kettering Cancer Center (New York, NY, USA) |
| LLC | C57BL/6N | Unresponsive | Lewis lung carcinoma cell line | American Type Culture Collection |
| B16 | C57BL/6N | Unresponsive | Melanoma cell line | As a gift from Dr. Nagahiro Minato, Graduate School of Medicine, Kyoto University |
| Pan02 | C57BL/6N | Unresponsive | Pancreatic ductal adenocarcinoma cell line | National Cancer Institute |
| MethA | BALB/c | Responsive | 3-methylcholanthrene (MCA)-induced fibrosarcoma cell line | Cell Resource Center for Biomedical Research (Sendai, Japan) |
| CT26 | BALB/c | Unresponsive | N-nitroso-N-methylurethane-(NNMU) induced colon carcinoma cell line | National Cancer Institute |
Additional files
-
Supplementary file 1
List of primers for quantifying mouse gene transcripts by qRT-PCR (related to Figure 6—figure supplements 3 and 4).
- https://cdn.elifesciences.org/articles/52330/elife-52330-supp1-v2.docx
-
Transparent reporting form
- https://cdn.elifesciences.org/articles/52330/elife-52330-transrepform-v2.docx
Download links
A two-part list of links to download the article, or parts of the article, in various formats.
Downloads (link to download the article as PDF)
Open citations (links to open the citations from this article in various online reference manager services)
Cite this article (links to download the citations from this article in formats compatible with various reference manager tools)
Tumors attenuating the mitochondrial activity in T cells escape from PD-1 blockade therapy
eLife 9:e52330.
https://doi.org/10.7554/eLife.52330


