Drosophila TRIM32 cooperates with glycolytic enzymes to promote cell growth
- Department of Biochemistry and Molecular Biophysics, Kansas State University, United States
- Department of Biology, Providence College, United States
- Laboratory for Optical and Computational Instrumentation, Department of Biomedical Engineering, University of Wisconsin-Madison, United States
- Regional Centre for Biotechnology, NCR Biotech Science Cluster, 3rd Milestone, Faridabad-Gurgaon Expressway, India
- Department of Biology, Indiana University, United States
Figures
Figure 1 with 1 supplement

The NHL region of Drosophila TRIM32 is structurally conserved.
(A) Schematic showing the RING, B-box, coiled-coil, and NHL domains in TRIM32. (B) Superimposed protein structures of the six NHL repeats in Drosophila (magenta) and Mus musculus (blue) TRIM32. Each NHL repeat consists of four antiparallel beta sheets that are arranged toroidally around a central axis. Mouse NHL has two additional loops (asterisks) not present in the fly protein. The positions and orientation of both R394/R1114 and D487/D1211 are identical between Mus musculus and Drosophila (orange). (C) The glycolytic pathway. Peptides corresponding to enzymes that co-purified with TRIM32_NHL are shown in blue.
-
Figure 1—source data 1
X-ray diffraction data collection and refinement statistics.
- https://cdn.elifesciences.org/articles/52358/elife-52358-fig1-data1-v1.docx
-
Figure 1—source data 2
Proteins identified via MS that co-purify with TRIM32-NHL Experiment #1 (1418) Experiment #2 (1426.1) Experiment #3 (1426.2).
- https://cdn.elifesciences.org/articles/52358/elife-52358-fig1-data2-v1.docx
Figure 1—figure supplement 1
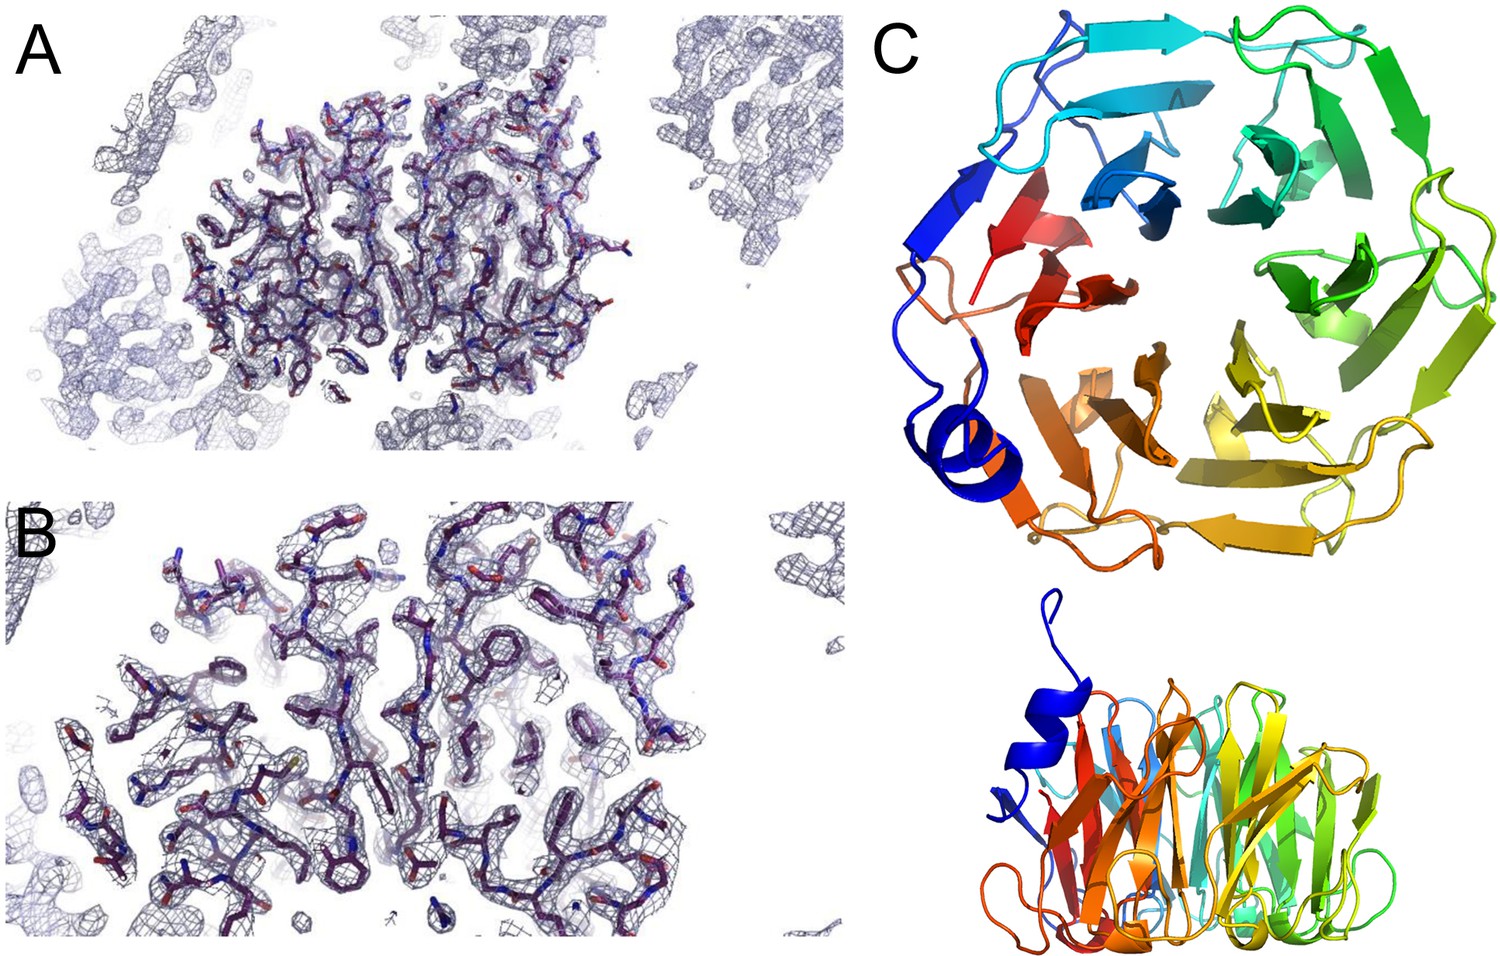
Crystal structure of the Drosophila TRIM32_NHL domain.
(A,B) Representative electron density maps. Two images showing regions of the final 2Fo-Fc electron density map (grey cage) corresponding to the NHL region of Drosophila TRIM32, contoured at 1.2 σ. The polypeptide is drawn in ball and stick convention (carbon atoms in purple). (C) Ribbon diagrams corresponding to the TRIM32_NHL domain are rendered in rainbow colors from red at the N-terminus to blue at the C-terminus. Top view (top panel) reveals six NHL repeats, each consisting of four antiparallel beta sheets that together are arranged toroidally around a central axis. Side view (bottom panel) shows that the NHL repeats form a compact structure with few extended loops.
Figure 2 with 1 supplement
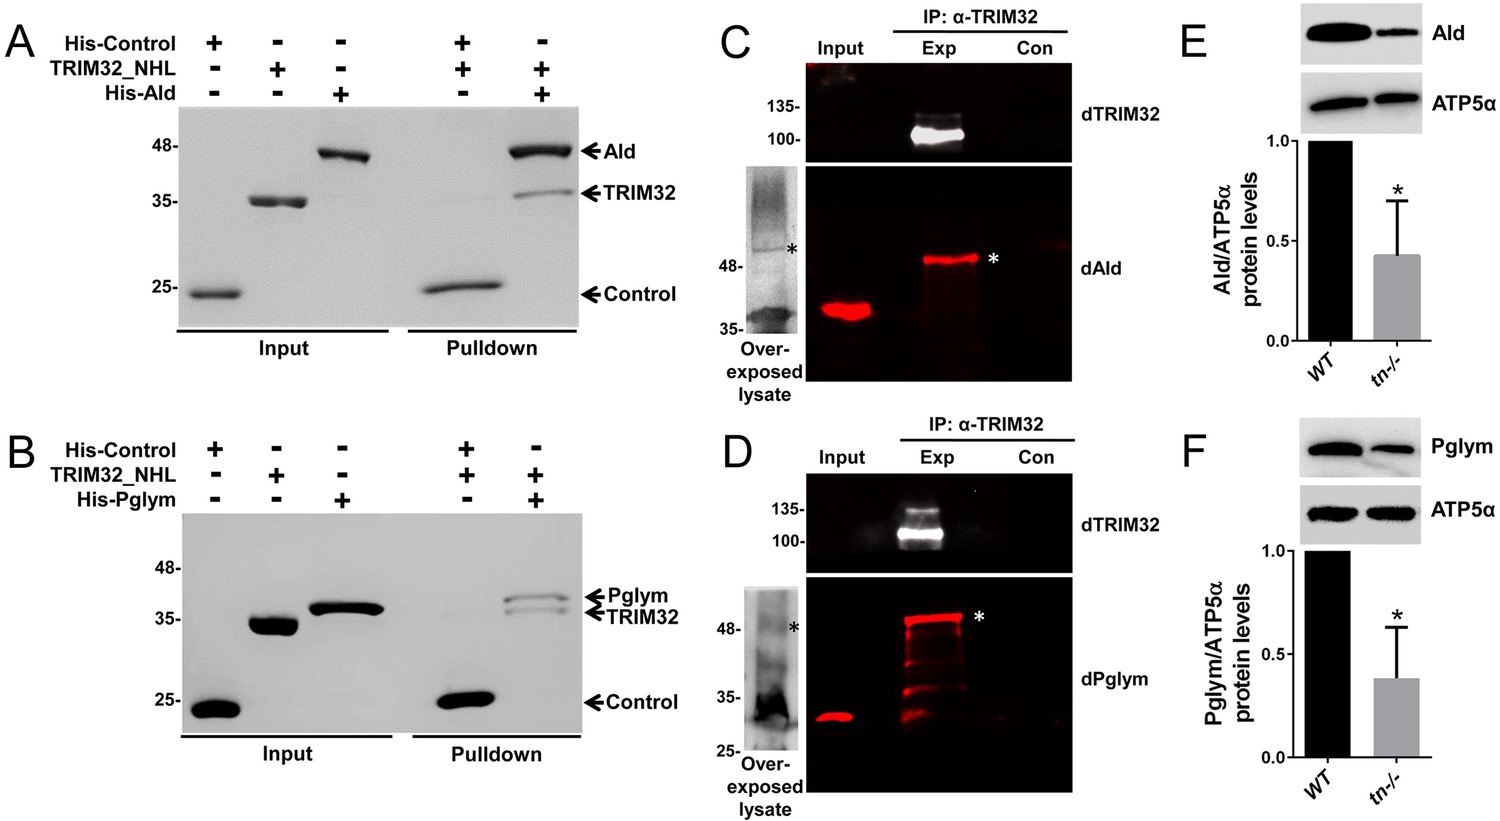
Drosophila TRIM32 physically interacts with the glycolytic enzymes Ald and Pglym78.
(A,B) In vitro binding assays. Untagged TRIM32_NHL was incubated with either the His-tagged SCIN control protein or the His-tagged candidate proteins Ald (A) or Pglym (B). After washing in 300 mM NaCl and 0.1% Triton, each of these protein complexes was separated by SDS-PAGE followed by Coomassie staining. Ald and Pglym proteins directly bind the NHL region of TRIM32, while no interaction with the His-SCIN control protein is observed. (C,D) Western blotting with antibodies against Drosophila Ald (dAld; C) or Drosophila Pglym (dPglym; D) detects higher molecular weight bands (asterisk) upon immunoprecipitation of Drosophila TRIM32, but not in control lanes. The observed molecular weights of Ald or Pglym in input larval lysates (~30 µg) is predominant over a higher migrating form that can be visualized after overexposure of blots with concentrated lysate (~300 µg). (E,F) Western blots showing that mutations in tn reduce Ald (E) or Pglym (F) protein levels ~ 50% quantitated relative to ATP5α in L3 larvae. N = 3. Mean +/- SD (*, p<0.05).
Figure 2—figure supplement 1
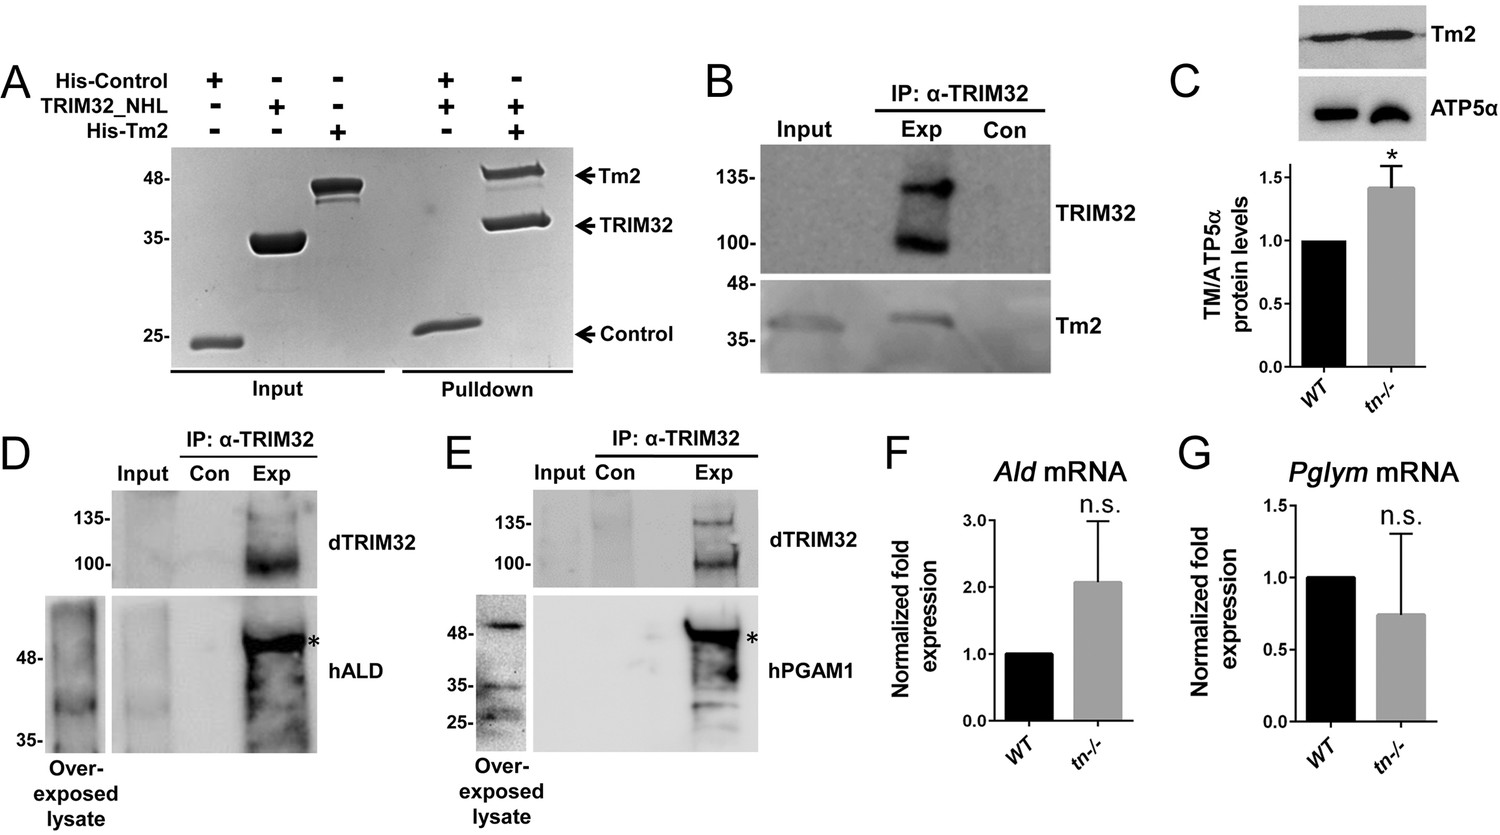
TRIM32 co-purifies with Tm2 and other proteins.
(A) In vitro binding assay shows that His-tagged Tm2, but not the His-tagged SCIN control protein, directly binds untagged TRIM32_NHL. (B) Tm is found to co-immunoprecipitate with TRIM32 in L3 larval lysates. (C) Western blot depicting overall protein levels in WT or tn-/- whole larvae quantitated relative to ATP5α. Tm protein levels are increased in tn-/- mutants compared to WT controls. N = 3. (D,E) Immunoprecipitation of TRIM32 from L3 larval lysates co-purifies with Ald or Pglym. The glycolytic proteins are detected using antibodies against human ALD or PGAM1. Asterisk denotes the high molecular weight band that was also detected with Drosophila antibodies in Figure 2. (F,G) qPCR shows there is no decrease in the mRNA levels of Ald (F) or Pglym (G) in tn-/- at the L3 stage. mRNA was normalized to rp49 transcripts. N = 3 biological replicates and three technical replicates for each genotype. Mean +/- SD (*, p<0.05; n.s., not significant).
Figure 3 with 1 supplement
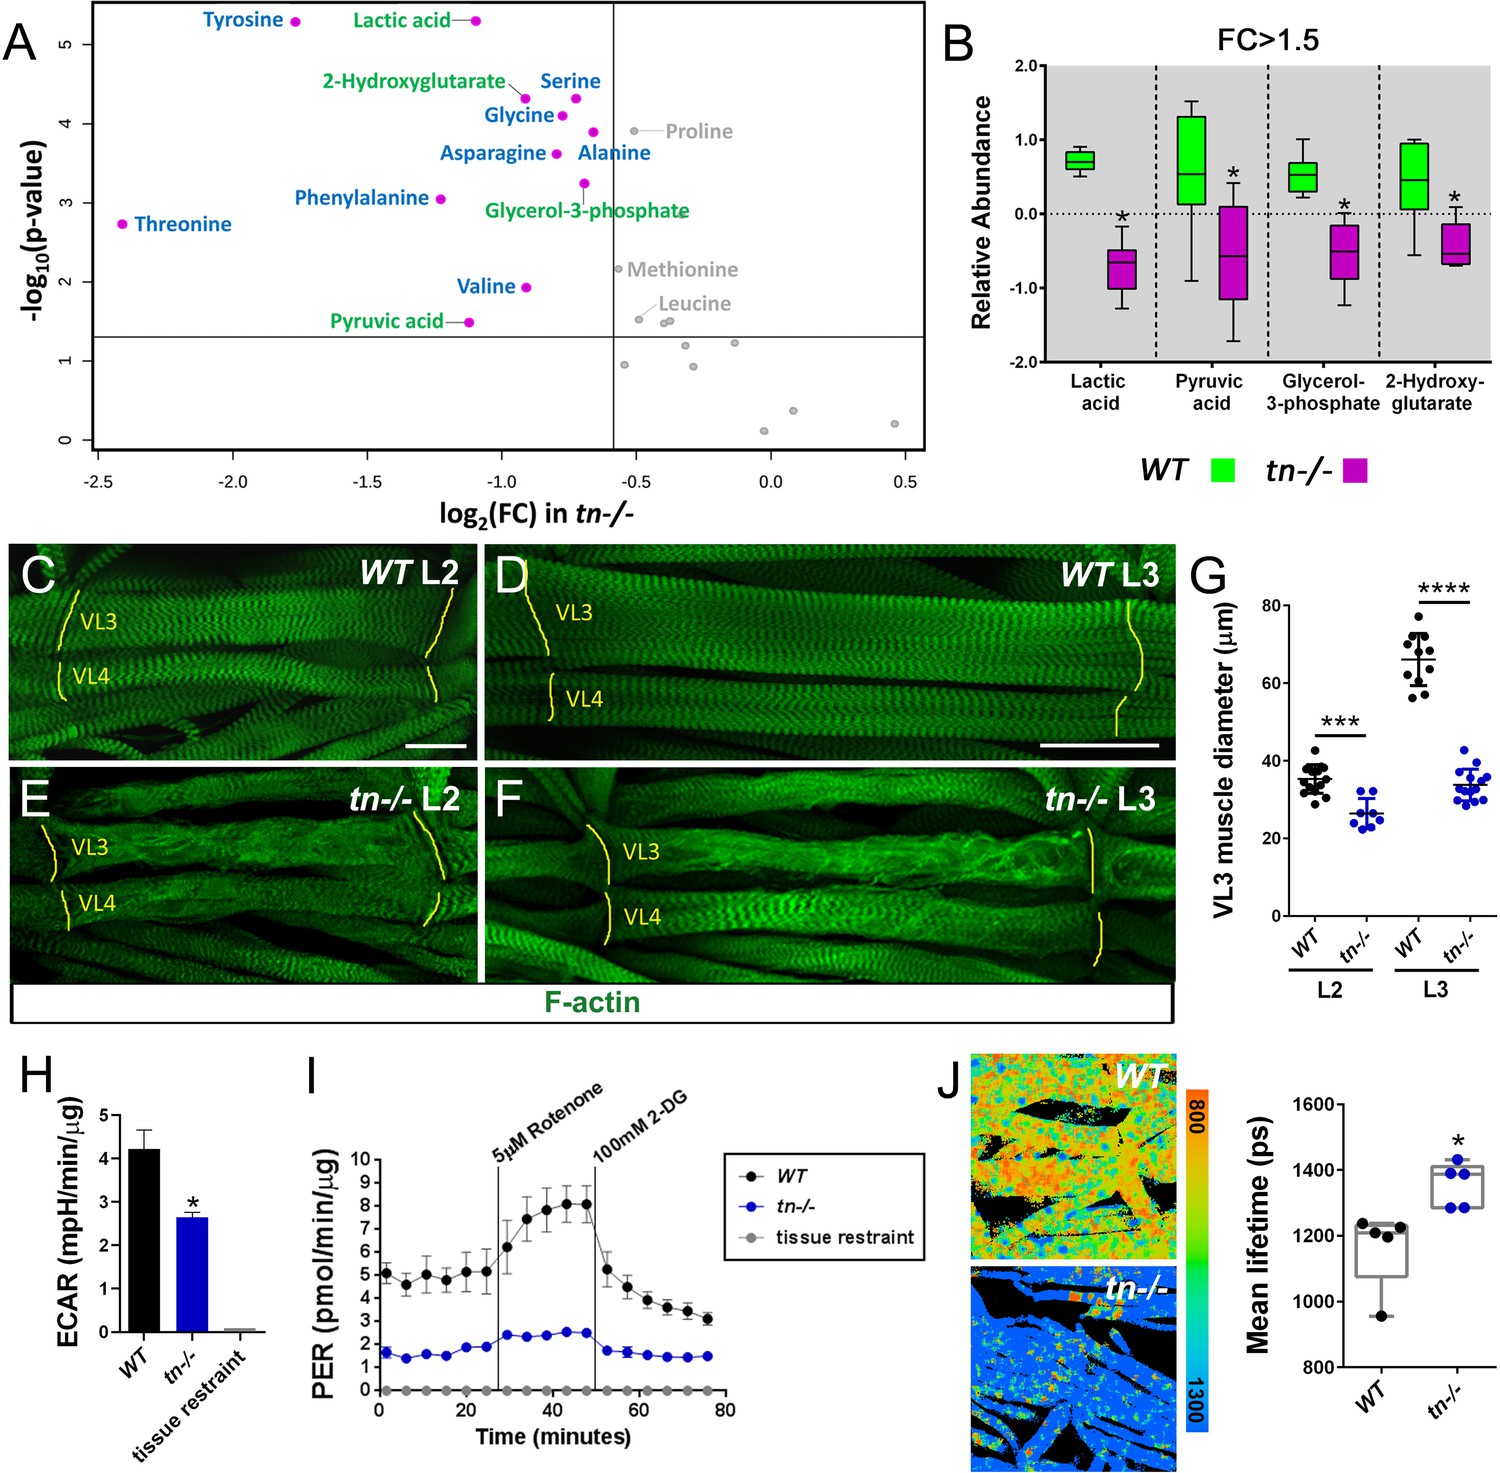
Loss of TRIM32 decreases glycolytic flux and reduces muscle tissue size.
(A) Volcano plot illustrating fold change (FC) (log base 2) compared with p-value (- log base 10) between WT and tn-/- L3 larvae. Vertical line represents FC >1.5. Horizontal line depicts a significance level p<0.05. Metabolites that are reduced in tn-/- larvae include indicators of glycolytic flux (green) and amino acids (blue). Metabolites in gray are significant, but exhibit a FC <1.5. (B) Box and whisker plot of terminal glycolytic metabolites significantly reduced upon loss of TRIM32. N = 6. (C–F) Ventral longitudinal muscles 3 (VL3) and 4 (VL4) stained with phalloidin to visualize F-actin (green). (C,D) The stereotypical morphology of WT muscles is not altered as overall muscle size increases from the L2 (C) to the L3 (D) stage. (E,F) In addition to sarcomeric disorganization, the VL3 and VL4 muscles are noticeably smaller in tn-/- larvae during L2 (E) and L3 (F) development. Muscle attachment sites (MASs) are denoted by yellow lines. (G) Scatter plot depicting VL3 muscle diameter. The diameter of WT muscles increase from the L2 to the L3 stage. This cell size increase is abolished in tn-/-. N ≥ 8. (H) Bar graph shows that ECAR measurements are decreased in isolated tn-/- muscle carcasses compared to WT. N ≥ 4. (I) Analysis of the glycolytic rate in WT or tn-/- muscle tissue after subtraction of mitochondrial-produced acidification. This PER is diminished upon loss of TRIM32. N = 4. (J) NADH lifetime image comparison of WT and tn-/- muscles. Box and whisker plot shows WT muscles have significantly lower NADH lifetime, indicative of higher glycolytic flux, than tn-/-. N = 5. Mean +/- SD. (****, p<0.001; ***, p<0.01; *, p<0.05; n.s., not significant). Scale bars: 25 µm (C,E), 50 µm (D,F).
Figure 3—figure supplement 1
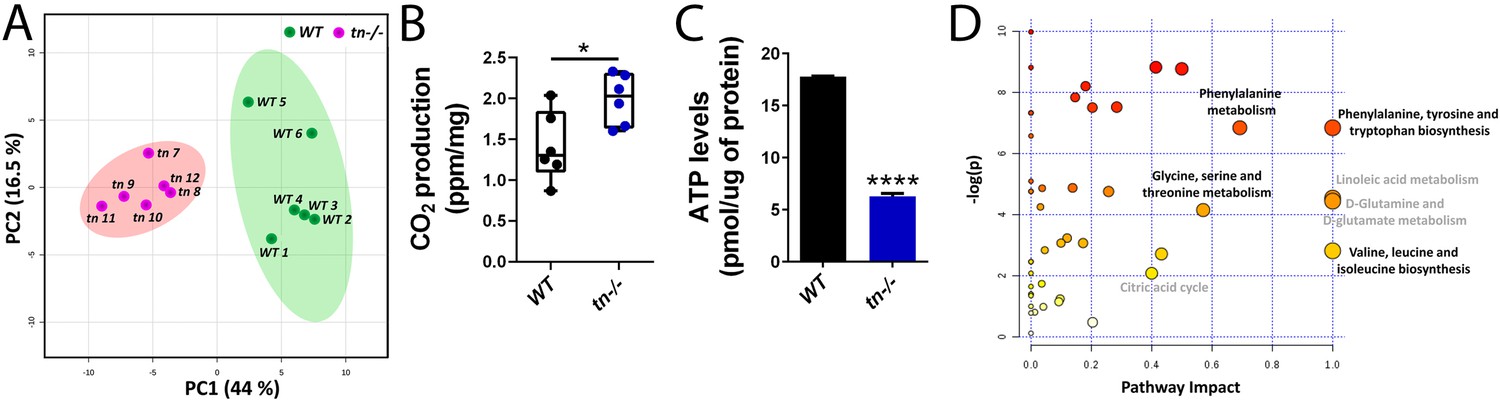
Metabolite analysis upon loss of TRIM32.
(A) PCA analysis depicting metabolite variances between WT (green) and tn-/- (magenta) L3 larvae. PC1, principal component 1. PC2, principal component 2. (B) Scatter plot reveals CO2 production is slightly elevated upon loss of TRIM32 in all tissues. N = 5. (C) Bar graph depicts reduction in ATP levels in tn-/-L3 larvae. N = 25. (D) Pathway analysis reveals a large proportion of amino acid biosynthetic pathways are impacted upon loss of TRIM32. p-Value significance is plotted on the y-axis (yellow to red depict increased p-values). More metabolites affected in a particular pathway increase from left to right along the x-axis. Mean +/- SD (****, p<0.001; *, p<0.05).
Figure 4
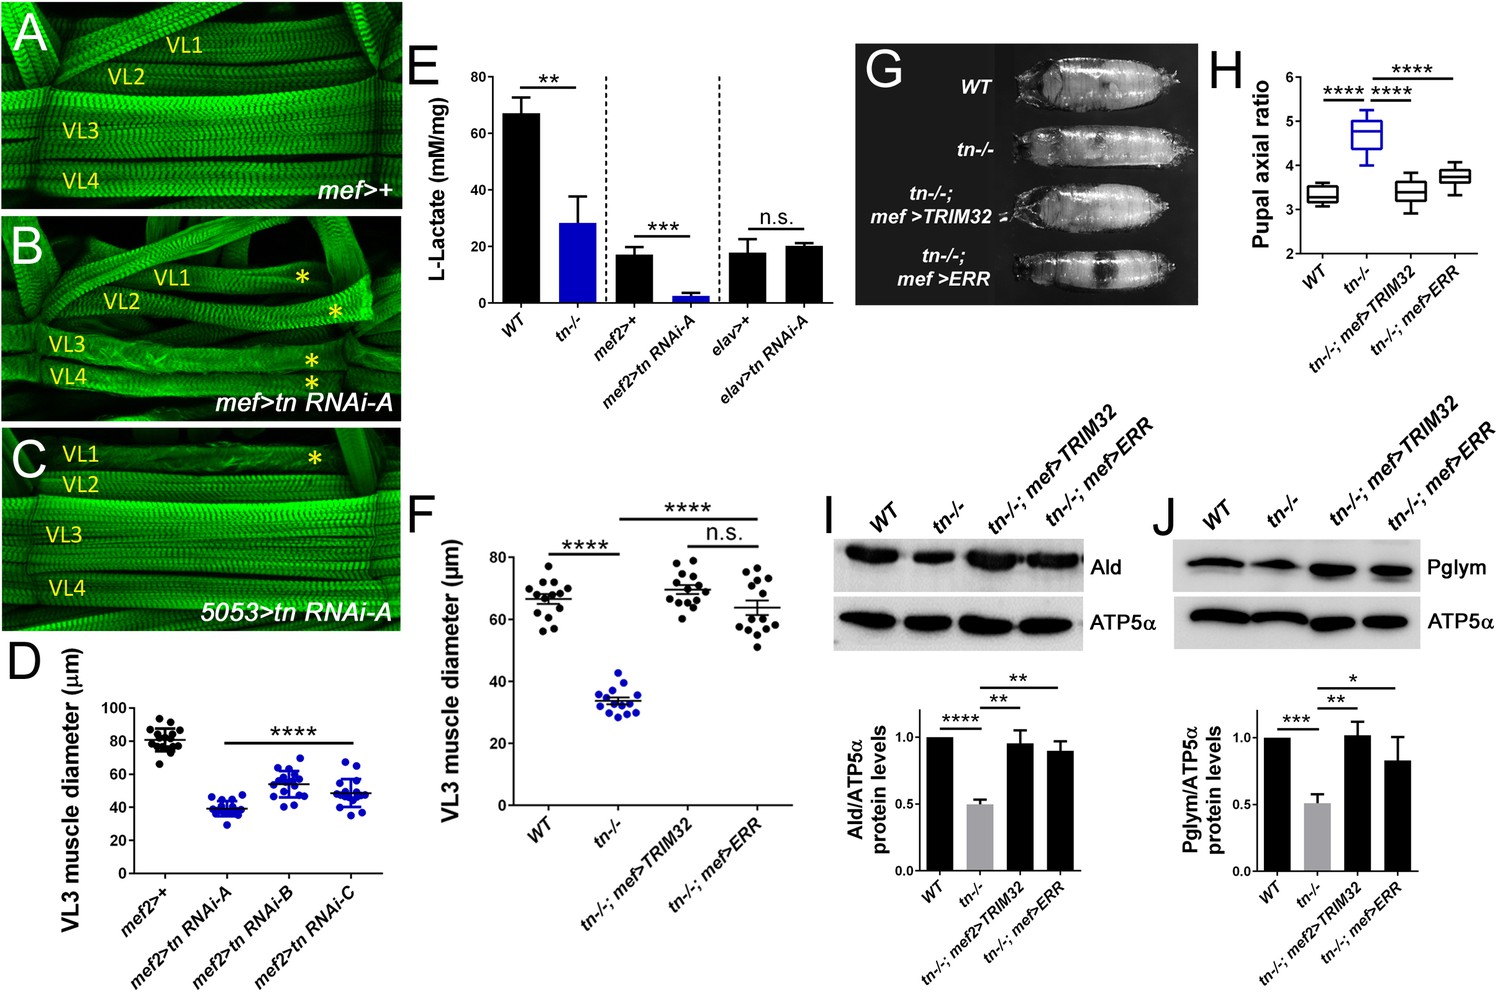
Muscle defects are cell autonomous and can be rescued upon stabilization of glycolytic enzyme levels.
(A–E) Knockdown of TRIM32 in muscle tissue decreases muscle size and reduces lactate levels. (A–C) Phalloidin-labeled VL1-4 muscles in a representative hemisegment of the indicated genotypes. (A) mef2>+ control muscles appear WT. (B,C) RNAi knockdown of tn in all muscles with mef2-Gal4 (B) or only muscle VL1 using the 5053-Gal4 driver (C) show a reduction in muscle size (asterisk). (D) Knockdown of tn mRNA transcripts with three independent UAS-tn RNAi constructs in muscle tissue under control of the mef2 promoter (mef2 >tn RNAi) show reduced VL3 muscle diameter compared to mef2/+ VL3 muscles. N ≥ 10. (E) Bar graph reveals a cell autonomous role for TRIM32 in muscle tissue. L-lactate levels in muscle carcasses are decreased upon loss of TRIM32 in all tissues. Induction of tn RNAi in muscle, but not neuronal tissue, reduces the concentration of muscle-derived lactate. N > 8. (F–J) Muscle-specific expression of TRIM32 (tn-/-, mef >TRIM32) or ERR (tn-/-, mef >ERR) in a tn-/- background attenuates the loss of muscle size, muscle contraction, and stabilizes glycolytic protein levels. (F) Scatter plot shows that the reduced VL3 muscle diameter upon loss of TRIM32 is restored upon expression of TRIM32 or ERR in muscle tissue. N ≥ 10. (G,H) The inability to contract body wall muscles in tn-/- causes elongated pupae. Muscle-specific expression of TRIM32 or ERR restores muscle contraction. (G) Representative pupal cases of the indicated genotypes. (H) Quantitation of pupal axial ratios represented by a box and whisker plot. N = 10. (I,J) Western blots showing the relative amounts of Ald or Pglym protein relative to the ATP5α loading control. Both Ald and Pglym protein levels are stabilized upon TRIM32 or ERR expression in muscle tissue compared to tn-/-. N = 3. Mean +/- SD (****, p<0.001; ***, p<0.01; **, p<0.05; *, p<0.01; n.s., not significant).
Figure 5

Amino acid supplementation is sufficient to improve tn-/- muscle mass.
(A) Box and whisker plots showing the relative abundance of individual amino acids in L3 larvae with a FC >1.5 (left panel) or FC <1.5 (right panel) that are significantly reduced upon loss of TRIM32. N = 6. (B–E) Maximum intensity projections of WT (B) or tn-/- (C–E) L3 muscles stained for F-actin. Upper panel depicts two complete hemisegments and lower panel focuses on the VL3 and VL4 muscles. MASs are denoted by yellow lines. (B) An example of thinner WT musculature reared on agar as a sole nutritional source. (C) Muscles in larvae deficient for TRIM32 are substantially thinner when raised on agar alone. (D,E) Suppression of the reduced muscle diameter is observed in tn-/- muscles supplemented with total yeast extract (D) or amino acids (E) compared to tn-/- muscles alone. (F) Scatter plot showing the diameter of muscle VL3 in WT or tn-/- exposed to the indicated nutritional diets. N ≥ 32. (G) Average body mass measurements of WT or tn-/- L3 larvae. Ten individuals were weighed for each biological replicate that was performed in triplicate. (H) Representative pupal cases grown on the indicated diets. (I) The axial ratio (length/width) of pupal cases represented by box and whisker plots. N ≥ 10. Mean +/- SD. (****, p<0.001; *, p<0.05; n.s., not significant). Scale bars: 100 µm (A-D, upper panel), 50 µm (A-D, lower panel), 1 mm (H).
Figure 6 with 1 supplement

TRIM32 maintains glycolytic-mediated growth in the larval brain.
(A–F) L3 larval brains labeled with DAPI (blue) and F-actin (green). (A) A representative micrograph of a WT larval brain showing the individual brain lobes (BL) and the ventral nerve cord (VNC). (B) The overall size of tn-/- brains is reduced due to mutations in tn. (C) Control brains expressing the pan-neuronal elav-Gal4 driver. (D) RNAi knockdown of tn in neurons under control of the elav promoter causes smaller brains. (E,F) Expression of mef2-Gal4 alone (E) or mef2 >tn RNAi in muscle tissue does not alter brain size (F). (G) Scatter plot depicting the entire brain area (including the BL and VNC) of WT, tn-/-, Gal4 driver controls, or tissue-specific tn RNAi knockdown brains. N ≥ 9. (H) Glycolytic rate assay shows a reduction in the proton efflux rate (PER) upon loss of TRIM32 in isolated L3 larval brains. The glycolytic rate is calculated after subtraction of mitochondrial-produced acidification. N = 4. (I) Bar graph representing L-lactate levels in isolated larval brain tissue. Only loss of TRIM32 in brain, but not muscle tissue, caused a reduction in L-lactate levels. N ≥ 15. Scale bar: 100 µm (A–F). Mean +/- SD. (****, p<0.001; ***, p<0.01; n.s., not significant).
Figure 6—figure supplement 1
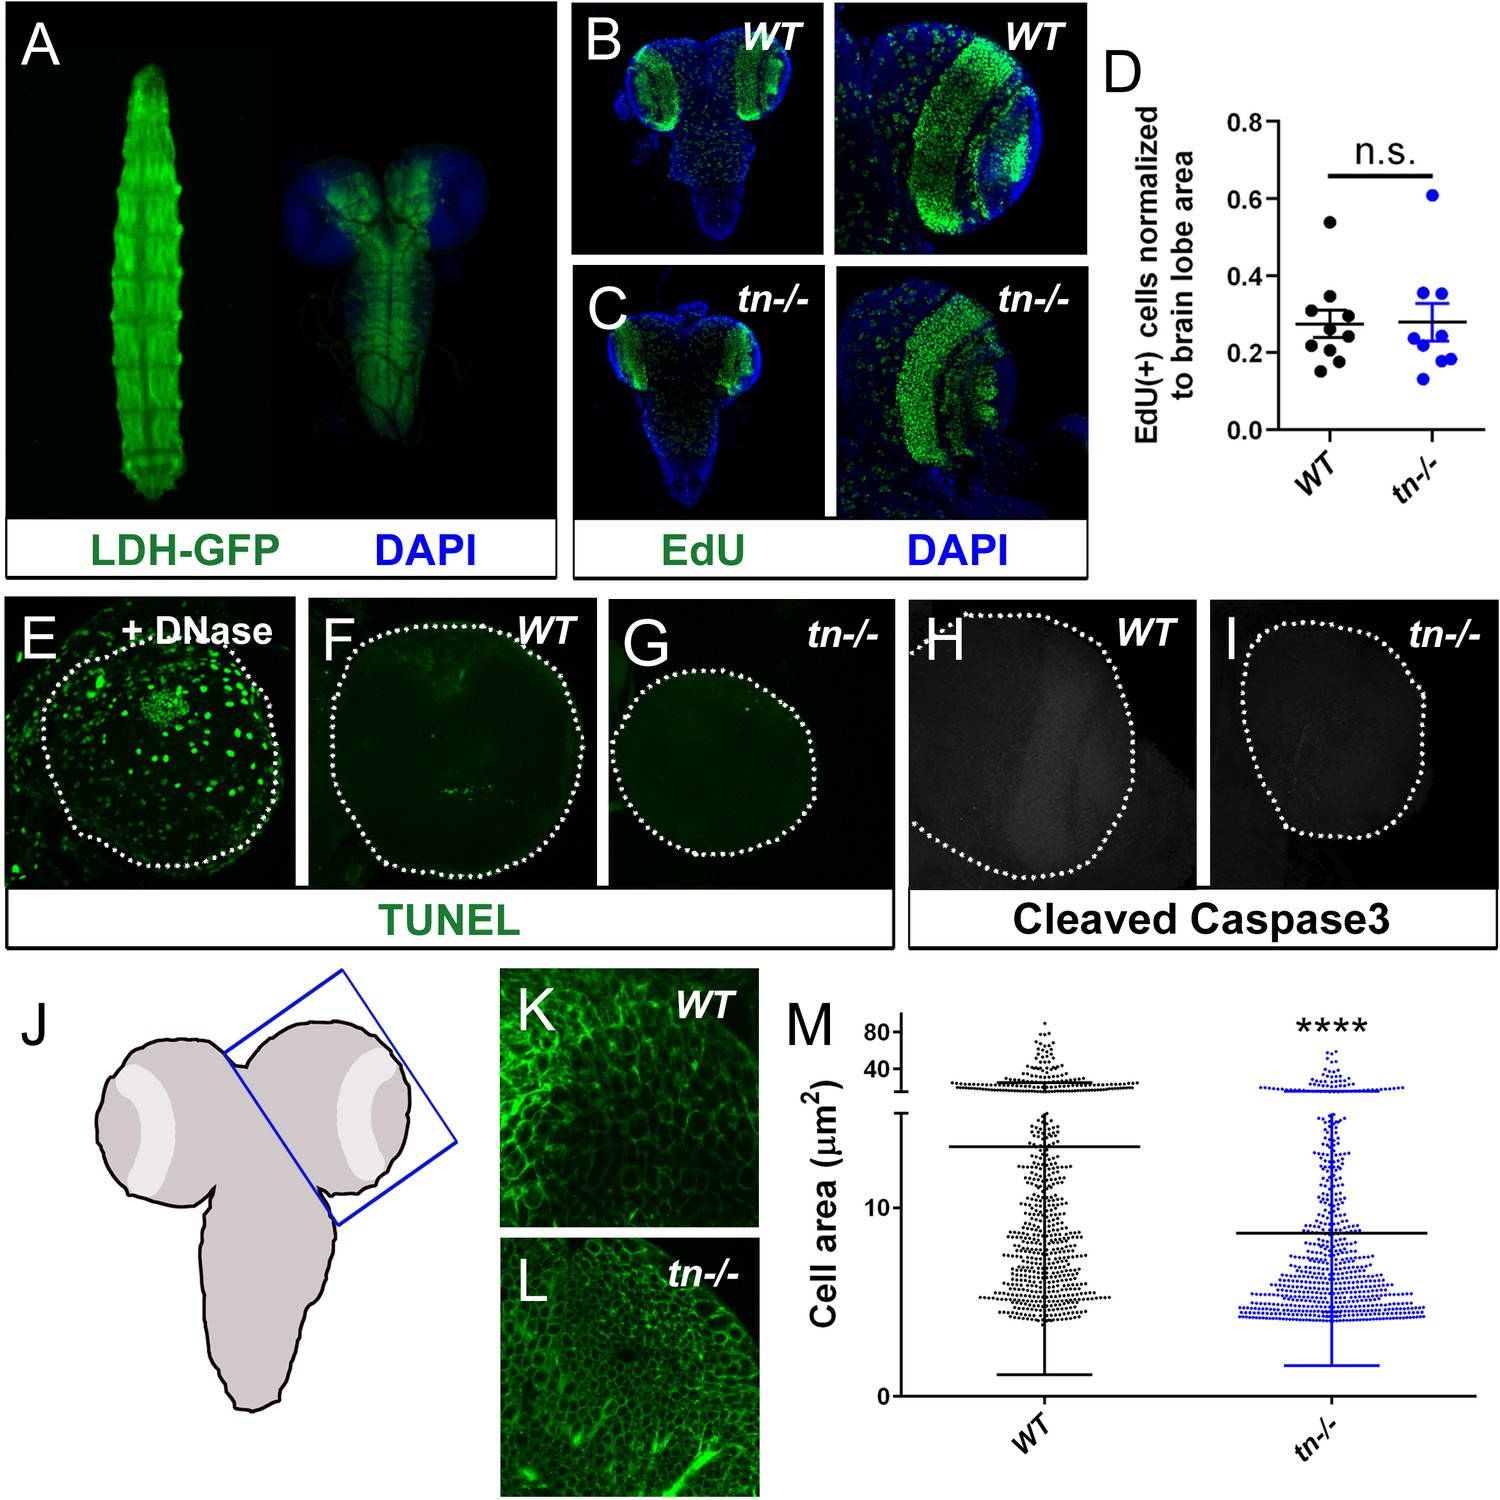
Cell proliferation or cell death are not affected in tn-/-.
(A) Endogenous LDH-GFP (green) expression in the somatic muscles of whole larvae (left) and isolated larval brain (right). DAPI (blue) is used to visualize the entire brain lobe. (B,C) EdU incorporation (green) in whole larval brains (left panels) or individual brain lobes (right panels) reveals no difference in the proliferative capacity of neuroblasts. DAPI (blue) demarcates the outlines of each tissue. (D) Scatter plot depicting the average number of EdU(+) cells normalized to the brain lobe area. N ≥ 9. (E–I) Individual brain lobes (white dotted outline) visualized with TUNEL (E–G) or cleaved caspase3 immunostaining (H,I) to assay apoptotic cells. There is no difference in the number of TUNEL(+) or Caspase3(+) cells in WT or tn-/-. Tissue treated with DNase served as a positive control for TUNEL labeling (E). (J–M) Analysis of cell size in the larval brain lobe. (J) Schematic of larval brain. Blue box indicates region of brain lobe images. (K,L) Representative micrograph of phalloidin-stained cells in the lobe region of WT (K) or tn-/- brains (L). (M) Quantification reveals various sizes of neuroblasts in brain lobe tissue. Overall cell size is reduced upon loss of TRIM32. N ≥ 300 cells in 10 independent brain lobes of each genotype. Mean +/- SD (****, p<0.001; n.s., not significant).
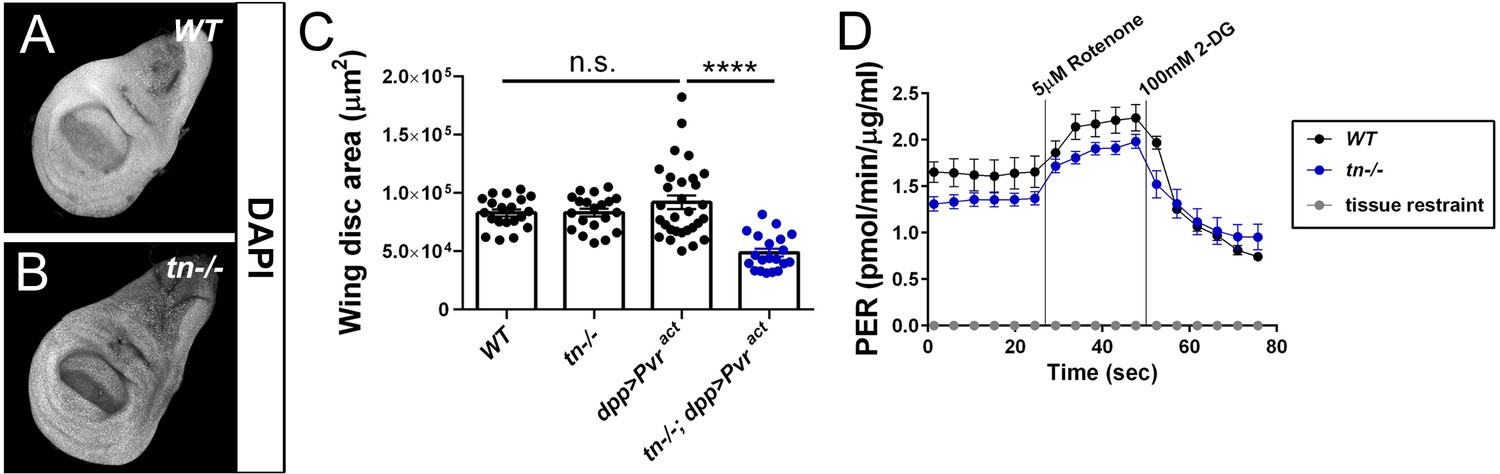
Figure 7 with 2 supplements
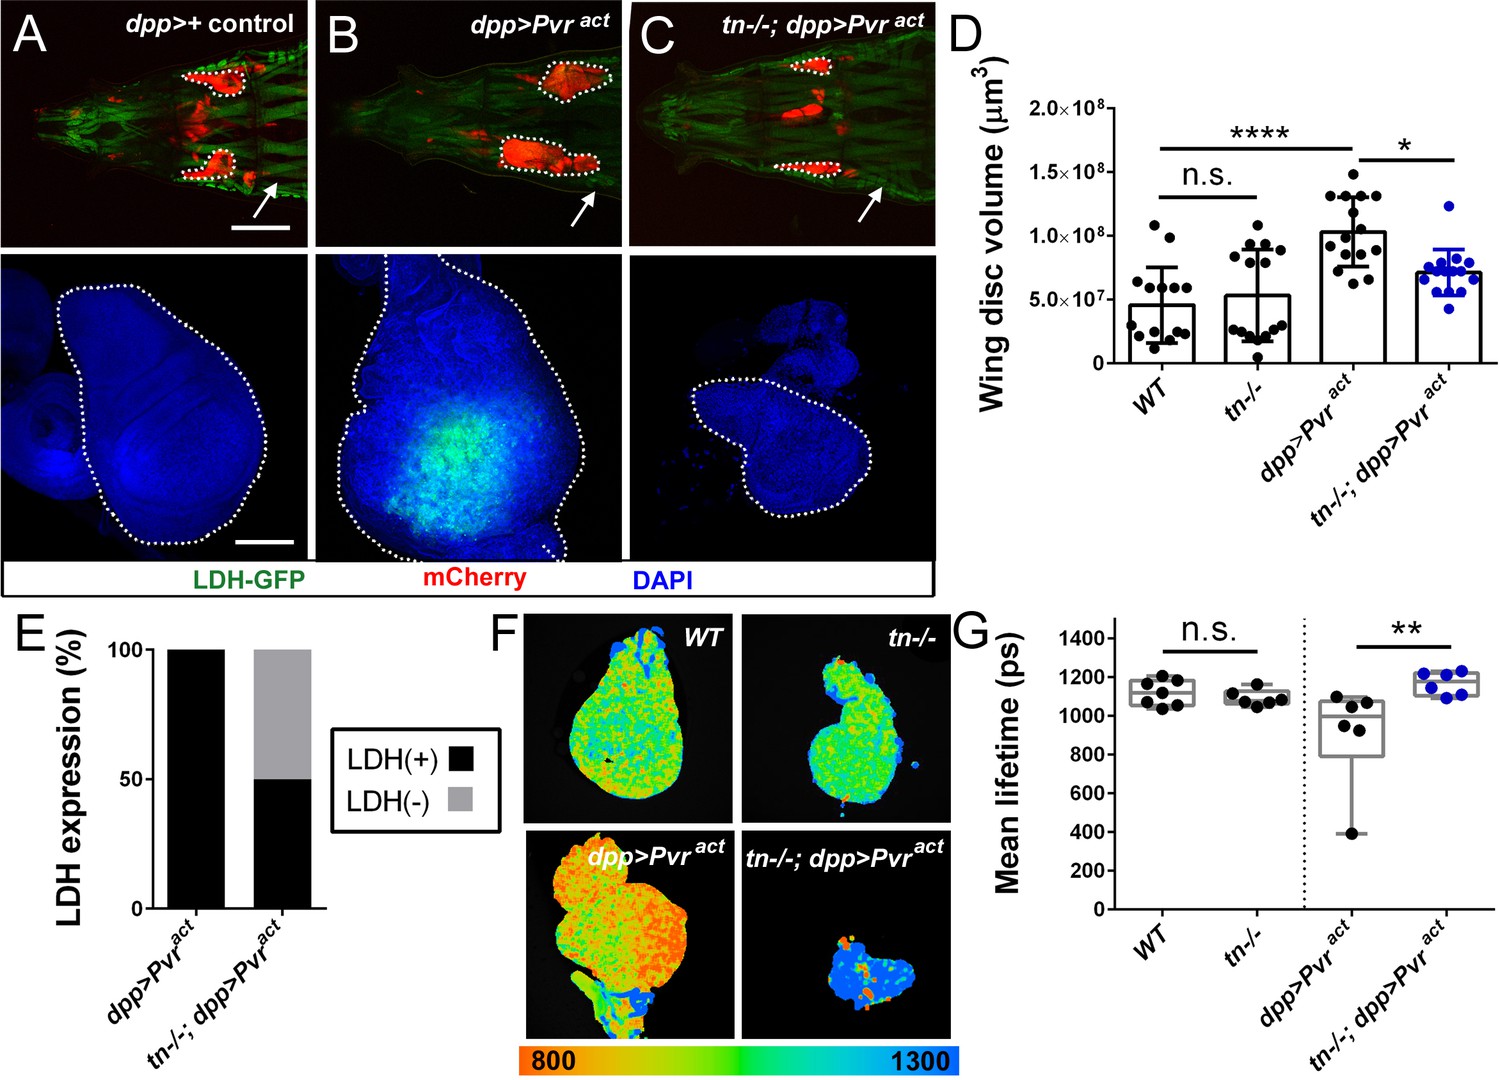
Loss of TRIM32 reduces Pvr-induced glycolytic tumor growth.
(A–C) Either intact (upper panel; red) or isolated (lower panel, blue) wing discs from L3 larvae of the indicated genotypes. LDH-GFP is high in somatic muscles (white arrow). Wing discs are outlined (white dotted outlines). (A) The normal size and shape of control dpp-Gal4/+ wing discs. (B) Overexpression of the activated Pvr receptor (dpp >Pvract) causes tissue overgrowth and an increase in LDH-GFP expression (green). (C) Tumor growth in a tn-/- host is dramatically reduced in size. (D) Overall wing disc volumes are represented in this column plot. N ≥ 15. (E) Approximately 50% of LDH-GFP(+) cells induced by activated Pvr expression is reduced upon loss of TRIM32. N = 20. (F) Representative fluorescence lifetime micrographs of control (WT or tn-/-) or tumorous (dpp >Pvract or tn-/-; dpp >Pvract) wing discs. (G) Box and whisker plot confirms no difference in the glycolytic profile between WT or tn-/- discs. The decreased lifetime in dpp >Pvract discs, indicative of higher glycolytic flux, is reduced upon loss of TRIM32. N = 6. Mean +/- SD. (****, p<0.001; *, p<0.05; n.s., not significant). Scale bars: 0.5 mm (A-C, upper panels), 100 µm (A-C, lower panels).
Figure 7—figure supplement 1
Wing disc size and glycolysis are not altered in tn-/-.
(A,B) Isolated L3 wing discs are the same size when isolated from WT (A) or tn-/- (B) L3 larvae. (C) Scatter plot depicting the relative wing disc area in the indicated genotypes. N ≥ 20. (D) PER, a measure of the glycolytic rate, between WT and tn-/- wing discs appear similar. N = 10. Mean +/- SD. (****, p<0.001; *, p<0.05; n.s., not significant).
Figure 7—figure supplement 2
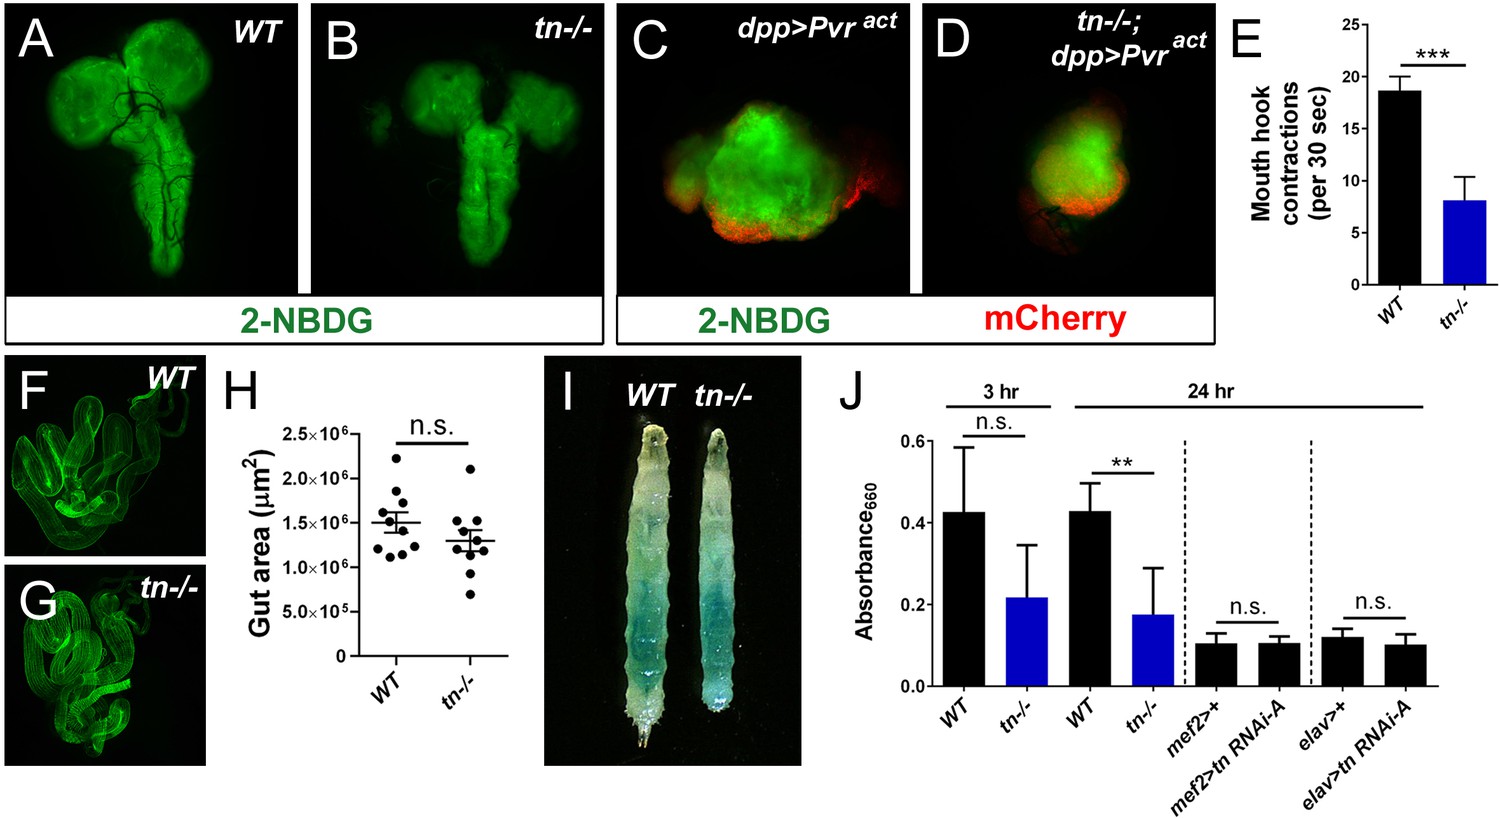
Glucose uptake and feeding behavior upon whole animal or tissue-specific loss of TRIM32.
(A–D) Incubation of the fluorescent glucose analog 2-NBDG with isolated larval brains (A,B) or Pvract tumors (C,D) from L3 larvae show no visible difference in glucose uptake. (E) Mount hook contractions, a proxy for feeding behavior, is decreased in tn-/- larvae. N = 9. (F,G) Isolated L3 midguts from WT (F) or tn-/- (G) stained with phalloidin. (H) Quantitation of total midgut area is not significantly different between WT and tn-/-. N = 8. (I) L3 larvae after feeding dye for 24 hr. (J) Bar graph shows measured absorbance readings from L3 isolated midguts after for 3 hr or 24 hr of feeding. tn-/- show differential food intake, while tissue-specific knockdown of TRIM32 in muscle or brain after 24 hr does not alter food intake. Mean +/- SD. (***, p<0.005; **, p<0.01; n.s., not significant).
Figure 8
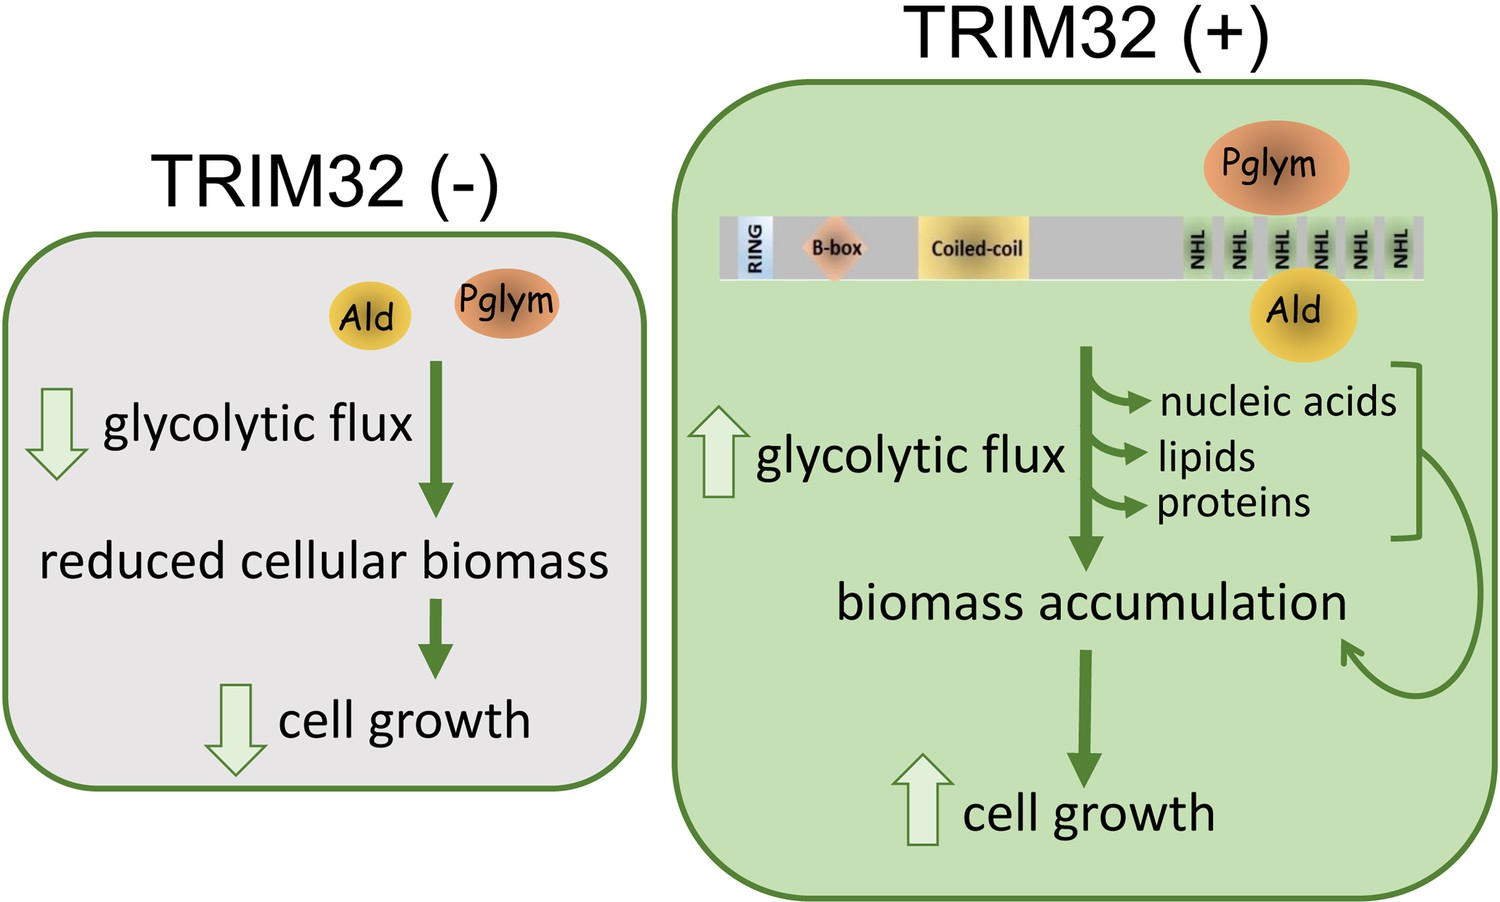
Model for TRIM32 function in the regulation of cell size.
Biochemical interactions between TRIM32 and glycolytic enzymes such as Ald or Pglym cooperate in maintaining glycolytic activity for the synthesis of macromolecules required for cell growth. Loss of TRIM32 results in reduced levels of glycolytic enzymes, reduced glycolytic pathway intermediates, and compromises cell growth.
Author response image 1

Reviewer Figure 1.
Tables
Key resources table
| Reagent type (species) or resource | Designation | Source or reference | Identifiers | Additional information |
|---|---|---|---|---|
| Gene (Drosophila melanogaster) | thin (tn) | LaBeau-DiMenna et al., 2012 | FLYB:FBgn0265356 | |
| Gene (D. melanogaster) | Aldolase 1 (Ald) | FLYB:FBgn0000064 | ||
| Gene (D. melanogaster) | Phosphogylcerate mutase 78 (Pglym) | FLYB:FBgn0014869 | ||
| Genetic reagent (D. melanogaster) | w1118 | Bloomington Drosophila Stock Center (BDSC) | BL3605 | |
| Genetic reagent (D. melanogaster) | tnΔA | LaBeau-DiMenna et al., 2012 | ||
| Genetic reagent (D. melanogaster) | CyO, Tb/Sco | BDSC | BL36335 | |
| Genetic reagent (D. melanogaster) | mef-Gal4 | BDSC | BL27390 | |
| Genetic reagent (D. melanogaster) | elav-Gal4 | BDSC | BL458 | |
| Genetic reagent (D. melanogaster) | 5053Gal4 | BDSC | BL2702 | |
| Genetic reagent (D. melanogaster) | UAS-tn RNAi-A | Vienna Drosophila Resource Center (VDRC) | v19290 | |
| Genetic reagent (D. melanogaster) | UAS-tn RNAi-B | BDSC | BL31588 | |
| Genetic reagent (D. melanogaster) | UAS-tn RNAi-C | VDRC | v19291 | |
| Genetic reagent (D. melanogaster) | dpp-UAS-mcherry, LDH-GFP | Wang et al., 2016 | ||
| Genetic reagent (D. melanogaster) | UAS-Pvract | Wang et al., 2016 | ||
| Genetic reagent (D. melanogaster) | LDH-optGFP | Materials and methods | ||
| Genetic reagent (D. melanogaster) | UAS-TRIM32 | LaBeau-DiMenna et al., 2012 | ||
| Genetic reagent (D. melanogaster) | UAS-ERR-FLAG | Materials and methods | ||
| Antibody | anti-TRIM32 (guinea pig polyclonal) | LaBeau-DiMenna et al., 2012 | (1:500) | |
| Antibody | anti-Pglym (rabbit polyclonal) | Sullivan, 2003 | (1:1000) from Jim Vigoreaux | |
| Antibody | anti-Ald (rabbit polyclonal) | Sullivan, 2003 | (1:1000) from Jim Vigoreaux | |
| Antibody | anti-Tm (rat monoclonal) | Babraham Institute | MAC141 | (1:500) |
| Antibody | anti-hALD | Biorad | VPA00226 | (1:1000) |
| Antibody | anti-hPGAL1 | Cell Signaling | D3J9T | (1:1000) |
| Antibody | anti-ATP5α (mouse monoclonal) | Abcam | Catalog# ab14748 | (1:10000) |
| Antibody | anti-Cleaved Caspase-3 | Cell Signaling | Catalog# 9661 | (1:100) |
| Antibody | Alexa 488 secondaries | Thermo Fisher | Catalog# A12379 | (1:400) |
| Antibody | Rabbit IgG HRP Linked Whole Ab | GE Healthcare | NA934-1ML | (1:3000-1:5000) |
| Antibody | Mouse IgG HRP Linked Whole Ab | GE Healthcare | NA931-1ML | (1:3000-1:5000) |
| Recombinant DNA reagent | pGEX-5X-2_TRIM32_NHL | Materials and methods | nucleotides 3231–4062 | |
| Recombinant DNA reagent | pT7HMT_Ald | Materials and methods | His-tagged Ald | |
| Recombinant DNA reagent | pT7HMT_Pglym | Materials and methods | His-tagged Pglym | |
| Recombinant DNA reagent | pT7HMT_SCIN | Ricklin et al., 2009 | His-tagged SCIN | |
| Sequence-based reagent | pGEX-5X-2_NHL_5’F | Integrated DNA Technologies (IDT) | Oligonucleotide GGGATCCCCGGAATTCCCCTGCGCAAGCGCCAGCAGCTGTTC | |
| Sequence-based reagent | pGEX-5X-2_NHL_5’R | Integrated DNA Technologies (IDT) | Oligonucleotide ATAAGAATGCGGCCGCCTGGCGCTTGCGCAGGTACACCTG | |
| Sequence-based reagent | pT7HMT_Tm2_5’F | Integrated DNA Technologies (IDT) | Oligonucleotide ACAGGATCCATGGACGCCATCAAGAAGAAG | |
| Sequence-based reagent | pT7HMT_Tm2_5’R | Integrated DNA Technologies (IDT) | Oligonucleotide AAGGAAAAAAGCGGCCGCTTAGTAGCCAGCCAATTCGGC | |
| Sequence-based reagent | pT7HMT_Ald_5’F | Integrated DNA Technologies (IDT) | Oligonucleotide ACAGGATCCATGACGACCTACTTCAACTACC | |
| Sequence-based reagent | pT7HMT_Ald_5’R | Integrated DNA Technologies (IDT) | Oligonucleotide AAGGAAAAAAGCGGCCGCTCAATACCTGTGGTCATCCAC | |
| Sequence-based reagent | pT7HMT_Pglym_5’F | Integrated DNA Technologies (IDT) | Oligonucleotide CAGGGGTCGACAATGGGCGGCAAGTACAAGATC | |
| Sequence-based reagent | pT7HMT_Pglym_5’R | Integrated DNA Technologies (IDT) | Oligonucleotide AAGGAAAAAAGCGGCCGCTTACTTGGCCTTGCCCTGGGC | |
| Sequence-based reagent | UAS—2xFLAG-ERR_5’F | Integrated DNA Technologies (IDT) | Oligonucleotide AGCGGCCGCCATGGACTACAAGGACGACGATGACAAGGGTGACTACAAGGACGACGATGACAAGGGTATGTCCGACGGCGTCAGCATC | |
| Sequence-based reagent | UAS—2xFLAG-ERR_3’F | Integrated DNA Technologies (IDT) | Oligonucleotide AGCGGCCGCTTATCACCTGGCCAGCGGCTCGAGC | |
| Commercial assay or kit | ATP Determination Kit | Molecular Probes | Catalog# A22066 | |
| Commercial assay or kit | Bradford Assay kit | Bio-Rad | Catalog# 5000001 | |
| Commercial assay or kit | RNAeasy Mini Kit (50) | Qiagen | Catalog# 74104 | |
| Commercial assay or kit | DeadEnd Fluorometric TUNEL System | Promega | Catalog# G3250 | |
| Commercial assay or kit | Click-iT EdU Cell Proliferation Kit for Imaging, Alexa Fluor 488 dye | Thermo Fisher | Catalog# C10337 | |
| Commercial assay or kit | ECL Plus Western Blotting Detection kit | Thermo Fisher | Catalog# 32132 | |
| Commercial assay or kit | SuperScript VILO cDNA Synthesis Kit | Invitrogen | Catalog# 11754050 | |
| Commercial assay or kit | EnzyChromTM L-Lactate Assay Kit | BioAssay Systems | Catalog# ECLC-100 | |
| Commercial assay or kit | Power UP SYBR Green Master mix | Applied Biosystems | Catalog# A25741 | |
| Chemical compound, drug | DAPI (4′,6-diamidino-2-phenylindole, Dihydrochloride) | Thermo Fisher | Catalog# D1306 | |
| Chemical compound, drug | 2-NBDG | Cayman Chemicals | Catalog# 186689-07-6 | |
| Chemical compound, drug | Erioglaucine disodium salt | Milipore Sigma | Catalog# 861146 | |
| Chemical compound, drug | Formaldehyde, 16% Methanol-free, ultra-pure EM Grade | Polyscience | Catalog# 1881lawr4 | |
| Chemical compound, drug | Triton X-100 | Sigma-Aldrich | Catalog# 9002-93-1 | |
| Chemical compound, drug | Tween20 | Sigma-Aldrich | Catalog# 9005-64-5 | |
| Chemical compound, drug | Glycerol | Fisher | Catalog# BP229-1 | |
| Chemical compound, drug | Methanol | Fisher | Catalog# A412P-4 | |
| Chemical compound, drug | Bromophenol-blue | Amresco | Catalog# 0449–25G | |
| Chemical compound, drug | DTT (1,4-Dithiothreitol) | Sigma-Aldrich | Catalog# 3483-12-3 | |
| Chemical compound, drug | Tris base | Fisher | Catalog# BP152-5 | |
| Chemical compound, drug | Sodium Chloride | Fisher | Catalog# BP358-212 | |
| Chemical compound, drug | Hydrochloric acid | Fisher | Catalog# A144-50/A144S212 | |
| Chemical compound, drug | Potassium Chloride | Fisher | Catalog# BP366-500 | |
| Chemical compound, drug | Magnesium Chloride | Fisher | Catalog# M-33 | |
| Chemical compound, drug | Sodium Bicarbonate | Fisher | Catalog# S233-500 | |
| Chemical compound, drug | Calcium Chloride Dihydrate | Fisher | Catalog# C-79 | |
| Chemical compound, drug | Sodium Dodecyl Sulphate | Fisher | Catalog# BP166-500 | |
| Chemical compound, drug | Sucrose | Fisher | Catalog# S3-500 | |
| Chemical compound, drug | Agar,Powder/Flakes | Fisher Scientific | Catalog# BP1423-500 | |
| Chemical compound, drug | L-amino acids | Sigma-Aldrich | Catalog# 200-157-7 | |
| Chemical compound, drug | Yeast Extract Hy-Yest 412 | Kind gift from Dr. Lawrence Davis | N/A | |
| Chemical compound, drug | HEPES | Fisher | Catalog# BP310-100 | |
| Chemical compound, drug | TEMED | Santa Cruz | Catalog# SC-29111 | |
| Chemical compound, drug | Ammonium Persulfate | Fisher | Catalog# BP179-100 | |
| Chemical compound, drug | HisPur Ni-NTA Magnetic Beads | Thermo Fisher | Catalog# 88831 | |
| Chemical compound, drug | Cyanogen bromide activated Sepharose 4B | Sigma-Aldrich | Catalog# 68987-32-6 | |
| Software, algorithm | Graphpad Prism 7.00 | GraphPad Software | https://www.graphpad.com/ | |
| Software, algorithm | ImageJ | NIH | https://imagej.nih.gov/ij/ | |
| Software, algorithm | Adobe Photoshop | Adobe | N/A | |
| Software, algorithm | Zen black | Zeiss | N/A | |
| Other | Zeiss 700 confocal microscope | Zeiss | N/A |
Table 1
Statistics Summary.
| Panel | Graph type | N value | Statistical test used | Precision | p-value |
|---|---|---|---|---|---|
| Figure 2E,F | Bar graphs | Pool of 5 larvae per genotype (N = 3 biological replicates and N = 3 technical replicates) | Unpaired t-test | Mean +/- SD | p<0.05 |
| Figure 3A | Volcano plot | Pool of 25 larvae per genotype (N = 6 biological replicates) | Univariate fold change and t-test analysis | N/A | FC > 1.5 p<0.05 |
| Figure 3B | Box and whisker plot | Pool of 25 larvae per genotype (N = 6 biological replicates) | Unpaired t-test | Min to max | p<0.05 |
| Figure 3G | Scatter plot | N ≥ 8 | One-Way ANOVA Kruskal-Wallis test | Mean +/- SD | p<0.001, p<0.01 |
| Figure 3H | Bar graph | N = 4 | Unpaired t-test | Mean +/- SD | p<0.05 |
| Figure 3I | Mean and error plot | N = 4 | Holm-Sidak t-test | Mean +/- SEM | p<0.05 |
| Figure 3J | Box and whisker plot | N = 5 | Unpaired t-test | Min to max | p<0.05 |
| Figure 4D | Scatter plot | N ≥ 10 | One-Way ANOVA Kruskal-Wallis test | Mean +/- SD | p<0.001 |
| Figure 4E | Bar graph | Pool of at least eight larvae per genotype (N = 3 biological replicates and N = 3 technical replicates) | One-Way ANOVA Kruskal-Wallis test | Mean +/- SD | p<0.005, p<0.01, n.s. |
| Figure 4F | Scatter plot | N ≥ 10 | One-Way ANOVA Kruskal-Wallis test | Mean +/- SD | p<0.001 |
| Figure 4H | Box and whisker plot | N = 10 | One-Way ANOVA Kruskal-Wallis test | Mean +/- SD | p<0.001 |
| Figure 4I,J | Bar graph | Pool of 5 larvae per genotype (N = 3 biological replicates and N = 3 technical replicates) | One-Way ANOVA Kruskal-Wallis test | Mean +/- SD | p<0.001, p<0.005, p<0.05, p<0.01 |
| Figure 5A | Box and whisker plot | Pools of 25 larvae (N = 6 biological replicates) | Unpaired t-test | Min to max | p<0.05 |
| Figure 5F | Scatter plot | N ≥ 32 | One-Way ANOVA Kruskal-Wallis test | Mean +/- SD | p<0.05, p<0.001, n.s. |
| Figure 5G | Column graph | Pool of 10 larvae per genotype subjected to each condition (N = 3) | One-Way ANOVA Kruskal-Wallis test | Mean +/- SD | p<0.05, p<0.001, n.s. |
| Figure 5I | Box and whisker plot | N ≥ 10 | One-Way ANOVA Kruskal-Wallis test | Min to max | p<0.001 |
| Figure 6G | Scatter plot | N ≥ 9 | One-Way ANOVA Kruskal-Wallis test | Mean +/- SD | p<0.001, n.s. |
| Figure 6H | Mean and error plot | N = 4 | Holm-Sidak t-test | Mean +/- SEM | p<0.05 |
| Figure 6I | Bar graph | Pool of at least 15 larvae per genotype (N = 3 biological replicates and N = 3 technical replicates) | One-Way ANOVA Kruskal-Wallis test | Mean +/- SD | p<0.005, p<0.01, n.s. |
| Figure 7D | Scatter plot | N = 15 | One-Way ANOVA Kruskal-Wallis test | Mean +/- SD | p<0.001, p<0.05, n.s. |
| Figure 7E | Bar graph | N = 20 | Unpaired t-test | Mean | N/A |
| Figure 7G | Box and whisker plot | N = 6 | One-Way ANOVA Kruskal-Wallis test | Min to max | p<0.05, n.s. |
| Figure 2—figure supplement 1C | Bar graph | Pool of 5 larvae per genotype (N = 3 biological replicates and N = 3 technical replicates) | Unpaired t-test | Mean +/- SD | p<0.05 |
| Figure 2—figure supplement 1F,G | Bar graph | Pool of 5 larvae per genotype (N = 3 biological replicates and N = 3 technical replicates) | Unpaired t-test | Mean +/- SD | n.s. |
| Figure 3—figure supplement 1B | Box and whisker plot | N = 6 chambers with five larvae per genotype | Unpaired t-test | Min to max | p<0.05 |
| Figure 3—figure supplement 1C | Bar graph | Pool of 25 larvae per genotype (N = 3 biological replicates and N = 3 technical replicates) | Unpaired t-test | Mean +/- SD | p<0.001 |
| Figure 6—figure supplement 1D | Scatter plot | N ≥ 9 | Unpaired t-test | Mean +/- SD | n.s. |
| Figure 6—figure supplement 1M | Scatter plot | N > 300 cells measured in 10 brains of each genotype | Unpaired t-test | Mean +/- SD | p<0.001 |
| Figure 7—figure supplement 1C | Scatter plot | N ≥ 20 | One-Way ANOVA Kruskal-Wallis test | Mean +/- SD | p<0.001, n.s. |
| Figure 7—figure supplement 1D | Mean and error plot | N = 10 | Holm-Sidak t-test | Mean +/- SEM | n.s. |
| Figure 7—figure supplement 2E | Bar graph | N = 9 | Unpaired t-test | Mean +/- SD | p<0.005 |
| Figure 7—figure supplement 2H | Scatter plot | N = 8 | Unpaired t-test | Mean +/- SD | n.s. |
| Figure 7—figure supplement 2J | Bar graph | Pool of at least 15 larvae per genotype (N = 3 biological replicates and N = 3 technical replicates) | One-Way ANOVA Kruskal-Wallis test | Mean +/- SD | p<0.05, n.s. |
Additional files
Download links
A two-part list of links to download the article, or parts of the article, in various formats.
Downloads (link to download the article as PDF)
Open citations (links to open the citations from this article in various online reference manager services)
Cite this article (links to download the citations from this article in formats compatible with various reference manager tools)
Drosophila TRIM32 cooperates with glycolytic enzymes to promote cell growth
eLife 9:e52358.
https://doi.org/10.7554/eLife.52358


