Cortical RORβ is required for layer 4 transcriptional identity and barrel integrity
- Department of Biology and Program in Neuroscience, Brandeis University, United States
- Janelia Research Campus, United States
- Laboratory of Endocrinology and Receptor Biology, National Institutes of Health, NIDDK, United States
Figures
Figure 1
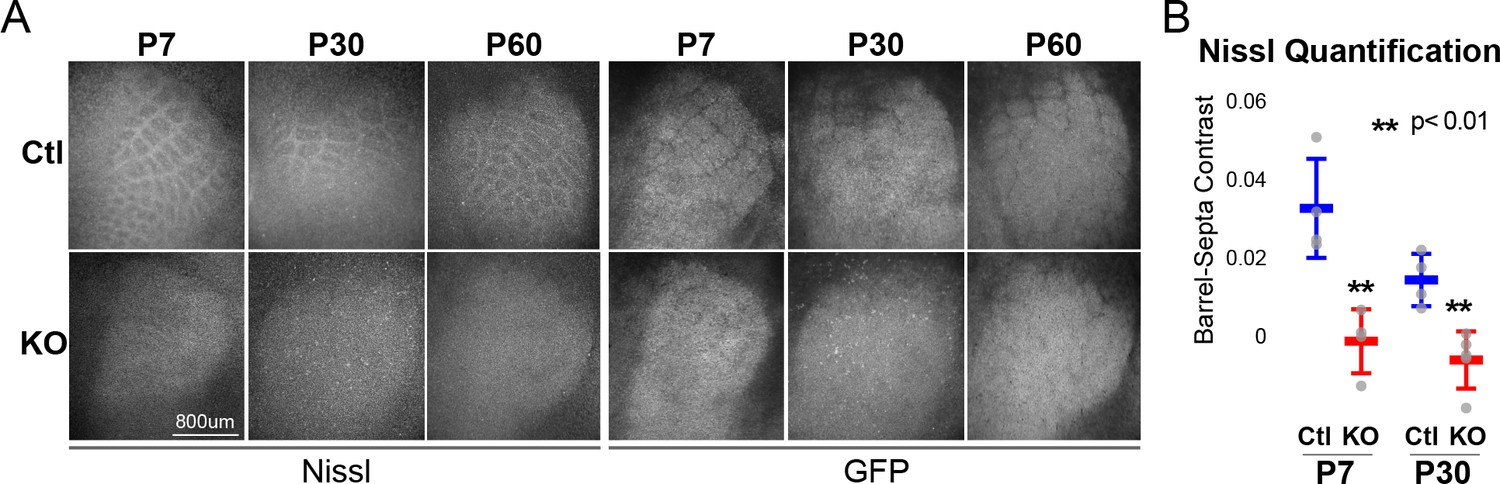
RORβ is required for postnatal barrel wall formation.
Nissl staining on tangential sections of flattened cortices after global, constitutive knock-out shows barrel wall organization requires RORβ. (A) Nissl staining (Left) in whisker barrel field as identified by strong GFP expression (Right). Control (Ctl) and Rorb knock-out (KO) animals were age matched at P7, P30, and P60. (B) Quantification of barrel hollow to barrel walls/septa contrast (Barrel-Septa Contrast) from Nissl staining. N = 4 age-matched animals for each genotype (Ctl or KO). Two tissue sections containing the largest portions of whisker barrel field identified by GFP signal were averaged per animal. Whisker plots show the median per animal ± standard deviation. Gray points show mean contrast for each animal. P-value by independent sample t-test, between Ctl and KO at each timepoint.
Figure 2 with 1 supplement
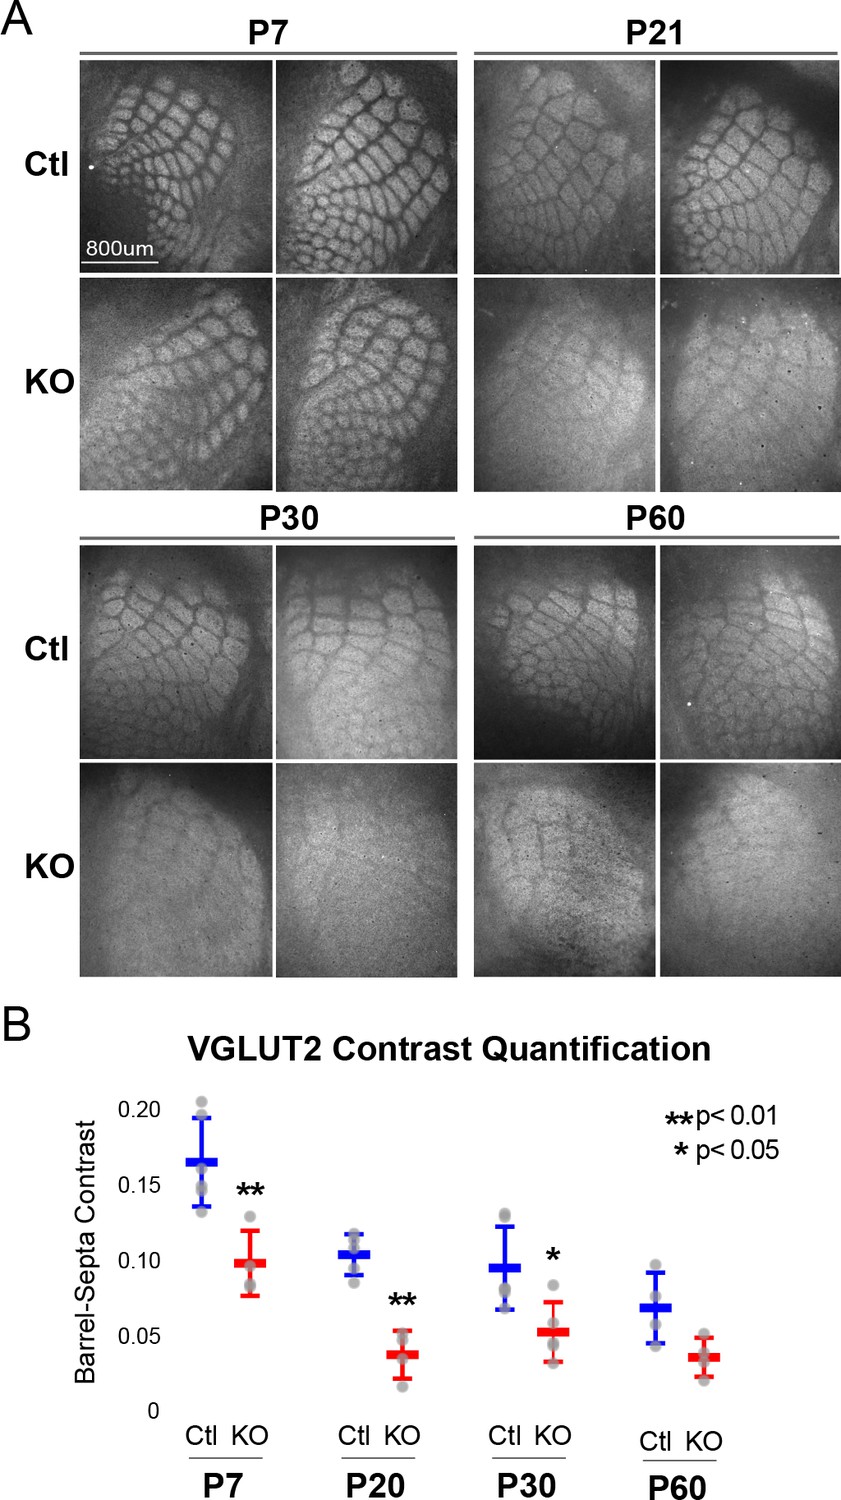
Rorb KO reduces thalamocortical afferent (TCA) segregation.
(A) VGLUT2 staining of excitatory thalamic axon terminals in cortical whisker barrels shows normal initial TCA patterning at P7 but with reduced barrel-septa contrast in Rorb KO, and further reductions in contrast with age in both KO and Ctl. Ctl and Rorb KO animals were age matched. (B) Quantification of barrel hollow to barrel walls/septa contrast (Barrel-Septa Contrast) in VGLUT2. N = 4–6 age-matched animals for each genotype (Ctl or KO; each section shown is from a separate animal). Two tissue sections containing the largest portions of whisker barrel field identified by GFP signal were averaged per animal. Whisker plots show median contrast per animal ± standard deviation. Gray points show mean contrast for each animal. P-value by independent sample t-test, between Ctl and KO at each timepoint.
Figure 2—figure supplement 1
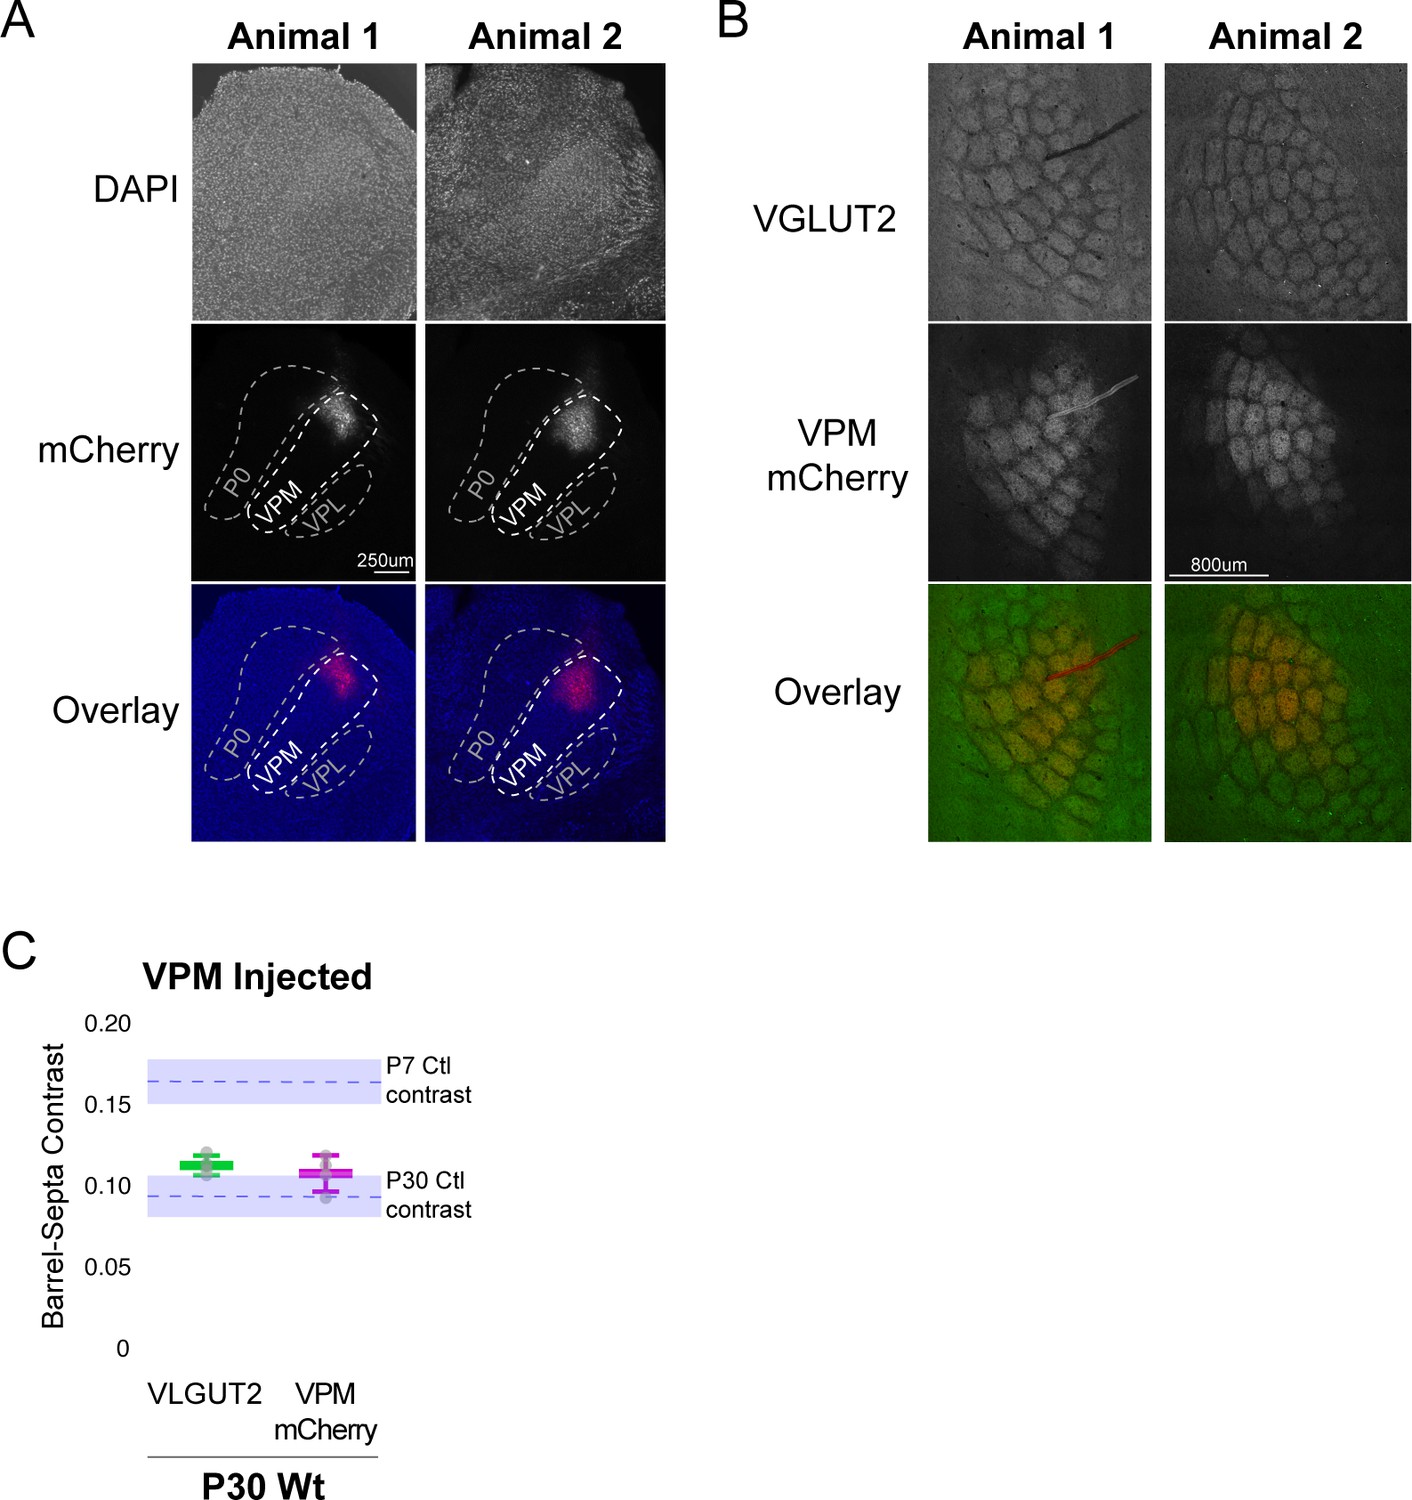
Barrel-septa contrast of VPM-specific afferents.
(A) Immunofluorescence images of thalamus from two animals injected with AAV carrying an hSyn-mCherry construct. Fixed tissue sections were counter stained with DAPI. (B) Immunofluorescence images of whisker barrel cortex from two animals with AAV-hSyn-mCherry injected into barreloids of the VPM. Fixed tissue sections were stained for VGLUT2. (C) Quantification of barrel-septa contrast for VLGUT2 and mCherry. N = 4 P30 wild-type animals. The two tissue sections with the strongest mCherry signal and containing at least two mCherry-saturated barrels (barrels surrounded by barrels with mCherry signal) were quantified per animal. Only mCherry-saturated barrels were quantified. The same barrels were quantified for mCherry and VLGUT2. Whisker plots show the median per animal ± standard deviation. Gray points show mean contrast for each animal. Dashed blue lines and blue shaded regions show the mean ± standard deviation contrast for Ctl P7 and P30 samples replotted from Figure 2B for reference. ANOVA with posthoc Tukey test reveals significant differences between P7 and all of the P30 groups (p=1.7×10⁻⁴, 9.1 × 10⁻³ and 4.3 × 10⁻³, for p7 vs. original VGLUT2 group, current VGLUT2 group and current mCherry group) but no differences between P30 groups (p=0.61, 0.81 and 0.99 for original vs. current VGLUT2, original VGLUT2 vs. mCherry and current VGLUT2 vs. mCherry). A single t-test between the current VGLUT2 and mCherry contrasts was also not significant.
Figure 3 with 1 supplement
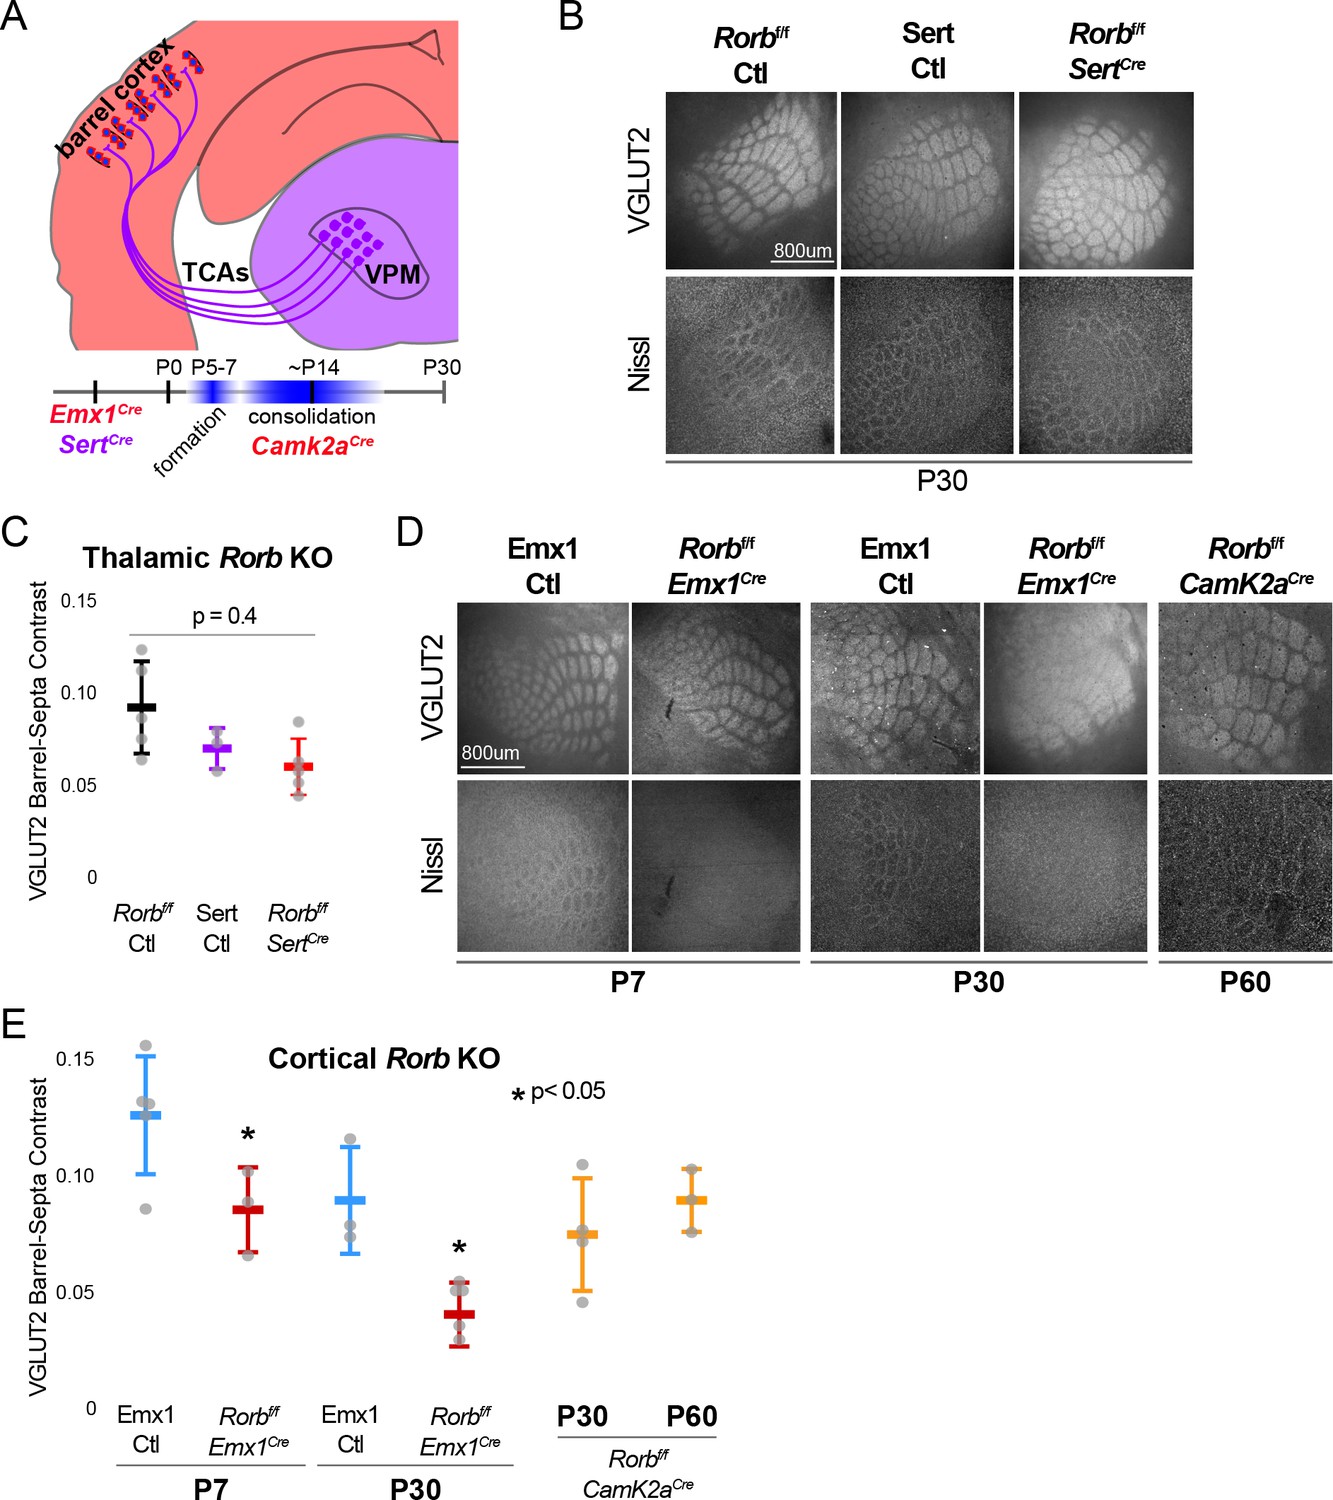
RORβ is required in the cortex but not the thalamus for barrel organization.
(A) Diagram and timeline of Cre driver line tissue-specific expression in cortex versus thalamus and timing relative to barrel formation and consolidation. Color indicates expression in cortex (red) or thalamus (purple). (B) VGLUT2 and Nissl staining of whisker barrel cortex at P30 from floxed Rorb control without Cre (Rorbf/f Ctl), SertCre control (Sert Ctl) without floxed Rorb and the cross (Rorbf/f SertCre), which knocks out Rorb specifically in thalamus during embryonic development. Whisker plots as described for Figure 1B. (C) Quantification of VGLUT2 Barrel-Septa Contrast in genetic lines from B. N = 3–5 P30 animals. Quantification and plotting as described in Figure 2B. P-value by ANOVA. (D) VGLUT2 and Nissl staining of whisker barrel cortex from Emx1Cre control (Emx1 Ctl) without floxed Rorb, and the cross (Rorbf/f Emx1Cre) from P7 and P30 animals, and a P60 animal from floxed Rorb crossed to a CamK2aCre driver line. Emx1Cre knocks out Rorb specifically in forebrain during embryonic development, and CamK2aCre knocks out Rorb in forebrain neurons at postnatal weeks 2–3. (E) Quantification of VGLUT2 Barrel-Septa Contrast in genetic lines from D. N = 3–5 animals per age group. Quantification and plotting as described in Figure 2B. P-values by independent sample t-test, between Ctl and KO at each time point. CamK2aCre showed no difference from Rorbf/f Ctl. Whisker plots as described for Figure 1B.
Figure 3—figure supplement 1
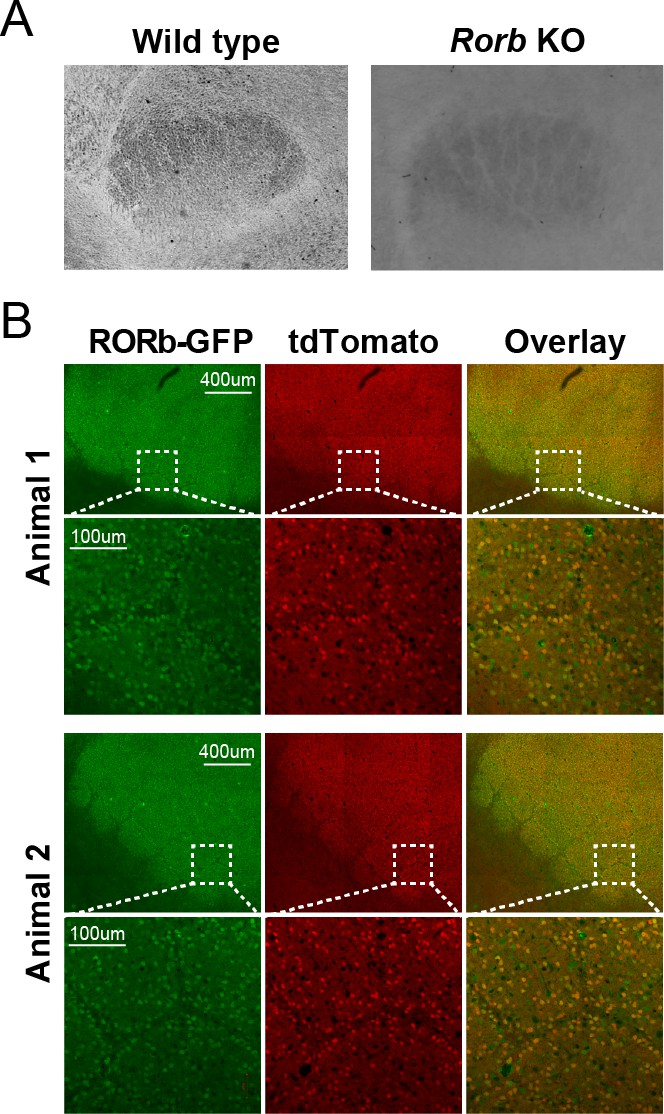
Reporter expression in L4 of Camk2aCre Rorb KO.
(A) Cytochrome oxidase staining of barreloids in thalamus. (B) Fluorescent images of barrel cortex from P30 mice with CamK2ACre; Rosa26tdTomato; Rorbflox/GFP.
Figure 4
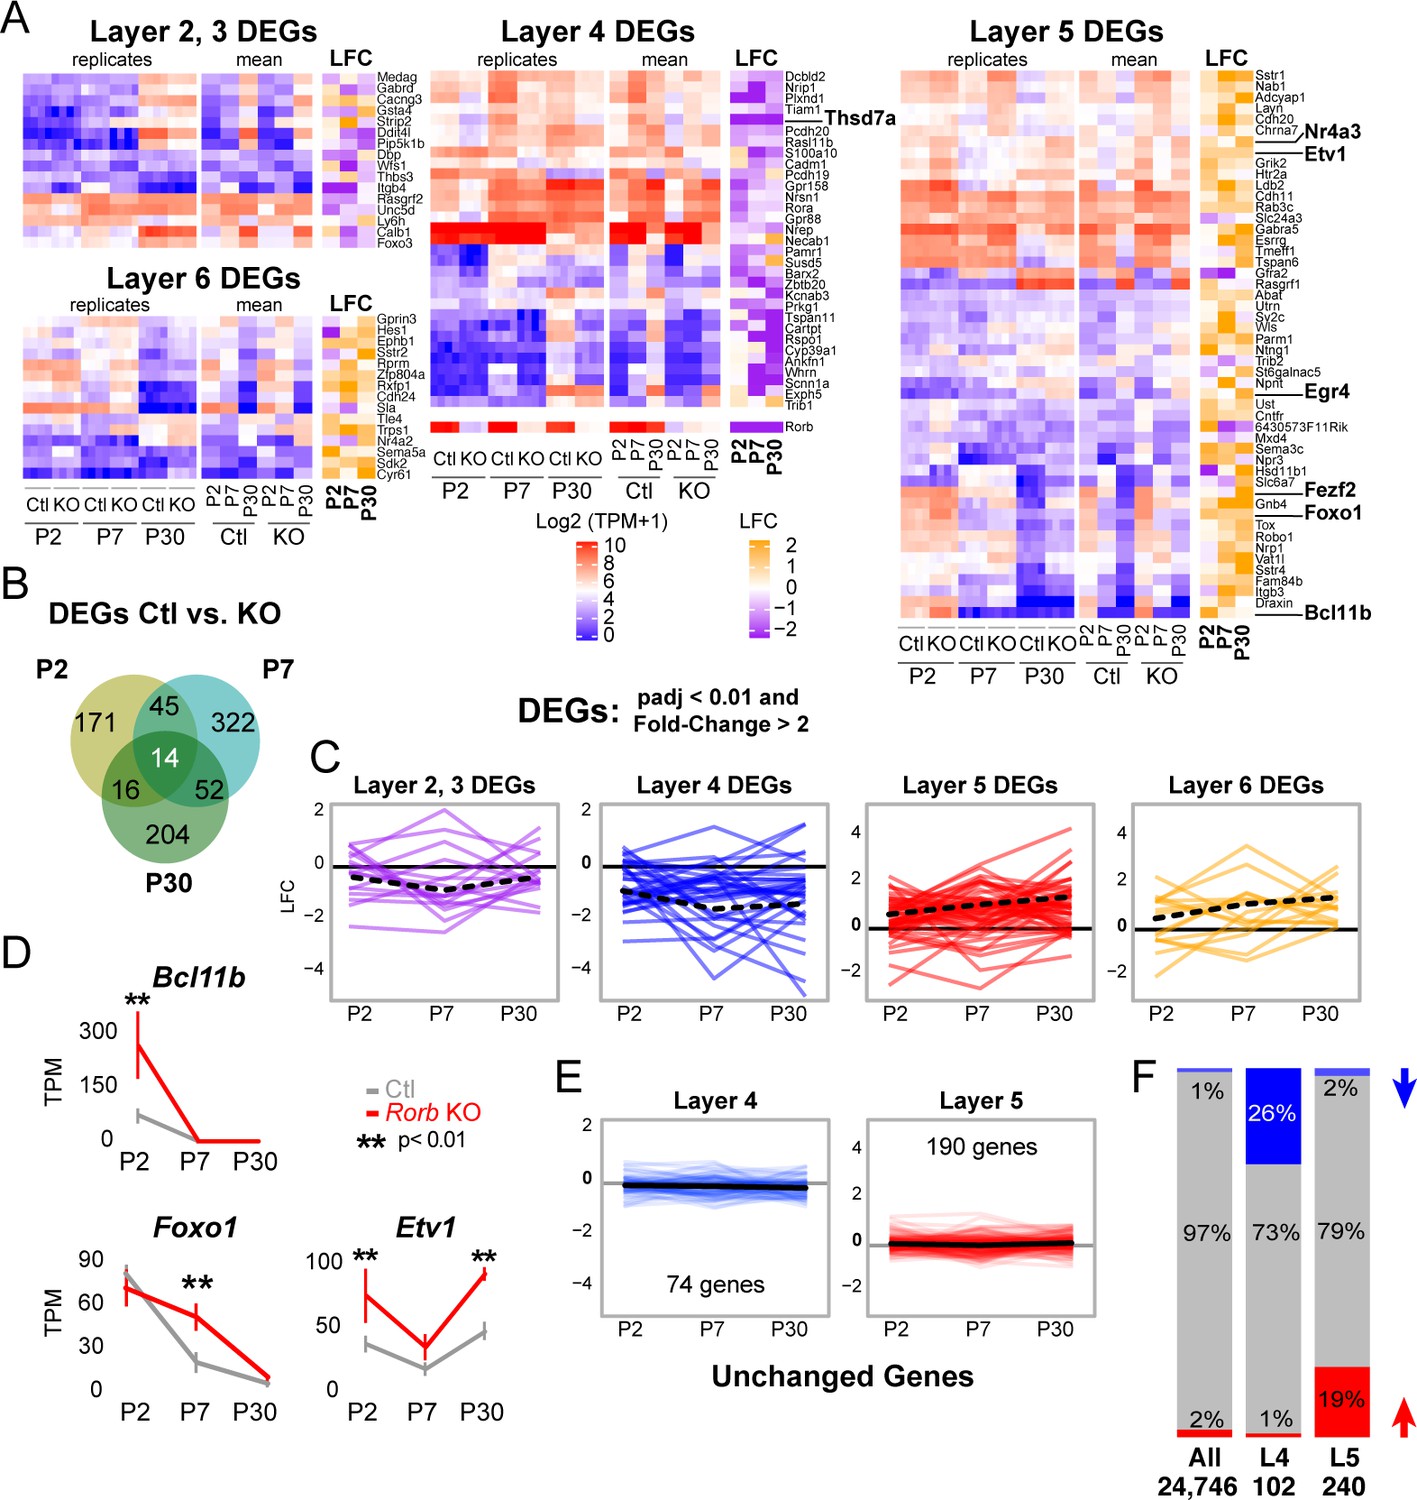
Rorb KO disrupts the layer four expression profile including up-regulating many deep layer genes.
(A) Heatmaps showing marker genes or genes strongly enriched, as identified in the Allen Brain Atlas, for each layer of the neocortex differentially expressed between control and Rorb KO. Log-transformed transcripts per million (TPM) are color scaled in red and blue for each of the four RNA-seq replicates in the left most heatmap and the mean for each time point and genotype in the middle heatmaps. Log fold change (LFC) between control (Ctl) and Rorb KO is color-scaled in orange and purple in the right most heatmaps. (B) Numbers of differentially expressed genes (DEGs) for the three ages examined. (C) Line plots showing LFC for the same genes. The solid black line indicates no change. Negative LFC indicates decreased expression in Rorb KO, and LFC >0 indicates increased expression in Rorb KO. Each colored line is a layer-specific DEG and the dashed black line plots the mean across the group of genes. (D) RNA-seq expression of layer 5 TFs. Lines plot the mean ± SE. P by moderated t-test adjusted for multiple comparisons (Benjamini-Hochberg). (E) Additional L4 and L5 genes were identified using the Allen Brain Atlas differential search contrasting L4 SSp structures to L5 SSp. Genes with >1.5 fold change and expression threshold >1.6 were selected. Genes already shown in A-C were removed. Hence each gene shown does not meet statistical criteria for differential expression in Ctl/KO by RNA-seq. Line plots show RNA-seq LFC for each layer-specific gene. The solid black line is the mean across genes and the solid gray line indicates no change. Negative LFC indicates decreased expression in Rorb KO, and LFC >0 indicates increased expression in Rorb KO. (F) Overall (first bar), 1% of genes were downregulated (blue) and 2% were upregulated (red). Downregulated genes were overrepresented (26%) among the 102 L4-specific genes (middle bar), while upregulated genes were overrepresented (19%) among the 240 L5-specific genes. Both overrepresentations were significant (p<2.2e-16) by fisher exact test.
Figure 5 with 1 supplement
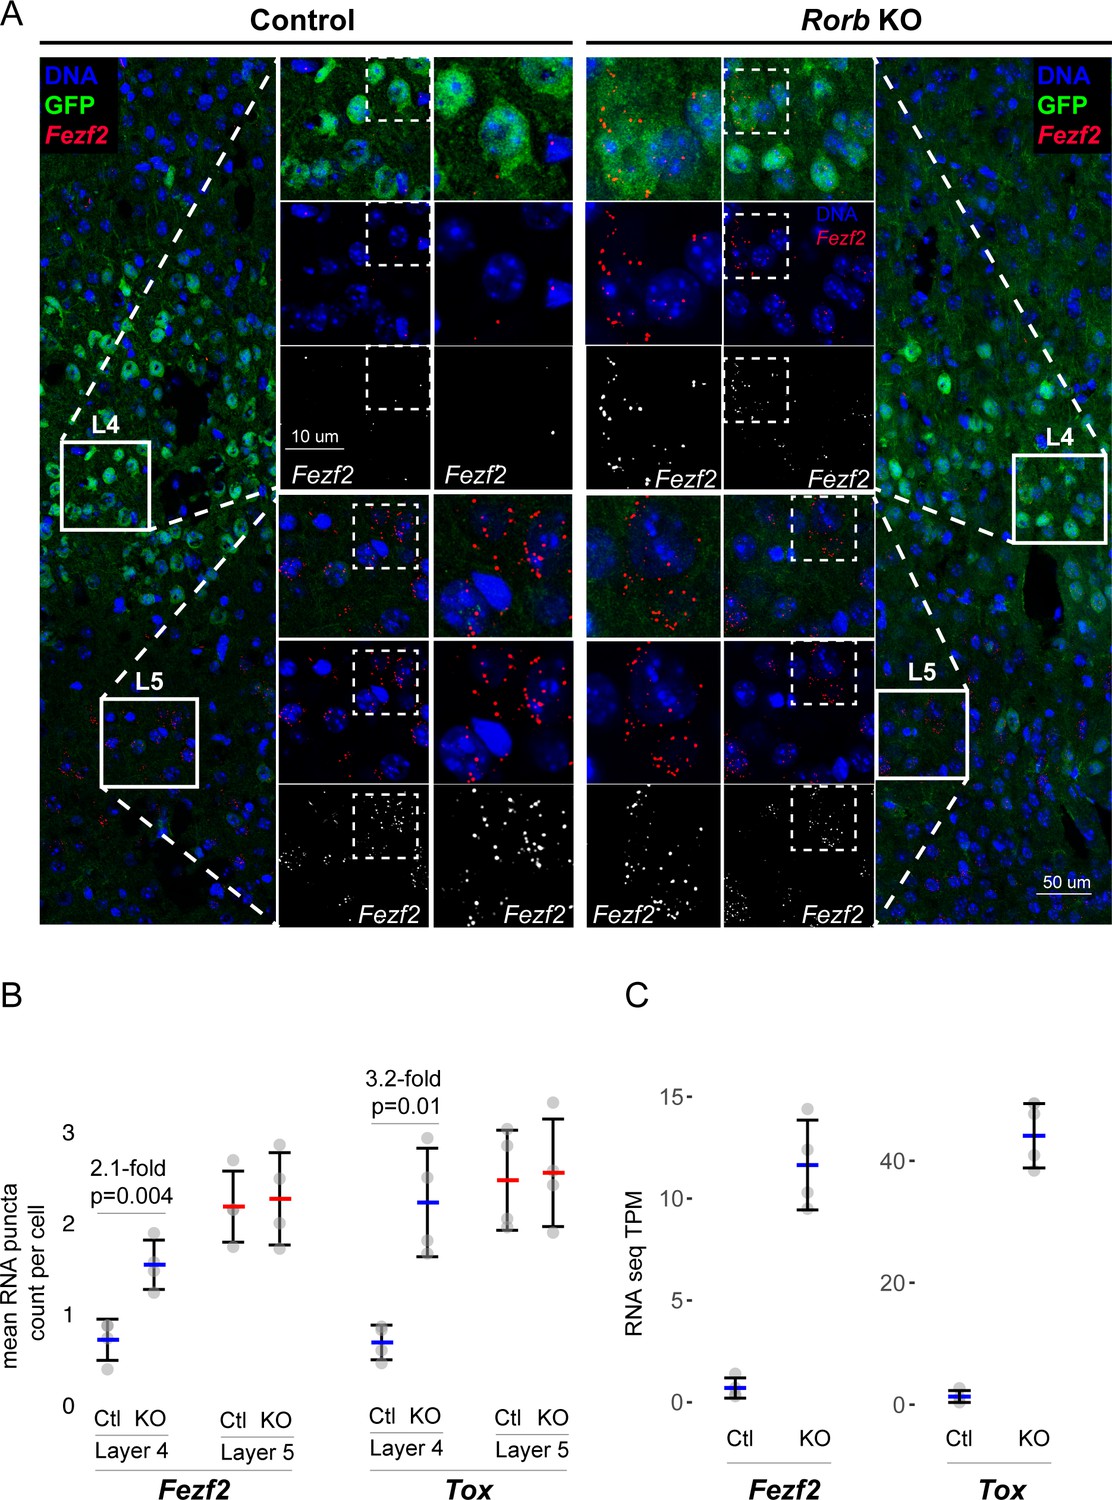
Confirmation of upregulated L5 genes in L4 neurons of Rorb KO.
(A) RNAscope in situ hybridization of Fezf2 in control (Ctl) and Rorb KO tissue. (B) Quantification of Fezf2 and Tox RNA puncta per cell in either layer 4 or layer 5 of control and Rorb KO tissue. Tox images are shown in a Figure 5—figure supplement 1. N = 4 P30 animals for each genotype (Ctl or KO). Two regions containing S1 were averaged per animal. Whisker plots show the median per animal ± standard deviation. Gray points show mean number of puncta per cell for each layer in each animal. P-value by independent sample t-test. (C) RNA-seq changes in Fezf2 and Tox expression at P30 replotted from heatmap of Figure 4. Gray points show values for individual replicates. Whisker plots show the mean ± standard deviation (N = 4).
Figure 5—figure supplement 1
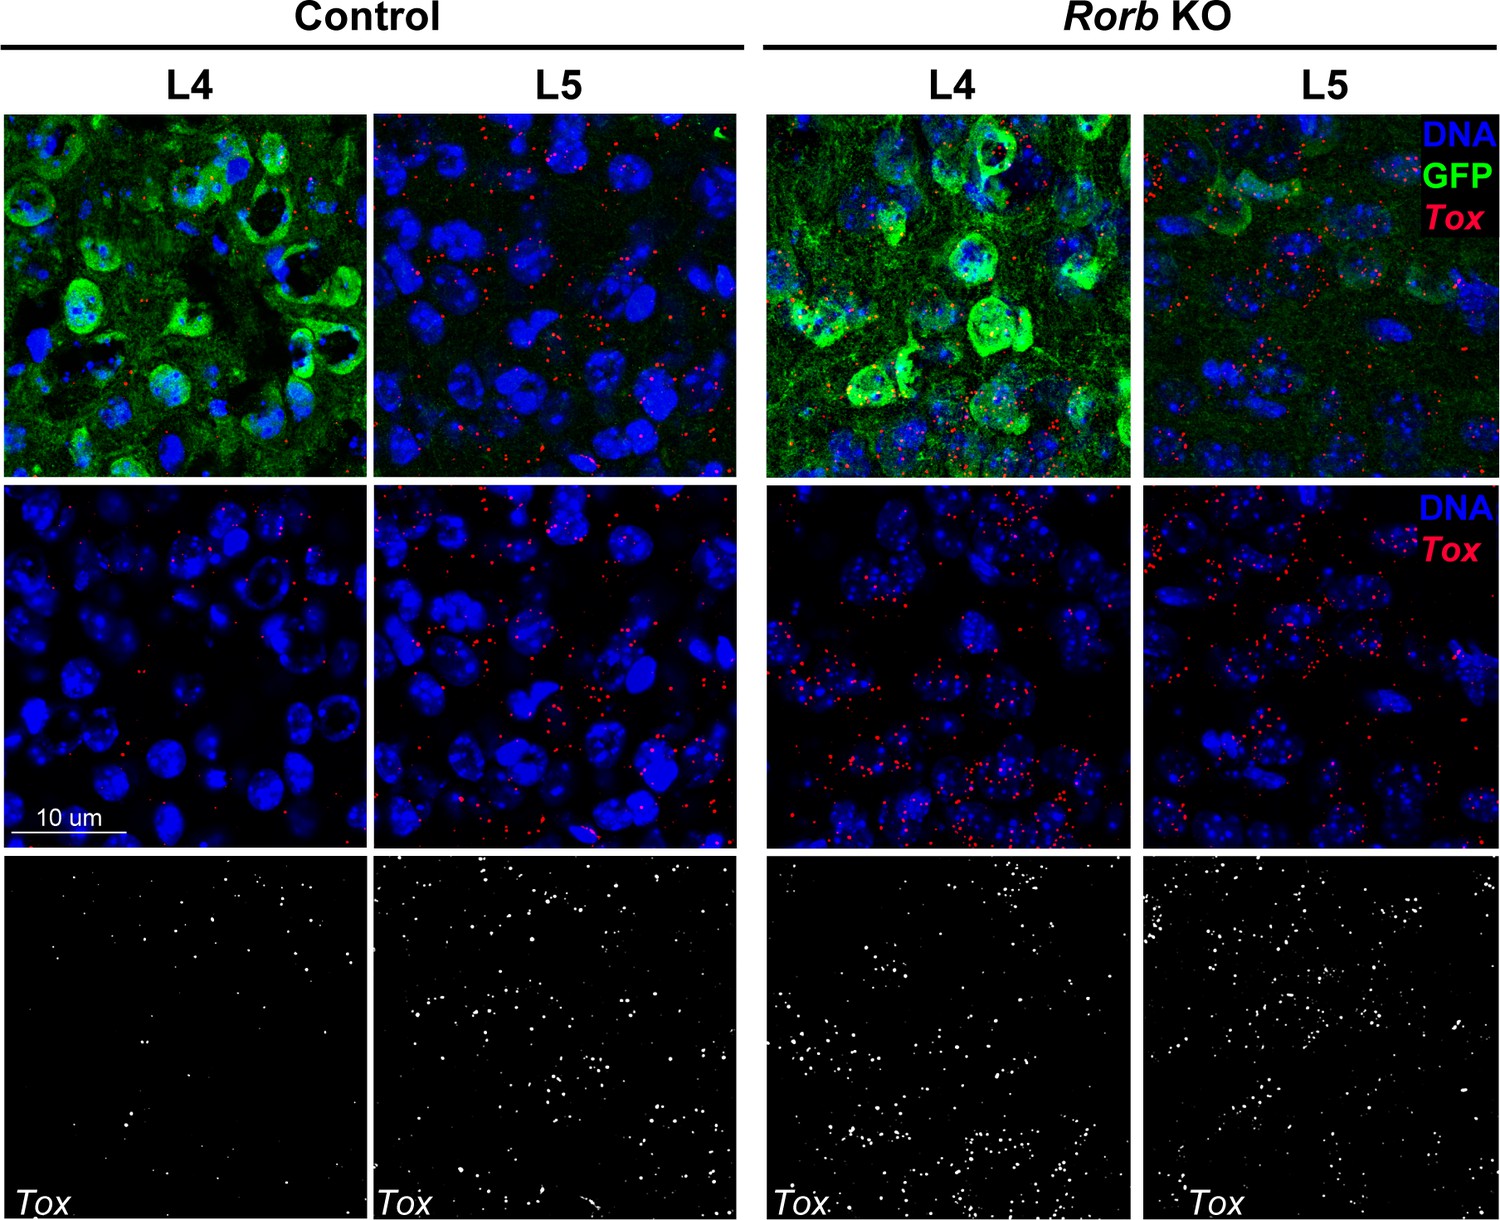
RNAscope in situ hybridization of Tox in control (Ctl) and Rorb KO tissue.
Quantification of puncta per cell is shown in Figure 5.
Figure 6 with 1 supplement
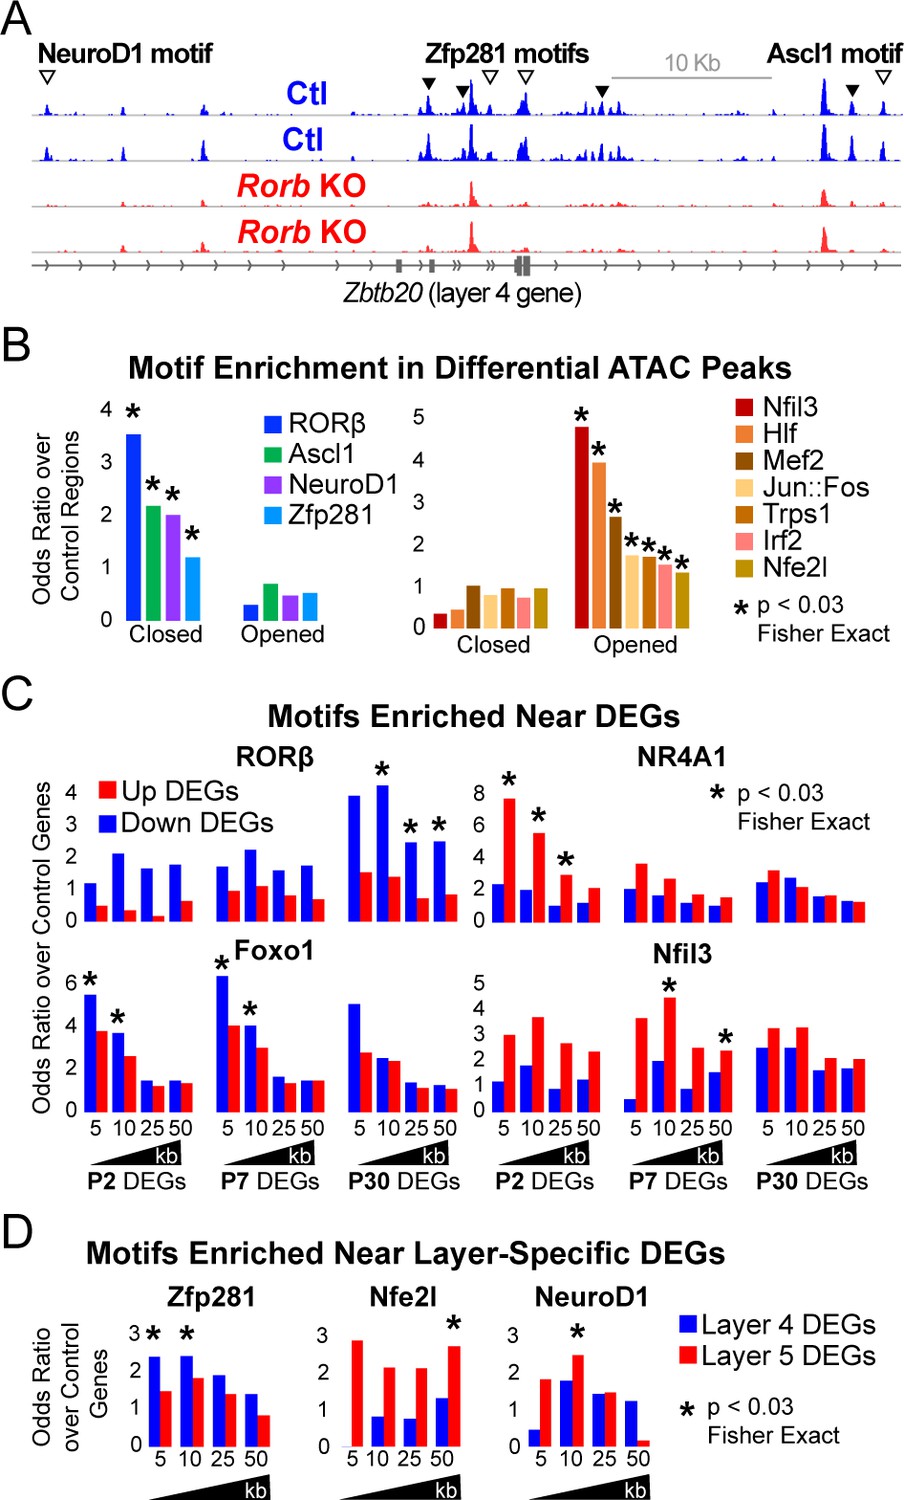
Rorb KO disrupts transcription factor binding sites near DEGs.
(A) ATAC-seq normalized reads per million (RPM) for biological replicates, y-axis scaled 0–2. Samples collected from GFP+ S1 L4 RorbGFP/+ neurons (Ctl, blue) and GFP+ S1 L4 RorbGFP/GFPneurons (KO, red). Arrows indicate differential peaks (fold change ≥2, FDR < 0.02). Open arrows indicate differential peaks with transcription factor motif sequences as in (B). (B) Cross-validated motifs with significant enrichment in ATAC peaks with differential accessibility. Closed; regions with significantly reduced access, Opened; regions with significantly increased access in the Rorb KO. Motif instances were cross-validated between MEME and HOMER algorithms. Odds ratio and p-value calculated comparing to motif frequency in control regions. (C–D) Cross-validated motif enrichment in ATAC peaks near the TSSs of (C) up-regulated or down-regulated DEGs and (D) L4- or 5-specific genes. Bars plot odds ratio over control regions. Asterisk indicates significant motif enrichment (p<0.03 by Fisher exact test) in nearby ATAC peaks compared to control regions and separately significant enrichment (p<0.03 by Fisher exact test) of DEGs with a nearby motif compared to an independent group of control genes.
Figure 6—figure supplement 1
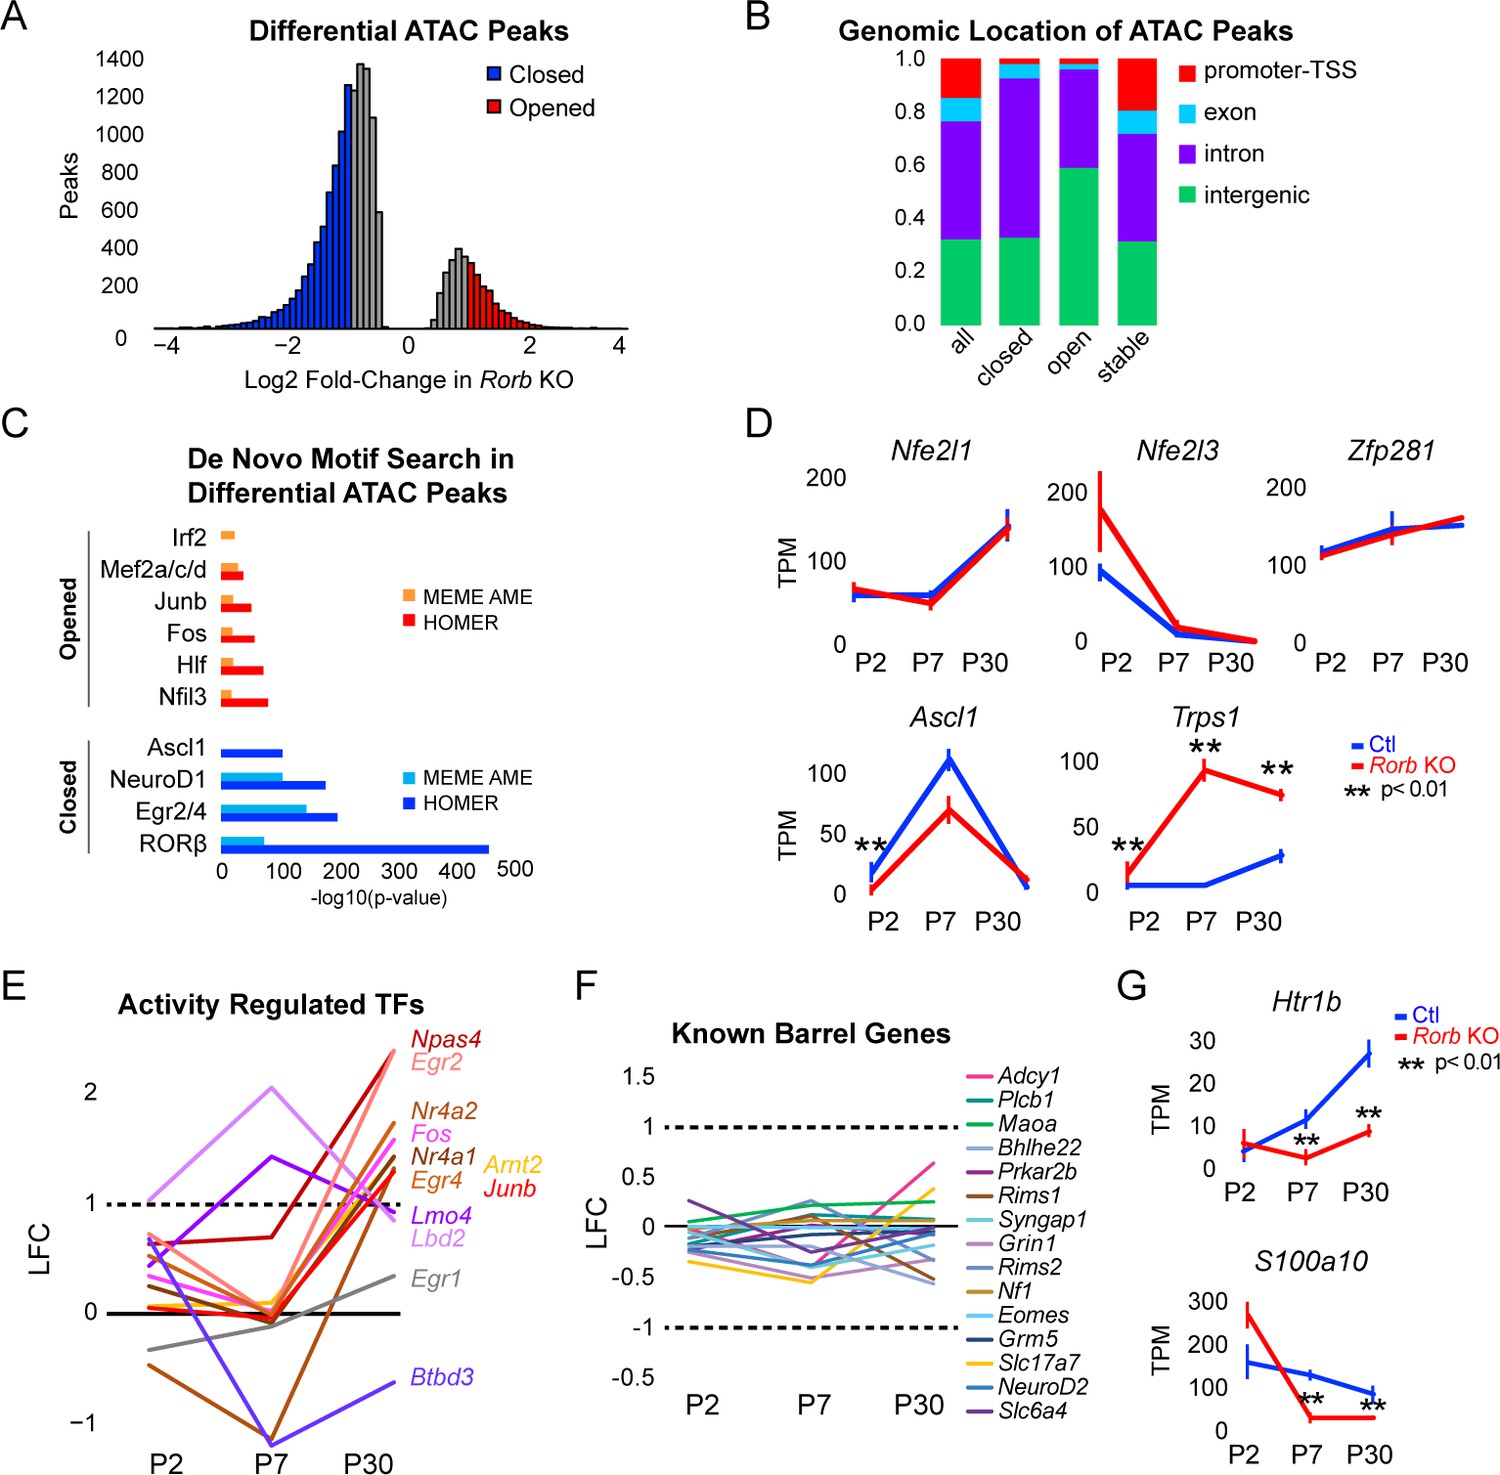
Rorb KO disrupts transcription factor binding sites near DEGs.
(A) Differential ATAC peaks identified by DiffBind with Log2 Fold change (LFC) >1 and FDR < 0.02. (B) Genomic distribution of ATAC-seq peaks identified in Rorb control and Rorb KO. All peaks; all ATAC peaks in Ctl and KO, closed and opened peaks as defined in (B), stable; peaks with the lowest LFC between control and KO. Promoter defined as 2 kb upstream of an annotated TSS. (C) De novo motif searching in differential ATAC peaks using two independent algorithms, MEME AME function and HOMER. Only motifs for TFs expressed in either sample are plotted. (D) RNA-seq expression of TFs with motifs in ATAC peaks. Lines plot the mean ± SE. P by moderated t-test adjusted for multiple comparisons (Benjamini-Hochberg). (E–F) RNA-seq log2 fold-change (LFC) for (E) activity-regulated transcription factors and (F) genes previously described to have a role in barrel organization. (G) RNA-seq of genes involved in serotonin signaling. Plots as in (D).
Figure 7 with 1 supplement
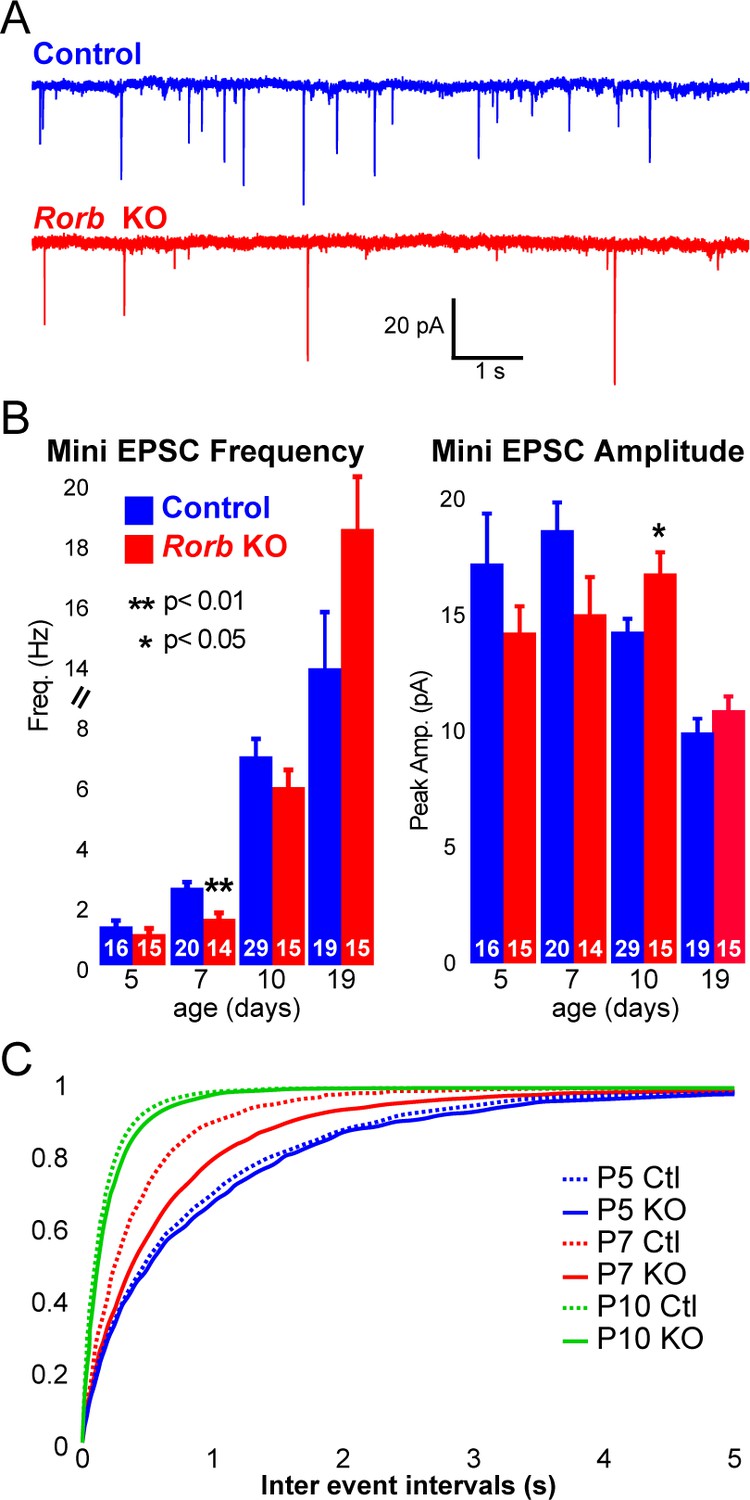
Rorb KO delays excitatory input to barrel cortex.
(A) Example of miniature excitatory postsynaptic currents (mEPSCs) from L4 barrel cortex at P7. (B) Average mEPSC frequency and amplitude from Ctl and Rorb KO L4 barrel cortex at P5, P7, P10 and P19. Bars plot mean + SE, number of cells in parentheses. P values by 2-way ANOVA adjusted for multiple comparisons. (C) Cumulative histogram of inter-event intervals for control and Rorb KO L4 barrel cortex at P5, P7, and P10.
Figure 7—figure supplement 1
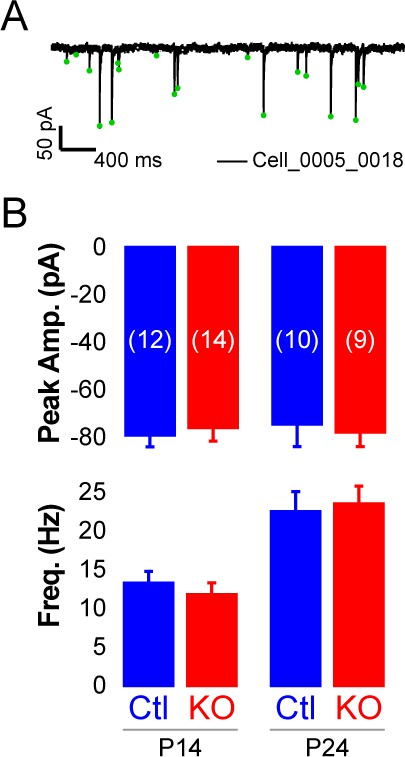
Rorb KO has minor effects on inhibitory input.
(A) Example mIPSCs in one cell. (B) Mini IPSC amplitude (top graph) and frequency (bottom graph) at P14 and P24. Bars plot mean + SE, N cells listed on upper graph.
Figure 8 with 1 supplement
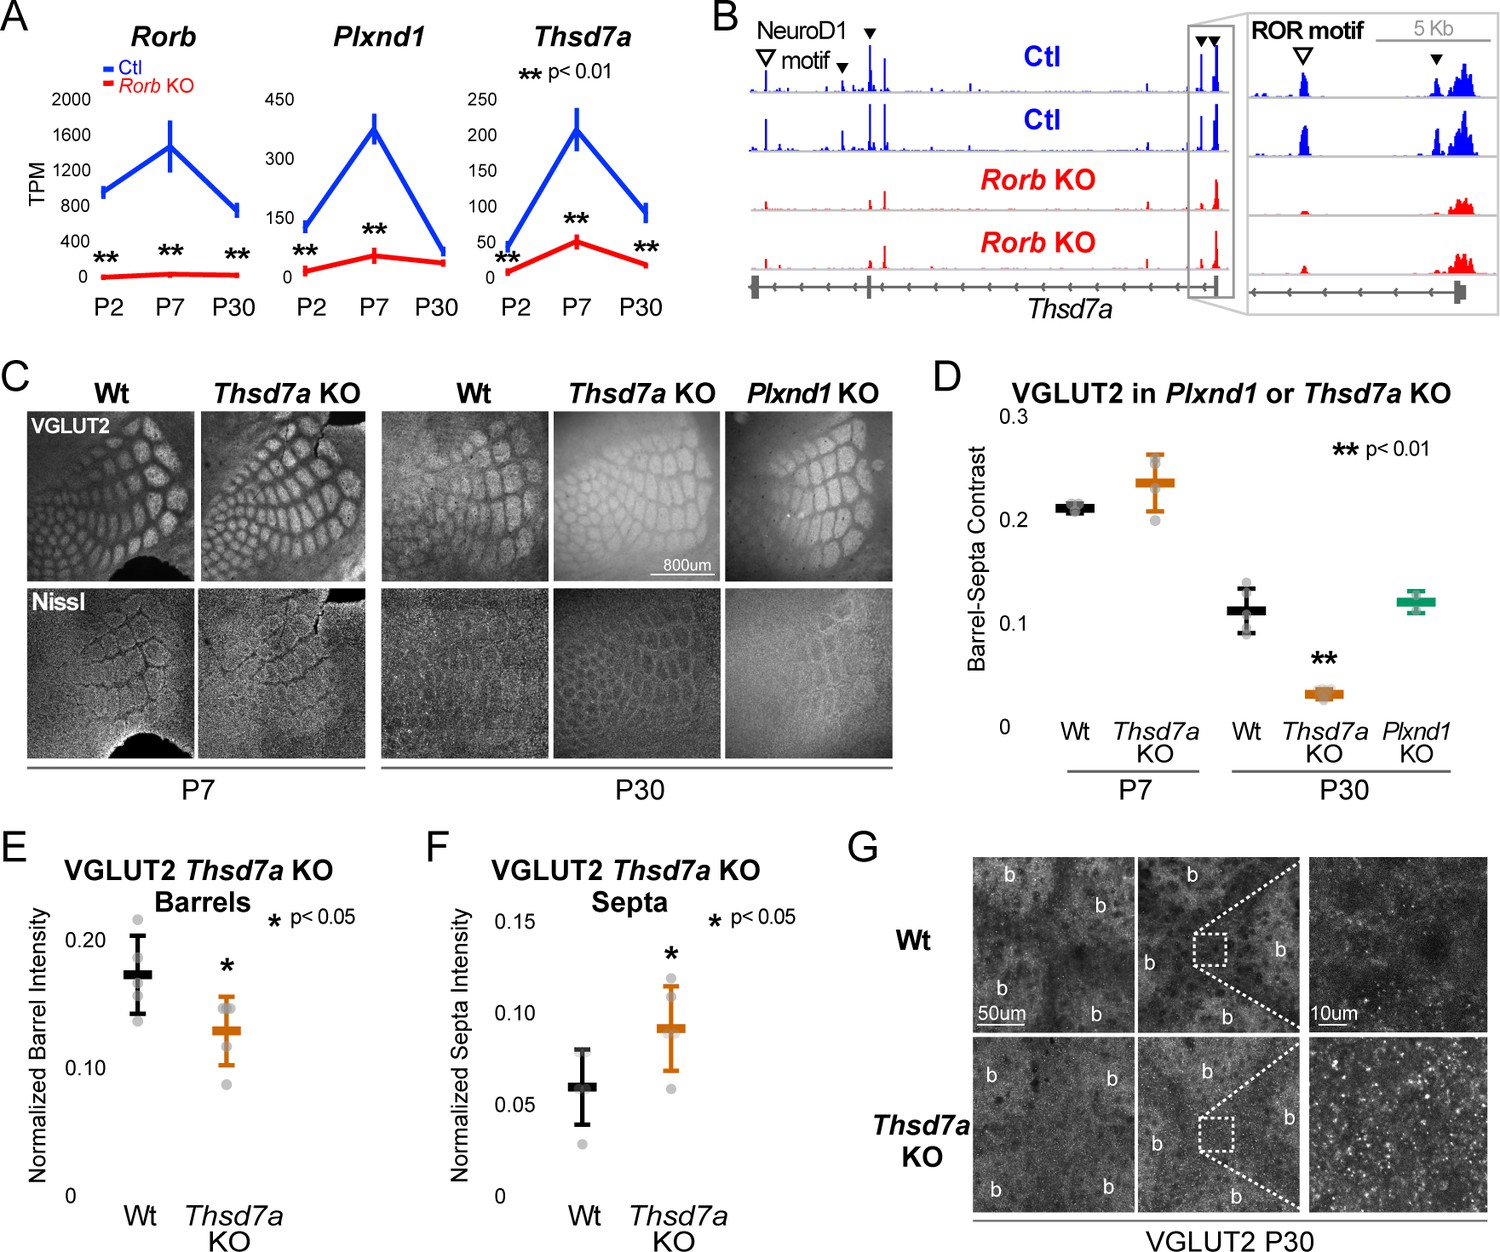
Thsd7a is required for TCA but not barrel wall organization.
(A) Line plots of transcripts per million (TPM) measured by RNA-seq for three genes (Rorb, Thsd7a, and Plxnd1) from Ctl (blue) or Rorb KO (red) S1 layer IV barrel cortex. Lines plot the mean ± SE. (B) ATAC-seq around the Thsd7a gene (as in Figure 6A), y-axis scaled 0–3. (C) VGLUT2 and Nissl staining of barrel cortex at P7 and P30 from wild-type (Wt), Plxnd1 KO, or Thsd7a KO. (D) Quantification of VGLUT2 Barrel-Septa Contrast from genetic lines in C. N = 2–5 animals. Whisker plots as described for Figure 1B. Statistical analysis summarized in Figure 8—figure supplement 1A. (E) Background normalized quantification of VGLUT2 contrast in barrel hollows. Two tissue sections containing the largest portions of whisker barrel field were averaged per animal. N = 5, P30 animals per genotype. Whisker plots as described for Figure 1B. (F) Background normalized quantification of VGLUT2 contrast in septa. Two tissue sections containing the largest portions of whisker barrel field were averaged per animal. N = 5, P30 animals per genotype. Whisker plots as described for Figure 1B. (G) VGLUT2 staining imaged at high magnification (63X) in P30 Wt or Thsd7a KO whisker barrel cortex. Barrels are labeled ‘b’.
Figure 8—figure supplement 1
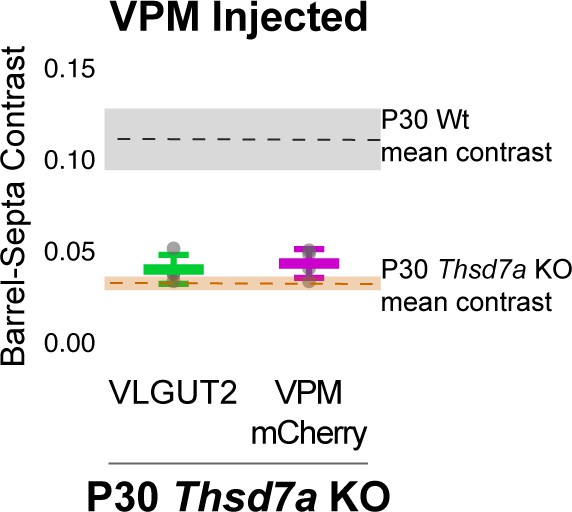
Barrel-septa contrast of VPM-specific afferents.
(A) AAV-hSyn-mCherry was injected, quantified, and plotted as described in Figure 2—figure supplement 1. Dashed lines and colored regions indicate the mean +/- SD contrast of P30 wild type (Wt) animals and P30 Thsd7a KO animals that were not injected with AAV quantified in Figure 8. N = 4 P30 Thsd7a KO animals. ANOVA including Ctrl and Thsd7a KO animals in Figure 8 as well as VGLUT2 and mCherry contrasts from P30 KO animals shown here revealed a significant difference across conditions and posthoc Tukey test revealed no significant differences between injected VGLUT2 and mCherry contrast (p=0.9996), or between either of these and the P30 Thsd7a KO animals shown in Figure 8 (p=0.908, p=0.980). The p7 KO and control animals shown in Figure 8 were also not significantly different (0.250) while all other comparisons were significant (range of p:<1×10⁻⁷: 1.47 × 10⁻⁵).
Figure 9
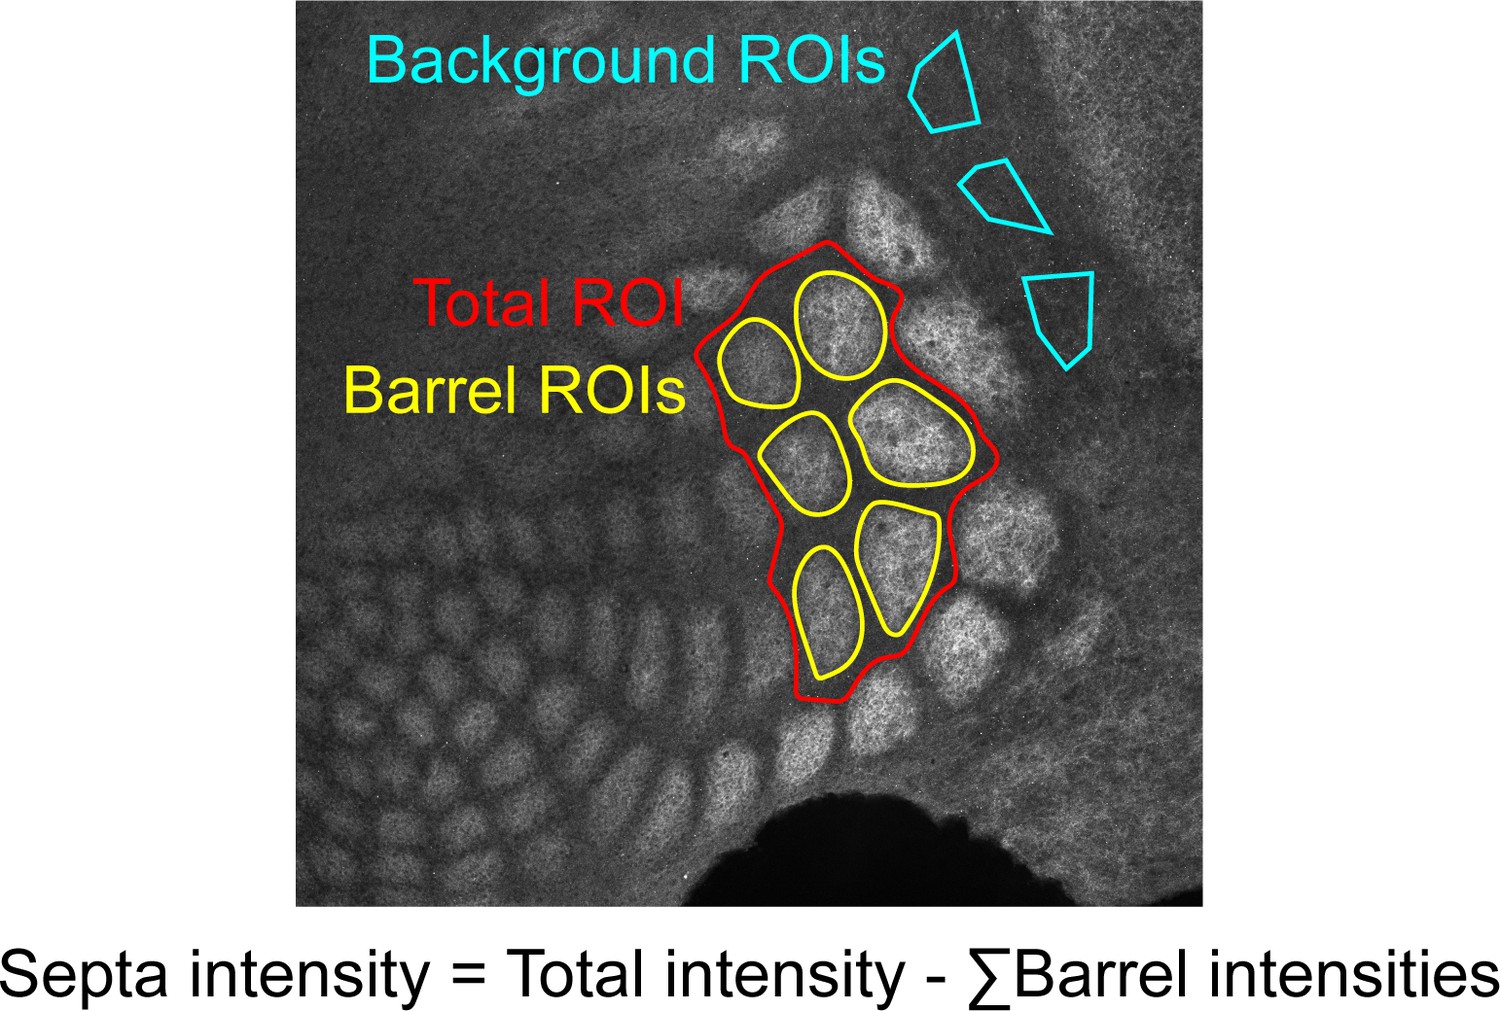
Example of quantification method.
Regions of interest (ROIs) were drawn in Fiji by a researcher blinded to genotype and age.
Figure 10
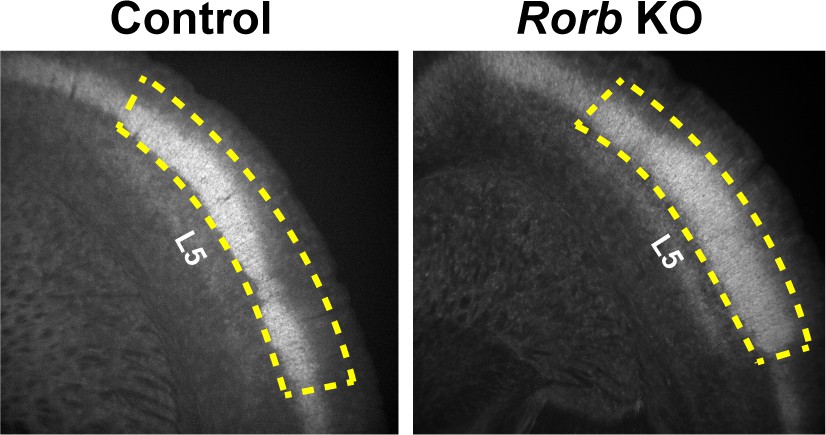
Example of micro dissected region for L4 S1 from coronal slices.
Yellow dashed line indicates the tissue retained for FACS. Layer five is labeled for reference.
Tables
Key resources table
| Reagent type (species) or resource | Designation | Source or reference | Identifiers | Additional information |
|---|---|---|---|---|
| Genetic reagent (M. musculus) | RorbGFP (Rorb1g) | PMID:23652001 | Dr. Douglas Forrest (Laboratory of Endocrinology and Receptor Biology, National Institutes of Health) | |
| Genetic reagent (M. musculus) | Rorbf/f (Rorbflox/flox) | PMID:29224725 | Dr. Douglas Forrest (Laboratory of Endocrinology and Receptor Biology, National Institutes of Health) | |
| Genetic reagent (M. musculus) | Rosa26tdTomato | Jackson Laboratories | RRID:IMSR_JAX:007909 | |
| Genetic reagent (M. musculus) | plexinD1flox | Jackson Laboratories | RRID:IMSR_JAX:018319 | |
| Genetic reagent (M. musculus) | Thsd7a KO | Jackson Laboratories | RRID:MGI:6263683 | |
| Genetic reagent (M. musculus) | Emx1cre | Jackson Laboratories | RRID:IMSR_JAX:005628 | |
| Genetic reagent (M. musculus) | SertCre | Jackson Laboratories | RRID:IMSR_JAX:014554 | |
| Genetic reagent (M. musculus) | CamK2acre | Jackson Laboratories | RRID:IMSR_JAX:005359 | |
| Antibody | Guinea pig anti-VGLUT2 | Millipore AB2251 | RRID:AB_2665454 | 1:500-1:1000 |
| Antibody | rabbit anti-VGLUT2 | Synaptic Systems 135 403 | RRID:AB_887883 | 1:250 |
| Antibody | chicken anti-GFP | Aves labs GFP-1020 | RRID:AB_10000240 | 1:500-1:1000 |
| Antibody | Goat Anti-Rabbit Alexa Fluor 564 | Invitrogen A-11037 | RRID:AB_2534095 | 1:500 |
| Antibody | Goat Anti-Chicken Alexa Fluor 488 | Invitrogen A-11039 | RRID:AB_2534096 | 1:500 |
| Antibody | Goat Anti-Rabbit Alexa Fluor 633 | Invitrogen A-21070 | RRID:AB_2535731 | 1:500 |
| Antibody | Goat Anti-Guinea Pig Alexa Fluor 647 | Invitrogen A-21450 | RRID:AB_2735091 | 1:500 |
| Stain | Nissl | Invitrogen N21479 | 1:250 | |
| Other | AAV-hSyn-mCherry | Addgene 114472-AAV8 | RRID:Addgene_114472 | Undiluted |
| Commercial assay or kit | RNAscope Fluorescent Multiplex kit | Advanced Cell Diagnostics, 320850 |
Additional files
Download links
A two-part list of links to download the article, or parts of the article, in various formats.
Downloads (link to download the article as PDF)
Open citations (links to open the citations from this article in various online reference manager services)
Cite this article (links to download the citations from this article in formats compatible with various reference manager tools)
Cortical RORβ is required for layer 4 transcriptional identity and barrel integrity
eLife 9:e52370.
https://doi.org/10.7554/eLife.52370


