Ankyrin-G mediates targeting of both Na+ and KATP channels to the rat cardiac intercalated disc
- NYU School of Medicine, United States
- Imperial College London, United Kingdom
Figures
Figure 1 with 2 supplements
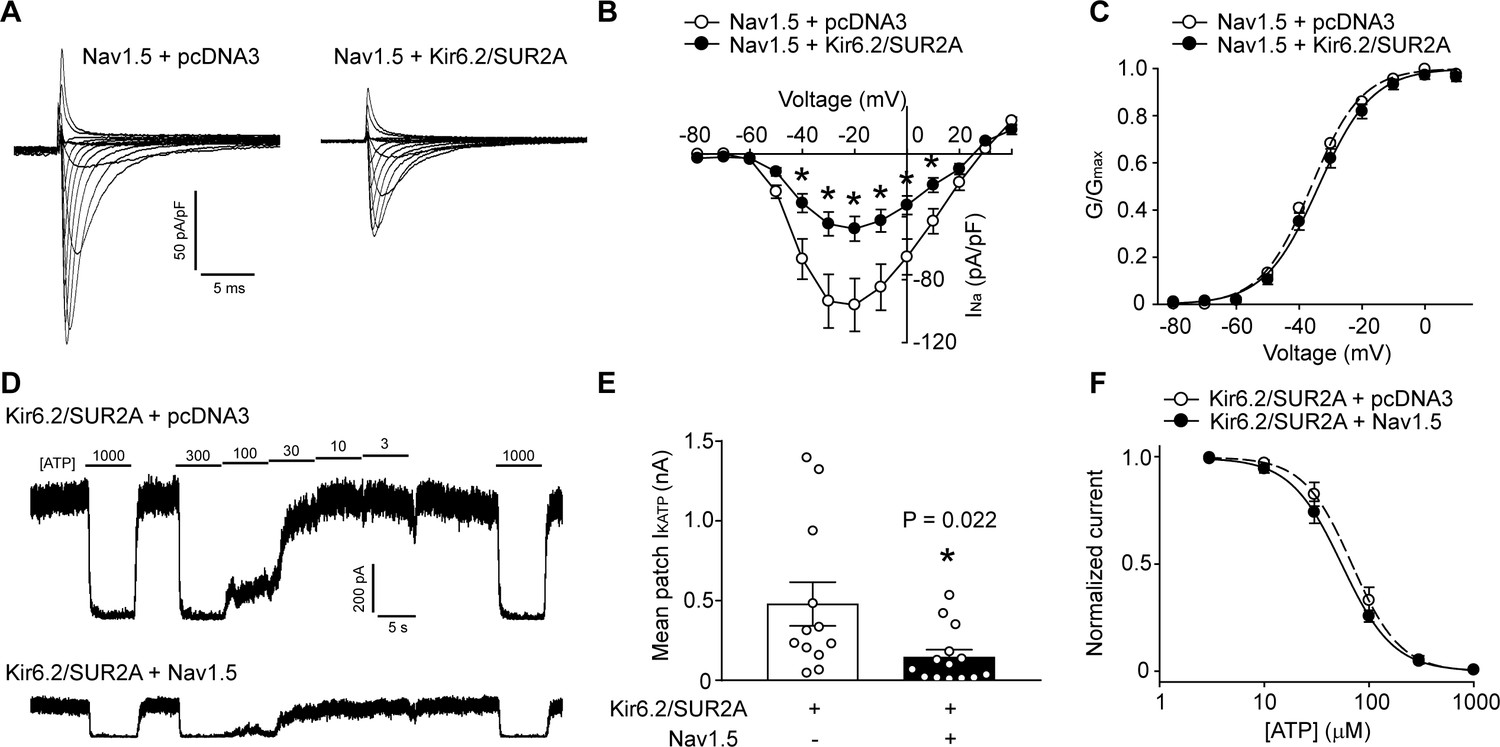
KATP channels and Na+ channels reciprocally reduce the functional expression of one another.
(A) Representative whole-cell Na+ current recordings from Nav1.5 transfected HEK293 cells co-transfected with empty vector (pcDNA3) or KATP channel (Kir6.2+SUR2A). (B) Averaged current-voltage relationships of Nav1.5 co-expressed with empty vector (open symbols; n = 12) or Kir6.2/SUR2A (filled symbols; n = 10). *p<0.001 determined by two-way ANOVA followed by Tukey’s test. (C) The voltage dependence of steady-state activation was calculated from the traces in panel A. Values of GNa were normalized to the maximum conductance and plotted as a function of voltage. The symbols have the same meaning as in panel B. (D) Representative inside-out current recordings obtained from KATP channel (Kir6.2+SUR2A) transfected HEK293 cells co-transfected with empty vector (pcDNA3) or Nav1.5. ATP concentrations (µM) were switched as indicated. The mean patch current was recorded at a membrane potential of −80 mV (a voltage at which Nav1.5 is inactive) and the KATP channel current was defined by the current component blocked by 1 mM ATP applied to the ‘cytosolic’ face of the patch. Recordings were made immediately after patch excision to minimize effects of ‘run-down’. (E) Data points from Kir6.2/SUR2A transfected cells co-transfected with empty vector (pcDNA3) (open symbols; n = 12) or Nav1.5 (filled symbols; n = 14). *p=0.022 using the Student’s t test. (F) The ATP-sensitivity of KATP channels was determined by plotting the KATP current (normalized to the maximum current) as a function of the ‘cytosolic’ ATP concentration. Data from individual patches were subjected to curve fitting to a modified Boltzmann equation, yielding IC50 values for ATP inhibition of 63.0 ± 9.5 µM and 66.2 ± 10.6 µM respectively for Kir6.2/SUR2A without and with Nav1.5. Data are from a minimum of 3 separate transfections.
Figure 1—figure supplement 1
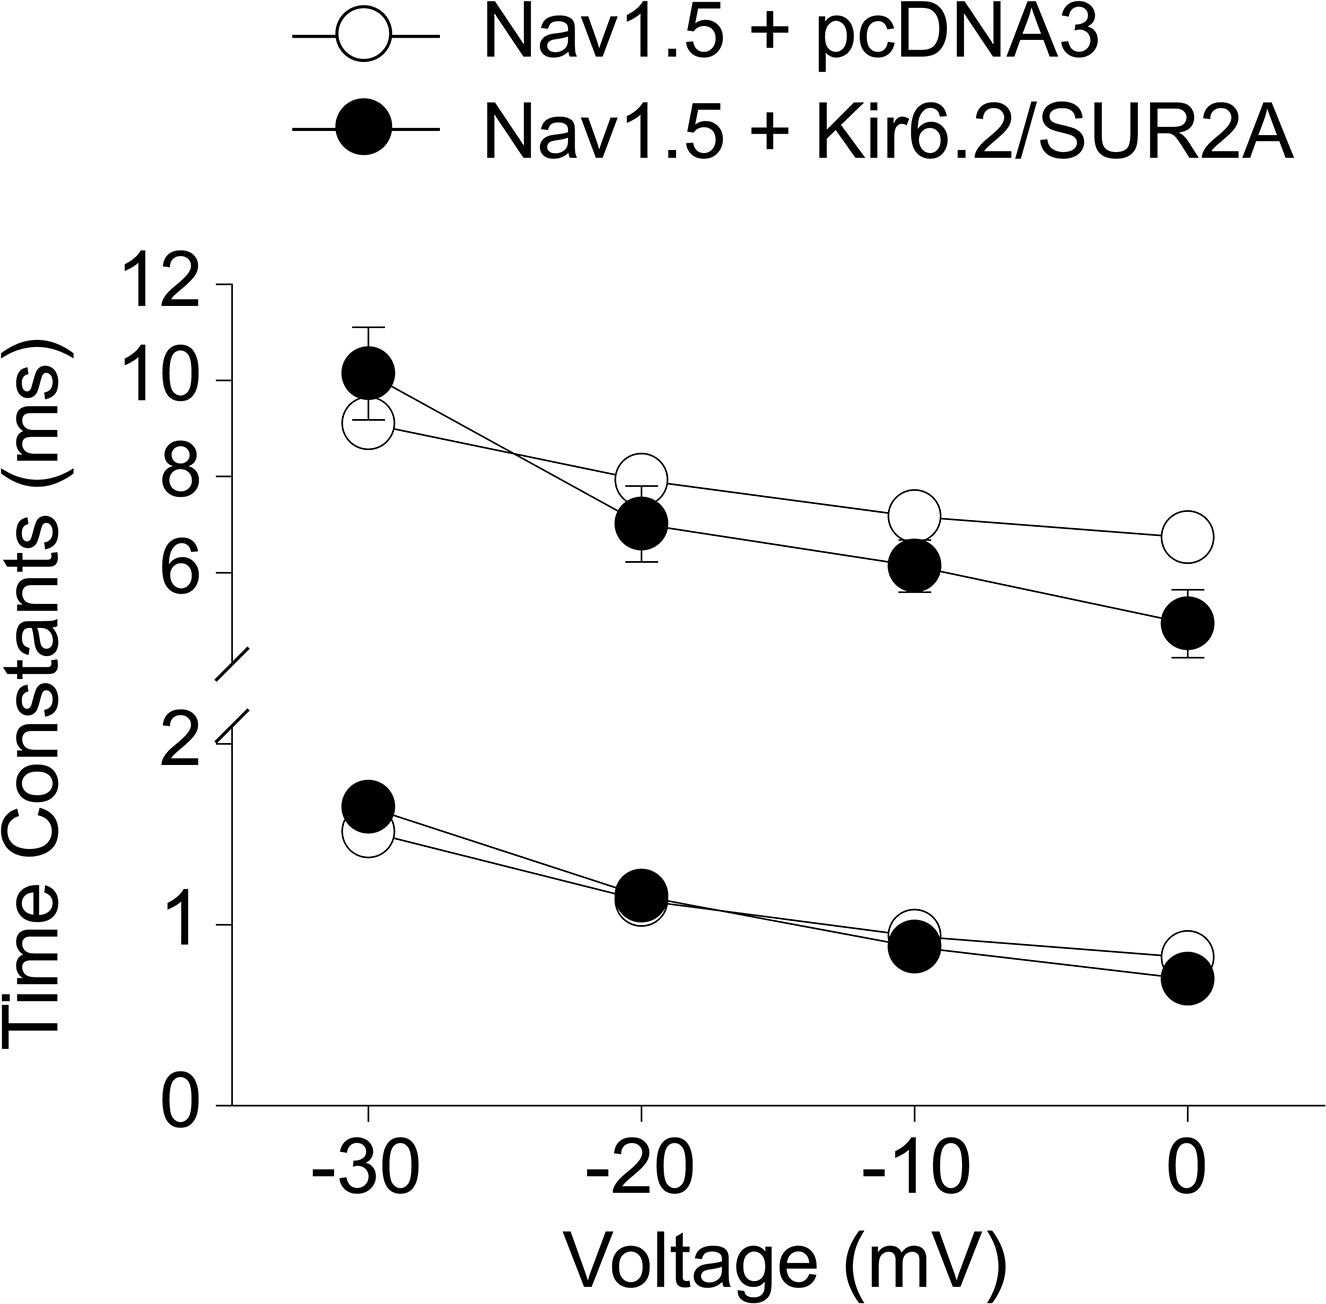
Co-expression with KATP channels does not affect Nav1.5 channel inactivation.
Inactivation time constants of Nav1.5 channels at different voltages were obtained by fitting individual data traces with a sum of two exponential functions. Shown are the time constants of the fast and slow components of activation when Nav1.5 was expressed with the pcDNA3 empty vector (open symbols; n = 10) or with Kir6.2 plus SUR2A (filled symbols; n = 7). Data are pooled from three separate transfections.
Figure 1—figure supplement 2
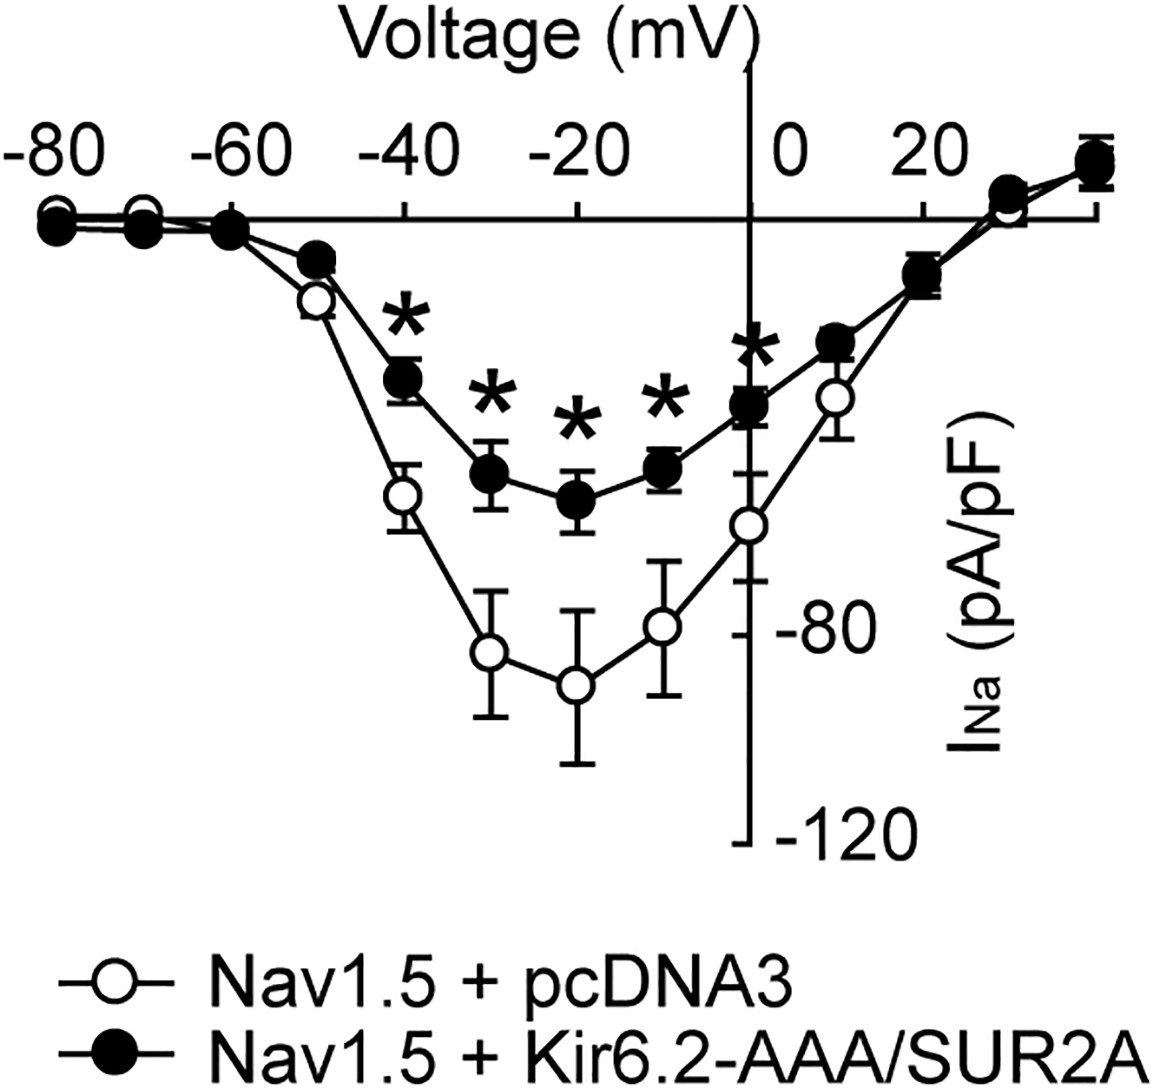
Non-conducting KATP channels negatively regulate Nav1.5.
Shown are current-voltage relationship of whole-cell currents measured in transfected HEK293 cells transfected with Nav1.5 and pcDNA3 to keep the cDNA amount equal (open symbols; n = 6), or Kir6.2-AAA plus SUR2A (filled symbols; n = 6). Measurements were pooled from cells of 3 transfections. *p<0.05 vs. pcDNA3 determined by two-way ANOVAs followed by Dunnett’s test.
Figure 2
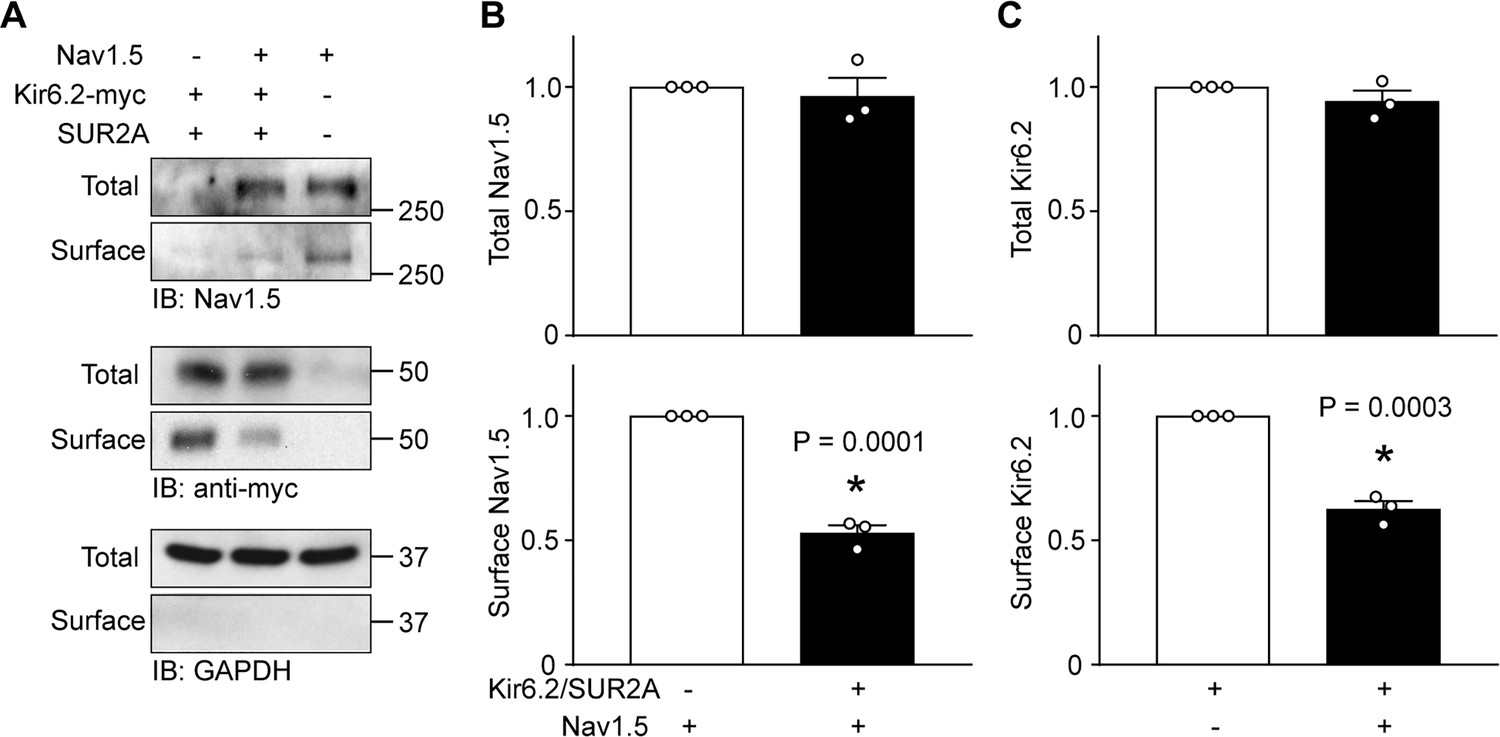
KATP channels and Na+ channels reciprocally reduce the surface expression of each other.
HEK-293 cells were transfected with combinations of Kir6.2 (C-terminal tagged with 6 × myc epitopes), SUR2A, Nav1.5 as indicated. pcDNA3 was included to keep the cDNA amounts equivalent in transfections. (A) Cell lysates (Total) or surface biotinylated membrane fractions (Surface) were subjected to SDS-PAGE and immunoblotted with antibodies against Nav1.5, myc, or GAPDH. A representative immunoblot is shown. Panels B and C respectively show data averaged from three similar blots. Total Nav1.5 or Kir6.2 protein in cell lysates were normalized to the amount of GAPDH, whereas surface expression was normalized to the total Nav1.5 or Kir6.2 protein. *p=0.0001 and p=0.0003 for panel B and C respectively with Student’s t test.
Figure 3 with 1 supplement

An intact Kir6.2 ankyrin binding motif is necessary for functional interaction.
(A) Sequence alignment of ankyrin binding motifs (or corresponding residues) of various Nav channels and members of the Kir6 subfamily of inward rectifier K+ channels. The Kir6.2-KKK shows the mutations made to disrupt the binding motif. (B) Whole-cell Na+ currents were measured in HEK293 cells and averaged current-voltage relationships are plotted for cells transfected with Nav1.5 plus either empty vector (n = 8), Kir6.1/SUR2A (n = 6), Kir6.2/SUR2A (n = 7) or Kir6.2-KKK/SUR2A (n = 6). Data are from a minimum of 3 transfections. *p<0.001 determined by two-way ANOVA followed by Tukey’s test. (C) HEK-293 cells were transfected with Nav1.5 plus combinations of empty vector, Kir6.2/SUR2A, or Kir6.2-KKK/SUR2A. Cell lysates (Total) or surface biotinylated membrane fractions (Surface) were subjected to SDS-PAGE and immunoblotted with antibodies against Nav1.5 or GAPDH. A representative immunoblot is shown. (D) Averaged data of Nav1.5 surface expression normalized to the total Nav1.5 protein from three similar blots. *p=0.020 with 1W ANOVA followed by Dunnett’s test.
Figure 3—figure supplement 1

Titration of the cDNA amounts used in transfection reactions to attain similar cell protein amounts.
(A) Representative immunoblot of HEK293 cells transfected with various amounts (µg) and types of cDNAs as indicated. Cell lysates were subjected to SDS-PAGE and immunoblotted against Nav1.5, Kir6.2 or GAPDH. (B) Summarized data from three similar immunoblots, showing the total Kir6.2 or Nav1.5 expression, normalized to Kir6.2-WT group. 0.3 µg of Kir6.2-KKK yielded similar expression levels as 0.1 µg Kir6.2-WT, without affecting Nav1.5 abundance, which was therefore used for subsequent experiments. *p=0.0051 and p<0.0001 respectively by 1W ANOVAs followed by Dunnett’s test. The apparent decrease of Nav1.5 expression by Kir6.2-KKK is a result of the experimental conditions used. By raising the Kir6.2-KKK cDNA amount relative to that of Nav1.5, we believe that less Nav1.5 cDNA was taken up into the cell during transfection because there is more of the other cDNAs. Indeed, less Nav1.5 expression also occurs when increasing the overall amount of empty vector (pcDNA3) in the transfection reaction.
Figure 4 with 2 supplements
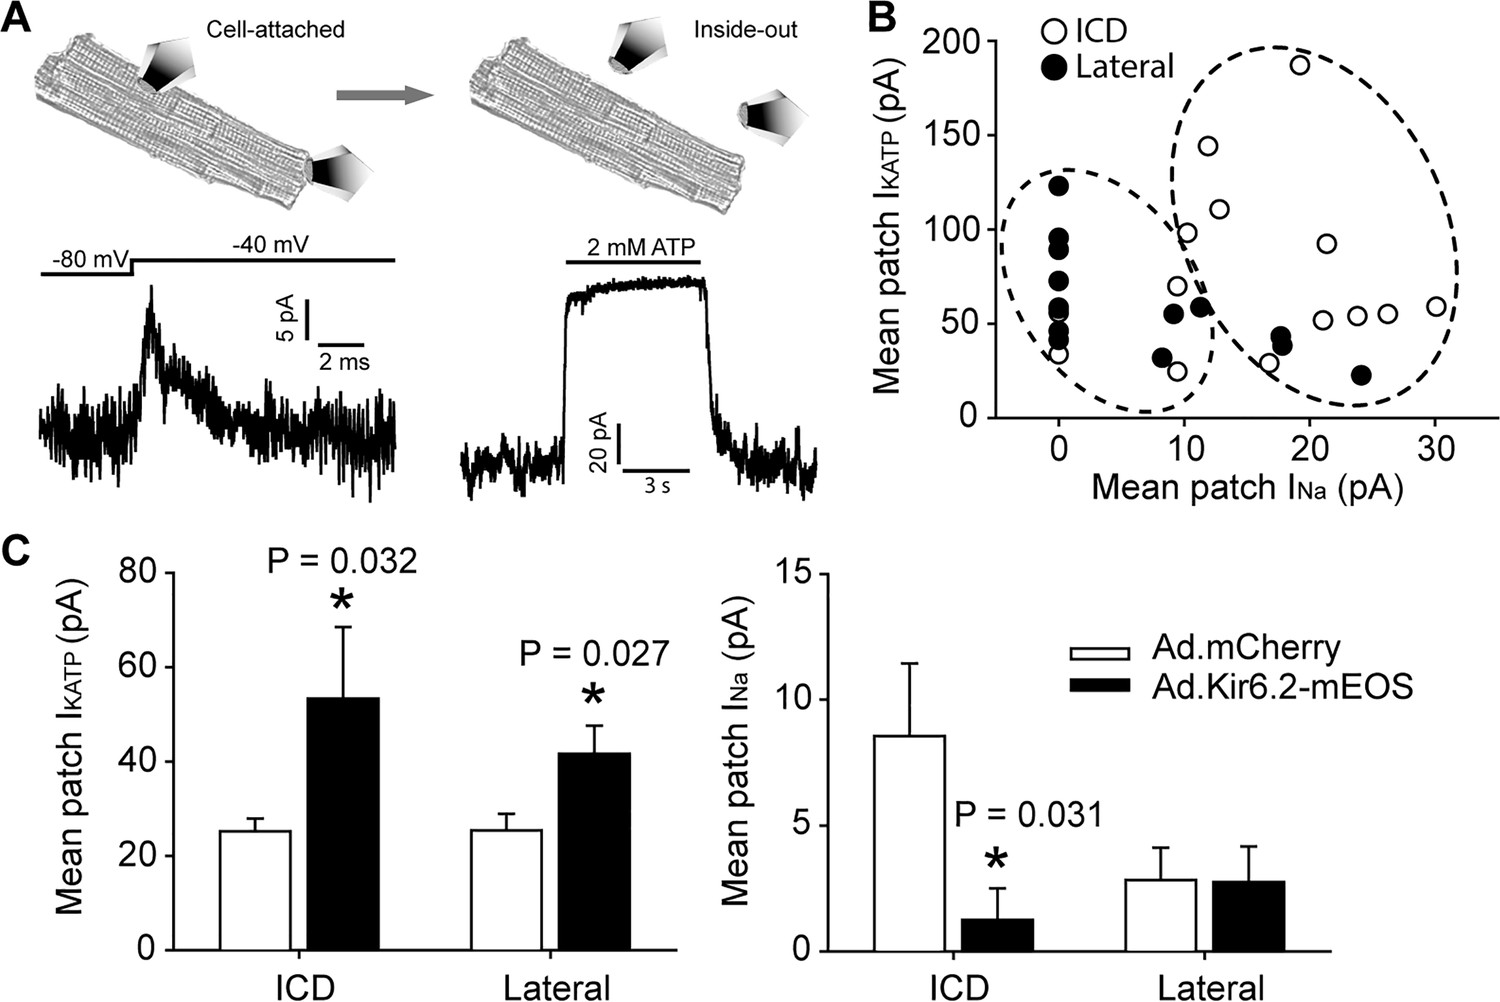
Functional interaction between KATP channels and Na+ channels in cardiac myocytes occurs predominantly at the ICD.
(A) Illustration of the duplex patch clamp method, which allows sequential recordings of INa and IKATP in the same membrane patch. In cell-attached mode (left), INa is recorded by changing the membrane potential. Recordings can be made in the absence of IKATP, which is generally not active in resting cardiomyocytes. After patch excision (right), recordings of KATP channels are made at +80 mV, a voltage at which INa is inactivated. Representative patch recordings are illustrated. (B) Paired duplex patch clamp recordings of IKATP and INa are plotted as individual points for patches from the lateral membrane (filled symbols; n = 15) or the ICD region of cardiomyocytes (open symbols; n = 14). The dotted circles illustrate the result of an independent hierarchal clustering analysis of these data (Figure 4—figure supplement 2). Data were obtained using cells from three separate isolations. (C) Duplex patch clamping was performed with rat cardiomyocytes treated with Ad.mCherry or Ad.Kir6.2-mEos. The average IKATP or INa recorded from lateral membranes (n = 14 for Ad.mCherry and 11 for Ad.Kir6.2-mEos) or the ICD (n = 13 for Ad.mCherry and 10 for Ad.Kir6.2-mEos) are plotted as bar graphs. Data were obtained using cells from four separate isolations. *p=0.032 and p=0.027 respectively for left panel, p=0.031 for right panel vs. Ad-mCherry using the Student’s t test.
Figure 4—figure supplement 1
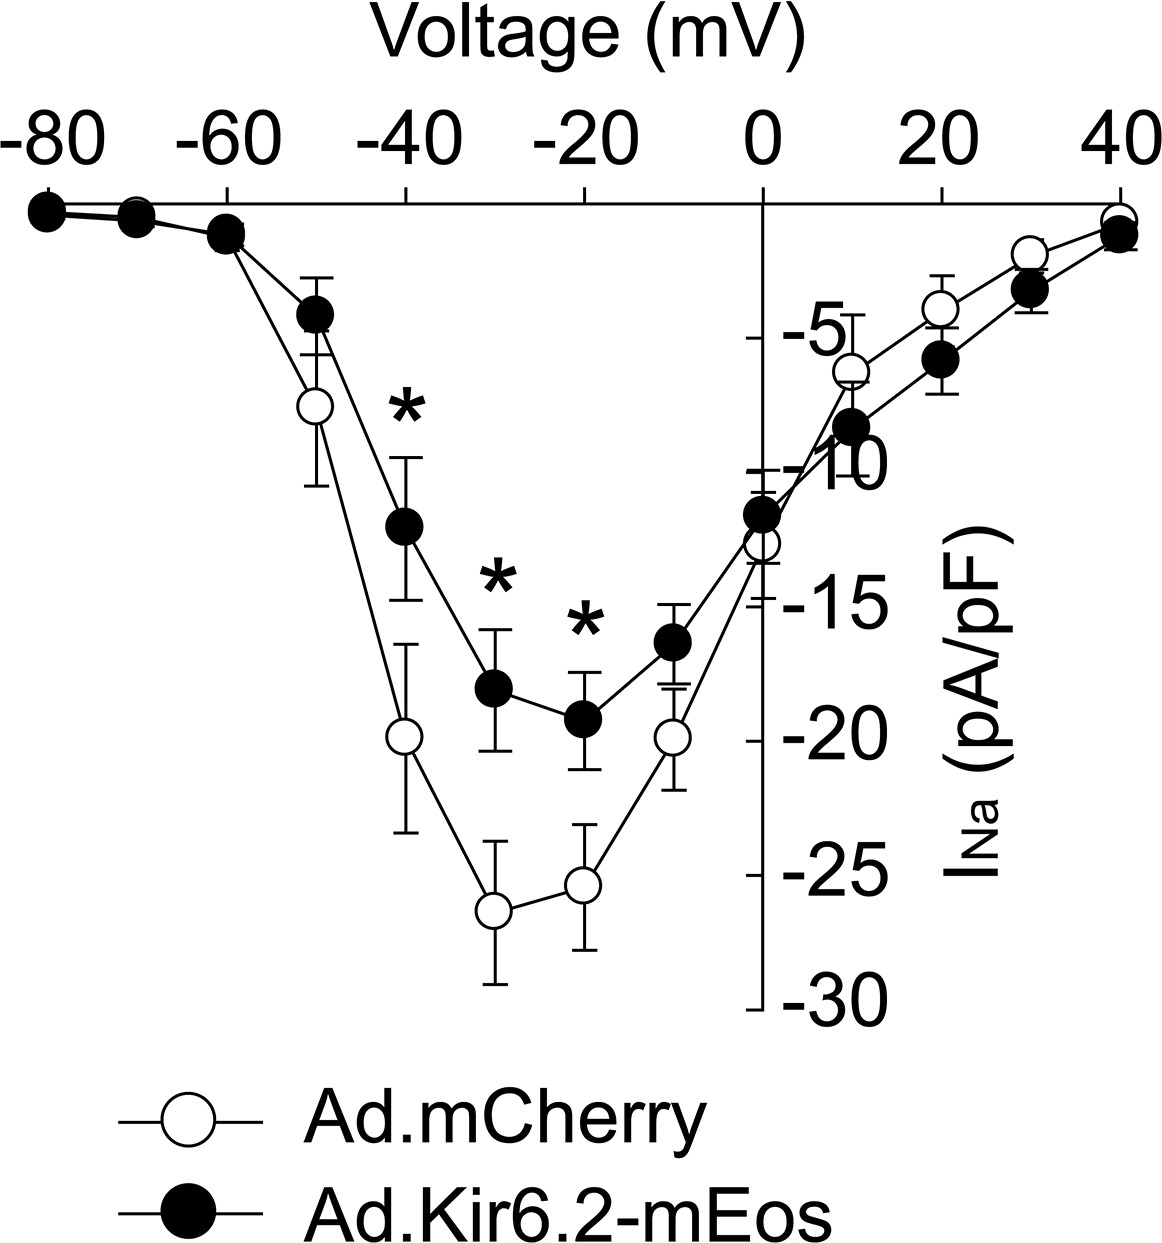
Adenoviral delivery of Kir6.2 in adult cardiomyocytes reduces whole-cell Nav1.5 current.
Isolated rat ventricular myocytes were incubated for 72 hr with adenoviruses hosting Kir6.2-mEOS (Ad.Kir6.2-mEos; filled symbols) to be able to identify infected myocytes; n = 8) or Ad.mCherry as a control (open symbols; n = 6). Whole-cell recordings were made of the INa and averaged current-voltage relationship are shown. Recordings were made using cells from three separate cell isolations. *p<0.05 using a 2W ANOVAs followed by Dunnett’s test.
Figure 4—figure supplement 2

Hierarchical clustering of duplex patch clamp data.
Shown are paired recordings of IKATP and INa membrane patches (open symbols). Data from lateral and ICD membranes were pooled, and thus blinded as to the origin of the patch. Hierarchical clustering, an unsupervised machine learning algorithm used to cluster unlabeled data points, was performed using Scikit-Learn and Python three to identify two distinct clusters (shown by the two dotted circles).
Figure 5
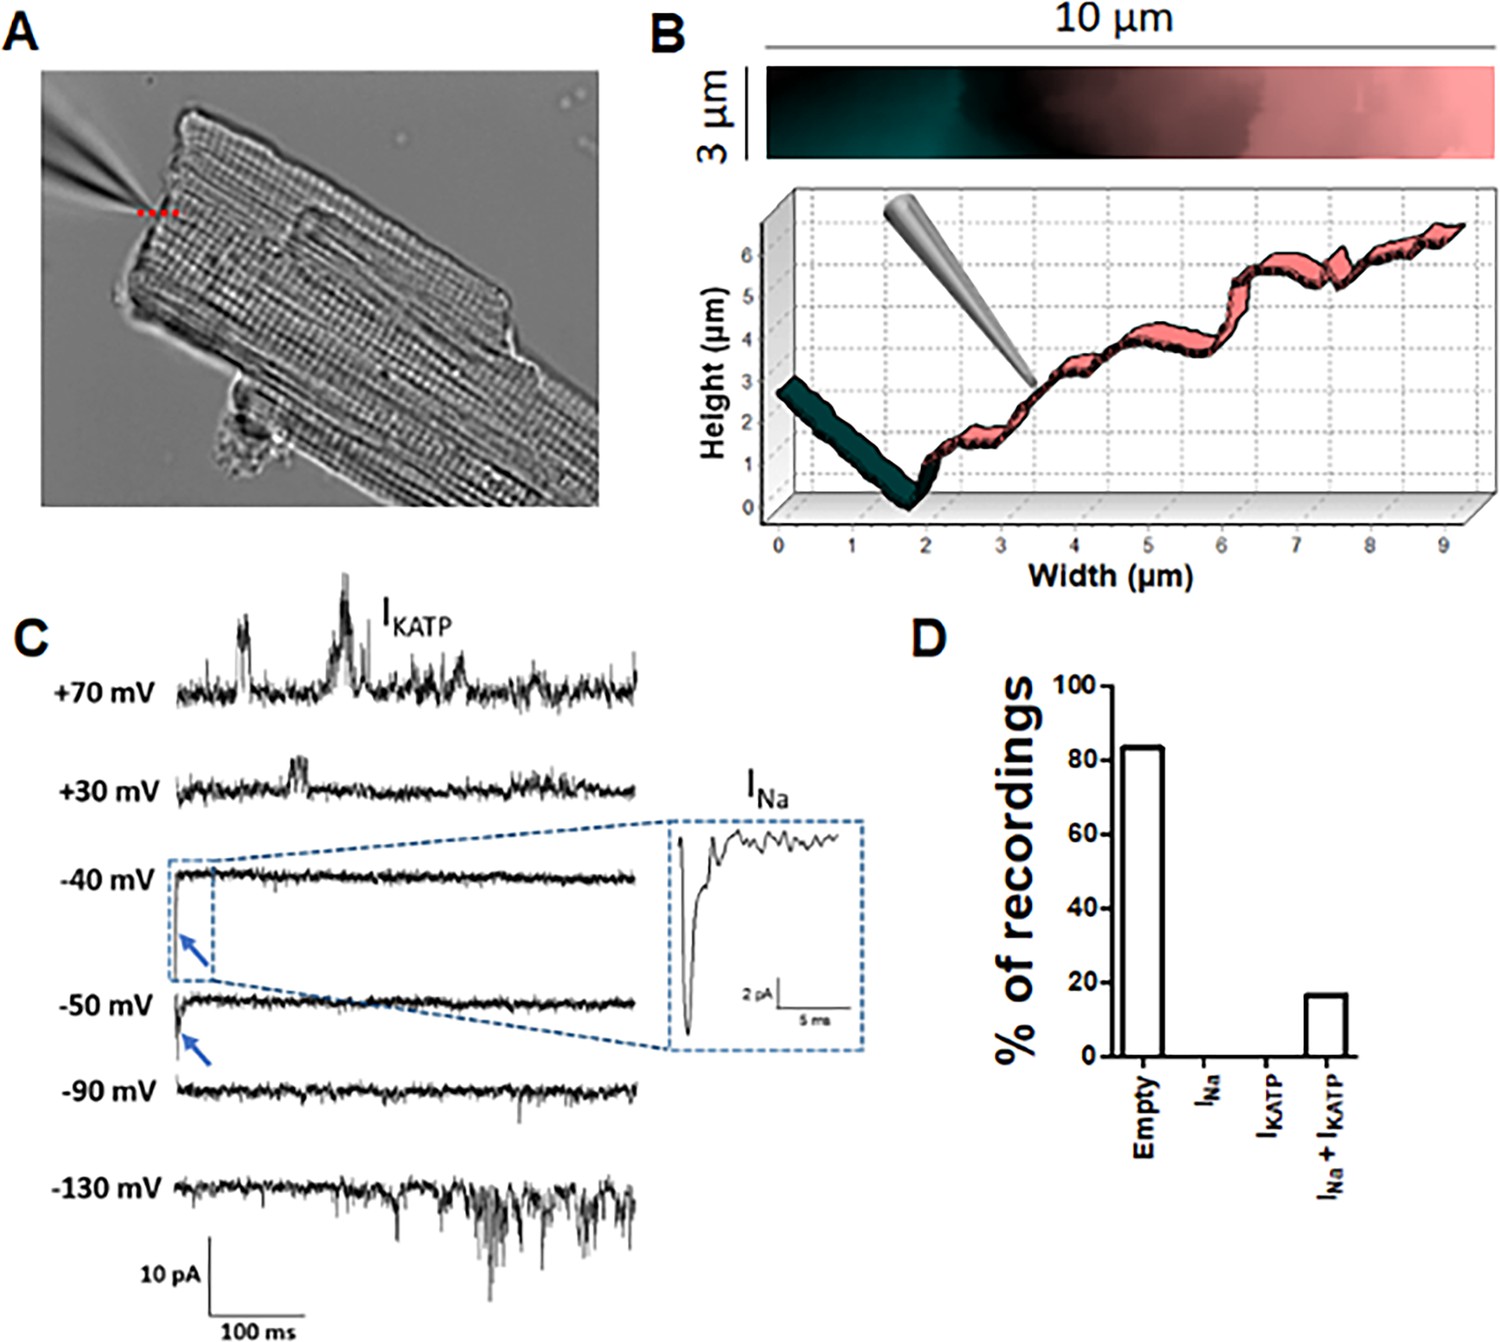
Angle SICM recordings demonstrate functional co-localization of Na+ and KATP channels at the ICD of adult rat ventricular cardiomyocytes.
(A) Representative phase contrast image of a single cardiomyocyte. Recording pipette can be observed in the upper left. (B) Scan image acquired from location marked with red dashed line in A showing ICD region (top panel). Cross section showing the position of the pipette with respect the ICD (bottom). (C) Representative traces of the recorded current. Na+ channel currents can be observed at −40 mV and −50 mV steps (blue arrow and dashed box), KATP channel currents can be observed at +70 mV and −130 mV, when the Na+ channels are inactive. (D) Summary of cell-attached patch recordings. A total of 12 seals were recorded in which 10 of them did not show any channel activity at any voltage and 2 of them shown both Na+ and KATP channels activity.
Figure 6 with 3 supplements
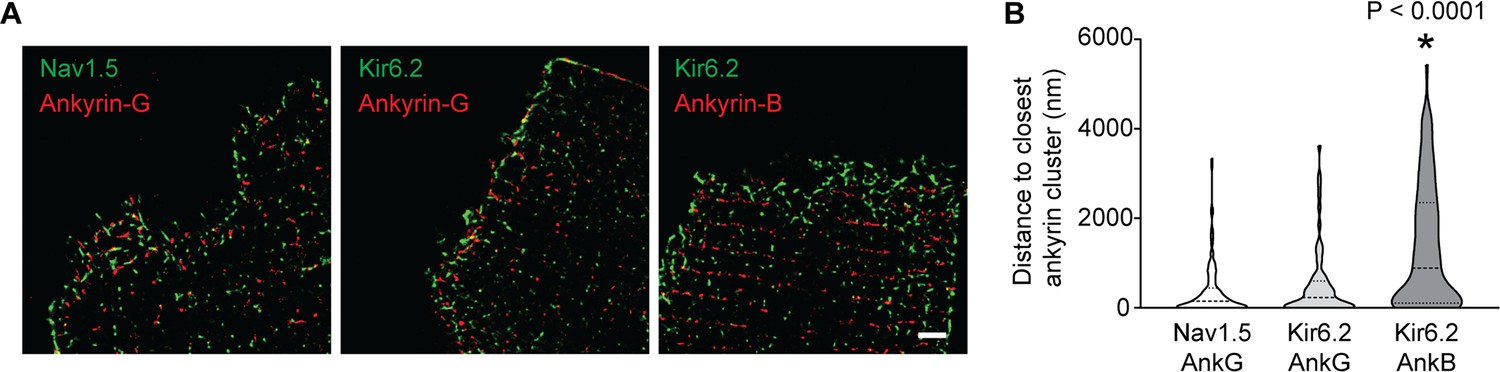
Quantification of inter-cluster distances between KATP channels, Na+ channels and ankyrins.
(A) Enlarged STORM images of the rat cardiomyocyte intercalated disc region, co-stained with antibodies against ankyrin B, ankyrin G, Kir6.2 and Nav1.5, as indicated. Scale bar, 2 μm. (B) Statistical analysis of the distances between Nav1.5 or Kir6.2 to the closest ankyrin clusters. N ≥ 67 clusters from three rats in each group. *p<0.0001 vs. Nav1.5/AnkG group determined by Kruskal-Wallis 1W ANOVA, followed by Dunn’s post-hoc analysis.
Figure 6—figure supplement 1
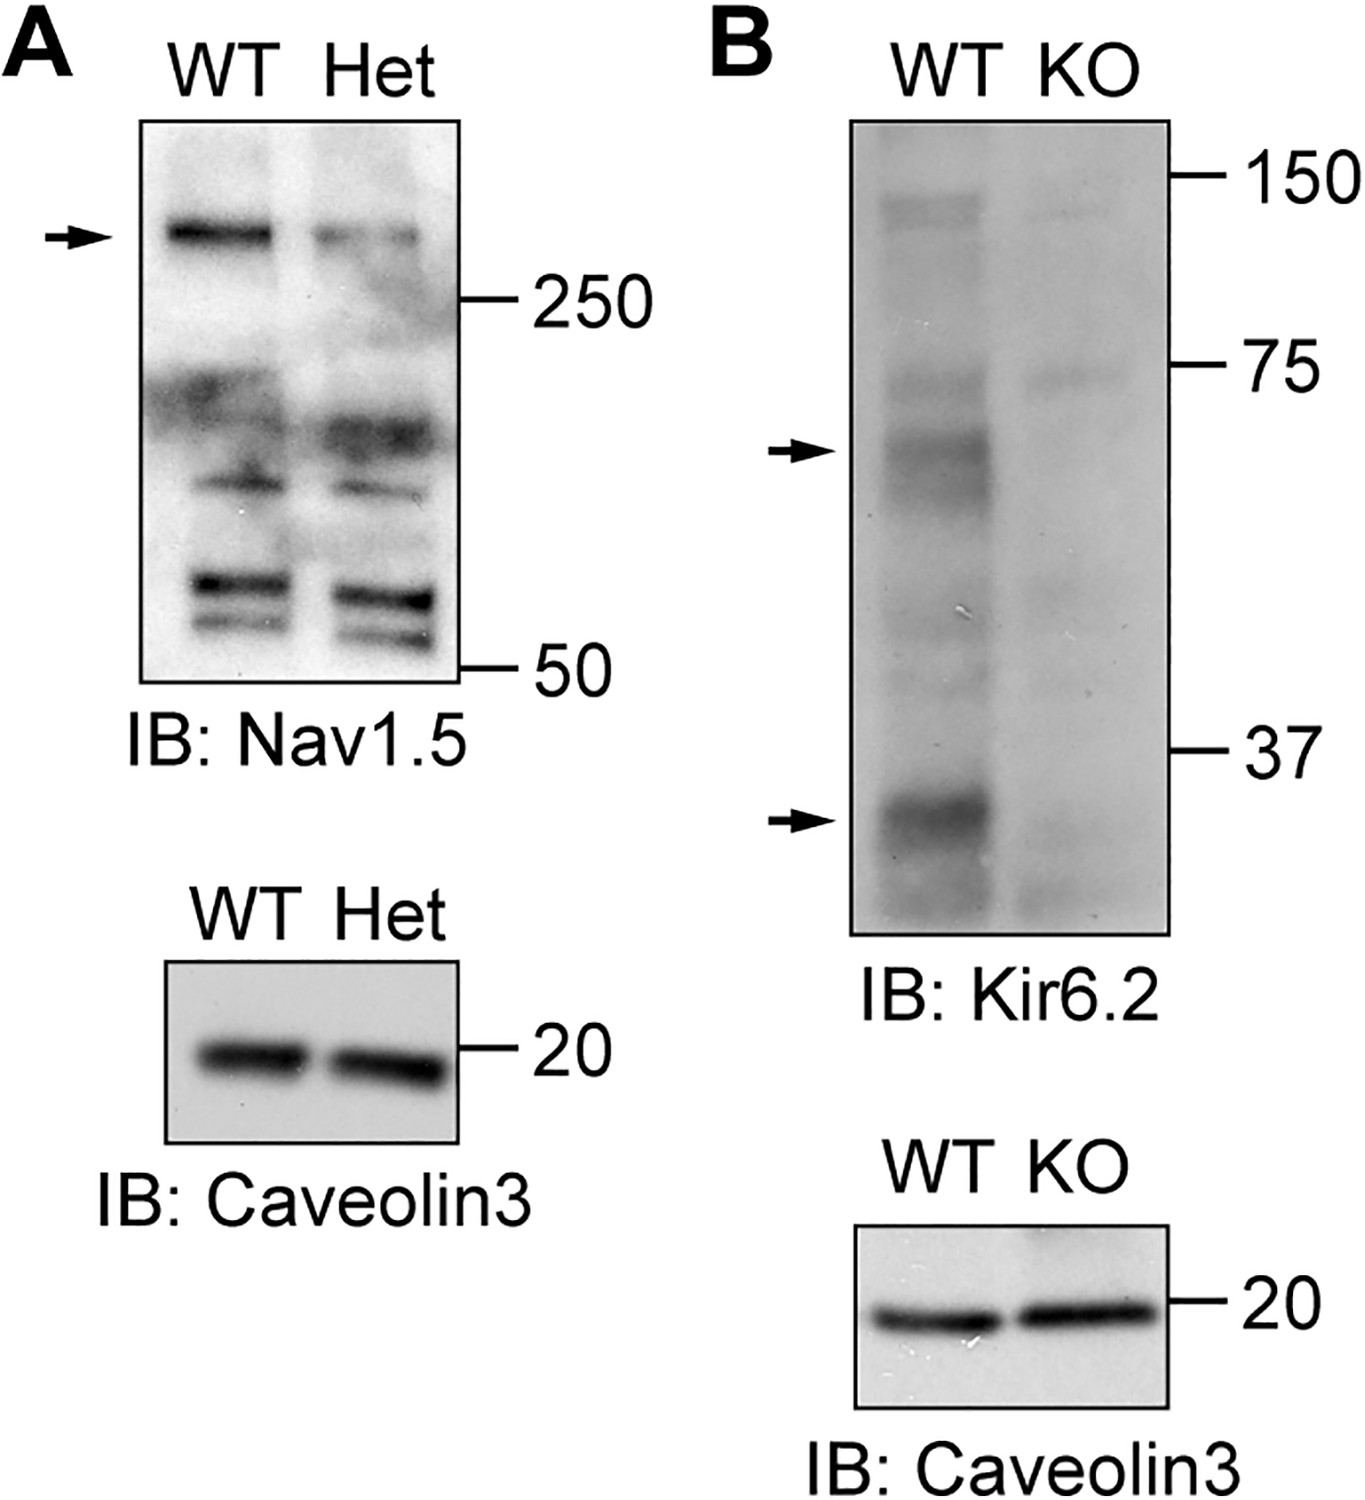
Validation of Nav1.5 and Kir6.2 antibodies for immunostaining in cardiomyocytes.
(A) Membrane fractions from wild-type Nav1.5 and heterozygous knockout (Nav1.5+/-) mouse hearts analyzed by SDS-PAGE and immunoblotted with Sigma S0819 anti-Nav1.5 antibody. The arrow indicates the band for Nav1.5. Caveolin3 was used as loading control. (B) Membrane fractions from Kir6.2 wild-type and homozygous knockout mouse hearts were detected with Lee62 anti-Kir6.2 antibody. The arrows indicate the bands specific to Kir6.2. Caveolin3 was used as a loading control.
Figure 6—figure supplement 2
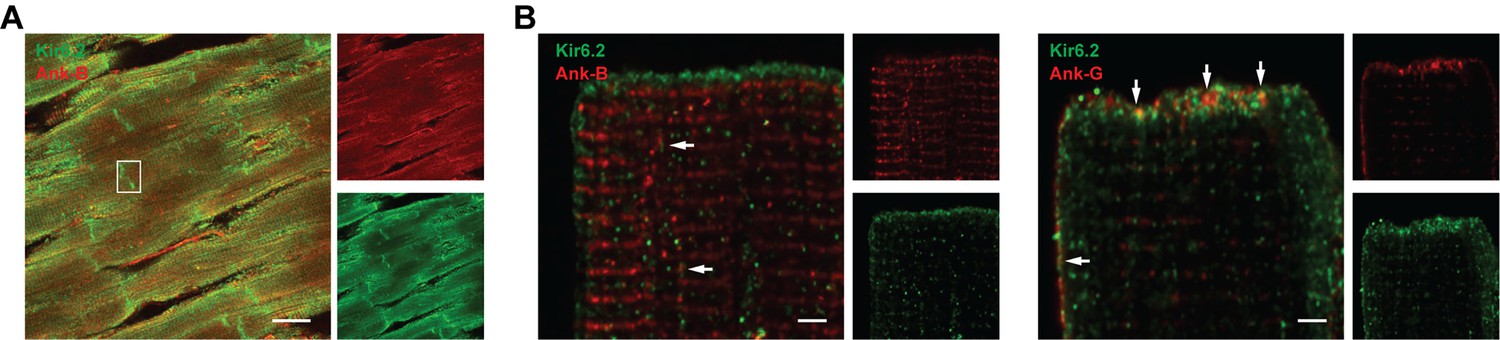
Co-localization of KATP channels, Na+ channels and Ankyrins at the ICD of cardiac myocytes.
(A) Immunofluorescence microscopy images of a rat heart cryosection, co-stained with Kir6.2 with AnkB. Mander’s coefficients are M1 = 0.42 and M2 = 0.02 in the boxed area. (B) Immunofluorescence microscopy images of a rat ventricular myocytes co-stained with antibodies against Kir6.2 (green) and AnkB or AnkG (red). Signals are overlaid in the larger panels. Note the predominant expression of AnkB in lateral membranes, and AnkG at the ICD region, where it colocalizes with Kir6.2 (arrows). At the ICD region, the Manders’ M1 values are 0.84 and 0.06 respectively for Kir6.2 co-localization with AnkG and AnkB. The scale bars are 20 μm in panel A and 2 μm in panel B.
Figure 6—figure supplement 3
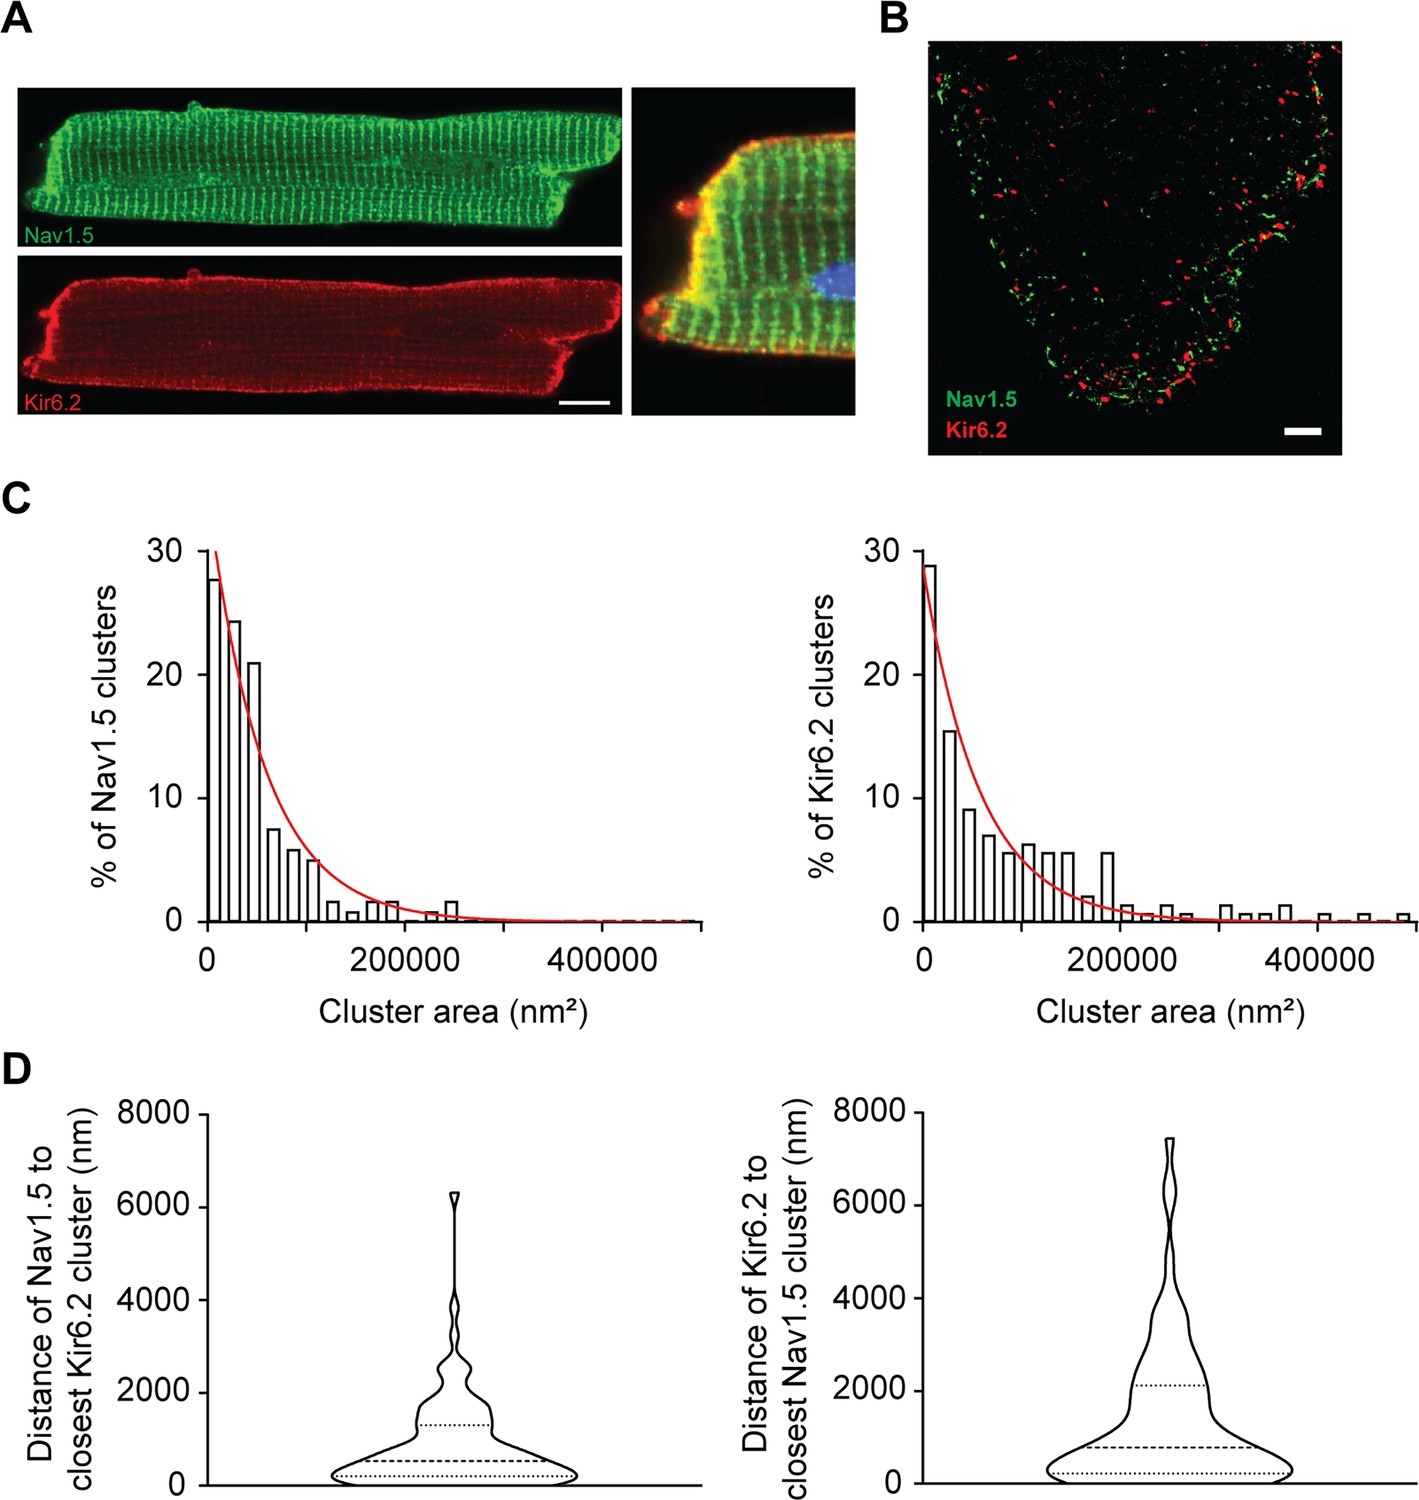
Co-localization of Kir6.2 and Nav1.5 at intercalated disc.
(A) Conventional immunofluorescence microscopy images of a rat ventricular myocyte co-stained with antibodies against Nav1.5 (green) and Kir6.2 (red). An overlay of the boxed section is magnified in the right-hand panel to highlight the ICD region. Blue is nuclear staining with DAPI. The Mander’s coefficients are M1 = 0.98 and M2 = 0.79 In the boxed area, The Kendall's Tau-b rank correlation value is 0.7 at the ICD and 0.4 at lateral membrane. Scale bar is 20 μm. (B) Representative STORM image of Nav1.5 and Kir6.2 detected with the same antibodies. Scale bar is 2 μm. (C) Histograms of the cluster area distributions of Nav1.5 and Kir6.2 channel subunits were fitted with single exponential function (red lines). (D) Calculated clustering distances between Nav1.5 to closest Kir6.2 clusters, and the distances of Kir6.2 to closest Nav1.5 clusters. The calculated median values are respectively 528 nm (interquartile range: 193–1254 nm, n = 89) and 390 nm (interquartile range: 106–1016 nm, n = 86).
Figure 7 with 1 supplement
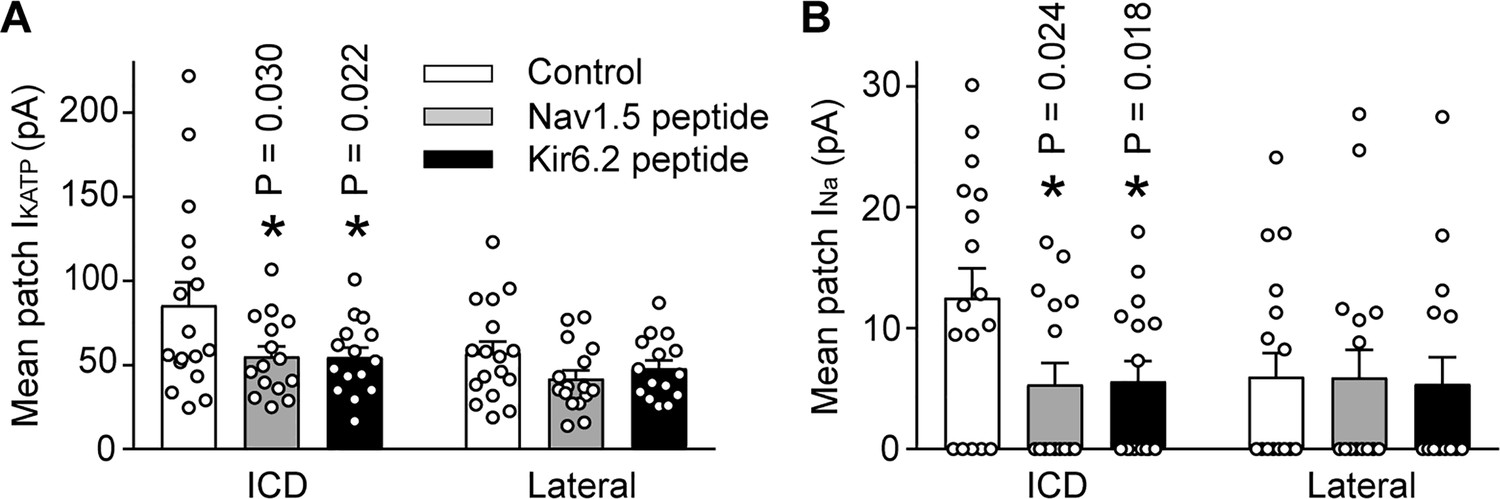
The IKATP and INa at the ICD is preferentially reduced by peptides corresponding to the Nav1.5 or Kir6.2 ankyrin binding sites.
Rat ventricular cardiac myocytes were incubated for 24 hr with TAT-conjugated peptides corresponding to the ankyrin binding site of Nav1.5 (Nav1.5 peptide, 50 µM; n = 15 cells) or Kir6.2 (Kir6.2 peptide, 50 µM; n = 15 cells). Untreated cardiomyocytes were used as a control (n = 17 cells). Duplex patch clamping was performed to measure IKATP (A) and INa (B) paired recordings at lateral membranes or at the ICD. Shown are cumulative data obtained from cells isolated from four rats. *p=0.030 and p=0.022 respectively for panel A, p=0.024 and p=0.018 respectively for panel B vs. control determined by 1W ANOVA followed by Tukey’s test.
Figure 7—figure supplement 1
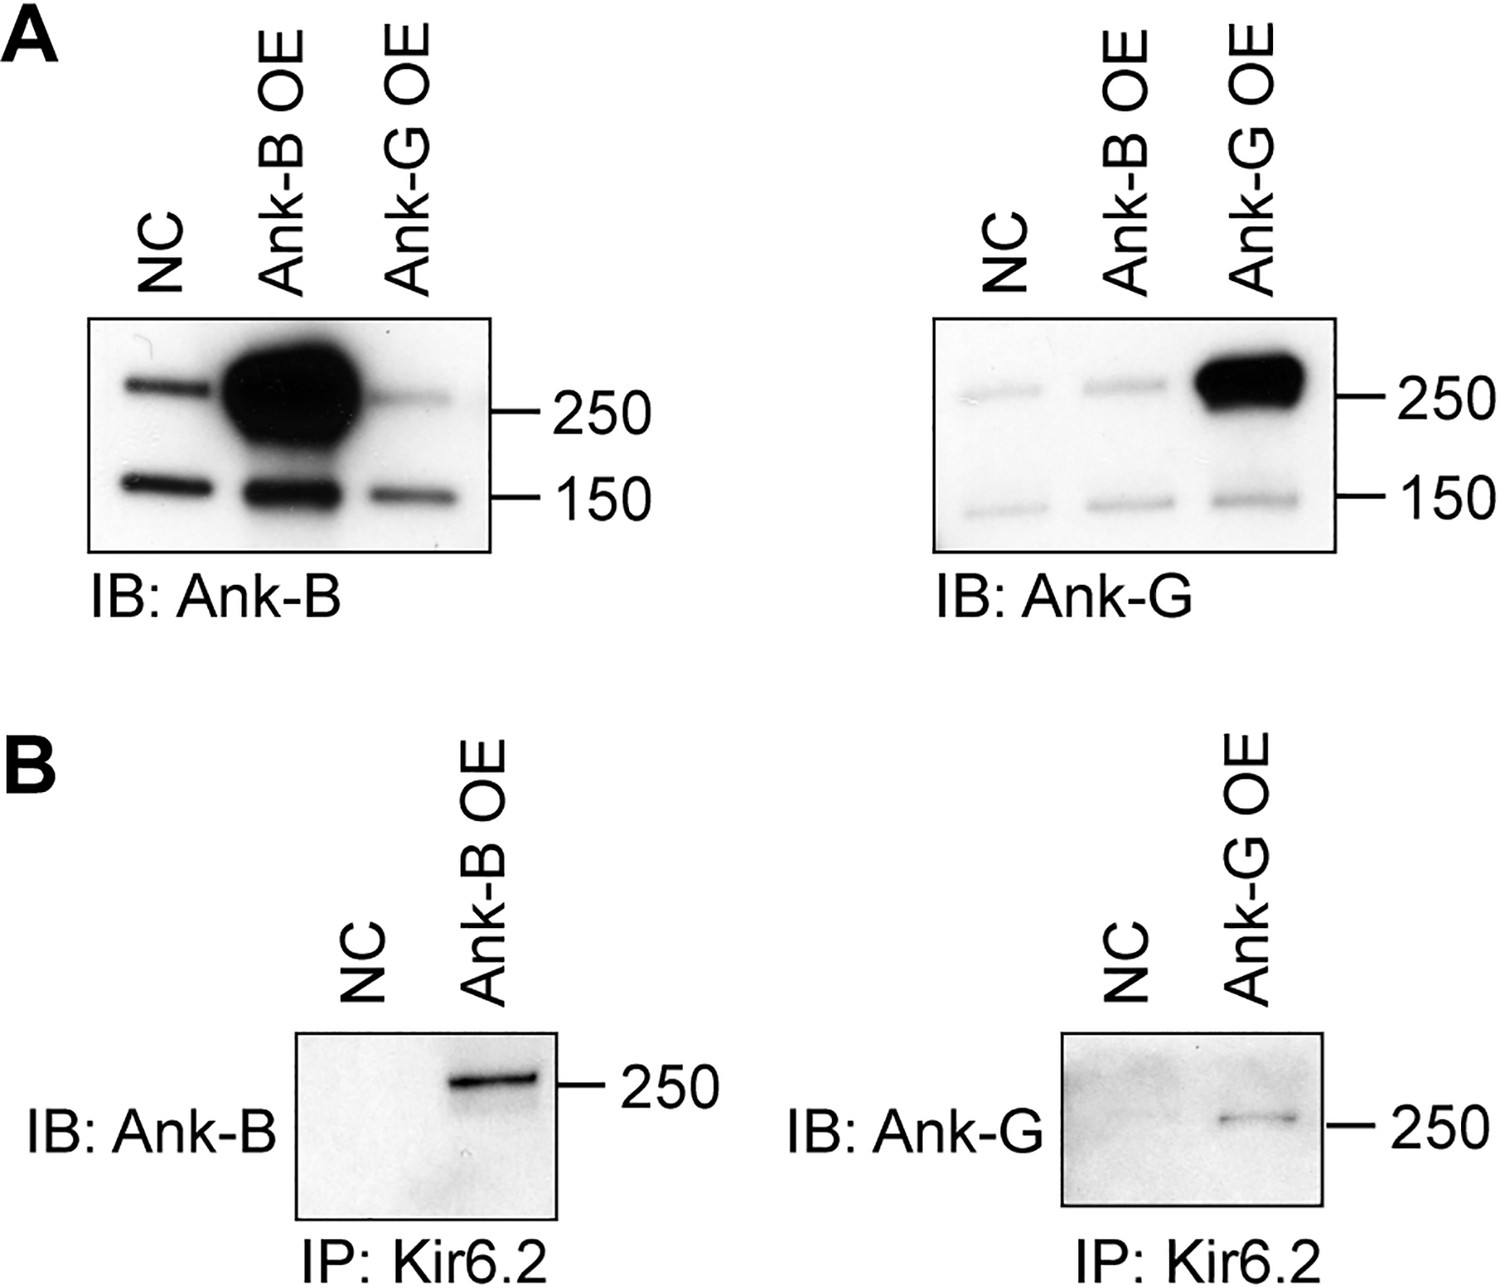
Co-immunoprecipitation of Kir6.2 with ankyrins.
(A) Validation of the anti-AnkB and anti-AnkG antibodies used. HEK293 cells were transfected with AnkB (AnkB-OE), AnkG cDNAs (AnkG-OE) (from AddGene) or with empty vector (N/C). Cell lystes were subjected to SDS-PAGE and immunoblotted with antibodies as indicated. (B) HEK293 cell lysates, transfected with Kir6.2-myc/SUR2A and AnkB (AnkB-OE), AnkG cDNAs (AnkG-OE) (from AddGene) or with empty vector (N/C) were immunoprecipitated with anti-myc antibody, followed by immunoblotting with antibodies against AnkB or AnkG.
Figure 8 with 1 supplement
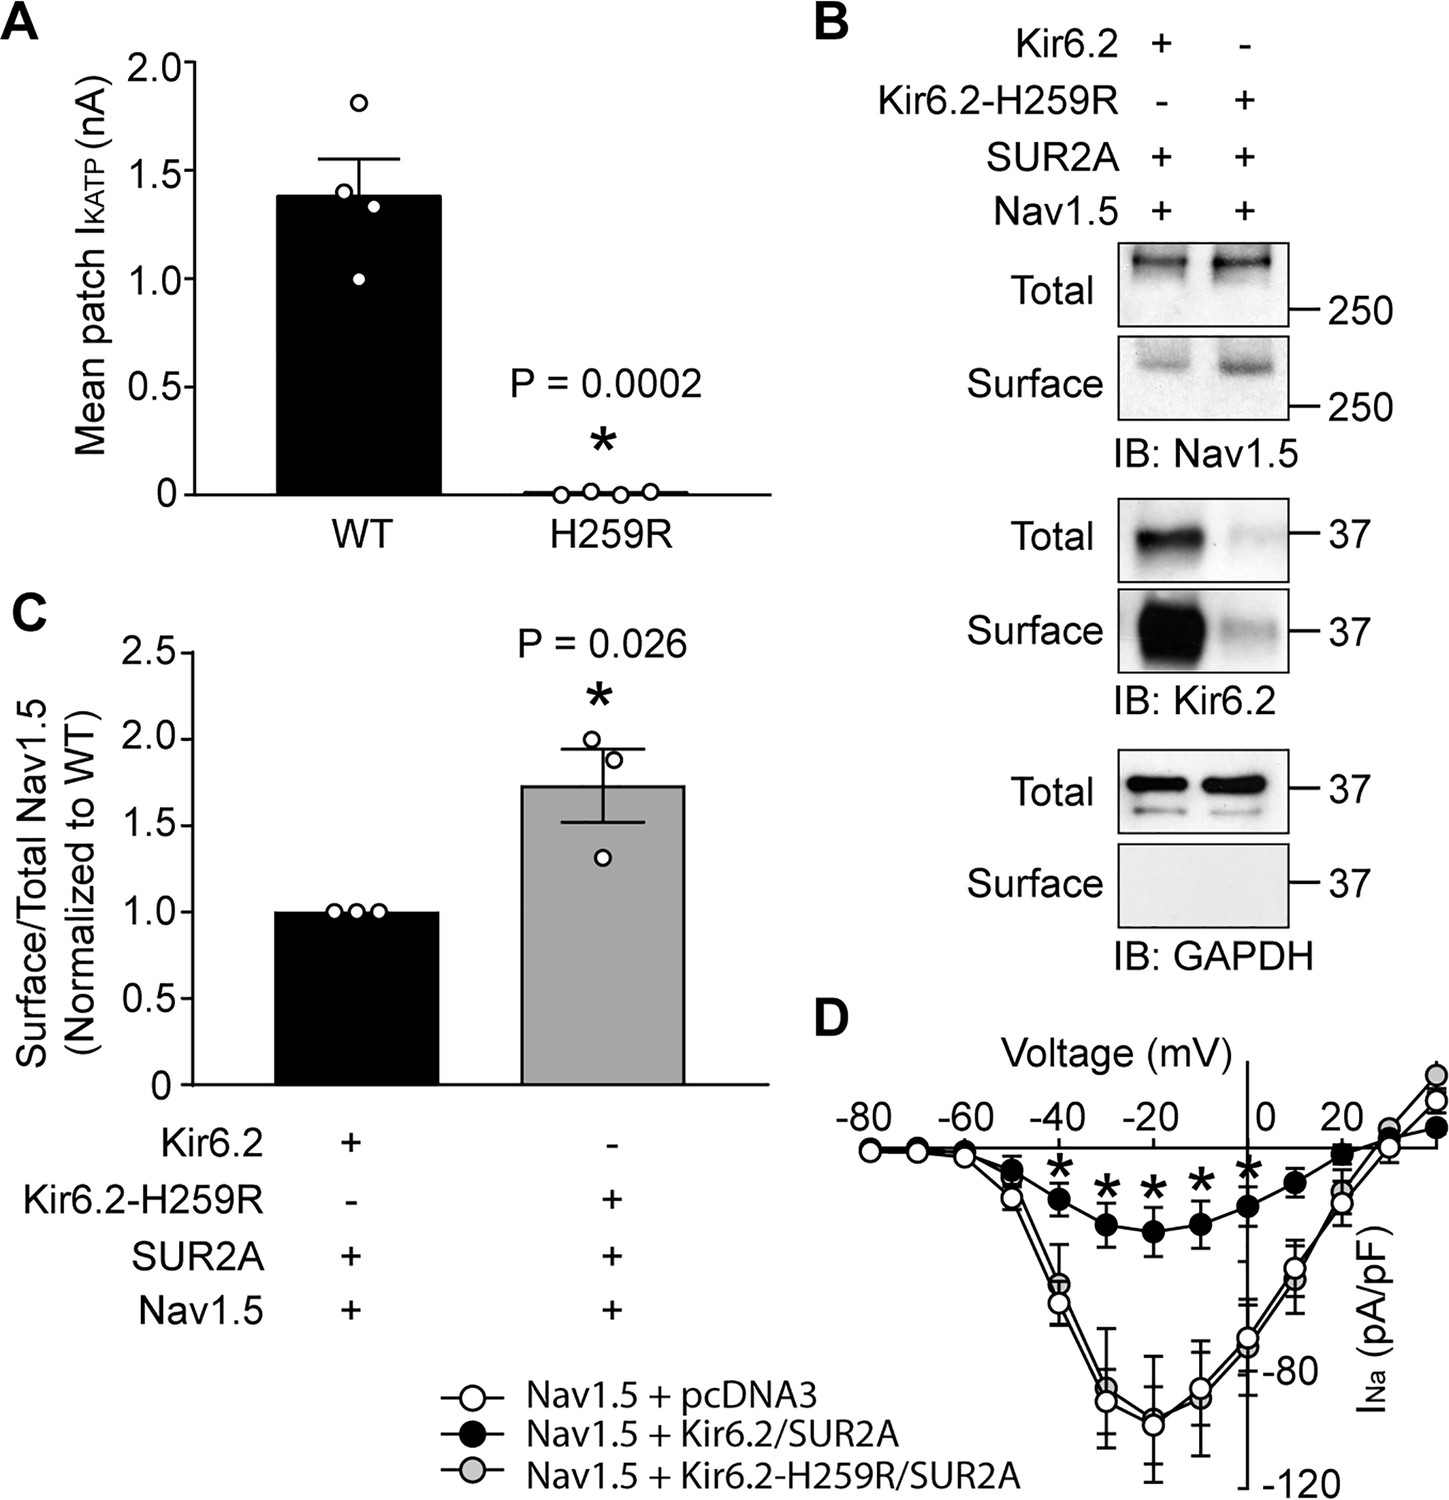
A clinically relevant Kir6.2 trafficking defective mutation (H259R) influences Nav1.5 surface expression.
(A) HEK-293 cells were transfected with Kir6.2/SUR2A or Kir6.2-H259R/SUR2A. The averaged KATP channel mean patch current, recorded in excised patches, are depicted as bar graphs, with WT-Kir6.2 and Kir6.2-H259R respectively depicted as black (n = 4 cells) or gray (n = 4 cells) bars. Data are from three transfections. *p=0.0002 using the Student’s t test. (B) Surface expression was determined by biotinylation assays with cell lysates from HEK293 cells transfected with combinations of Nav1.5, Kir6.2, Kir6.2-H259R, and/or SUR2A. Shown is a representative immunoblot of cell lysates (total) or biotinylated membrane fractions (surface) probed with antibodies as indicated. (C) Summary data (n = 3) of the normalized ratio of surface/total Nav1.5 protein in cells transfected with cDNAs as indicated. *p=0.026 using the Student’s t test. (D) Average current-voltage relationships of whole cell currents in HEK293 cells transfected with Nav1.5 plus empty vector (n = 7), Kir6.2/SUR2A (n = 7) or Kir6.2-H259R/SUR2A (n = 7). Data are from three transfections. *p<0.05 determined by two-way ANOVA followed by Tukey’s test.
Figure 8—figure supplement 1
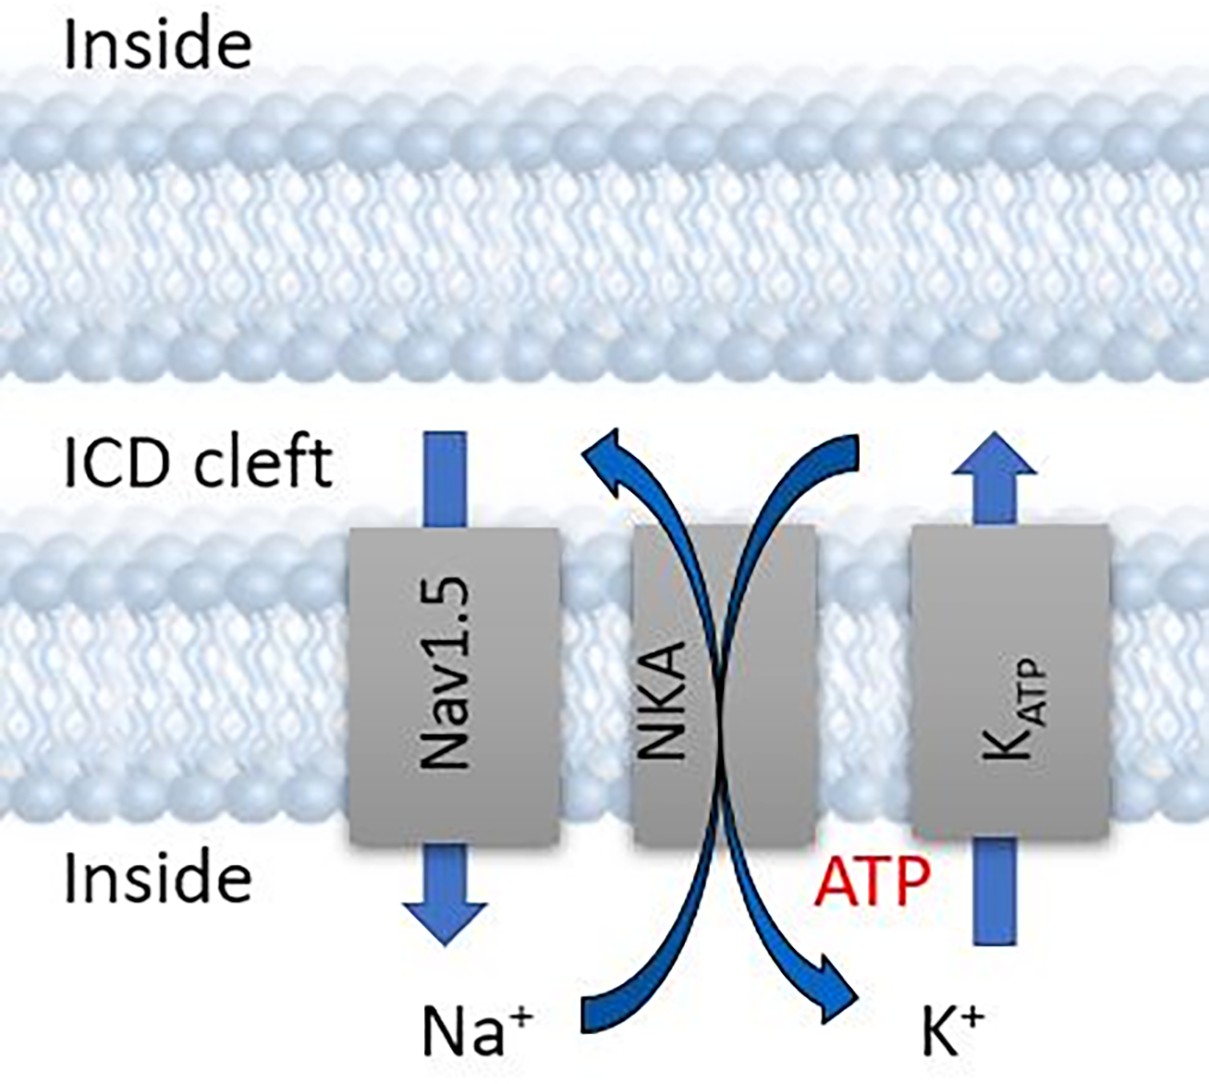
Proposed model of Na+ and K+ flux coupling at the ICD.
Tables
Key resources table
| Reagent type (species) or resource | Designation | Source or reference | Identifiers | Additional information |
|---|---|---|---|---|
| Cell line (Homo-sapiens) | HEK293 | ATCC | Cat# CRL-1573, RRID:CVCL_0045 | Mycoplasma contamination negative |
| Recombinant DNA reagent | Nav1.5 | Tan et al., 2018 | ||
| Recombinant DNA reagent | Kir6.2 | Yang et al., 2018 | ||
| Recombinant DNA reagent | Kir6.2-myc | Yang et al., 2018 | ||
| Recombinant DNA reagent | Avi-Kir6.2-myc | Yang et al., 2018 | ||
| Recombinant DNA reagent | Kir6.2-KKK | This paper | Genscript | |
| Recombinant DNA reagent | Kir6.2-H259R | This paper | Genscript | |
| Recombinant DNA reagent | Kir6.1 | This paper | Genscript | |
| Recombinant DNA reagent | Kir6.2-AAA | Tong et al., 2006 | ||
| Recombinant DNA reagent | SUR2A | Yang et al., 2018 | ||
| Recombinant DNA reagent | Ankyrin-B | Addgene | RRID:Addgene_31057 | |
| Recombinant DNA reagent | Ankyrin-G | Addgene | RRID:Addgene_31059 | |
| Transfected construct | Adenovirus mCherry | This paper | Vector Biolabs | |
| Transfected construct (human) | Adenovirus Kir6.2-mEos3.2 | This paper | Vector Biolabs | |
| Peptide, recombinant protein | Kir6.2 ankyrin binding motif | Genscript | VPIVAEEDGGGGGRKKRRQRRRPQ | |
| Peptide, recombinant protein | Nav1.5 ankyrin binding motif | Genscript | VPIAVAESDGGGGGRKKRRQRRRPQ | |
| Antibody | Anti-Nav1.5 (Mouse monoclonal) | Sigma Aldrich | Cat# S8809, RRID:AB_477552 | WB (1:2000) |
| Antibody | Anti-Nav1.5 (Rabbit polyclonal) | Sigma Aldrich | Cat# S0819, RRID:AB_261927 | IF(1:200), STORM (1:50) |
| Antibody | Anti-Kir6.2 (Goat polyclonal) | Santa Cruz | Cat# sc-11226, RRID:AB_2130475 | WB (1:500) |
| Antibody | Anti-Kir6.2 (Chicken polyclonal) | Hong et al., 2012 | C62 | IF(1:50), STORM (1:50) |
| Antibody | Anti-Kir6.2 (Rabbit polyclonal) | Hong et al., 2012 | Lee62 | STORM (1:50) |
| Antibody | Anti-AnkyrinG (Mouse monoclonal) | Neuromab | Cat# N106/20, RRID:AB_2750699 | IF(1:500), STORM (1:50), WB (1:2000) |
| Antibody | Anti-AnkyrinB (Mouse monoclonal) | Neuromab | N105/17 | IF(1:500), STORM (1:50), WB (1:2000) |
| Antibody | Anti-myc (Mouse monoclonal) | Sigma Aldrich | 9E10 | WB (1:6000) |
| Antibody | Anti-GAPDH (Mouse monoclonal) | Sigma Aldrich | Cat# G8795, RRID:AB_1078991 | WB (1:20000) |
| Antibody | Anti-caveolin3 (Mouse monoclonal) | Transduction Laboratories | C38320 | WB (1:50000) |
| Antibody | donkey anti-mouse-HRP | Jackson ImmunoResearch | Cat# 715-035-150, RRID:AB_2340770 | WB (1:10000) |
| Antibody | donkey anti-goat-HRP | Jackson ImmunoResearch | Cat# 705-035-147, RRID:AB_2313587 | WB (1:10000) |
| Antibody | goat anti-chicken Alexa Fluor568 | Thermo Scientific | Cat# A-11041, RRID:AB_2534098 | IF(1:200) |
| Antibody | donkey anti-rabbit Alexa Fluor488 | Jackson ImmunoResearch | Cat# 711-545-152, RRID:AB_2313584 | IF(1:200) |
| Antibody | donkey anti-mouse Cy3 | Jackson ImmunoResearch | Cat# 715-165-151, RRID:AB_2315777 | IF(1:200) |
| Software, algorithm | GraphPad Prism | GraphPad Prism | RRID:SCR_002798 |
Additional files
-
Source data 1
Original data and graph files.
- https://cdn.elifesciences.org/articles/52373/elife-52373-data1-v2.zip
-
Supplementary file 1
Validation of antibodies.
- https://cdn.elifesciences.org/articles/52373/elife-52373-supp1-v2.docx
-
Transparent reporting form
- https://cdn.elifesciences.org/articles/52373/elife-52373-transrepform-v2.docx
Download links
A two-part list of links to download the article, or parts of the article, in various formats.
Downloads (link to download the article as PDF)
Open citations (links to open the citations from this article in various online reference manager services)
Cite this article (links to download the citations from this article in formats compatible with various reference manager tools)
Ankyrin-G mediates targeting of both Na+ and KATP channels to the rat cardiac intercalated disc
eLife 9:e52373.
https://doi.org/10.7554/eLife.52373


