Visually-updated hand state estimates modulate the proprioceptive reflex independently of motor task requirements
- NTT Communication Science Laboratories, Nippon Telegraph and Telephone Co., Japan
Figures
Figure 1

Experimental setups.
(A) Participants’ right hand was fixed to a wrist manipulandum, which allowed only flexion and extension movement of wrist joint. Visual feedback was displayed on a horizontally set screen. (B) Schematic diagrams of Experiment 1. In the baseline condition, cursor motion was presented along the x-axis so that flexion of the wrist joint (increase in θ) was transformed to a leftward motion (negative x). With the rotated visual feedback condition, locations of the cursor, the starting point, and the goal target were all rotated around the center of work space ([x, y] = [0, 0]).
Figure 2 with 1 supplement
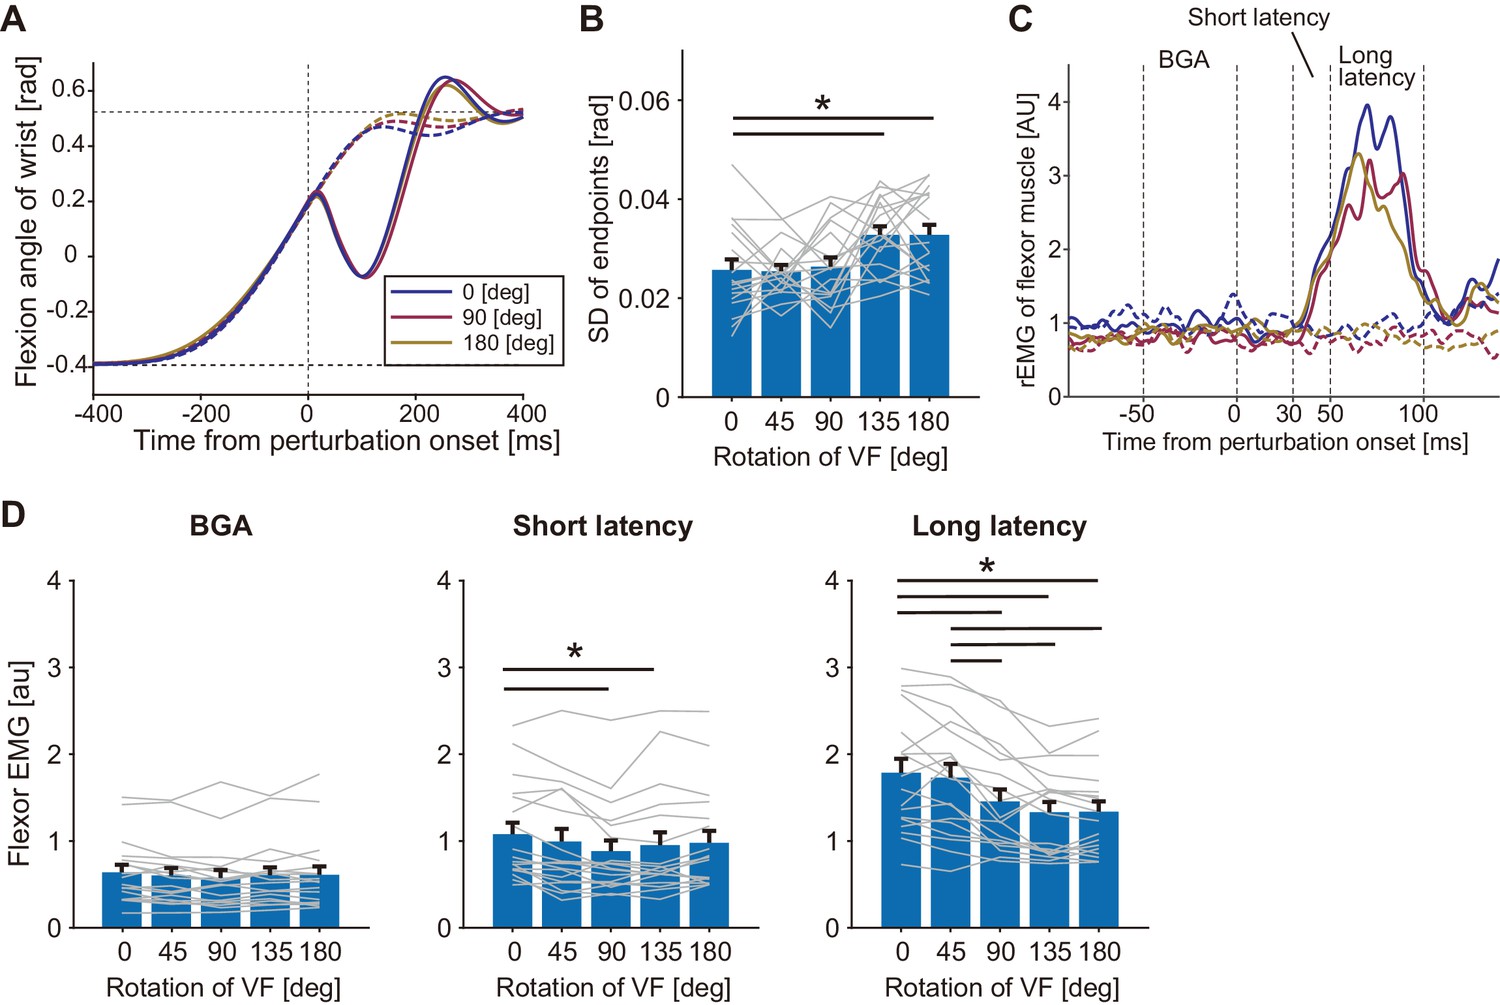
Responses to a mechanical perturbation applied during visually guided wrist flexion movements of Agonist group in Experiment 1.
(A) Temporal profiles of wrist movements with different visual feedback (representative participant). All data were aligned at the position where the mechanical perturbations were applied. Dotted curves show unperturbed trials and solid curves show perturbed trials. Blue, magenta, and yellow curves denote trials with the visual rotation of 0°, 90°, and 180°, respectively. (B) Variability of endpoints (standard deviation) of unperturbed trials in each visual rotation condition. (C) Rectified and smoothed EMG patterns of wrist flexor of a representative participant. Each solid curve denotes average of perturbed trials and dotted curve denotes average of unperturbed trials (notation of color is same with A). BGA denotes background EMG activity. (D) The wrist flexor EMG amplitude in each time window (BGA, Short latency, and Long latency) for each VF rotation (see Materials and methods). Thin gray lines represent data of individual participants. Bar graphs and error bars indicate group mean and standard error across participants. Asterisks indicate significant differences (p<0.05). Additional movement profiles of Agonist group in Experiment 1 are available in figure supplement.
-
Figure 2—source data 1
Data of Agonist group in Experiment 1 including quantified muscle activities and movement profiles of each participant.
- https://cdn.elifesciences.org/articles/52380/elife-52380-fig2-data1-v1.txt
Figure 2—figure supplement 1
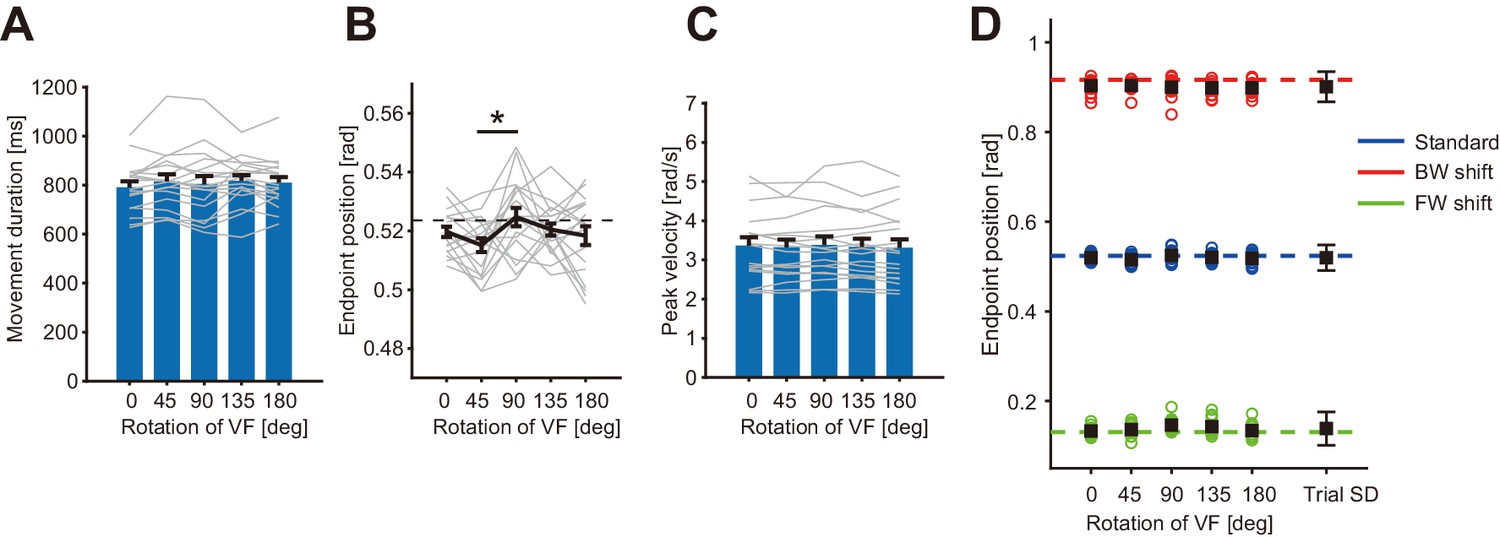
Additional movement profiles of Agonist group in Experiment 1.
(A) Movement durations in all visual rotation conditions. Main effect of visual feedback was not significant (p=0.31, F(4, 17)=1.23, partial η2 = 0.067). (B) Movement endpoint of unperturbed trials in all visual rotation conditions. Main effect of visual feedback was significant (p=0.048, F(4, 17)=2.54, partial η2 = 0.13). Post-hoc test found significant difference between 45° and 90° (p<0.05, shown with asterisk). (C) Peak velocity in all visual rotation conditions. Main effect of visual feedback was not significant (p=0.53, F(4, 17)=0.80, partial η2 = 0.045). (D) Movement endpoint shifts in response to forward (FW) and to backward (BW) cursor shifts in catch trials. In A, B, and C, error bar denotes standard error across participants. In D, error bar of Trial SD denotes the mean of standard deviations of the endpoints in each condition (FW, BW, or Standard for each rotation angle) of all participants.
Figure 3 with 1 supplement
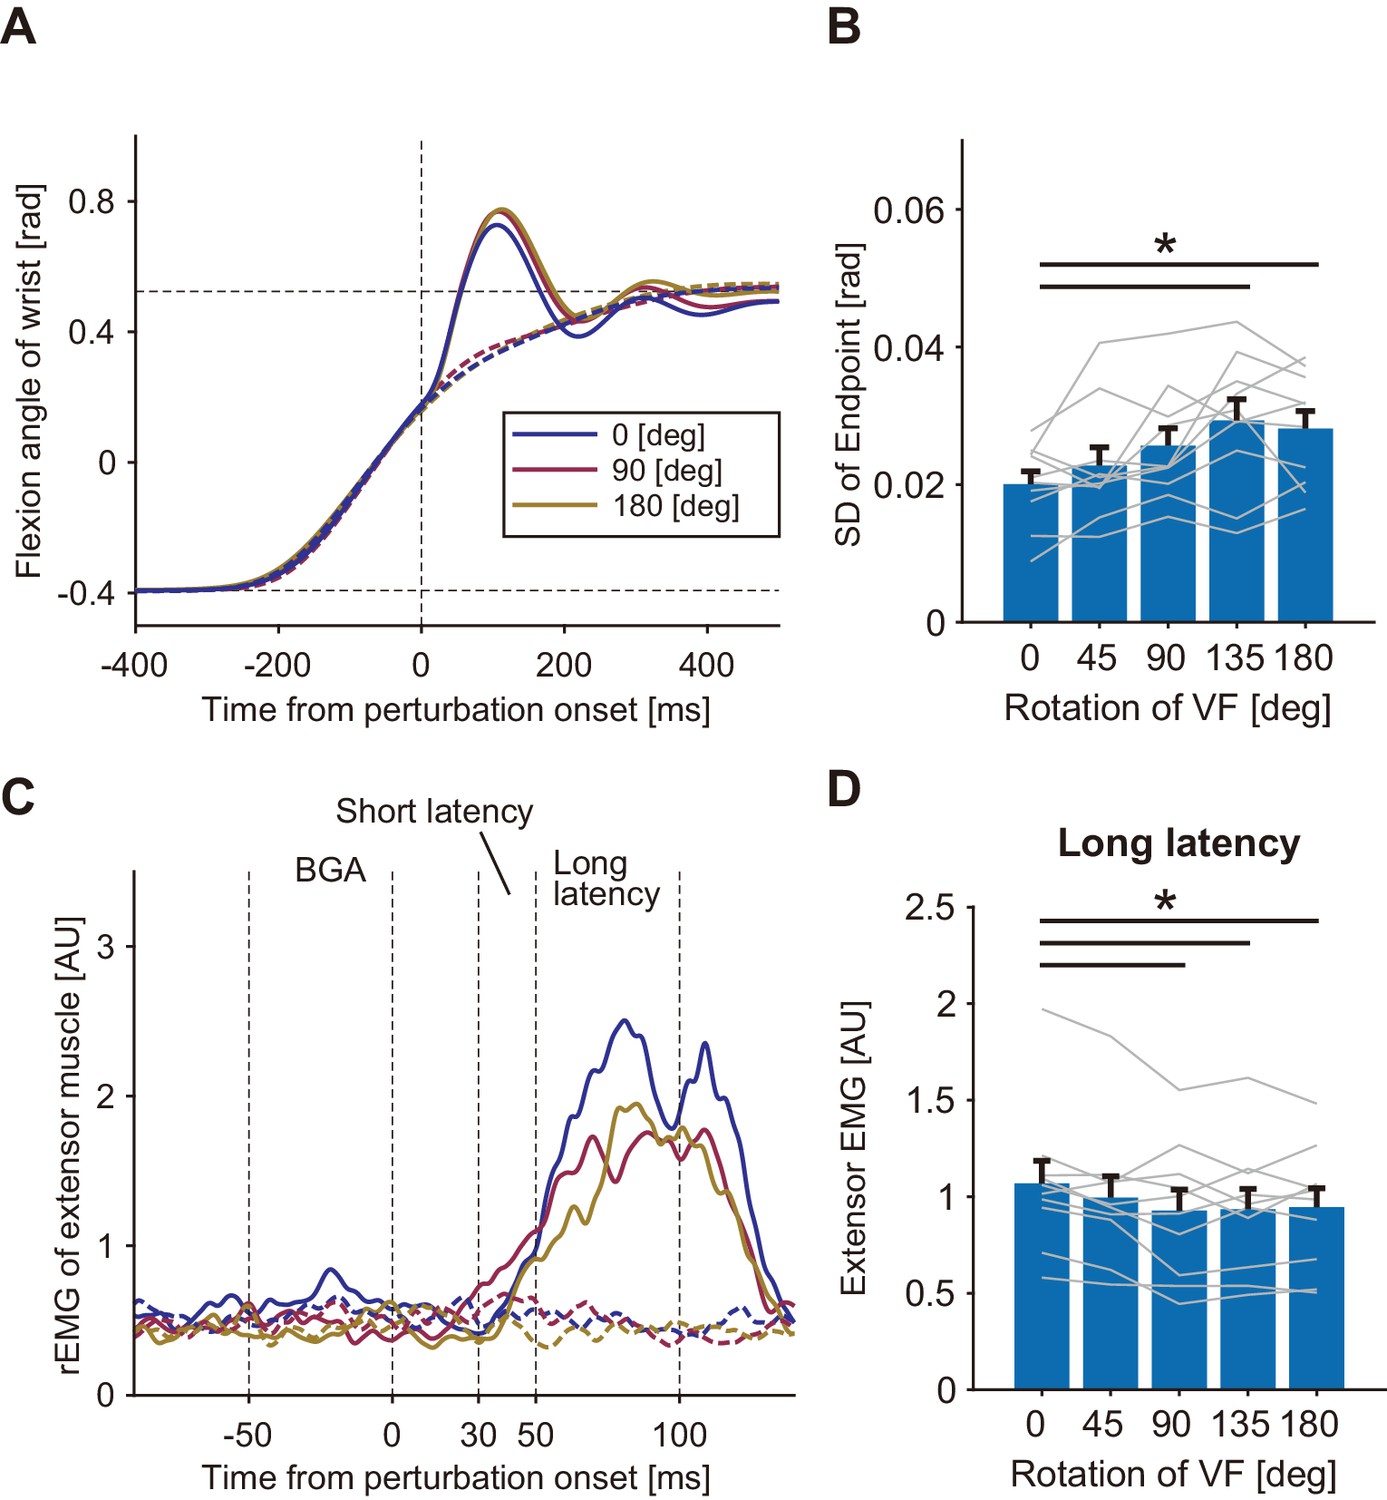
Responses to a mechanical perturbation applied during visually guided wrist flexion movements of Antagonist group in Experiment 1.
(A) Temporal profiles of wrist movements with different visual feedback (representative participant). Dotted curves show unperturbed trials and solid curves show perturbed trials. Blue, magenta, and yellow curves denote visual rotations of 0°, 90°, and 180°, respectively. (B) Variability of endpoints (standard deviation) of unperturbed trials in each visual rotation condition. (C) Rectified and smoothed EMG patterns of wrist extensor activity for a representative participant. Each solid curve denotes average of perturbed trials and dotted curve denotes average of unperturbed trials (curve color is the same as in A). BGA denotes background EMG activity. (D) Amplitude of long-latency stretch reflex of the wrist extensor (means ±SE) for each VF rotation. Lines represent individual data. Asterisk indicates significant differences between the pairs of conditions (p<0.05). Additional movement profiles of Antagonist group in Experiment 1 are available in figure supplement.
-
Figure 3—source data 1
Data of Antagonist group in Experiment 1 including quantified muscle activities and movement profiles of each participant.
- https://cdn.elifesciences.org/articles/52380/elife-52380-fig3-data1-v1.txt
Figure 3—figure supplement 1

Additional movement profiles of Antagonist group in Experiment 1.
(A) Movement durations in all visual rotation conditions. Main effect of visual feedback was not significant (p=0.15, F(4, 9)=1.78, partial η2 = 0.16). (B) Movement endpoint of unperturbed trials in all visual rotation conditions. Main effect of visual feedback was not significant (p=0.52, F(4, 9)=0.82, partial η2 = 0.083). (C) Peak velocity in all visual rotation conditions. Main effect of visual feedback was not significant (p=0.47, F(4, 9)=0.90, partial η2 = 0.091). (D) Movement endpoint shifts in response to forward (FW) and to backward (BW) cursor shifts in catch trials. In A, B, and C, error bar denotes standard error across participants. In D, error bar of Trial SD denotes the mean of standard deviations of the endpoints in each condition (FW, BW, or Standard for each rotation angle) of all participants.
Figure 4 with 1 supplement

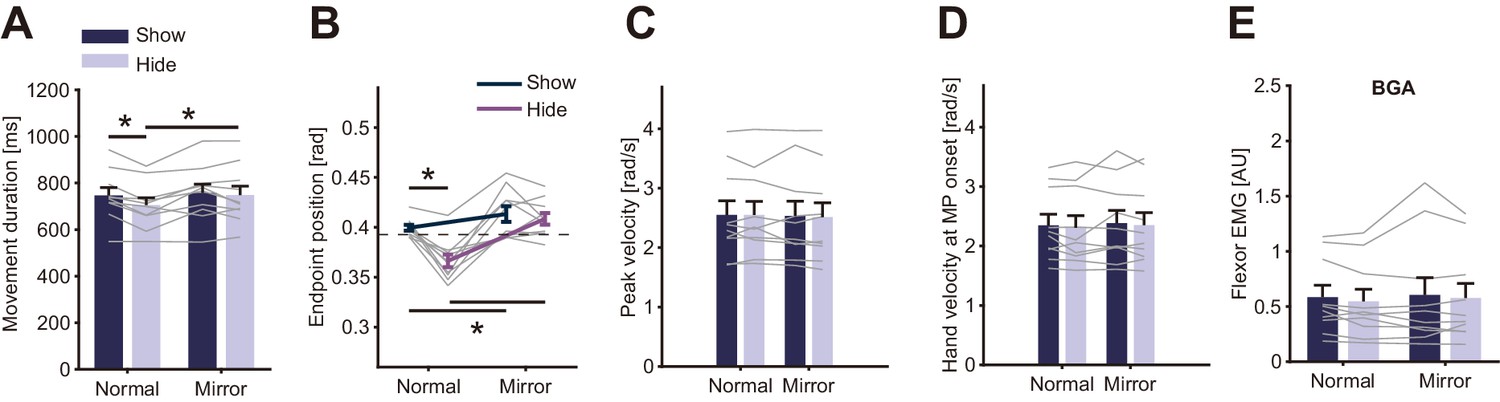
Visual feedback effects on stretch reflexes in Experiment 2.
(A) Experimental conditions and visual feedbacks. Normal and Mirror conditions were inflicted in different blocks while Show and Hide conditions appeared randomly within each block. (B) Temporal profiles of wrist movements (representative participant). Data in both perturbed (solid curve) and unperturbed (dotted curve) trials are plotted. (C) Standard deviation of movement endpoints (group mean ±SE). Dark blue: data from show-cursor trials; Light blue: data from hide-cursor trials. Grey lines represent individual data. Two-way ANOVA showed significant effects of both visual feedback types. Interaction between the visual feedback type and the cursor appearance was not significant (p=0.10). (D) Rectified and smoothed EMG patterns of flexor muscle activity evoked by the mechanical perturbation. Solid curves show perturbed trials and dotted curves show unperturbed trials. Data from a representative participant. BGA denotes background EMG activity. (E) Amplitude of long-latency stretch reflexes (group mean ±SE) in Experiment 2. Two-way ANOVA showed significant effects of both visual feedback type (Normal vs Mirror, p=6.0 × 10⁻⁴) and cursor appearance (Show vs Hide, p=1.6 × 10⁻³). Interaction between visual feedback type and cursor appearance was not significant (p=0.41). Additional movement profiles in Experiment 2 are available in figure supplement.
-
Figure 4—source data 1
Group data of Experiment 2 including quantified muscle activities and movement profiles.
- https://cdn.elifesciences.org/articles/52380/elife-52380-fig4-data1-v1.txt
Figure 4—figure supplement 1
Additional movement profiles in Experiment 2.
(A) Movement durations in four conditions. Two-way ANOVA found significant effect of factor for visual feedback type (p=0.043, F(1, 9)=5.56, partial η2 = 0.38), cursor visibility (p=0.026, F(1, 9)=7.03, partial η2 = 0.44), and interaction (p=0.0035, F(1, 9)=15.43, partial η2 = 0.63). Asterisks indicate significant simple main effects (p<0.05). (B) Movement endpoints of unperturbed trials in four conditions. Two-way ANOVA found significant effect of factor for visual feedback type (p=2.7 × 10⁻⁴, F(1, 9)=33.26, partial η2 = 0.79), cursor visibility (p=9.6 × 10⁻⁴, F(1, 9)=23.13, partial η2 = 0.72), and interaction (p=0.0040, F(1, 9)=14.76, partial η2 = 0.62). Asterisks indicate significant simple main effects (p<0.05). (C) Peak velocity in four conditions. (D) Hand velocities just before application of mechanical perturbation in MP trials. (E) The wrist flexor EMG amplitude in the duration of BGA of MP trials. Since the movement states (position and velocity) and background EMG activities just before the MP applications were not significantly different among four conditions, we compared the stretch reflex responses among those conditions in the main analysis.
Figure 5 with 1 supplement

Cursor elimination effects on stretch reflexes in Experiment 3.
(A) Schematic diagram of the experimental task. The visual cursor disappeared (shown as dotted curves in the right panels) after passing one of three different locations in the test conditions, while the cursor was displayed throughout the trial in the baseline condition (Show). Mechanical perturbations were applied at a constant position in all conditions, indicated by a short bar on the movement paths. (B) The duration of the elimination of visual cursor before the perturbation onset in each type of trial. (C) Standard deviation of movement endpoints in unperturbed trials. (D) Amplitude of long-latency stretch reflexes. In panel B, C, and D, lines represent individual data, bar graphs and error bars indicate group mean and standard error, and solid horizontal bars indicate significant differences between corresponding pairs (p<0.05). Additional movement profiles in Experiment 3 are available in figure supplement.
-
Figure 5—source data 1
Group data of Experiment 3 including quantified muscle activities, movement profiles, and duration of cursor elimination.
- https://cdn.elifesciences.org/articles/52380/elife-52380-fig5-data1-v1.txt
Figure 5—figure supplement 1

Additional movement profiles in Experiment 3.
(A) Movement durations in four conditions. Main effect of cursor elimination was not significant (p=0.052, F(4, 9)=2.93, partial η2 = 0.25). (B) Movement endpoints of unperturbed trials in four conditions. Main effect of cursor elimination was not significant (p=0.097, F(4, 9)=2.32, partial η2 = 0.21). (C) Peak velocity in four conditions. Main effect of cursor elimination was not significant (p=0.16, F(4, 9)=1.84, partial η2 = 0.17). (D) The wrist flexor EMG amplitude in the duration of BGA. Main effect of cursor elimination was not significant (p=0.055, F(4, 9)=2.86, partial η2 = 0.24).
Figure 6

Schematic diagram of Experiment 4.
(A) Pro/Anti-reaction session. Left panels show the task in baseline trial, middle panels show the task in forward target jump trial, and right panels show the task in backward target jump trial. Visual cursor was always shown on the screen. Two small markers (gray dots) were also shown as possible goals in Anti-reaction block. In Anti-reaction block, participant should move their hand in the opposite direction to the target jump (See main text for details). (B) Normal/Mirror session. From left to right, panels show baseline, forward target jump, and backward target jump. In Mirror block, hand cursor moved in the opposite direction to the real hand motion.
Figure 7 with 1 supplement

Temporal patterns of hand acceleration, Flexor rEMG, and Extensor rEMG.
(A) Pro/Anti-reaction session (representative participant). All data were aligned to the onset timing of the target jump. Gray solid line: baseline; Dashed line: Forward target jump; Dash-dot line: Backward target jump. Open triangle denotes response latency estimated from each type of data (see Materials and methods). Grey shaded areas show the time window for quantifying quick visuomotor response defined from the reaction latencies of all participants (115–175 ms, see Results). Response latencies for target jump in Pro/Anti-reaction sessions are available in figure supplement. (B) Normal/Mirror session (representative participant). Regardless of visual feedback type (Normal/Mirror), forward target jumps required more flexing correction then backward jumps required extending correction. All notations are same as in A. Group data of the response latency are available in figure supplement.
Figure 7—figure supplement 1
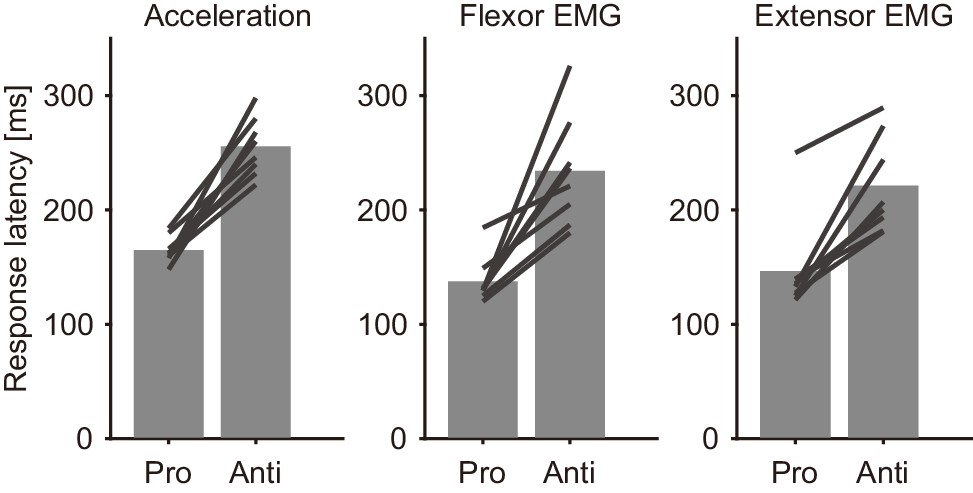
Response latencies for target jump in Pro/Anti-reaction sessions.
Each line is an individual participant’s data. Bars are the group mean. The response latency of acceleration was 165.0 ± 4.2 ms (group mean ±SE) for Pro and 255.8 ± 9.1 ms for Anti. Similarly, the response latency of flexor EMG was 137.5 ± 7.3 ms for Pro and 234.2 ± 17.2 ms for Anti, and those obtained from extensor EMG were 146.4 ± 15.0 ms for Pro and 221.3 ± 14.9 ms for Anti.
Figure 8 with 2 supplements
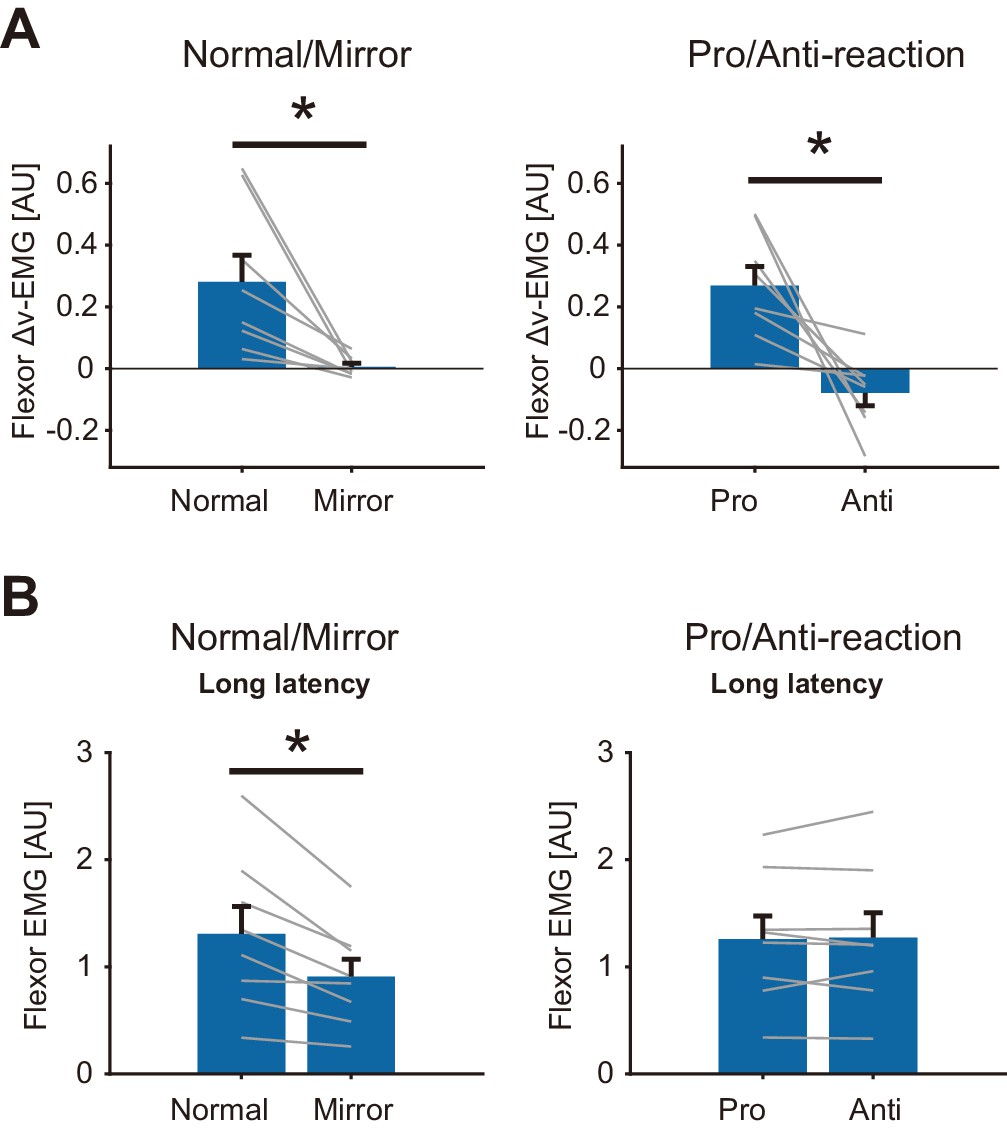
Reflexive muscle reactions (Flexor) to target jump and to mechanical perturbation in Normal/Mirror and in Pro/Anti-reaction sessions of Experiment 4.
(A) Mean flexor Δv-EMG amplitudes, obtained by (v-EMG for forward correction) − v-EMG for backward correction). Δv-EMG in Pro-reaction condition was greater than that in Anti-reaction condition. Δv-EMG in Normal visual feedback condition was greater than that in Mirror condition. (B) Mean flexor long-latency stretch reflex amplitudes induced by mechanical perturbation. While a difference in stretch reflex was not found between Pro- and Anti-reaction conditions, the stretch reflex in the Normal condition was greater than that in the Mirror condition. In all graphs, error bars indicate standard error, and thin gray lines represent individual data. Asterisks indicate significant differences. Additional movement profiles in Experiment 4 are available in Figure 8—figure supplement 1, and reflexive muscle reactions (Extensor) to target jump in Pro/Anti-reaction and in Normal/Mirror sessions are available in Figure 8—figure supplement 2.
-
Figure 8—source data 1
Group data of Experiment 4 including long-latency stretch reflex, Δv-EMG, response latencies, and movement profiles.
- https://cdn.elifesciences.org/articles/52380/elife-52380-fig8-data1-v1.txt
Figure 8—figure supplement 1
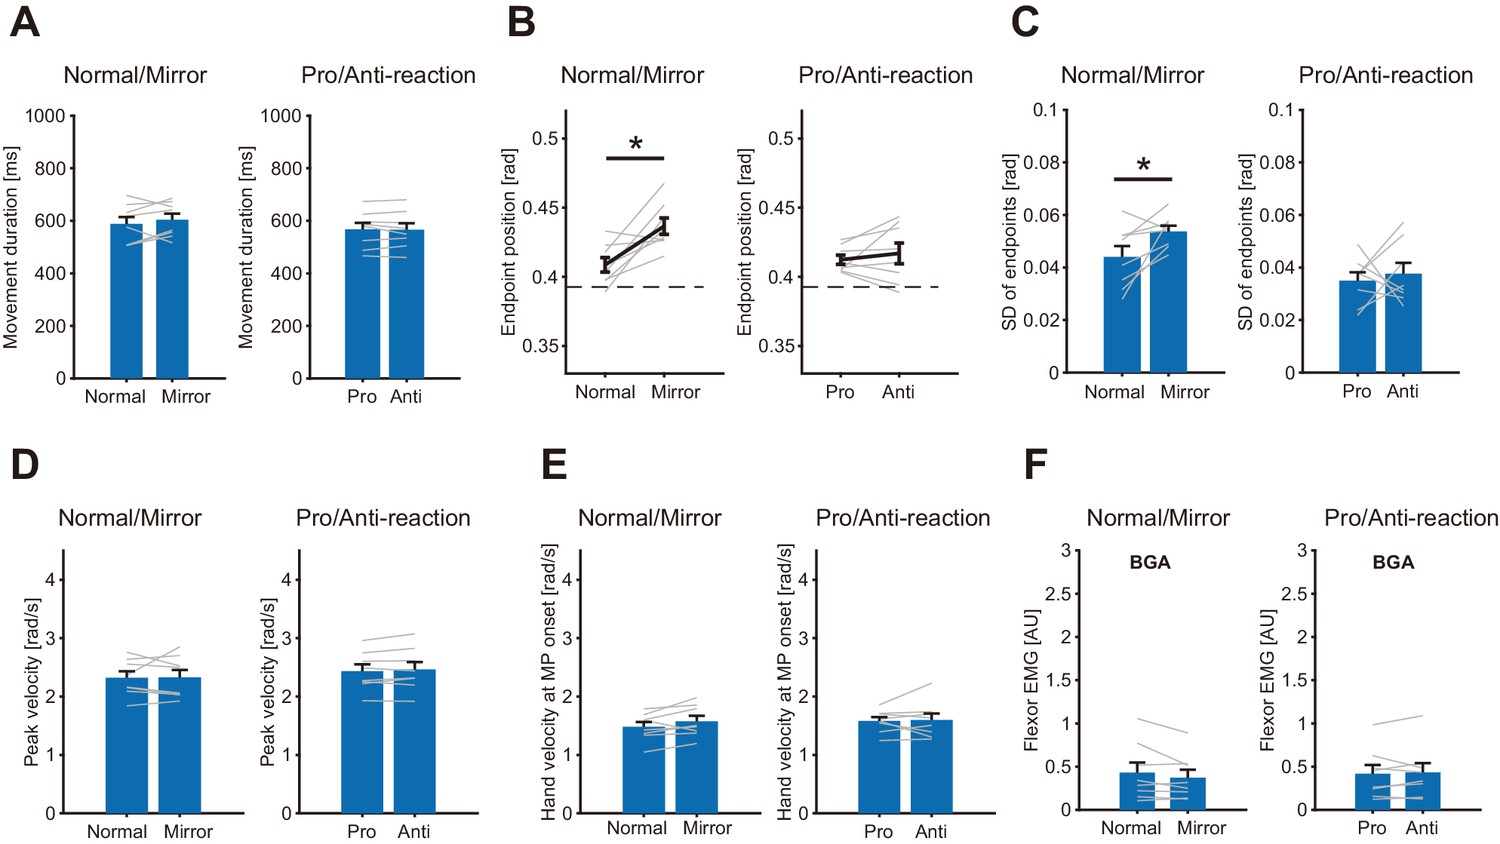
Additional movement profiles in Experiment 4.
(A) Movement durations in Pro/Anti-reaction and Normal/Mirror sessions. Values were not significantly different between Pro and Anti block (p=0.80, t(7) = 0.27, d = 0.022) nor between Normal and Mirror blocks (p=0.34, t(7) = 1.03, d = 0.23). (B) Movement endpoints of baseline trials (no target jump and no MP) in these sessions. A significant difference was not found between Pro and Anti blocks (p=0.46, t(7) = 0.78, d = 0.28), but was found between Normal and Mirror blocks (p=0.010, t(7) = 3.48, d = 1.8). (C) Standard deviation (SD) of movement endpoints in baseline trials in these sessions. The SD of movement endpoints was not different between Pro and Anti blocks (p=0.83, t(7) = 0.23, d = 0.13), but it was significantly larger in Mirror block than Normal block (p=0.037, t(7) = 2.56, d = 1.1). (D) Peak velocities in these sessions. Peak velocities were not significantly different between Pro and Anti block (p=0.28, t(7) = 1.18, d = 0.079) nor between Normal and Mirror blocks (p=0.93, t(7) = 0.086, d = 0.020). (E) Hand velocities just before application of MP in the MP trials. The values were not significantly different between Pro and Anti blocks (p=0.82, t(7) = 0.24, d = 0.065) nor between Normal and Mirror blocks (p=0.099, t(7) = 1.90, d = 0.37). (F) The wrist flexor EMG amplitude in the duration of BGA of MP trials. The values were not significantly different between Pro and Anti blocks (p=0.62, t(7) = 0.51, d = 0.053) nor between Normal and Mirror blocks (p=0.16, t(7) = 1.58, d = 0.20). Since the movement states (position and velocity) and background EMG activities just before application of MP were not significantly different between the two conditions in each session, we compared the stretch reflex responses in the main analysis.
Figure 8—figure supplement 2
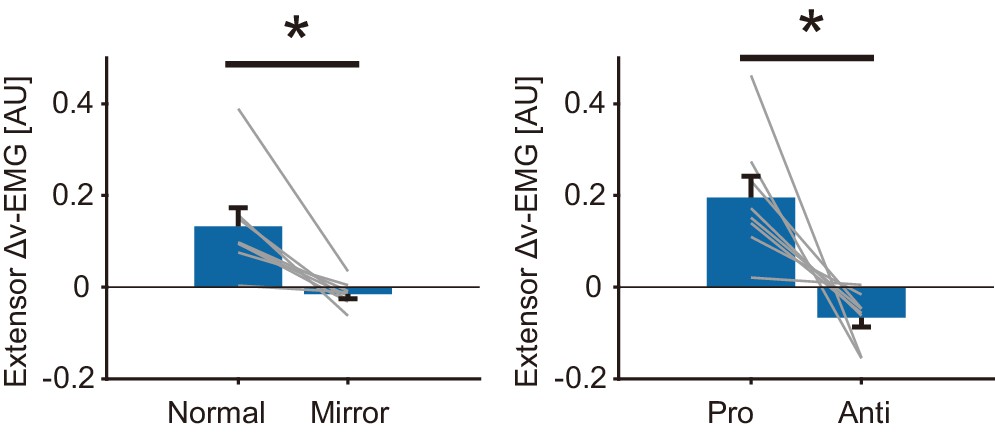
Reflexive muscle reactions (Extensor) to target jump in Pro/Anti-reaction and in Normal/Mirror sessions of Experiment 4.
(A) Mean extensor Δv-EMG amplitudes, obtained by (v-EMG for backward correction) - (v-EMG for forward correction). Extensor Δv-EMG in Pro-reaction condition was greater than that in Anti-reaction condition (p=0.0053, t(7) = 3.98, d = 2.6). Extensor Δv-EMG in Normal visual feedback condition was greater than that in Mirror condition (p=0.0050, t(7) = 4.03, d = 1.8).
Tables
Table 1
Trial conditions in Experiment 2.
| Block (Direction) | Target | Cursor | Perturbation | # of trials |
|---|---|---|---|---|
| Normal | Std | Show | MP | 4 |
| N | 6 | |||
| Hide | MP | 4 | ||
| N | 6 | |||
| Near | Show | N | 5 | |
| Hide | N | 5 | ||
| Far | Show | N | 5 | |
| Hide | N | 5 | ||
| Mirror | Std | Show | MP | 4 |
| N | 6 | |||
| Hide | MP | 4 | ||
| N | 6 | |||
| Near | Show | N | 5 | |
| Hide | N | 5 | ||
| Far | Show | N | 5 | |
| Hide | N | 5 |
Table 2
Trial conditions in Experiment 3.
| Target | Cursor | Perturbation | # of trials |
|---|---|---|---|
| Std | Show | MP | 4 |
| N | 6 | ||
| Short-hide | MP | 4 | |
| N | 6 | ||
| Middle-hide | MP | 4 | |
| N | 6 | ||
| Long-hide | MP | 4 | |
| N | 6 | ||
| Near | Show | N | 10 |
| Long-hide | N | 10 | |
| Far | Show | N | 10 |
| Long-hide | N | 10 |
Table 3
Session and bock conditions in Experiment 4.
| Session | Block (randomized in each session) |
|---|---|
| Pro/Anti | Pro-reaction x 2 |
| Anti-reaction x 2 | |
| Normal/Mirror | Normal x 2 |
| Mirror x 2 |
Table 4
Trial conditions in each block in Experiment 4.
| MP/Target jump | # of trials (randomized in each block) |
|---|---|
| No (baseline) | 12 |
| MP | 12 |
| Forward jump | 18 |
| Backward jump | 18 |
Additional files
-
Source code 1
Individual EMG and kinematic data.
- https://cdn.elifesciences.org/articles/52380/elife-52380-code1-v1.mat
-
Transparent reporting form
- https://cdn.elifesciences.org/articles/52380/elife-52380-transrepform-v1.docx
Download links
A two-part list of links to download the article, or parts of the article, in various formats.
Downloads (link to download the article as PDF)
Open citations (links to open the citations from this article in various online reference manager services)
Cite this article (links to download the citations from this article in formats compatible with various reference manager tools)
Visually-updated hand state estimates modulate the proprioceptive reflex independently of motor task requirements
eLife 9:e52380.
https://doi.org/10.7554/eLife.52380


