Repression of interrupted and intact rDNA by the SUMO pathway in Drosophila melanogaster
- Division of Biology and Biological Engineering, California Institute of Technology, United States
- Institute of Molecular Genetics, Russian Academy of Sciences, Russian Federation
Figures
Figure 1
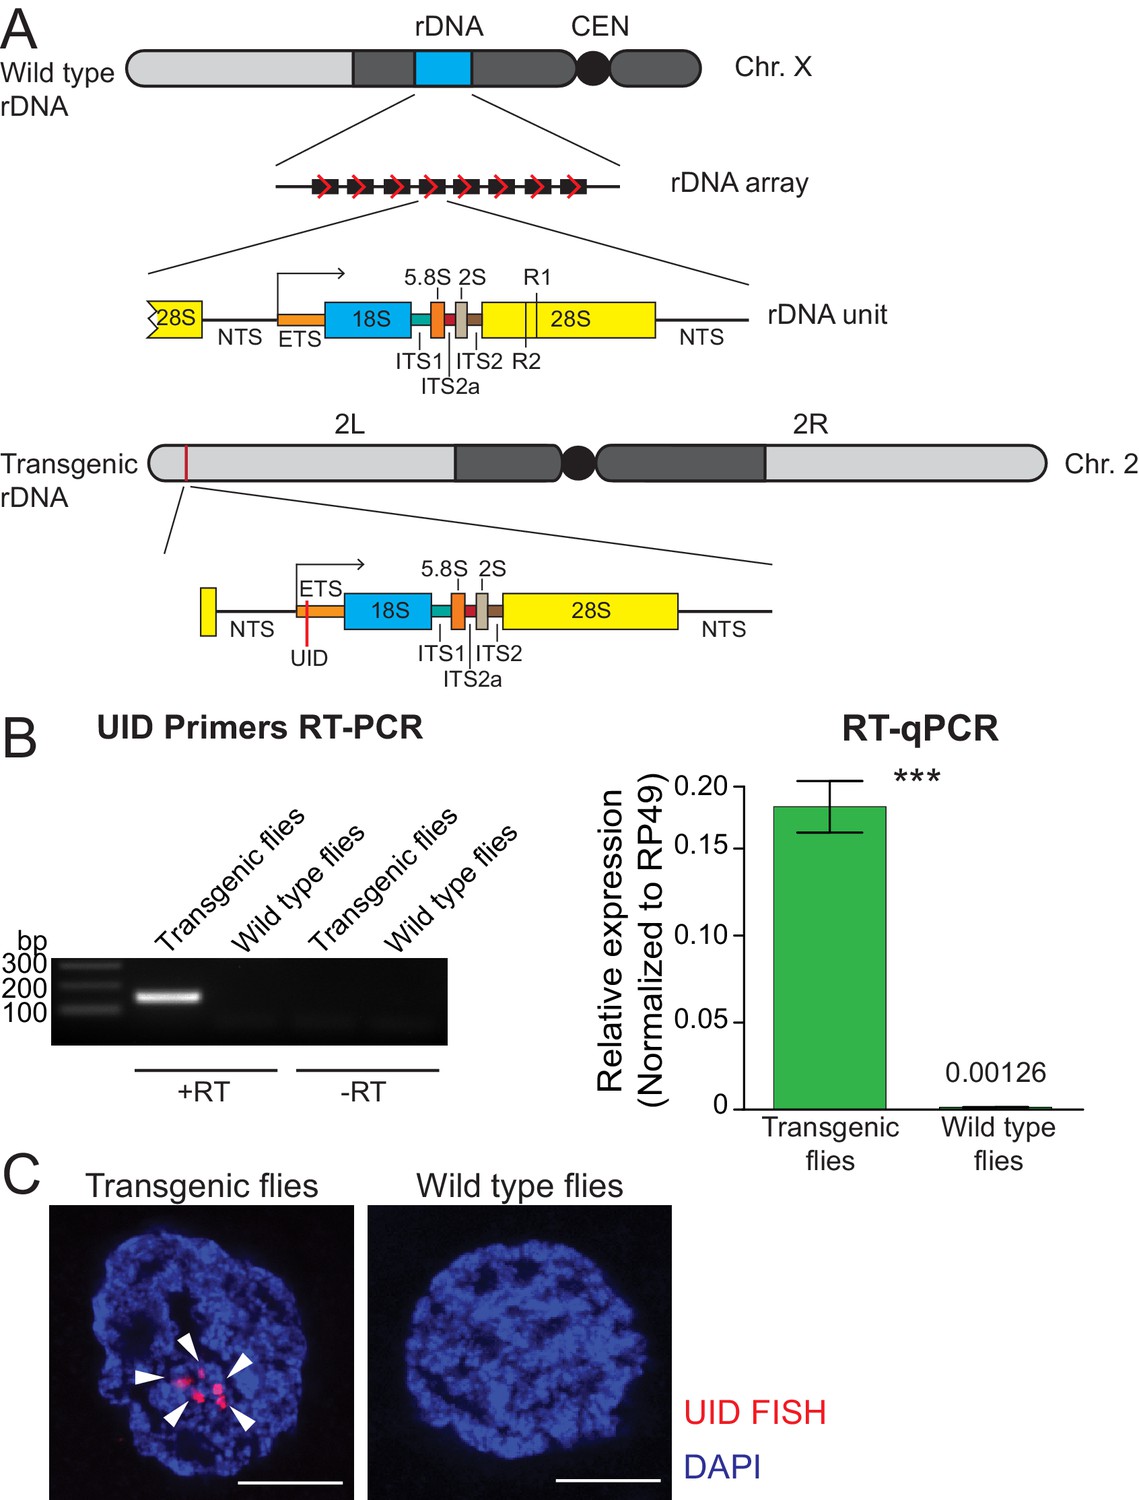
Single-copy rDNA transgene allows study of rDNA expression.
(A) Scheme of endogenous rDNA units and the rDNA transgene. Native rDNA units are composed of non-transcribed spacer (NTS) and a transcribed portion that produces the 47S pre-rRNA. The pre-rRNA contains a 5' external transcribed sequence (ETS) and internal transcribed spacers (ITSs), which are removed from the pre-rRNA to generate mature 18S, 5.8S, 2S and 28S rRNAs. Positions of R1 and R2 transposon integration sites in the 28S rRNA are indicated. The 9 Kb transgene contains one complete rDNA unit together with a 28 bp of the 28S rDNA from the upstream unit. The transgene is marked by insertion of a 21 bp unique identification sequence (UID, red bar) into the ETS and inserted using ΦC31-mediated recombination into a common att site on the second chromosome (chr 2L: 1,582,820). (B) rDNA transgene expression is detected by RT-PCR in fly ovaries. RT-PCR amplicon of the UID ETS region is only detected in transgenic but not in wild-type flies or in the absence of reverse transcriptase (-RT). rDNA transgene expression in ovaries was measured by RT-qPCR and normalized to rp49 mRNA. Error bars indicate standard deviation of three biological replicas. Statistical significance is estimated by two-tailed Student’s t-test; ***p<0.001. (C) rDNA transgene expression is detected by HCR-FISH in fly ovaries. Nascent transcripts of the pre-rRNA transgene (arrowhead) were detected in nurse cell nuclei using a probe against the UID sequence (red). Control wild-type flies lack the UID sequence. Scale bar: 5 µm.
Figure 2
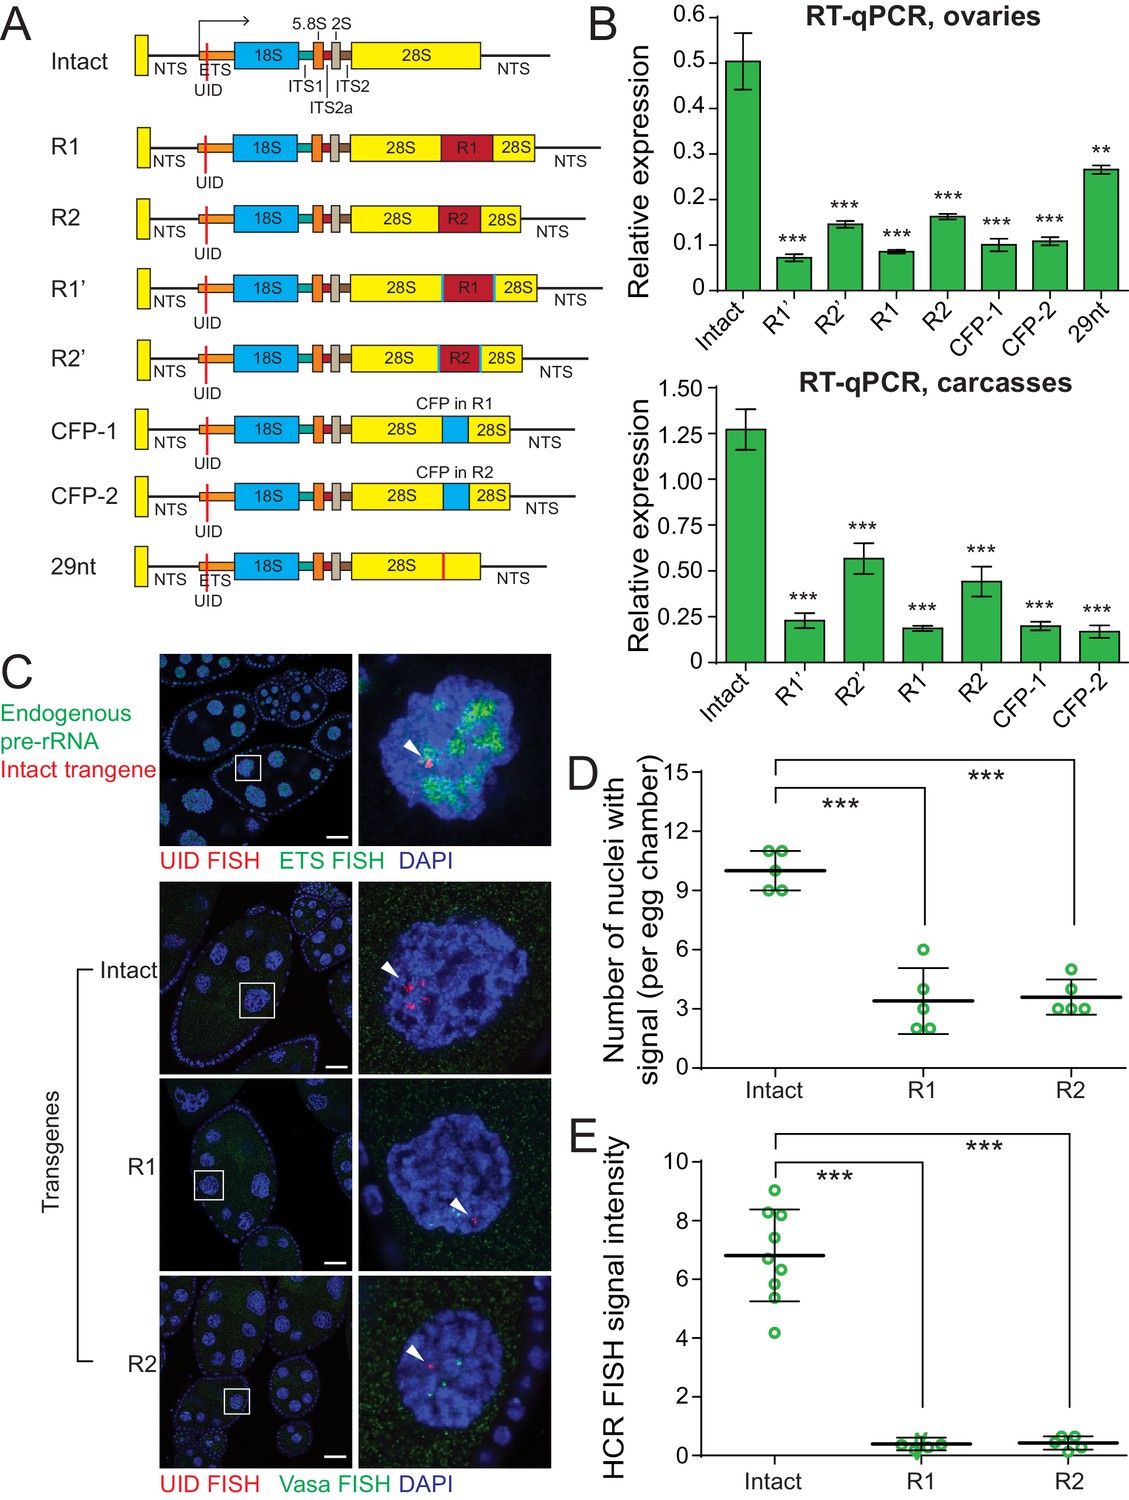
Insertions into 28S rRNA lead to decreased transgene expression.
(A) The scheme of rDNA transgenes. The sequences of R1 and R2 transposons were inserted into their natural integration sites within the 28S rRNA. Transgenes R1’ and R2’ are identical to R1 and R2 transgenes, respectively, but contain second UID flanking retrotransposon sequence. The promotorless CFP sequences were inserted into the same R1 (CFP-1 transgene) and R2 (CFP-1 transgene) integration sites. 29nt sequence was inserted into R2 site. All constructs were integrated into the same genomic att site (chr 2L: 1,582,820) on the second chromosome using ΦC31-mediated recombination. (B) Transgenic rRNA expression is decreased upon insertion of foreign sequence. Expression of rDNA transgenes in ovary (top) and carcasses (bottom) measured by RT-qPCR and normalized to rp49 mRNA. Error bars indicate standard deviation of three biological replicas. Statistical significance is estimated by two-tailed Student’s t-test; ***p<0.001. (C) R1 or R2 insertion decreases transgenic rRNA transcripts as detected by HCR-FISH Endogenous pre-rDNA is detected in stage 7–8 nurse cell nuclei using a probe against ETS (green), while transgenes are detected with probe against the UID (Red). Vasa mRNA is detected as a control (green). Scale bar: 10 µm. (D) Transgenic rDNA is expressed in fewer nuclei upon R1/R2 insertion Shown is the number of nurse cell nuclei with positive HCR-FISH signal per egg chamber (out of 15 nuclei per chamber). Each circle represents data from one egg chamber. Error bars indicate standard deviation from five egg chambers. Statistical significance is estimated by two-tailed Student’s t-test; ***p<0.001. (E) Transgenic rDNA HCR-FISH signal is reduced upon R1/R2 insertion The total intensity of HCR-FISH signal was measured in individual nuclei that have positive signal. Error bars indicate standard deviation from five nuclei. Statistical significance is estimated by two-tailed Student’s t-test; ***p<0.001.
Figure 3 with 1 supplement
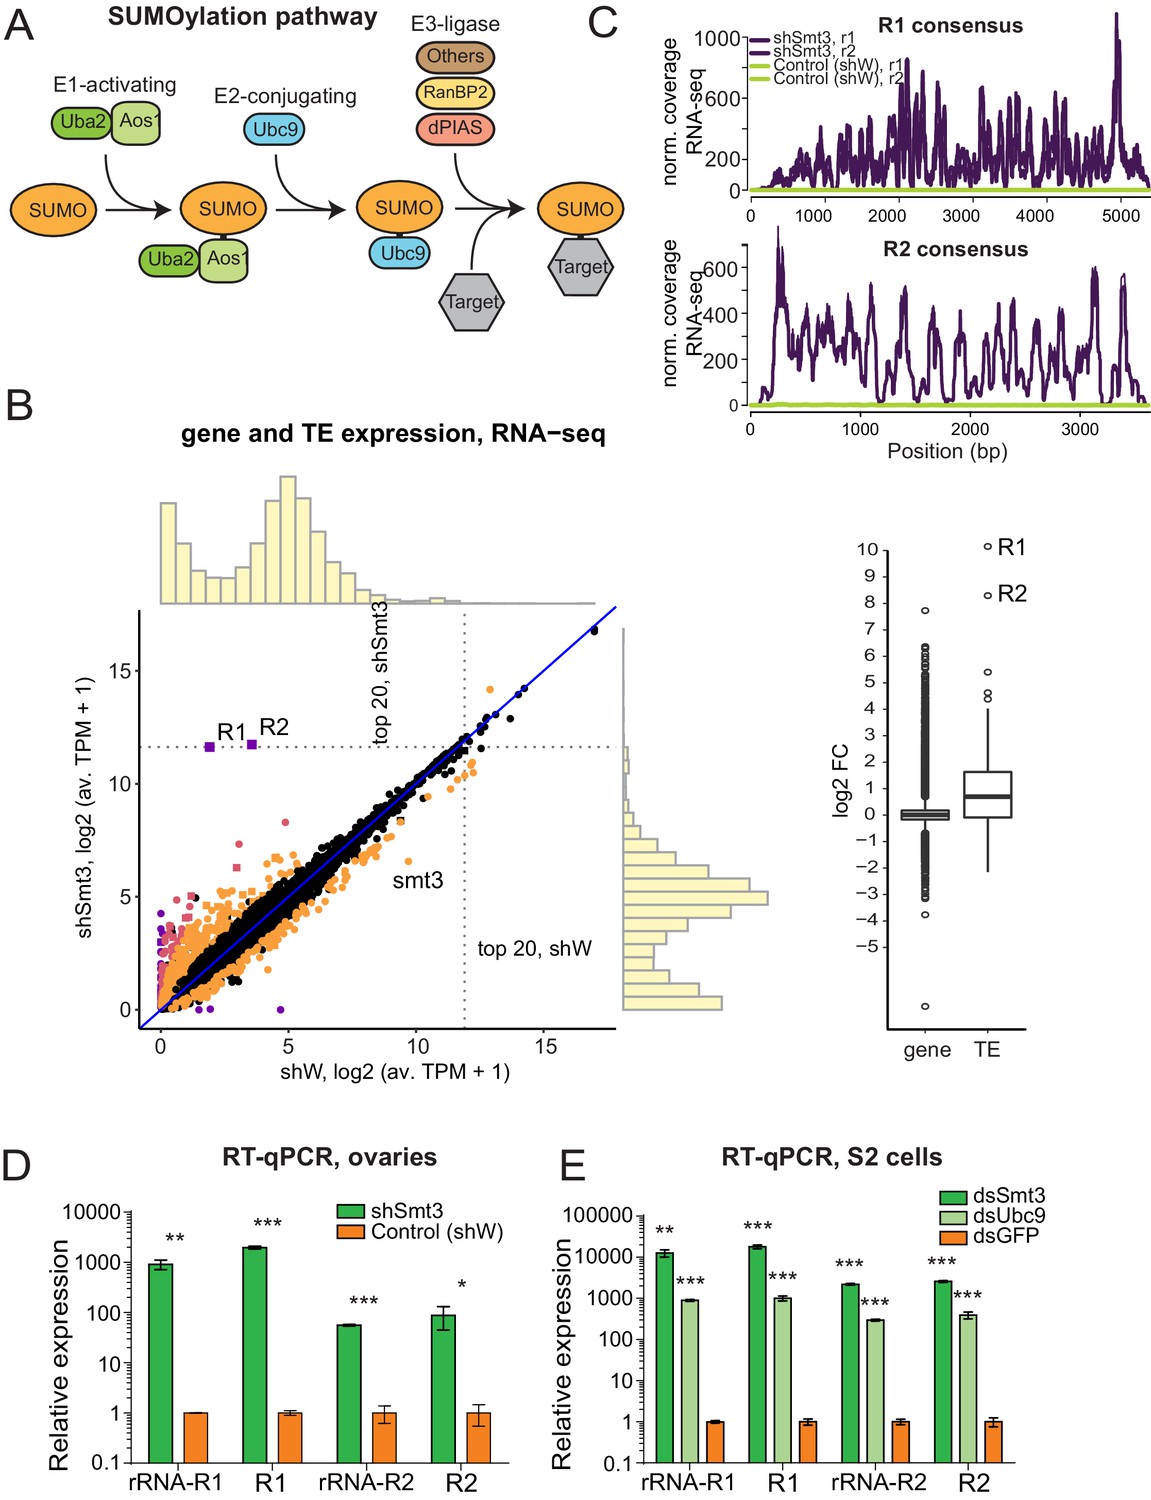
SUMO pathway is required for repression of transposons integrated into rDNA.
(A) Scheme of SUMO pathway. SUMO is activated by E1 enzyme composed of Uba2/Aos1 dimer. Next SUMO is transferred from Aos1 to E2 Ligase Ubc9. Unc9 can directly transfer SUMO to target proteins. SUMOylation of some (but not all) targets require help of the one of several E3 ligases that bring target protein and Ubc9-SUMO into proximity facilitating the transfer of SUMO. (B) Change in genes and transposons expression upon SUMO KD in the ovary. (Left) Gene and transposon expression in RNA-seq data from smt3 KD and control ovaries. Germline-specific knockdown of smt3 was induced by small hairpin driven by maternal-tubulin-Gal4 driver; shRNA against the white gene was used as a control. Genes that change significantly (qval <0.05, LRT test, sleuth [Pimentel et al., 2017]) 2-fold and above are highlighted. R1, R2 transposons and smt3 gene are labelled. (Right) Boxplot shows the distribution of fold changes in smt3 KD versus control ovaries of genes (RefSeq) and transposons (RepBase). Genes with infinite fold change values (zero counts in control ovaries) are not shown. One is added to log2-transformed TPM values to enable the visual display of genes that are not expressed in a given condition. (C-E) SUMO depletion leads to upregulation of R1 and R2 transposons (C) RNA-seq signal coverage along the R1 and R2 consensus sequences (RepBase) from control (shW) and SUMO-depleted (shSmt3) ovaries (r1 and r2 indicate two biological replicates). Data is normalized to total reads mapping to the genome. (D) RT-qPCR analysis of R1 and R2 expression normalized to rp49 mRNA from SUMO-depleted (shSmt3) and control (shW) ovaries. PCR amplicons are within the R1 and R2 sequence (R1 and R2) or spans the junction between the 28S rRNA and the transposon (rRNA-R1 and rRNA-R2). Error bars indicate standard deviation of three biological replicates. Statistical significance is estimated by two-tailed Student’s t-test; *p<0.05, **p<0.01, ***p<0.001. (E) RT-qPCR analysis of R1 and R2 expression normalized to rp49 mRNA in S2 cells upon knockdown of SUMO (dsSmt3), the E2 SUMO ligase Ubc9 (dsUbc9) or control (dsGFP) by double strand RNA. Error bars indicate standard deviation of three biological replicates. Statistical significance is estimated by two-tailed Student’s t-test; **p<0.01, ***p<0.001.
Figure 3—figure supplement 1
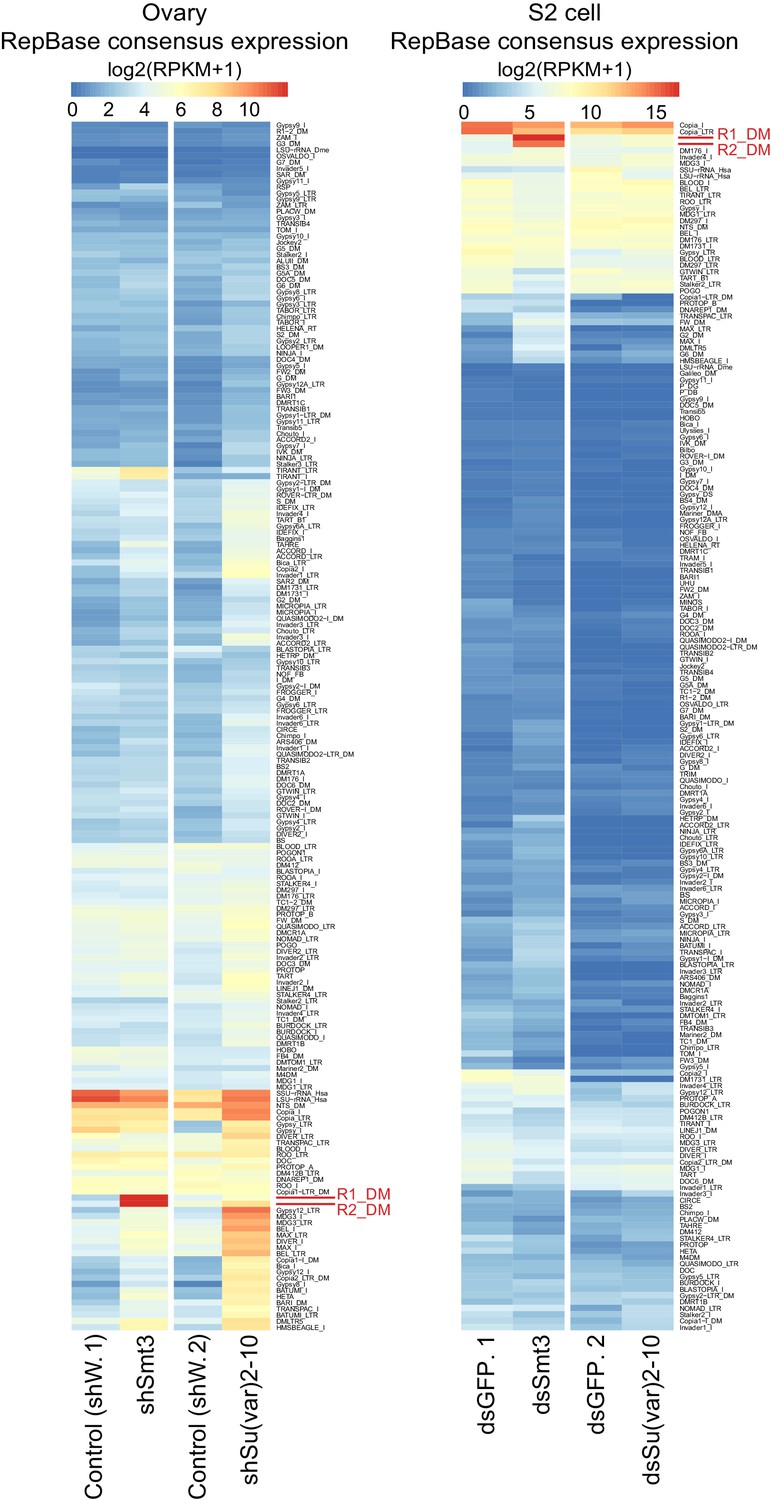
R1 and R2 are strongly up-regulated upon SUMO but not Su(var)2–10 depletion.
Heat maps show RPKM-normalized expression of TE consensuses (RepBase) in SUMO and Su(var)2–10 depleted ovaries (shSmt3 and shSv210) and respective controls (shW) (left) and in SUMO and Su(var)2–10 depleted S2 cells (dsSmt3 and dsSv210) and respective controls (dsGFP) (right). Data is average from two biological replicates. TEs with less than 10 reads in all conditions are excluded. Data is clustered by the maximum distance method.
Figure 4
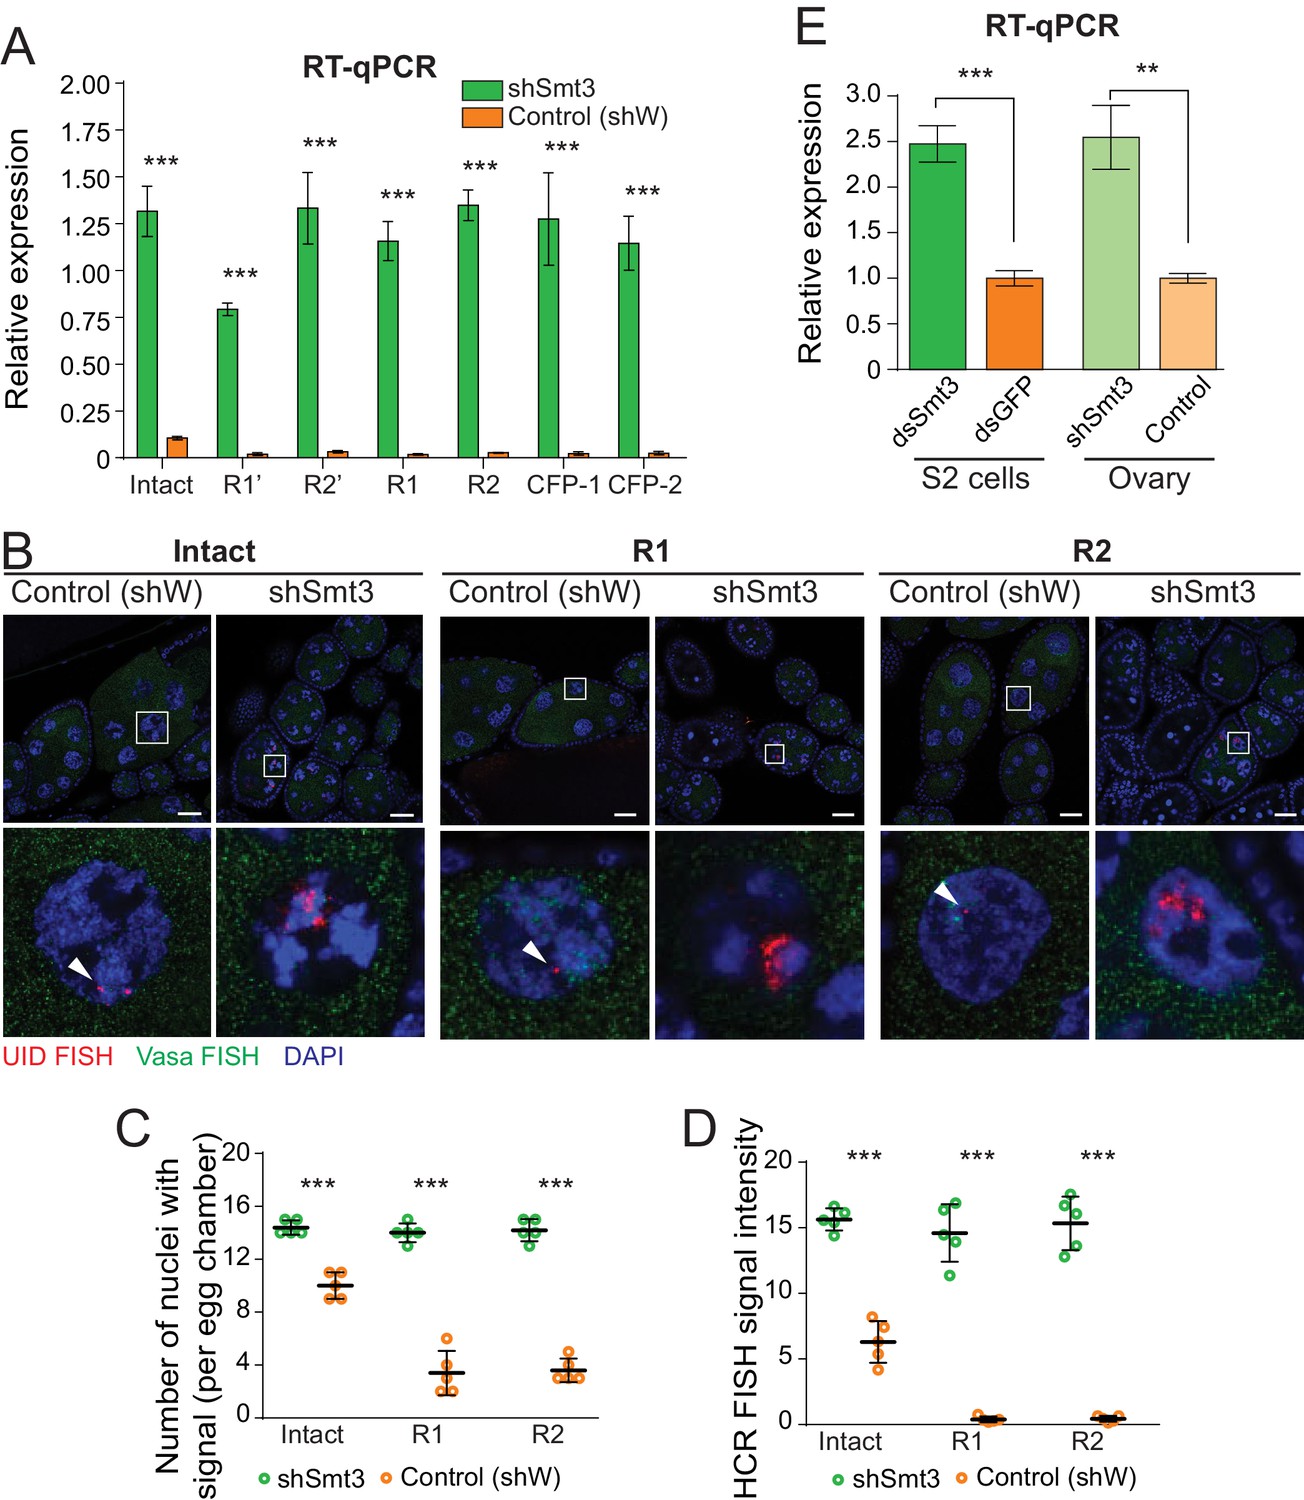
SUMO depletion leads to derepression of both interrupted and intact rDNA transgenes.
(A) SUMO knockdown depresses rDNA transgenes. Expression of rDNA transgenes in ovaries as measured by RT-qPCR upon germline knockdown of SUMO (shSmt3) and in control (shW). Data shows three biological replicates normalized to rp49 mRNA. Error bars indicate standard deviation of xxxx biological replicates. Statistical significance is estimated by two-tailed Student’s t-test; ***p<0.001. (B) Transgenic pre-rRNA expression is repressed by SUMO as detected by HCR-FISH Expression of rDNA transgenes in nurse cells is detected upon germline-specific knockdown of SUMO (shSmt3) or control (shWhite) gene using a probe against the UID sequence (Red). Vasa mRNA (green) is detected in parallel. Scale bar: 10 µm. Bottom row shows magnification of individual boxed nuclei. (C) rDNA transgenes are expressed in more nuclei upon SUMO KD as detected by HCR-FISH Shown is the number of nurse cell nuclei with positive HCR-FISH signal per egg chamber (out of 15 nuclei per stage 7/8 chamber). Each circle represents data from one egg chamber. Both intact and interrupted transgenes are expressed in all nuclei upon SUMO knockdown. Error bars indicate the standard deviation of 5 egg chambers. Statistical significance is estimated by two-tailed Student’s t-test; ***p<0.001. (D) Transgenic rDNA HCR-FISH signal is increased upon SUMO KD The total intensity of HCR-FISH signal was measured in individual nuclei that have positive signal. Error bars indicate the standard deviation of 5 nuclei. Statistical significance is estimated by two-tailed Student’s t-test; ***p<0.001. (E) SUMO knockdown increases pre-rRNA expression. Expression of pre-rRNAs were measured by RT-qPCR using primers that target ETS region normalized to rp49 mRNA. Germline-specific knockdown of SUMO (shSmt3) or control (shW) gene was induced by small hairpin driven by maternal-tubulin-Gal4 driver. In S2 cells, knockdown of SUMO (dsSmt3) or control (dsGFP) was induced by double stranded RNA. Error bars indicate the standard deviation of three biological replicates. Statistical significance is estimated by two-tailed Student’s t-test; **p<0.01, ***p<0.001.
Figure 5 with 1 supplement
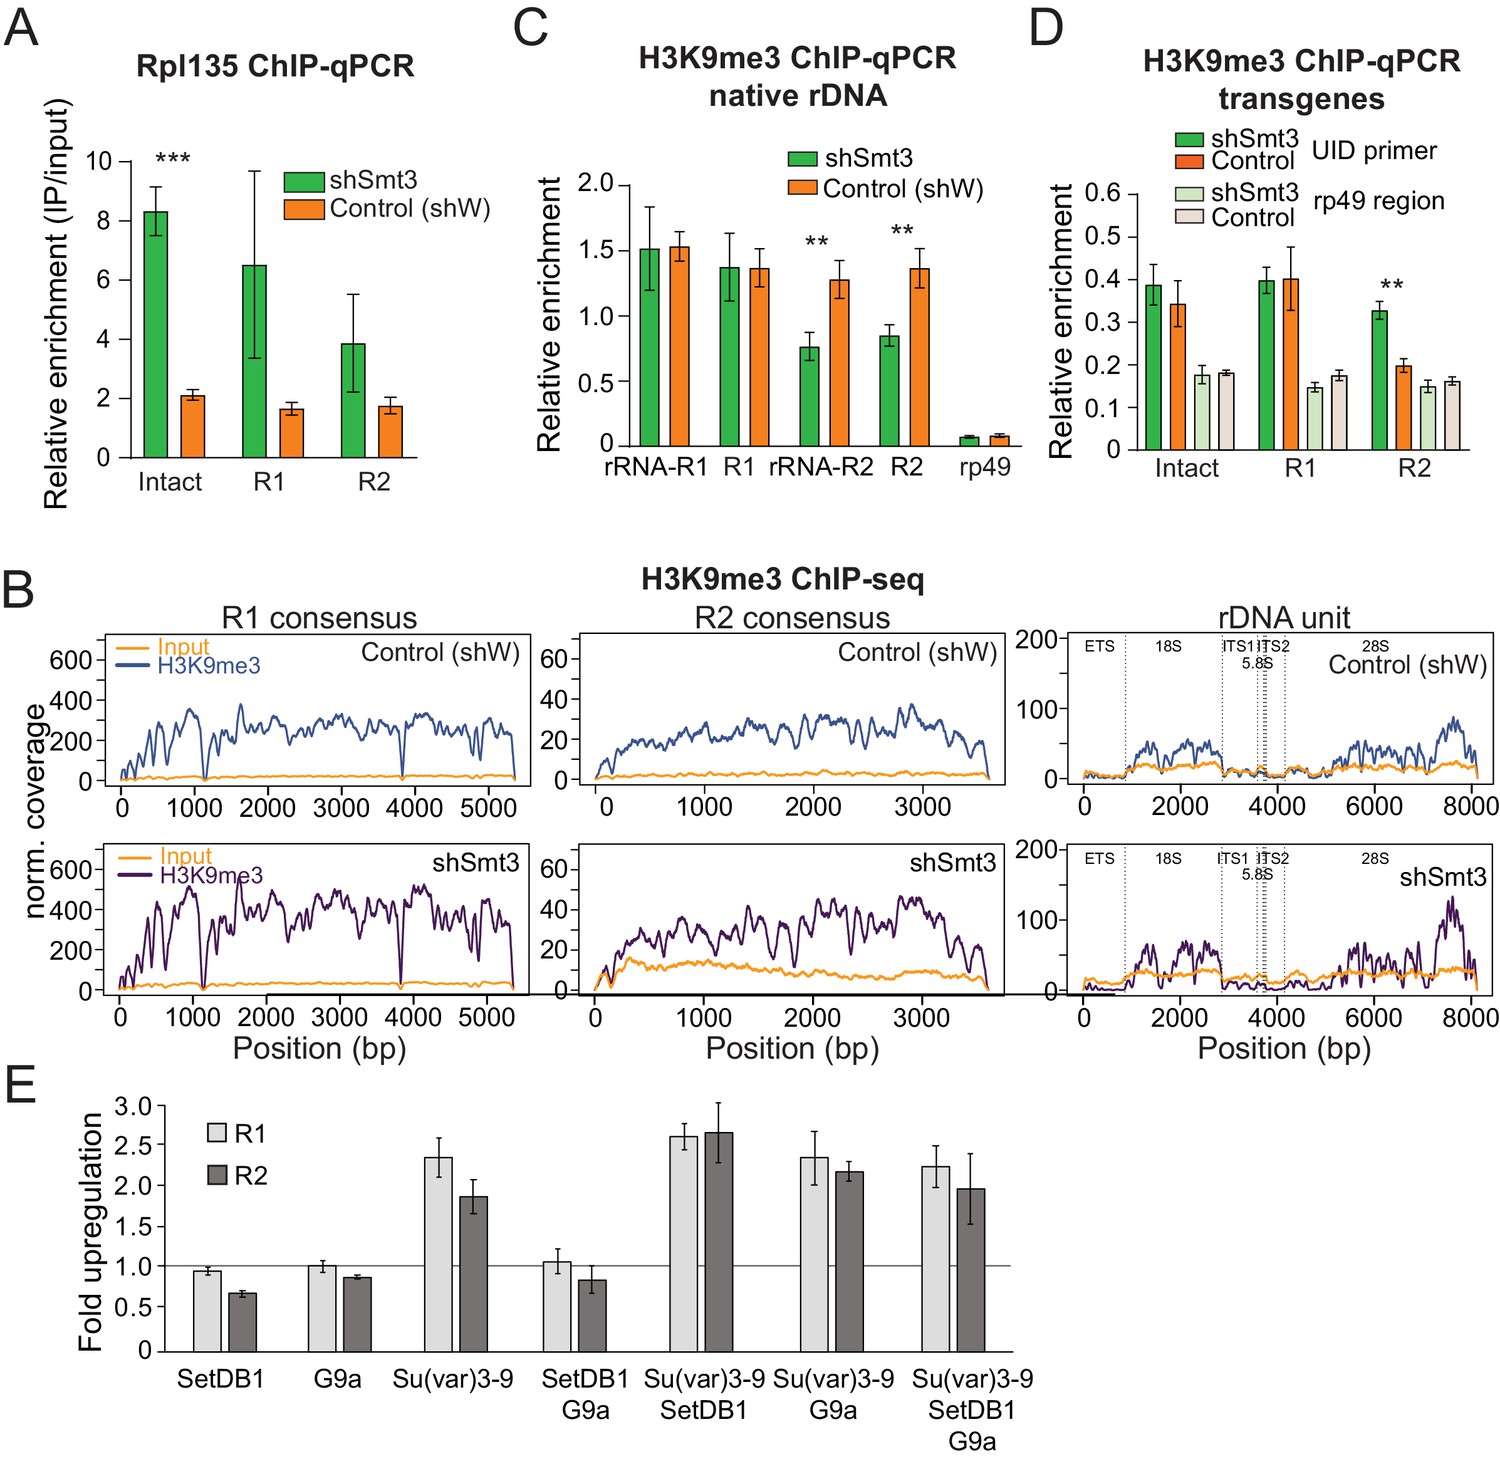
SUMO KD does not affect H3K9me3 enrichment over rDNA and R1/R2.
(A) Pol I occupancy increases over rDNA transgenes upon SUMO KD Germline-specific knockdown of SUMO (shSmt3) or control (shW) gene was induced by small hairpin driven by maternal-tubulin-Gal4 driver. ChIP of Rpl135-GFP using a GFP antibody for pull-down was followed by qPCR analysis using UID-specific primers. Data were normalized using a sequence mapping to a gene-poor region. Error bars indicate standard deviation of three biological replicates. Statistical significance is estimated by two-tailed Student’s t-test; ***p<0.001. (B-C) H3K9me3 enrichment over native rDNA and the R1 and R2 transposons sequences is unaffected by SUMO KD. Germline knockdown was induced by small hairpin driven by maternal-tubulin-Gal4 driver (B) H3K9me3 ChIP-seq signal and corresponding input coverage across the R1 and R2 consensus sequences (RepBase), and the rDNA unit (Stage and Eickbush, 2007) from control (shW) and SUMO-depleted (shSmt3) ovaries. Data is normalized to total reads mapping to the genome. (C) H3K9me3 ChIP-qPCR using primers to native 28S rDNA interrupted with R1 and R2 insertions as in Figure 3D. ChIP to input enrichment is normalized to the region that has high level of H3K9me3 mark (chr2R: 4,141,405–4,141,502). Error bars indicate the standard deviation of three biological replicates. Statistical significance is estimated by two-tailed Student’s t-test; **p<0.01. (D) H3K9me3 mark measured on rDNA transgenes by ChIP-qPCR. H3K9me3 ChIP-qPCR analysis of rDNA transgenes in control (shW) and SUMO-depleted (shSmt3) ovaries using primers to the UID sequence and RP49 (control region), normalized to H3K9me3-enriched region (chr2R: 4,141,405 ~ 4,141,502). Error bars indicate the standard deviation of three biological replicates. Statistical significance is estimated by two-tailed Student’s t-test; **p<0.01. (E) Impact of knock-down of H3K9 methyltransferases on R1 and R2 expression. Three H3K9 methyltransferases were depleted in S2 cells using RNAi individually and in combination. Expression of R1 and R2 transposons was measured by RT-qPCR and normalized to rp49 mRNA. Shown is fold upregulation of R1 and R2 expression upon knock-down compared to control (double-stranded RNA against eGFP gene). Expression levels were measured in three biological replicates. Statistical significance is estimated by two-tailed Student’s t-test; *p<0.05, **p<0.01, ***p<0.001. Information about efficiency of RNAi KD is shown in Supplementary file 4.
Figure 5—figure supplement 1
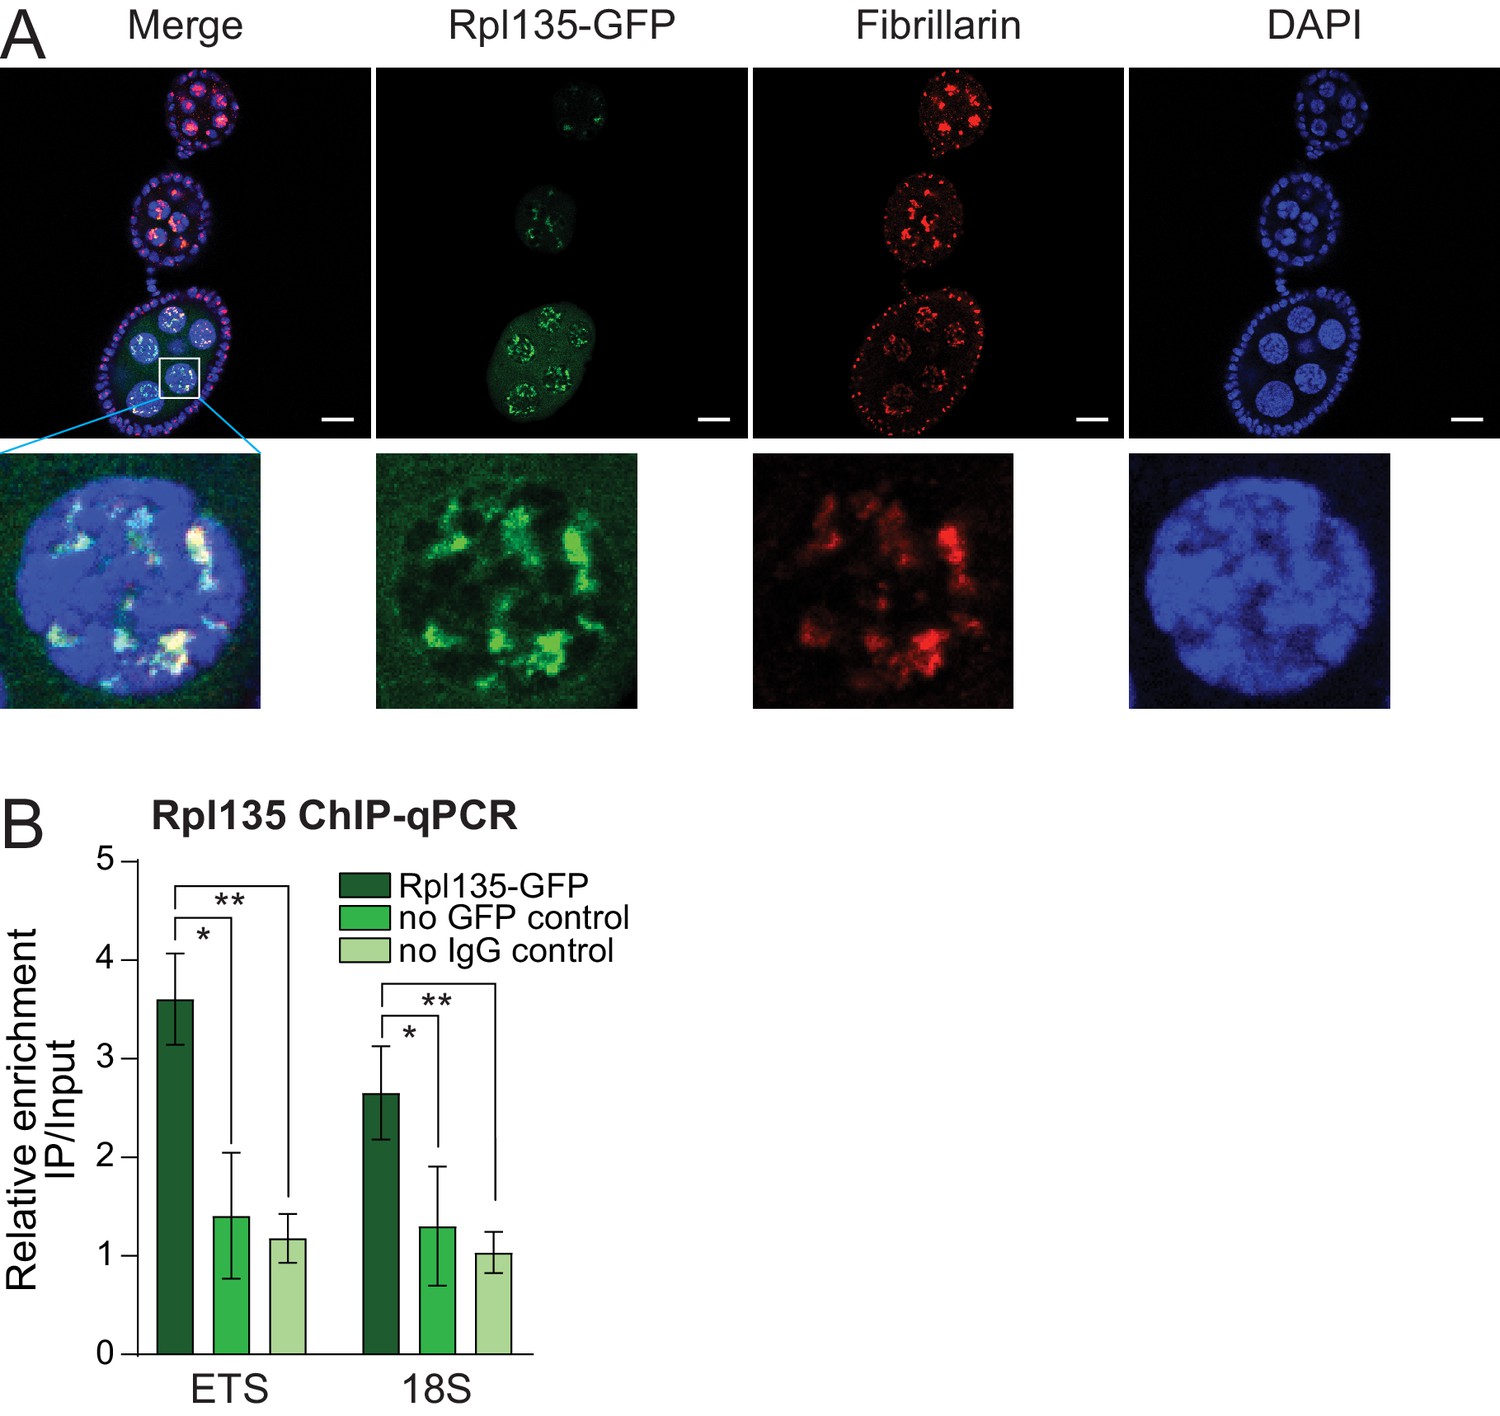
Validation of Rpl135-GFP expression, localization in the nucleolus and binding to rDNA.
(A) Rpl135-GFP localizes to the nucleolus. Rpl135-GFP (green) and nucleolus marker Fibrillarin IF (red) show co-localized in nurse cells of the fly ovary. Scale bar: 10 µm. (B) Rpl135-GFP ChIP-qPCR. Fold enrichment of Rpl135-GFP as measured on ETS and 18S of endogenous rDNA in ovaries by ChIP-qPCR normalized using a sequence mapping to a gene-poor region kalahari. Error bars indicate standard deviation of three biological replicates. Statistical significance is estimated by two-tailed Student’s t-test; *p<0.05, **p<0.01.
Figure 6
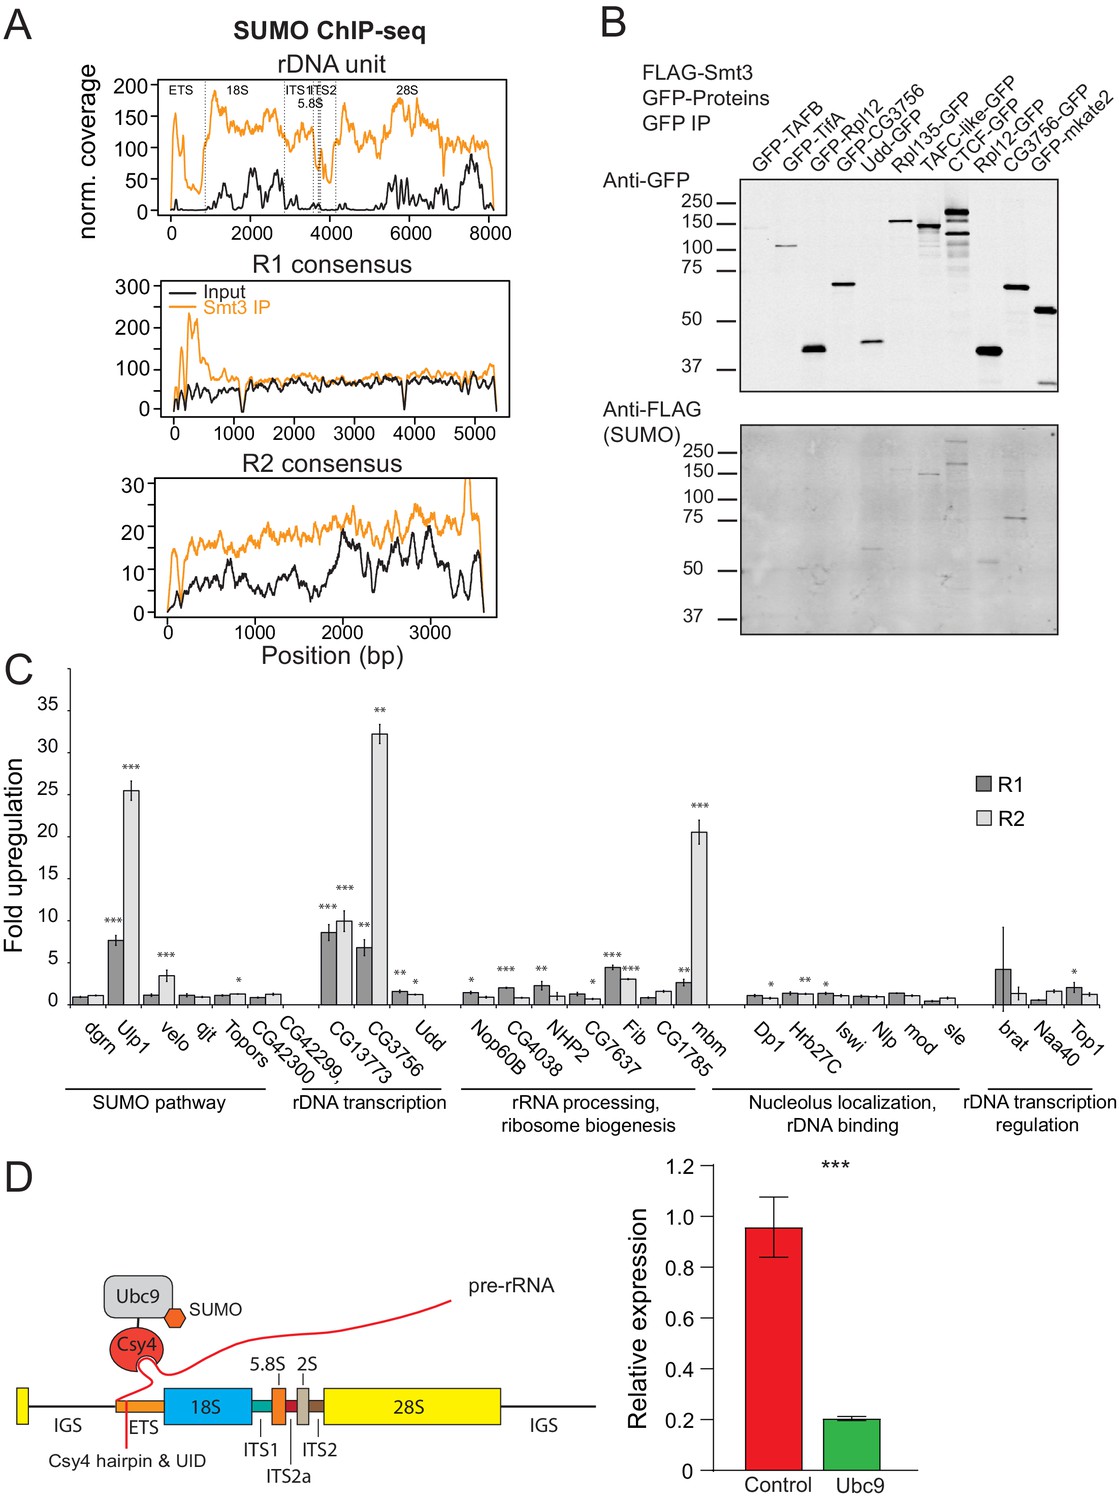
SUMOylated proteins.
(A) SUMO ChIP-seq profile on rDNA and R1 and R2 consensus sequences. SUMO ChIP-seq signal over the R1 and R2 consensuses and the rDNA unit as in (4A). ChIP-seq data is from Gonzalez et al., 2014. (B) SUMOylation of proteins involved in rDNA transcription and nucleolar function. GFP-tagged proteins were co-expressed with FLAG-SUMO in S2 cells. SUMOylation was detected after immunoprecipitation with anti-GFP antibodies. Several proteins were tagged at either N- or C-terminus. In case of CG3756, only C-terminally tagged protein appears to be SUMOylated. (C) RNAi screen for genes involved in R1 and R2 repression in S2 cells. After knock-down of gene expression using RNAi expression of R1 and R2 transposons was measured by RT-qPCR and normalized to rp49 mRNA. Shown is fold upregulation of R1 and R2 expression upon knock-down compared to control (double-stranded RNA against eGFP gene). Expression levels were measured in three biological replicates. Statistical significance is estimated by two-tailed Student’s t-test; *p<0.05, **p<0.01, ***p<0.001. Information about genes and efficiency of RNAi KD is shown in Supplementary file 4. (D) Tethering of E2 SUMO ligase Ubc9 suppresses rDNA transgene. (Left) The scheme of tethering experiment. The rDNA transgene was modified by insertion of binding site for Csy4 RNA-binding protein into ETS. E2 SUMO ligase Ubc9 was fused with Csy4 protein and co-expressed with rDNA transgene. (Right) The results of RT-qPCR analysis of rDNA transgene expression upon Ubc9 tethering.
Additional files
-
Supplementary file 1
Drosophila melanogaster stocks.
- https://cdn.elifesciences.org/articles/52416/elife-52416-supp1-v2.docx
-
Supplementary file 2
Primers.
- https://cdn.elifesciences.org/articles/52416/elife-52416-supp2-v2.docx
-
Supplementary file 3
Cellular component (CC) GO analysis of SUMOylated proteins identified in S2 cells.
The table shows results from GO enrichment analysis for the cellular component on SUMOylated proteins identified by Handu et al., 2015, performed using the enrichGO function of the clusterProfiler package (Yu et al., 2012).
- https://cdn.elifesciences.org/articles/52416/elife-52416-supp3-v2.xlsx
-
Supplementary file 4
RNAi screen for genes involved in R1 and R2 repression in S2 cells For each gene the information column describes it known or predicted function and nucleolus localization.
Association with GO term ‘nucleolus’ (GO:0005730) and its child terms is shown according to Gene Ontology analysis. The presence of SUMOylation motif(s) was indicates the presence of consensus SUMOylation sequence (ψKxE/D) in protein sequence. Expression of R1 and R2 transposons were measured by RT-qPCR in S2 cells after knock-down using double-stranded RNA using primers listed in Supplementary file 2. Shown is fold change in R1 and R2 levels upon knock-down of corresponding gene compared to control KD (double-stranded RNA against eGFP gene). Knockdown efficiency shows the depletion of target gene as measured by RT-qPCR. Expression levels were measured in three biological replicates and normalized to rp49 mRNA. Statistical significance is estimated by two-tailed Student’s t-test; *p<0.05, **p<0.01, ***p<0.001.
- https://cdn.elifesciences.org/articles/52416/elife-52416-supp4-v2.docx
-
Supplementary file 5
Numerical data from RNA-seq analysis by sleuth.
- https://cdn.elifesciences.org/articles/52416/elife-52416-supp5-v2.xlsx
-
Transparent reporting form
- https://cdn.elifesciences.org/articles/52416/elife-52416-transrepform-v2.pdf
Download links
A two-part list of links to download the article, or parts of the article, in various formats.
Downloads (link to download the article as PDF)
Open citations (links to open the citations from this article in various online reference manager services)
Cite this article (links to download the citations from this article in formats compatible with various reference manager tools)
Repression of interrupted and intact rDNA by the SUMO pathway in Drosophila melanogaster
eLife 9:e52416.
https://doi.org/10.7554/eLife.52416


