Sound exposure dynamically induces dopamine synthesis in cholinergic LOC efferents for feedback to auditory nerve fibers
- The Johns Hopkins University School of Medicine, United States
- College of Pharmacy and Natural Medicine Research Institute, Mokpo National University, Republic of Korea
Figures
Figure 1
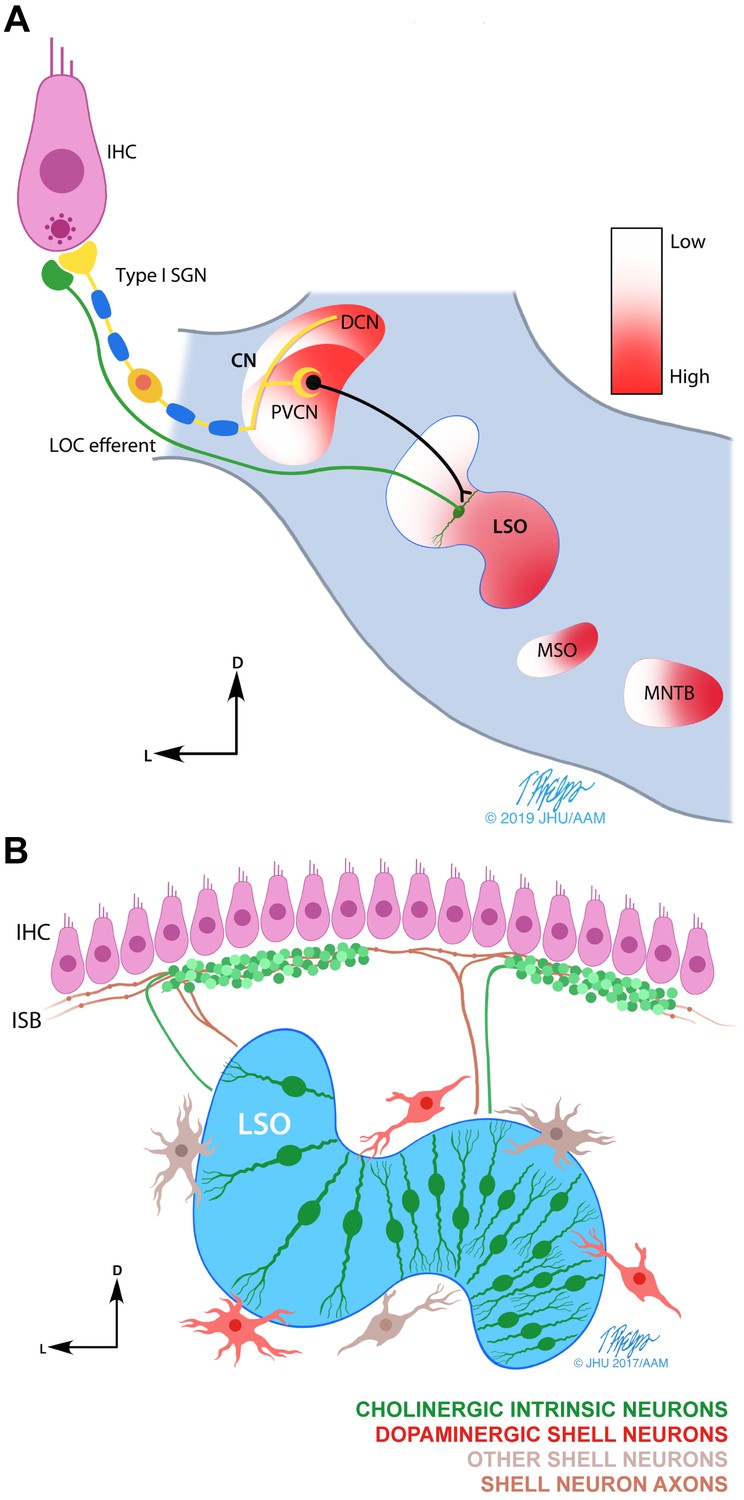
Schematic drawings of the LOC efferent system.
(A) Line drawing illustrating the postulated LOC acoustic reflex (Guinan, 2011). The inner hair cell (IHC) transmits the sound signal via auditory nerve fibers (ANFs) and via the posteroventral subdivision of the cochlear nucleus (PVCN) to the lateral olivocochlear (LOC) neurons in and around the lateral superior olive (LSO) (Thompson and Thompson, 1991). LOC efferents signal back to the cochlea to the ANFs endings directly under the IHCs. The tonotopic frequency map (from low to high) found in the cochlea, is also present in multiple auditory brainstem nuclei (shown in color gradient). Other nuclei within the superior olivary complex: medial superior olive (MSO) and medial nucleus of the trapezoid body (MNTB). (B) Illustration summarizing the current understanding of the anatomy and neurochemistry of LOC intrinsic and shell neurons in mice (modified from Warr et al., 1997). LOC intrinsic neurons reside within the LSO, whereas LOC shell neurons are located on the outskirts of the LSO. Intrinsic neuron axons cover a short distance along the inner spiral bundle (ISB) and form dense bouton terminals. Shell neuron axons usually bifurcate and cover an extensive distance along the cochlear spiral with en passant swellings. In mice, LOC intrinsic neurons have been shown to be cholinergic (Maison et al., 2003), while a separate group of LOC shell neurons has been shown to be dopaminergic (Darrow et al., 2006b). The higher density of intrinsic neurons in the high frequency region of the LSO is based on studies in guinea pig and rat (Kaiser et al., 2011; Radtke-Schuller et al., 2015; Warr et al., 1997).
© 2019 Tim Phelps, JHU AAM. Illustrations in panels A and B: Tim Phelps © 2019 JHU AAM (Department of Art as Applied to Medicine, Johns Hopkins University School of Medicine), published with permission. These illustrations are not covered by the CC-BY 4.0 licence and may not be separated from the article.
Figure 2 with 1 supplement
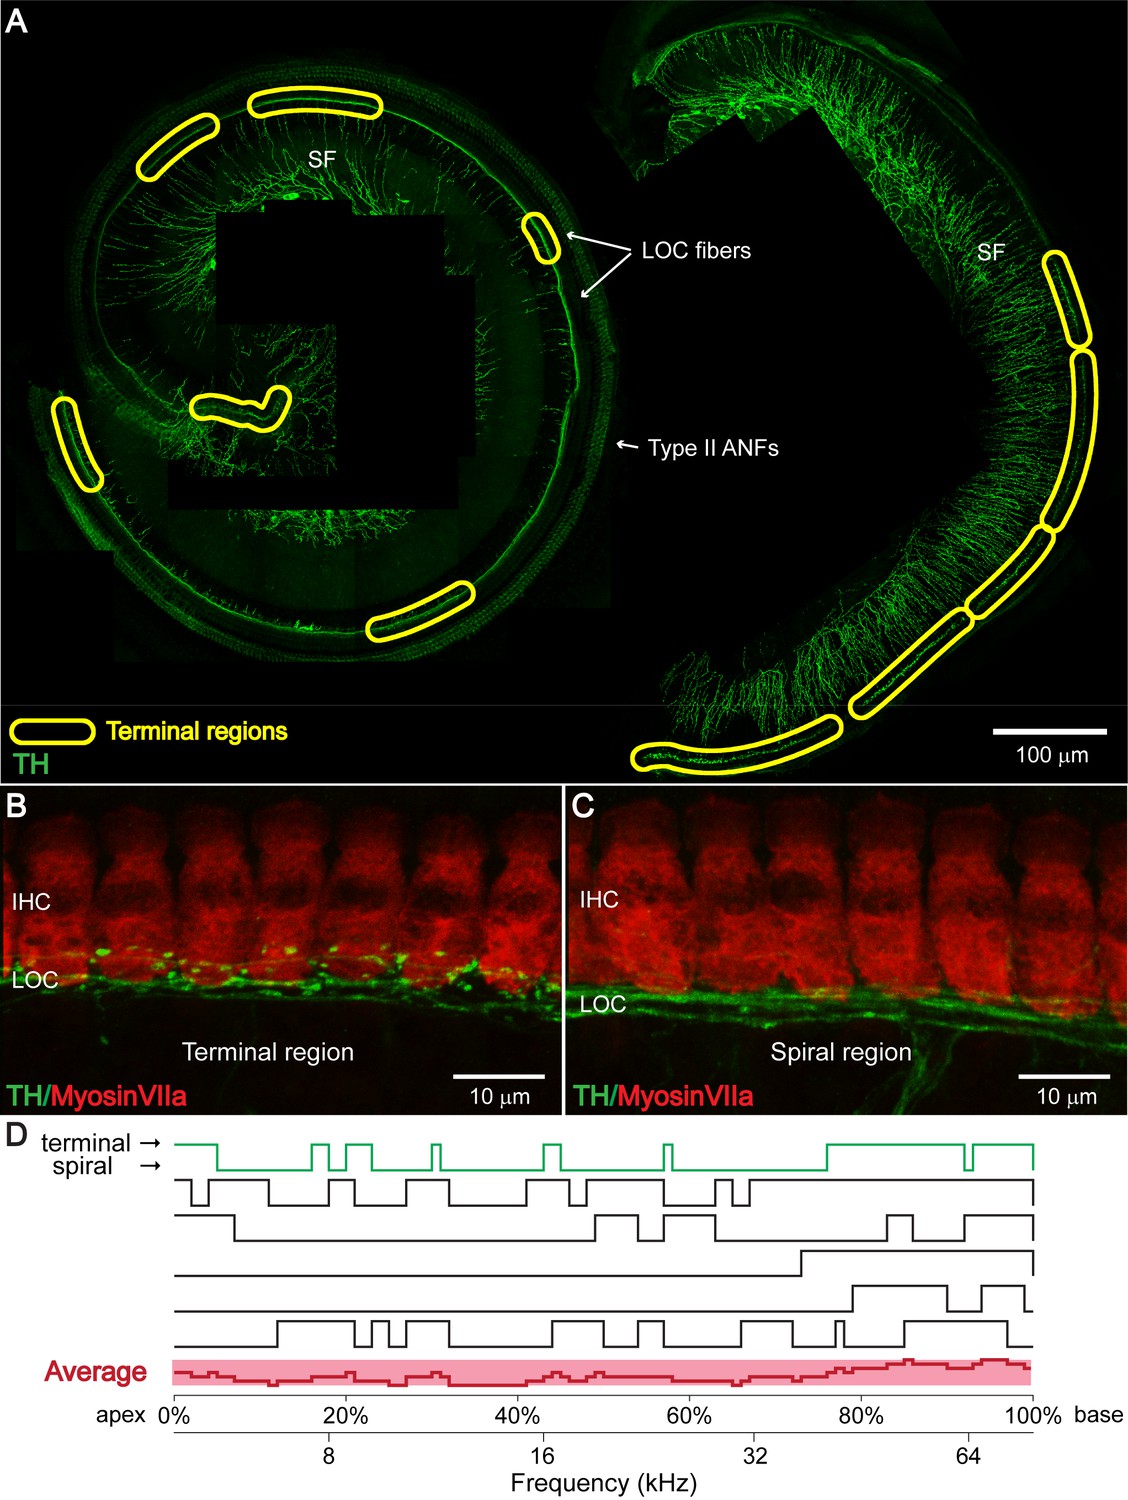
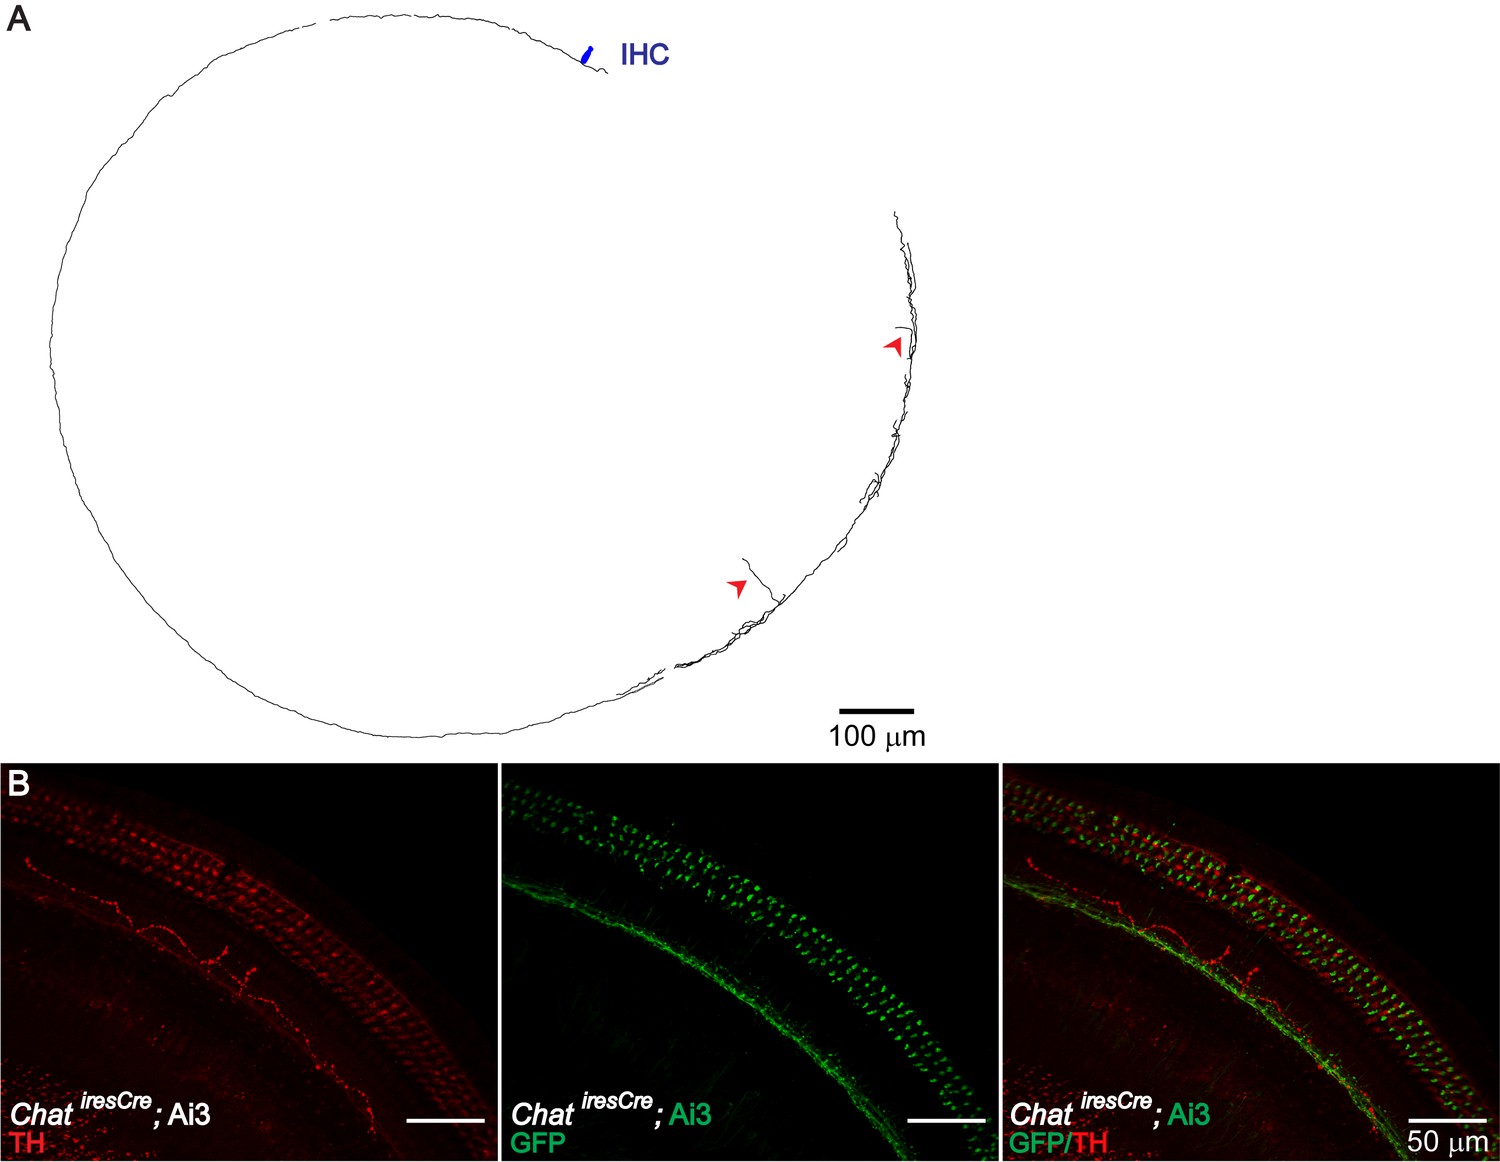
TH+ LOC efferent bouton endings appear in patches at seemingly random locations along the cochlear frequency axis.
(A) TH immunostaining in a one-month-old cochlear whole mount preparation (left: apical half; right: basal half). Bundles of TH+ LOC efferent fibers (LOC fibers) run underneath the IHCs along the whole cochlear spiral, either with only a few swellings in ‘spiral regions’, or in patches with many bouton endings in ‘terminal regions’, as marked by yellow circles. TH also labels type II auditory nerve fibers (Type II ANFs) and sympathetic fibers (SFs). (B and C) Representative higher magnification images of a ‘terminal region’ and of a ‘spiral region’ in a 3-week-old cochlea. IHCs and dopaminergic LOC fibers are immunolabeled with Myosin VIIa and TH antibodies respectively. (D) Line plots along cochlear coil for six 1–3 months old cochleas indicating TH+ efferent terminal regions (upper line) and spiral regions (lower line). Line plot for the representative cochlea shown in (A) is colored green. The average line plot for the six cochleas is shown in red at the bottom. The upper x-axis represents the linear distance along the cochlear spiral (with 0% at the apex and 100% at the base). The lower x-axis relates cochlear spiral location to ANF characteristic frequency. See also Figure 2—figure supplement 1.
Figure 2—figure supplement 1
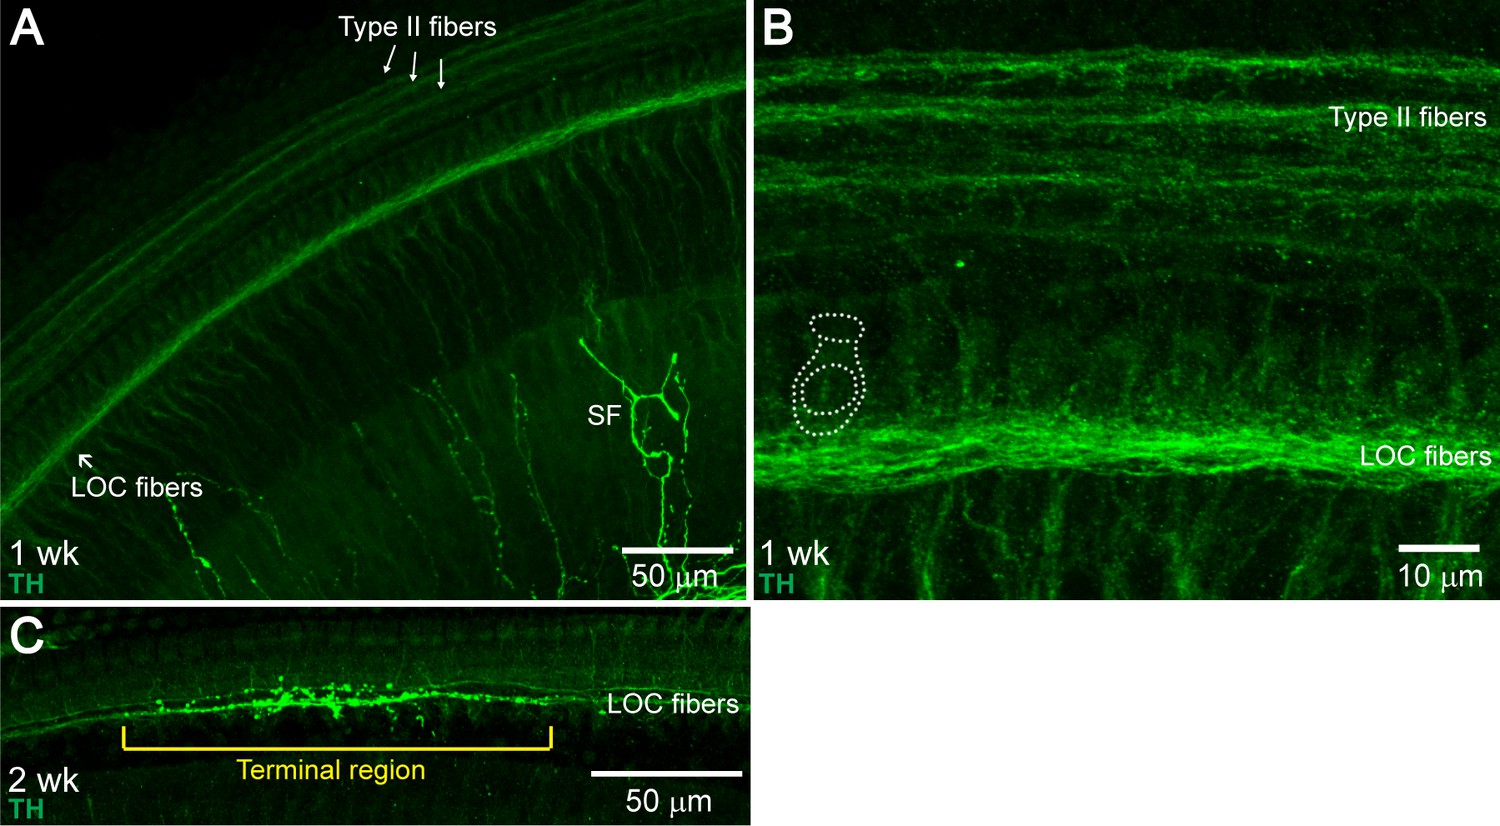
Developmental Changes in TH+ LOC Fiber Innervation Pattern.
The mature TH+ LOC fiber innervation pattern was established between postnatal weeks 1–3. In one-week-old cochleas, TH+ fibers were found in the ISB throughout the whole cochlear spiral, but no terminal regions were observed (A and B) (n = 3 cochleas, two mice). At two weeks, around the onset of hearing (Song et al., 2006), terminal regions could be observed occasionally, mostly in the base (C) (n = 3 cochleas, two mice). At three weeks, the innervation pattern included terminal and spiral regions, similar to 1–3 month-old young adult cochleas (n = 3 cochleas, three mice, data not shown). (A) An apical cochlear segment from a one-week-old C57BL/6J wildtype mouse immunolabled against TH, demonstrating TH+ LOC fiber bundles at the ISB region. TH immunostaining also labeled type II fibers (arrows) and sympathetic fibers (SF). (B) A higher magnification image of an apical region from the same mouse as in (A), demonstrating the TH+ LOC fibers running underneath the IHCs. One IHC is outlined with dotted lines. (C) A basal cochlear segment from a two-week-old C57BL/6J wildtype mouse immunolabeled with TH. A TH+ terminal region is identified with a bracket.
Figure 3 with 2 supplements
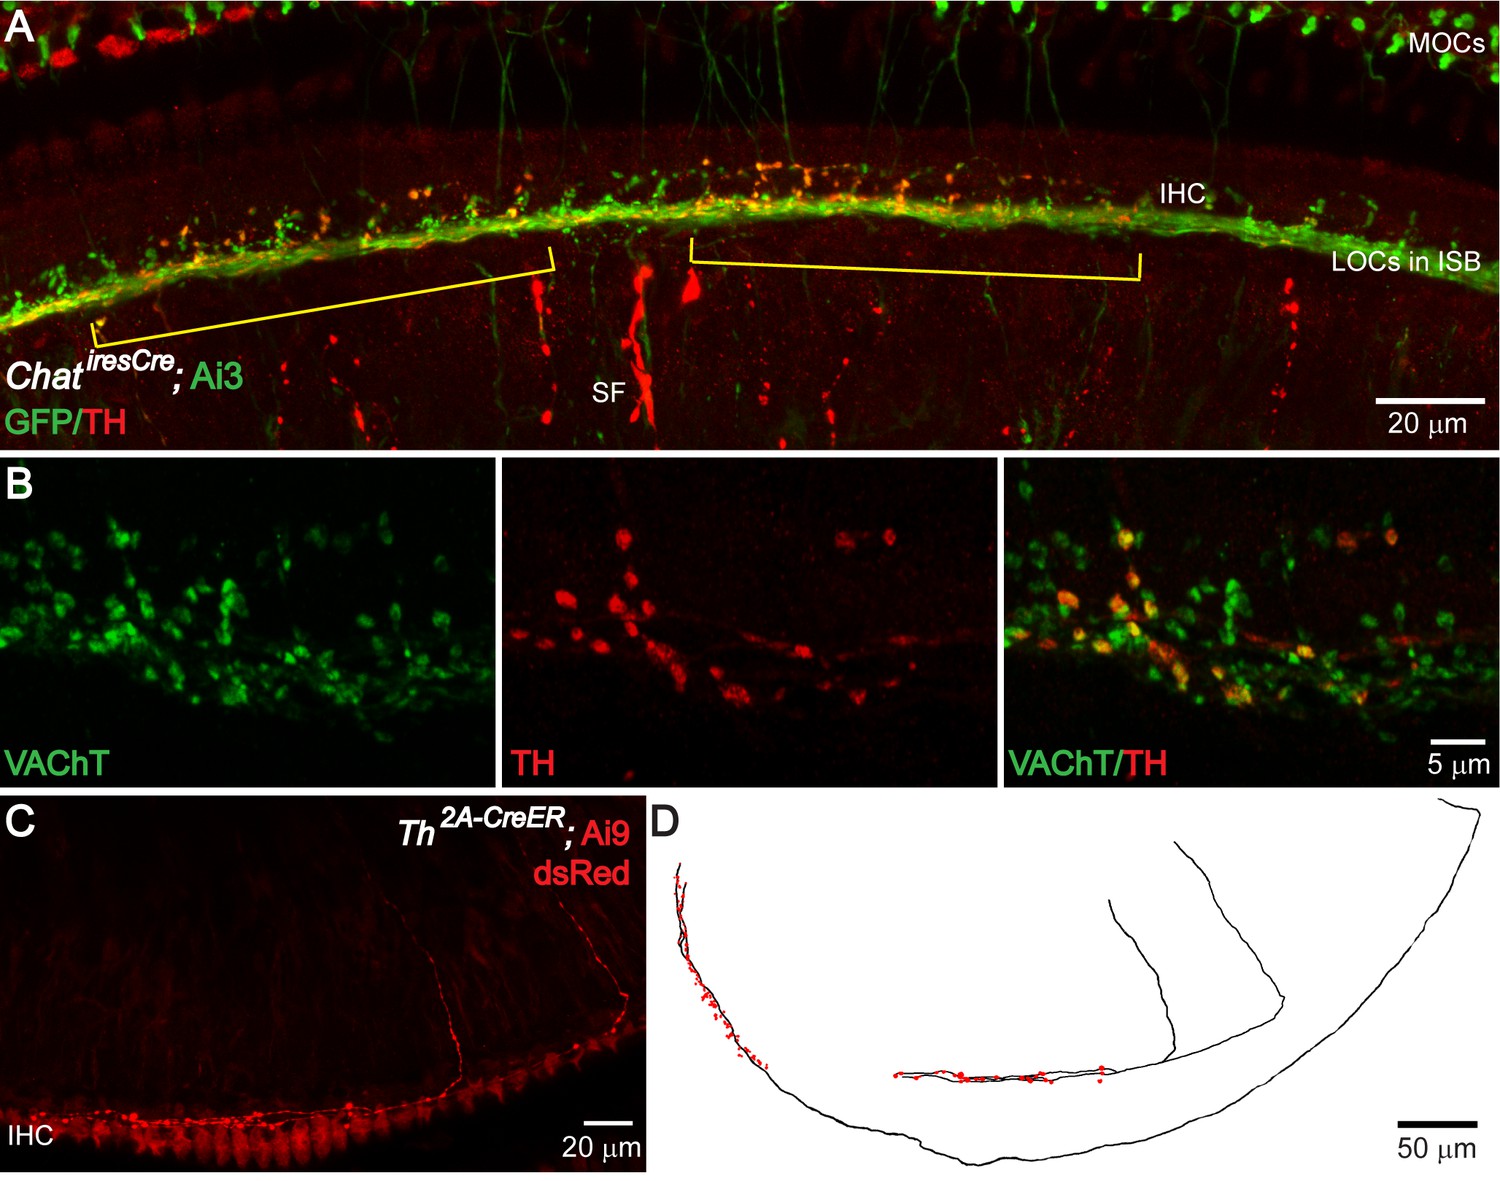
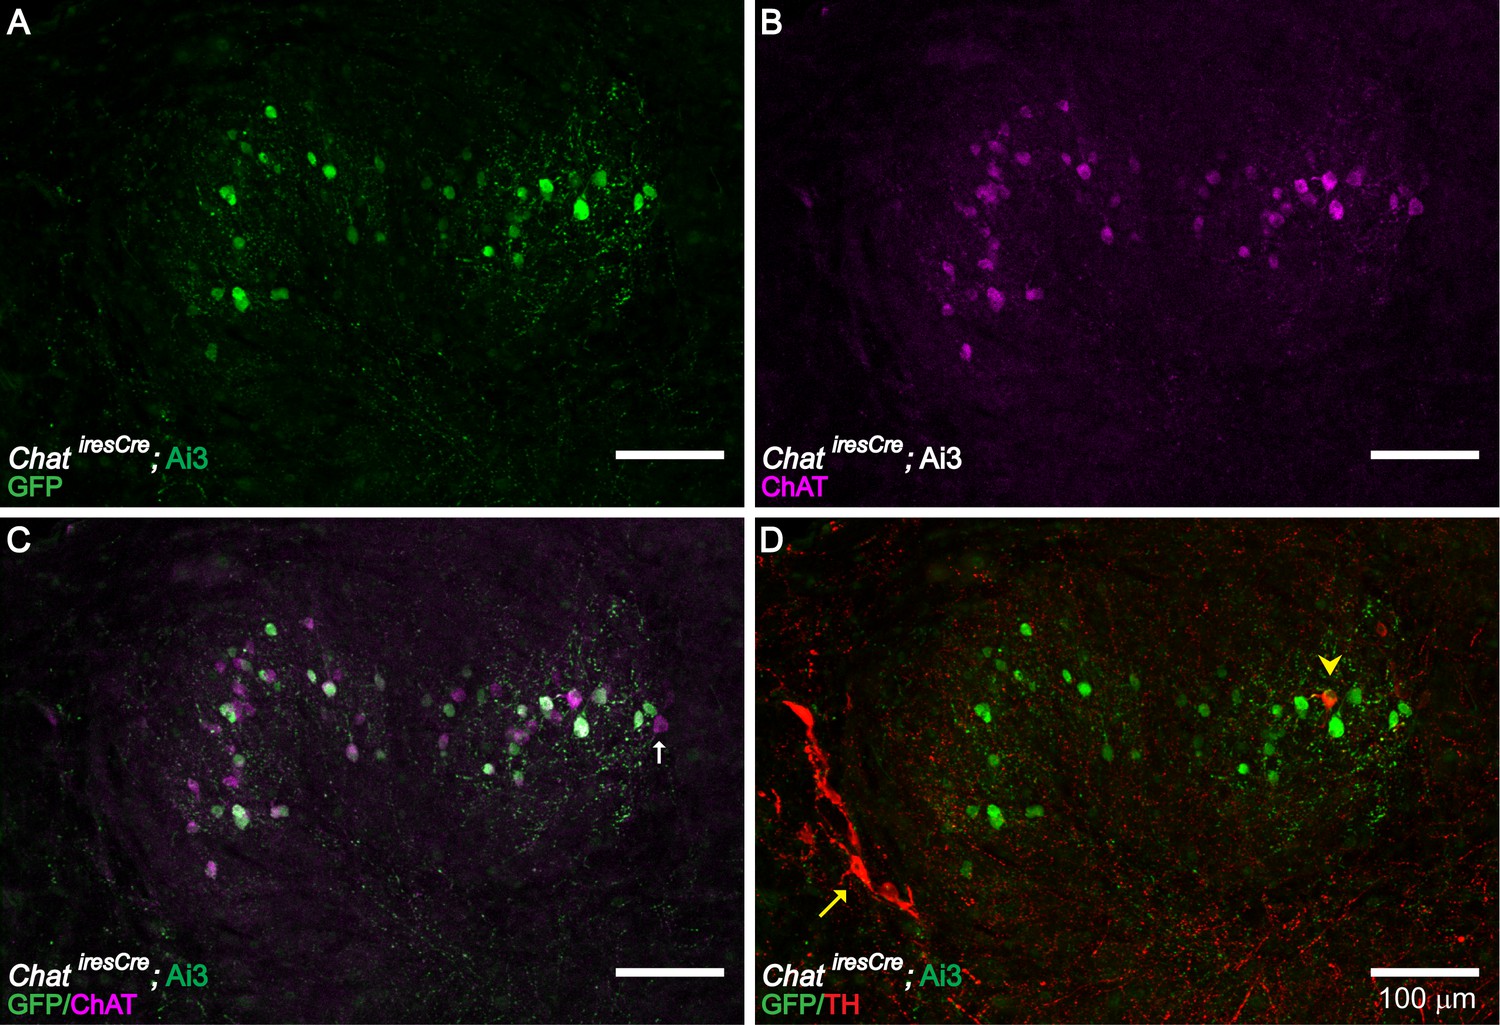
TH+ terminal patches are formed by a subset of cholinergic LOC intrinsic neurons that also express TH.
(A) A segment of the cochlea epithelium from a ChatiresCre; Ai3 mouse that labels cholinergic LOC efferents. Reporter protein EYFP is detected by an antibody against GFP. Cholinergic LOC fibers are found along the inner spiral bundle (ISB), under and around the IHCs. Cholinergic medial olivocochlear (MOCs) efferent fibers are found in the ISB and in the outer hair cell region. Co-labeling with TH immunostaining shows two patches of TH+ terminals (brackets) that overlap with a subset of the cholinergic terminals. TH also labels sympathetic fibers (SF). (B) Co-immunolabeling of TH and VAChT in the ISB of a wildtype mouse cochlea. A subset of VAChT-positive terminals are co-labeled with TH. (C) Two TH+ fibers with the characteristic morphology of LOC intrinsic neurons are shown in the cochlea of a 7-week-old old Th2a-CreER; Ai9 mouse with tamoxifen injection between 3–6 weeks of age (see Materials and methods). (D) Reconstruction of three sparsely labeled TH+ LOC neurons that show intrinsic neuron characteristics (axons in black; terminals in red). Two of the reconstructed fibers are shown in (C). The third one is from a different cochlea. See also Figure 3—figure supplements 1 and 2.
Figure 3—figure supplement 1
ChAT and TH Expression in the LSO Region of the Brainstem.
ChAT immunolabeling confirms the cholinergic identity of LOC neurons genetically labeled in ChatiresCre; Ai3 mice (A–C) (n = 4 LSOs, three mice). Immunolabeling against TH (yellow arrowhead) labeled a small number of cholinergic LOC intrinsic neurons, as confirmed by co-labeling with ChAT antibody or ChatiresCre; Ai3 mice (D) (n = 41 LSOs, 23 mice). The previously described TH+, ChAT- shell neurons (Darrow et al., 2006b) are also observed (red arrow) (D) (n = 41 LSOs, 23 mice). (A–C) A brainstem slice from a P30 ChatiresCre; Ai3 mouse is immunolabeled against ChAT, demonstrating that LOC neurons labeled by the mouse line (a GFP antibody recognizes the reporter protein EYFP) are positive for ChAT. Note a small fraction of ChAT-immunopositive LOC neurons (magenta) were not labeled in ChatiresCre; Ai3 mouse (green) (arrow indicates one example), possibly due to different thresholds of reporter line and immunolabeling. (D) The same brainstem slice as in (A–C) is immunolabeled with TH, demonstrating the presence of a TH+/ChAT+ LOC intrinsic neuron (arrowhead) and a few of the previously described TH+/ChAT- LOC shell neurons (arrow) (Darrow et al., 2006a).
Figure 3—figure supplement 2
TH+ ChAT- LOC Fibers.
Consistent with the previously reported TH+, ChAT- LOC shell neurons (Darrow et al., 2006b), LOC fibers with a typical shell-neuron morphology can be observed in sparsely labeled Th2A-CreER; Ai9 mouse cochleas (A) (n = 4, three mice). In addition, TH immunolabeling revealed another type of TH+ fiber, which travels around the IHC region in a meandering fashion (B) (n = 6 fibers, five mice). This type of fibers is not co-labeled by ChatiresCre; Ai3 mice (B) (n = 5 fibers, four mice). (A) Reconstruction of two LOC fibers labeled in a 7-week-old Th2A-CreER; Ai9 cochlea, both with a shell neuron-like morphology. The entry points into the organ of Corti for these two fibers are indicated with red arrowheads. One IHC is illustrated in navy blue for size comparison. (B) A cochlear segment of a P30 ChatiresCre; Ai3 mouse is immunolabeled with TH, demonstrating the peculiar meandering fiber path. This fiber is TH+ ChAT-; it does not overlap with the cholinergic fibers labeled by the mouse line.
Figure 4 with 1 supplement
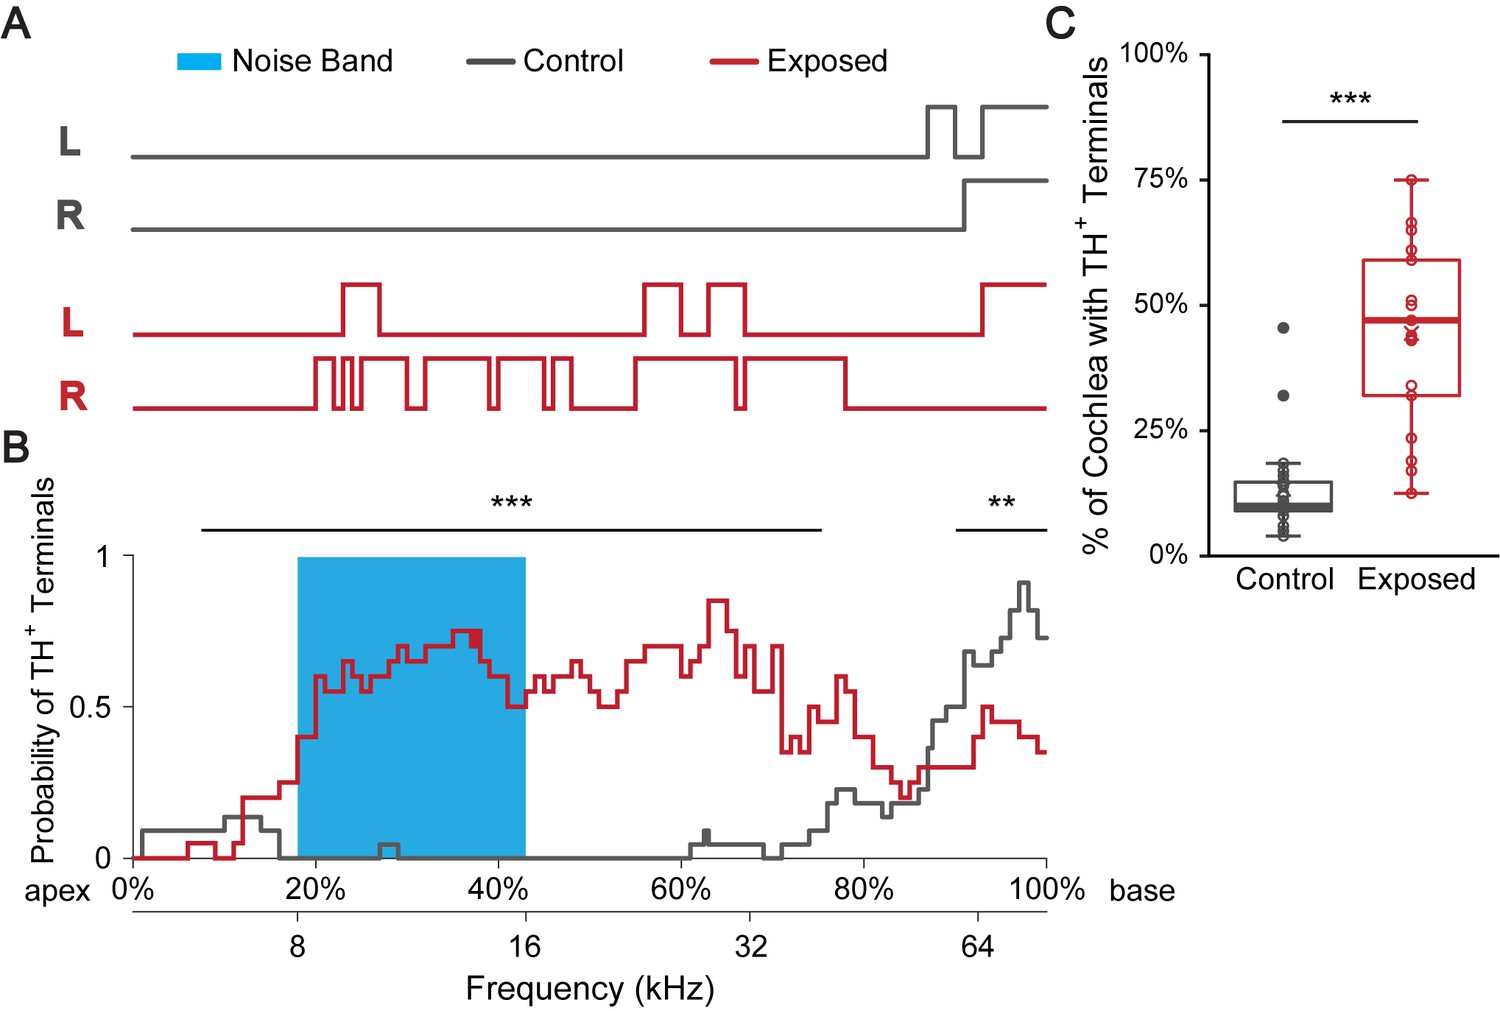
Sound exposure increases the percentage of cochlear spiral covered with TH+ terminal regions.
(A) Line plots indicate TH+ terminal regions (upper lines) versus TH+ spiral regions in a representative control mouse raised in a ‘low noise’ vivarium (gray) and in a mouse that was exposed to a 12 kHz-centered one-octave noise band at 110 dB SPL for 2 hr (red). Immunolabeling for TH was performed 7–10 days after sound exposure. Left (L) and right (R) cochleas are shown. The upper x-axis (shown in B) represents the linear distance along the cochlear spiral (with 0% at the apex and 100% at the base). The lower x-axis relates cochlear spiral location to ANF characteristic frequency. (B) A plot showing the averaged probability for a cochlear region to be covered by TH+ terminals at the cochlear frequencies plotted on the x-axis for control (gray, n = 22 cochleas, 11 mice) and sound exposed mice (red, n = 20 cochleas, 11 mice). Blue region marks the frequency range of the noise band. For the 7.5–75.5% of the cochlear length from the apex (~6–40 kHz), sound exposed mice are significantly more likely to have TH+ bouton endings compared to control. For the 90–100% of the cochlear length from the apex (~60–75 kHz), sound exposed mice are significantly less likely to have TH+ bouton endings compared to control. Repeated measures binary logistic regression using generalized estimating equations (GEE); ***p<0.001, **p<0.01. Data for individual cochleas are provided in Figure 4—source data 1. (C) Sound exposed mice (n = 21 cochleas, 11 mice) showed on average 31% more cochlear coverage by TH+ terminal regions compared to their littermate control mice (n = 22 cochleas, 11 mice). Linear mixed model with sound exposure as the fixed effect and repeated measures from two ears of the same mouse; ***p<0.0005. See also Figure 4—figure supplement 1.
-
Figure 4—source data 1
Regions of Cochlear Spiral covered by TH+ LOC terminal regions in Control and Sound Exposed (2hr 110 dB SPL) mice.
- https://cdn.elifesciences.org/articles/52419/elife-52419-fig4-data1-v2.xlsx
Figure 4—figure supplement 1
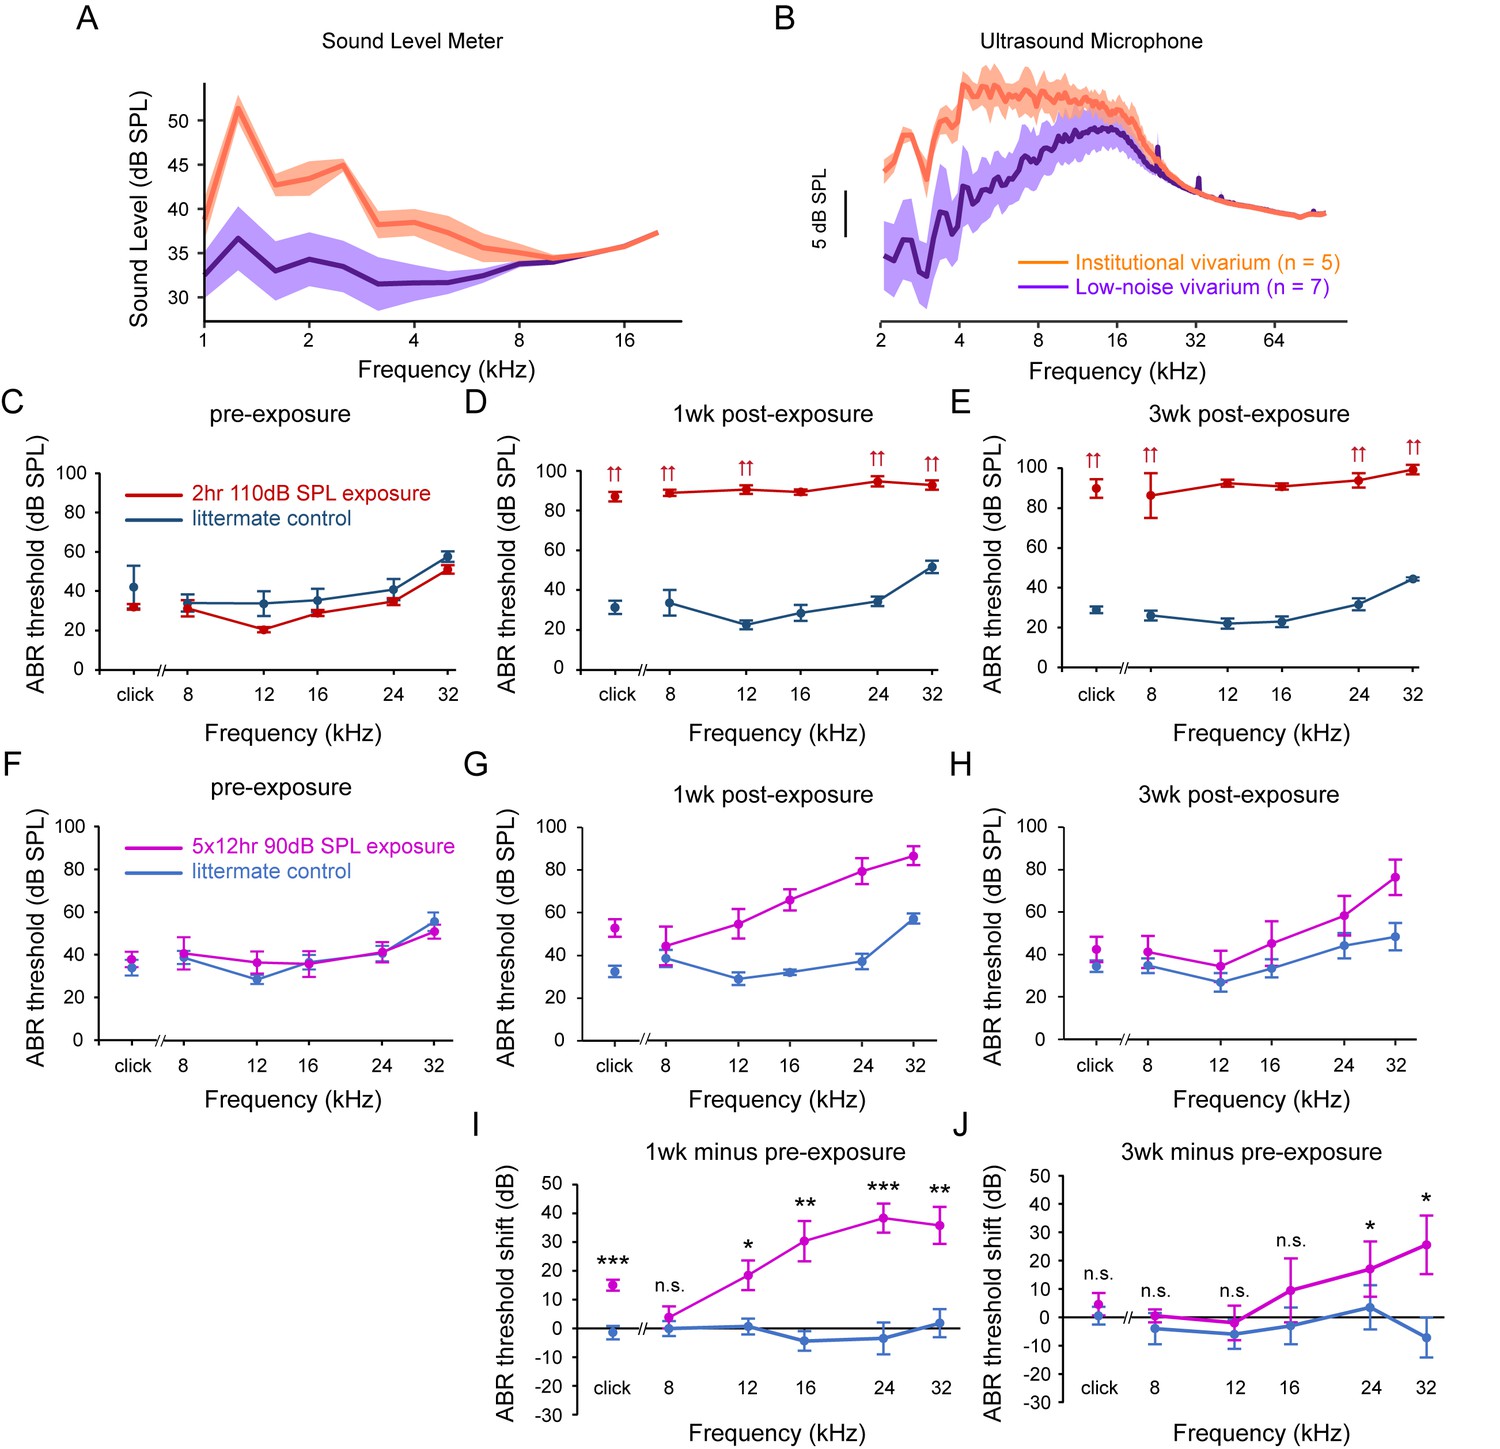
Sound Levels Measured in the Institutional and a ‘Low Noise’ Vivarium and ABR Threshold and Threshold Shifts Induced by Sound Exposure Protocols.
To compare the sound level between the institutional vivarium and a ‘low noise’ satellite vivarium, 5 min recordings were performed using a sound level meter and an ultrasound microphone (A-B). To assess the effects of two different sound exposure protocols on hearing, ABR thresholds were measured before and after sound exposure. For both protocols, a 12 kHz-centered one-octave noise band was applied. In contrast to the 2 hr 110 dB SPL protocol, which caused an irreversible ABR threshold shift (C-E), the 5 × 12 hr 90 dB SPL protocol showed a partially reversible ABR threshold shift (F-J). (A) Sound level recorded using a sound level meter in the two vivariums. Data are plotted as mean ± SD. (B) Frequency analysis of ultrasound microphone recordings in the two vivariums, FFT size: 2048, Window: Hamming. Data are plotted as mean ± SD. (C–E) ABR thresholds for mice exposed to the 2 hr 110 dB SPL protocol (red) and for their control littermates (navy), at pre-exposure, 1 week post-exposure and 3 weeks post-exposure time points. Note that sound exposure caused an irreversible ABR threshold elevation. Double arrows indicate that the actual threshold is higher than the highest sound intensity presented. Data are plotted as mean ± SEM. (F–H) ABR thresholds for mice exposed to the 5 × 12 hr 90 dB SPL protocol (magenta) and for their control littermates (blue), at pre-exposure, 1 week post-exposure and 3 weeks post-exposure time points. Data are plotted as mean ± SEM. (I–J) ABR threshold shifts at 1 week post-exposure and 3 weeks post-exposure for mice exposed to 5 × 12 hr 90 dB SPL protocol (magenta) and for their control littermates (blue). Data are plotted as mean ± SEM. Two-tailed independent t-tests between control and exposed group on original data or on rank-transformed data for each tone, ***p<0.001, **p<0.01, *p<0.05, n.s. not significant.
Figure 5 with 1 supplement
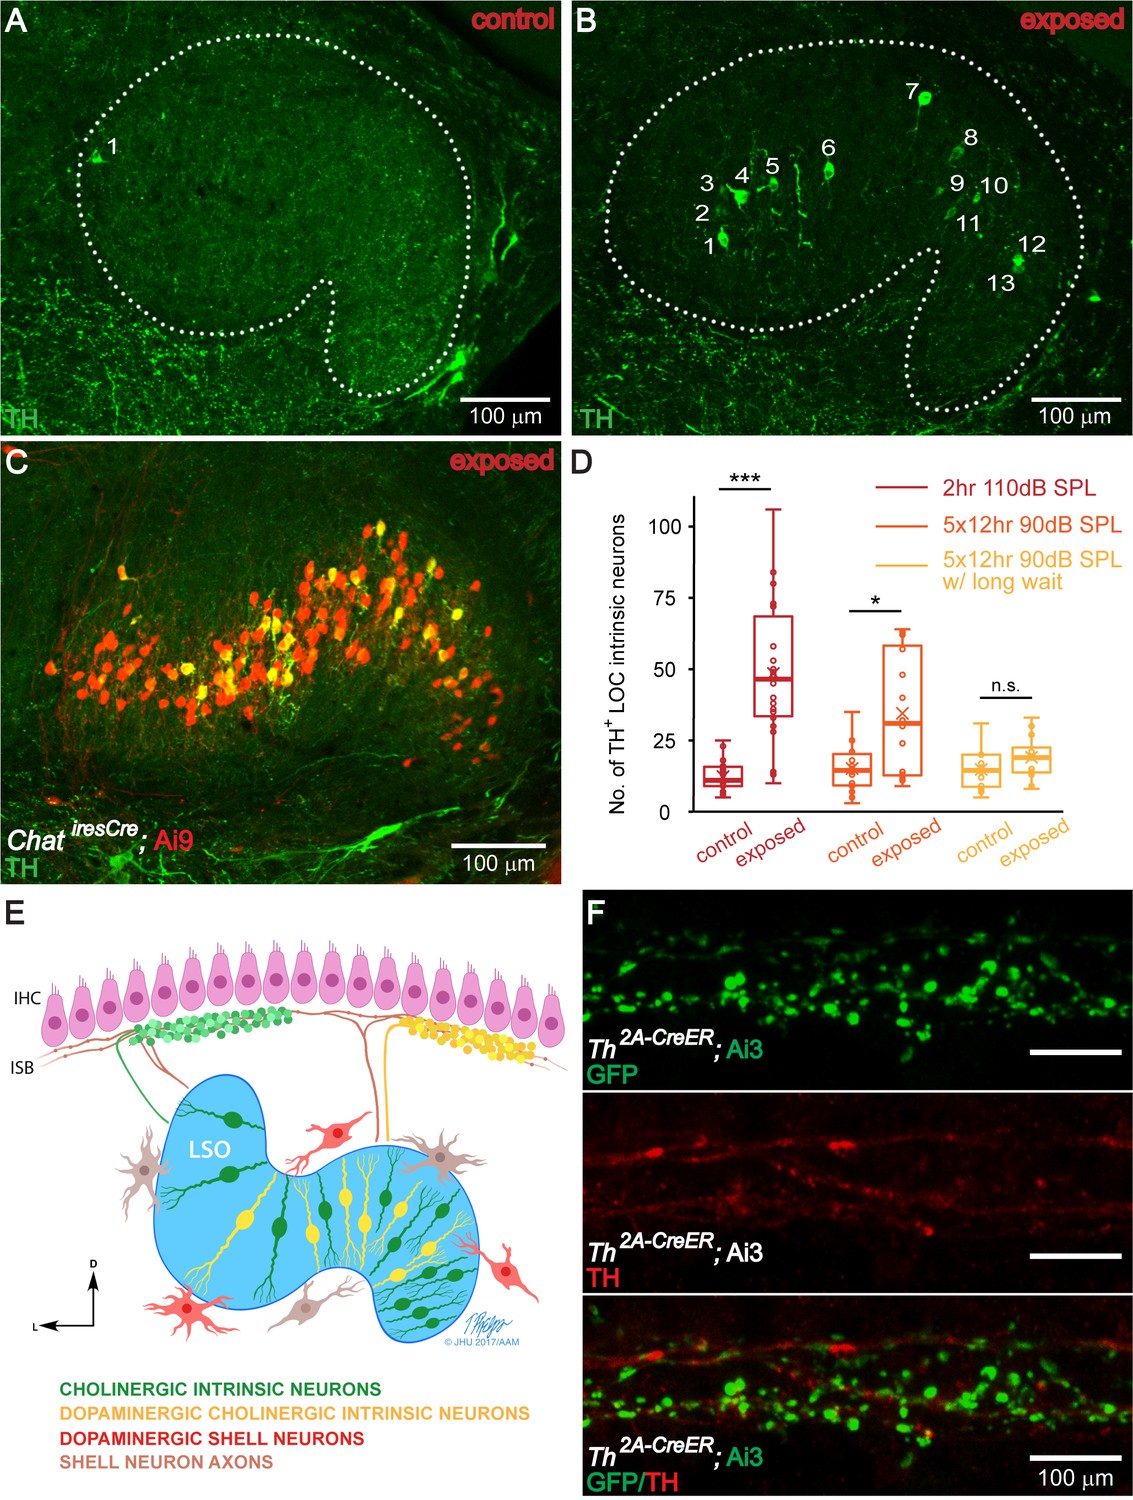
The number of TH+ LOC intrinsic neurons in the LSO is dynamically regulated by sound.
(A and B) Representative images of TH immunolabeled 50 μm brain slices of the LSO region from a control (A) and a sound exposed mouse (B, 2 hr exposure). Sound exposure occurred at 7 weeks of age, and immunolabeling at 8 weeks. Each number identifies a TH+ LOC intrinsic neuron. (C) A representative brain slice of the LSO region from a sound exposed mouse (2 hr exposure) expressing tdTomato (Ai9) driven by ChatiresCre to label cholinergic LOC intrinsic neurons (red). Co-labeling with TH immunostaining (green) demonstrates that TH expression is found in existing cholinergic LOC intrinsic neurons. (D) Box plots demonstrating the number of TH+ LOC intrinsic neurons identified within LSO from either side of the brain, in control versus sound exposed mice for three sets of experiments. For both, 2 hr 110 dB SPL exposure (red) (control: n = 22 LSOs, 11 mice, exposed: n = 22 LSOs, 11 mice) and 5 × 12 hr 90 dB SPL exposure (orange) (control: n = 14 LSOs, 8 mice, exposed: n = 16 LSOs, 8 mice), the exposed groups have significantly larger numbers of TH+ LOC neurons than control groups, when examined one week from the beginning of the exposure (2 hr 110 dB SPL exposure, control: 11 ± 7, exposed: 47 ± 35) (5 × 12 hr exposure, control: 15 ± 11, exposed: 31 ± 46). In contrast, when examined three weeks from the beginning of the 5 × 12 hr 90 dB SPL exposure (yellow) (control: n = 12 LSOs, 6 mice, exposed: n = 12 LSOs, 6 mice), the number of TH+ LOC neurons is not significantly different between exposed and control groups (5 × 12 hr exposure w/long wait, control: 15 ± 11, exposed: 19 ± 9). Linear mixed model with sound exposure as the fixed effect and a random intercept for each mouse to account for the correlation among two measurements from the same mouse, ***p<0.0005; *p<0.05; n.s. not significant p>0.05. Presented data indicate median ±IQR per LSO. (E). Modified schematic drawing demonstrating the hypothesis that after sound exposure, a subset of cholinergic LOC intrinsic neurons will become dopaminergic and cholinergic. (F). An apical cochlear segment of a Th2A-CreER; Ai3 mouse raised in the institutional vivarium. Tamoxifen was administrated between 1–3 weeks. The mouse was sacrificed at the age of 1 month. Comparing mouse line labeling (top, a GFP antibody recognizes the EYFP reporter protein) and TH immunostaining (middle) suggests that some of the LOC efferent terminals that expressed Th at the time of tamoxifen injection did not express Th anymore at 1 month. See also Figure 5—figure supplement 1.
© 2019 Tim Phelps, JHU AAM. Illustration in panel E: Tim Phelps © 2019 JHU AAM (Department of Art as Applied to Medicine, Johns Hopkins University School of Medicine), published with permission. These illustrations are not covered by the CC-BY 4.0 licence and may not be separated from the article.
Figure 5—figure supplement 1
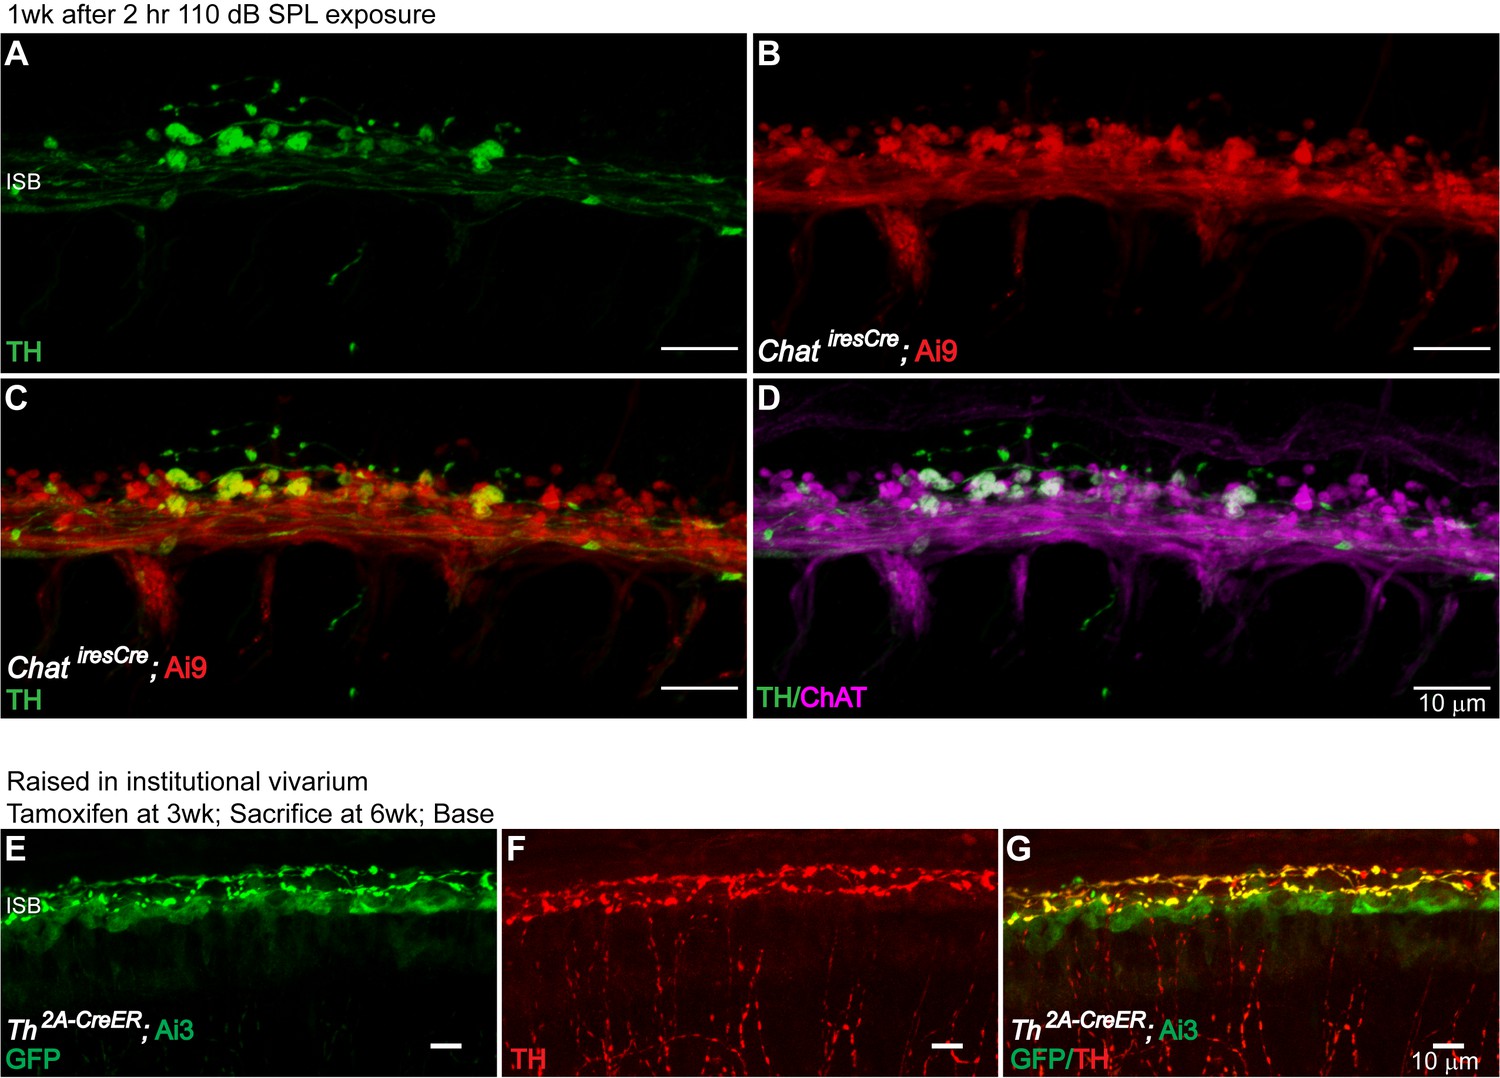
Dynamic expression of TH in LOC Fiber Bouton Endings.
To test whether the sound-induced TH expression in cholinergic LOC efferent fibers could affect the cholinergic phenotype of these neurons, sound-exposed cochleas were immunolabeled for TH and ChAT. At 1 week post-exposure, TH+ LOC efferent terminals were still positive for ChAT (n = 1 cochlea) (A–D). To demonstrate the dynamic expression of TH in a variable acoustic environment, Th2A-CreER; Ai3 mice raised in the institutional vivarium were administrated with tamoxifen at various time points. TH-expression in LOC neurons around the time of tamoxifen administration was compared with the TH immunolabeling at the time of tissue harvest. While the TH expression in LOC neurons that innervate the apical region of the cochlea is more dynamic (shown in Results, E), in the basal cochlea, TH expression is more stable, as shown here (E–G) (n = 5 cochleas, 5 mice). (A–D). A segment of the ISB region from an 8-week-old ChatiresCre; Ai9 mouse that have been exposed to the 2 hr 110 dB SPL protocol. TH immunostaining revealed that TH+ LOC efferent terminals are both co-labeled for ChAT by the mouse line (left) and by ChAT immunolabeling (right). This result suggests that sound exposure induces TH expression in existing cholinergic LOC efferent terminals, and that these terminals remain cholinergic during TH expression. (E–G) A basal cochlear segment of a 6-week-old Th2A-CreER; Ai3 mouse raised in the institutional vivarium. Tamoxifen was administrated at 3 weeks. The mouse was sacrificed at 6 weeks. Comparing TH immunolabeling and mouse line labeling (a GFP antibody recognizes the EYFP reporter protein) suggests that a large subset of LOC efferent terminals that expressed Th at 3 weeks continue to express Th at 6 weeks in the base.
Figure 6 with 1 supplement
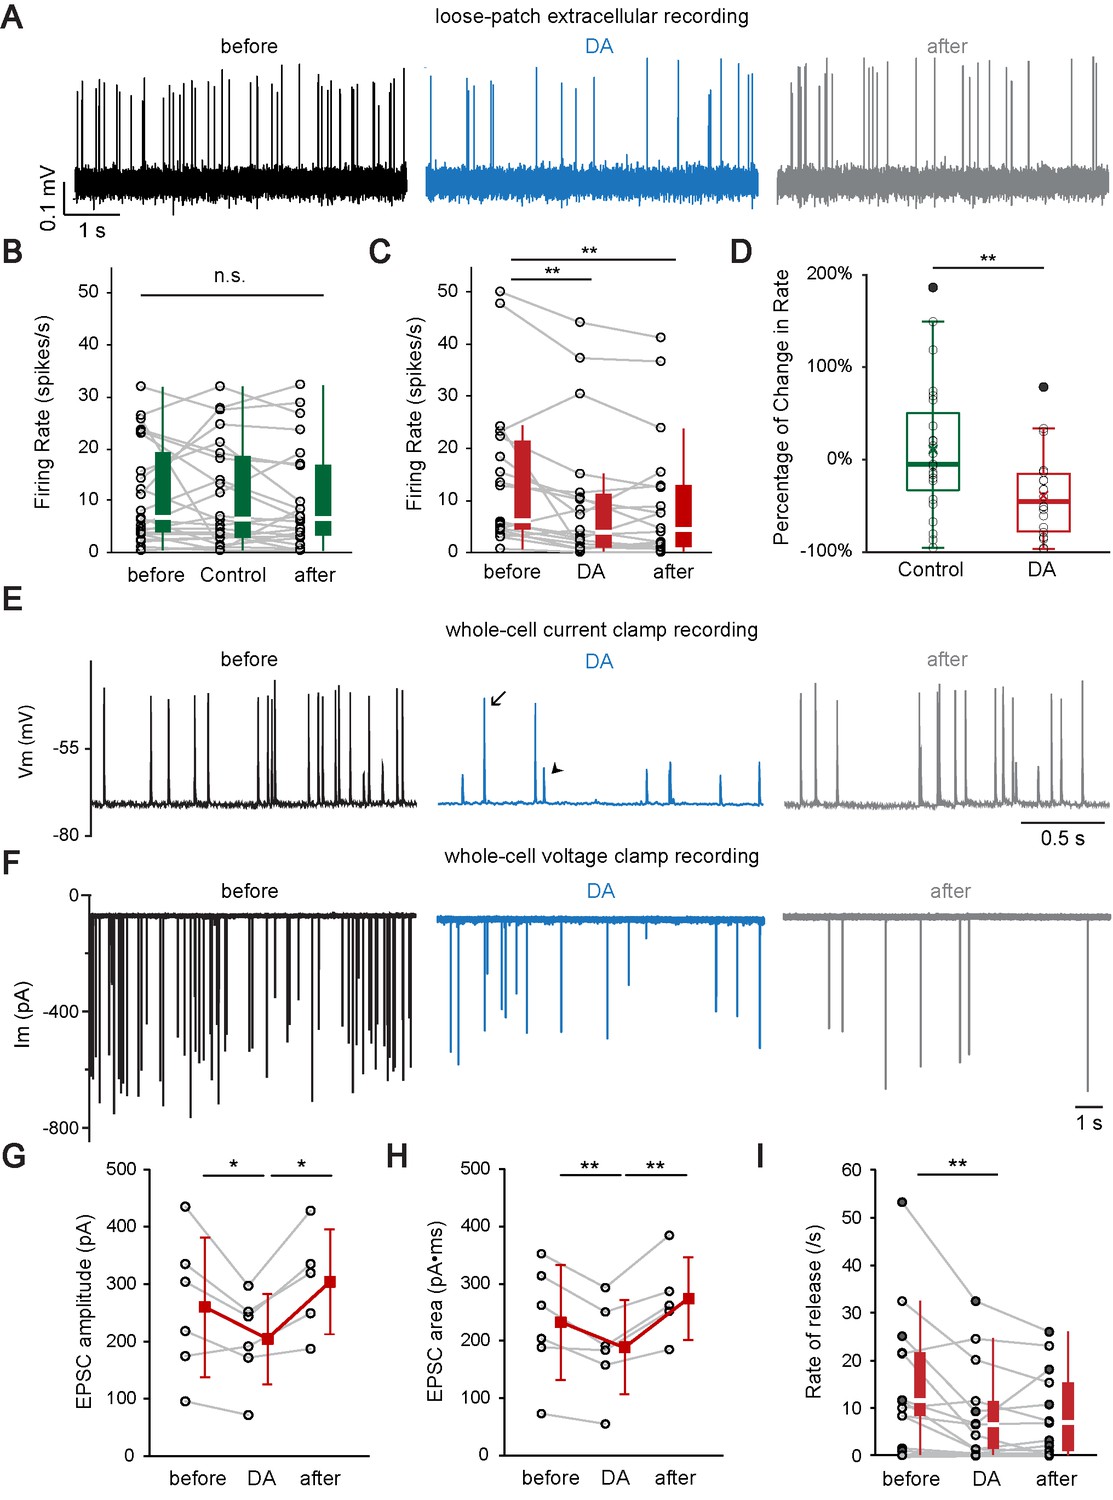
Dopamine modulates auditory nerve fiber activity at the IHC afferent synapse by two distinct mechanisms.
(A) A representative loose-patch extracellular recording demonstrates that DA (dopamine, 1 mM) reduced the firing rate of the ANF. (B) Profile plots for individual recordings of control experiments (n = 23). Box plots are shown to the right of individual data. Switching from extracellular solution to Control solution, which contains 0.1% sodium ascorbate, the antioxidant used in DA solution, did not cause any significant change in firing rate. Friedman test, n.s. not significant. (C) Profile plots for individual recordings with DA application (n = 22). Box plots are shown to the right of individual data. DA significantly reduced the firing rate. Friedman test followed by Dunn's multiple comparisons test, **p<0.01. Note that one fiber with a high spontaneous rate (~90 spikes/s) was omitted from the individual profile plots for better visualization of other fibers, but is included for statistical analysis. (D) Box plots of the percentage of change in firing rate during the application of Control solution (B) or DA (C). Two-tailed independent t-test, **p<0.01. (E) A representative current clamp recording demonstrates that DA (1 mM) reduces the rate of synaptic events and decreases the percentage of EPSPs (arrowhead) that activate APs (arrow). (F) A representative voltage clamp recording demonstrates that DA (2 mM) application reduced the rate and amplitude of EPSCs. (G–H) Profile plots showing changes in the (G) EPSC amplitude and (H) EPSC area during DA application for 6 voltage clamp recordings. Mean ± SD (red squares) is shown to the right of individual data (open black circles). In order to utilize all available data points, two-tailed paired t-tests were performed separately between ‘before’ and ‘DA’ group (n = 6) and between ‘DA’ and ‘after’ group (n = 5), *p<0.05, **p<0.01. (I) Profile plot of synaptic rate for individual fibers before (before), during (DA) and after (after) dopamine application for 6 current clamp recordings (filled circles; both APs and EPSPs were counted) and 7 voltage clamp recordings (open circles). Box plots are shown to the right of individual data. One extreme outlier was excluded from this analysis. One-way repeated-measure ANOVA on rank transformed data, followed by post hoc pairwise comparison with a Bonferroni adjustment, **p<0.01. See also Figure 6—figure supplement 1.
Figure 6—figure supplement 1
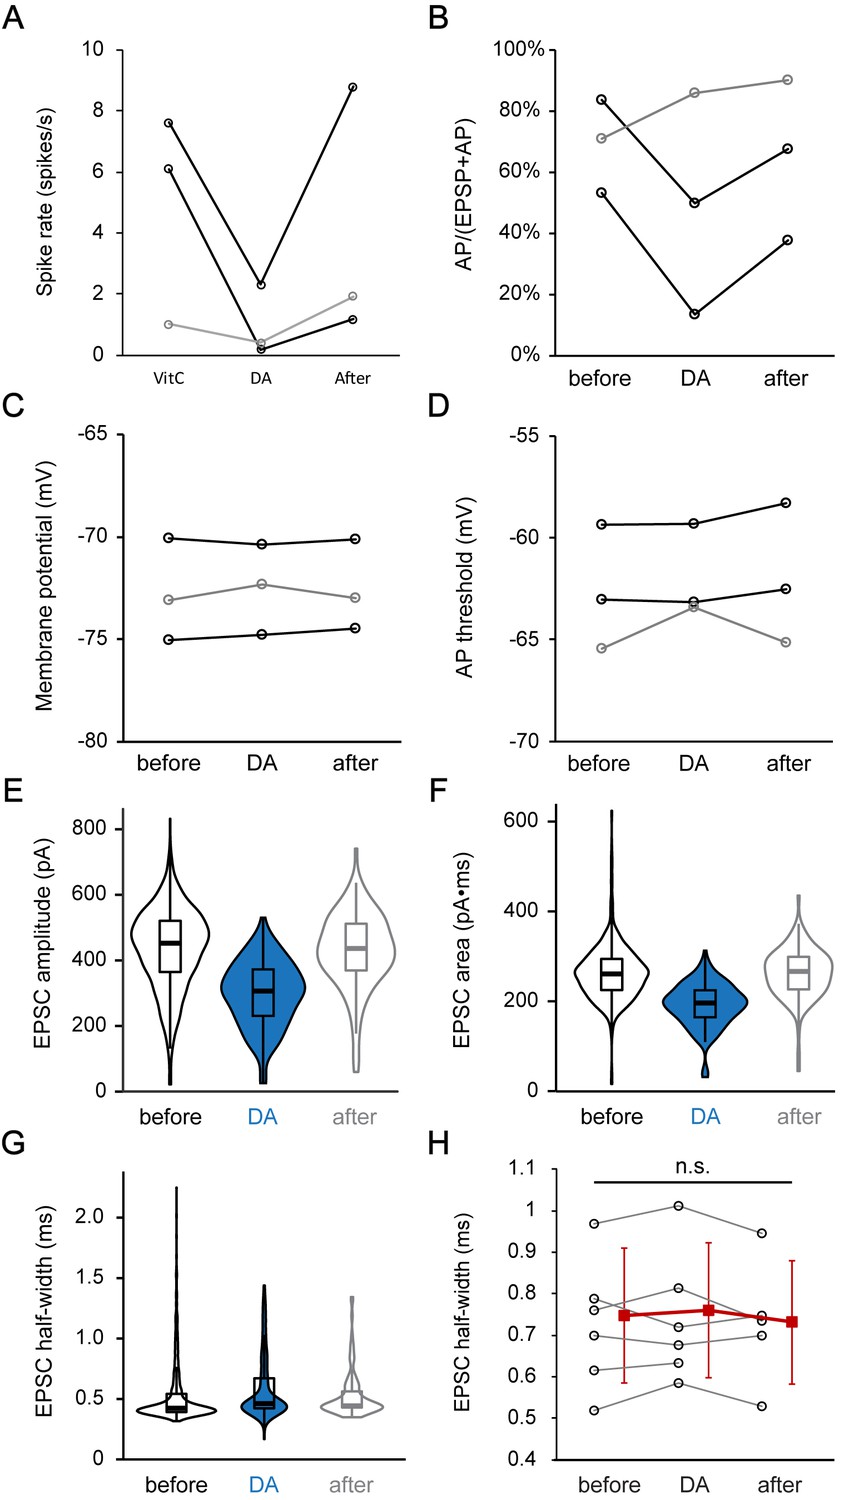
Dopamine reduces the EPSC amplitude, and thereby most likely reduces the percentage of EPSPs that activate an AP.
(A–D) Profile plots for changes in spike rate (A), percentage of APs in all events (APs + EPSPs) (B), membrane potential (C), and AP threshold (D), before (before), during (DA, 1 mM) and after DA application (after) for 3 current clamp ANF recordings. Two fibers (black) showed a reversible reduction in spike rate and AP/(AP+EPSP) ratio during DA application, without any change in membrane potential or AP threshold. The third fiber showed a different behavior (gray). Statistical test was not performed due to the small sample size. (E–G) Violin plots and box plots depicting the change in the distributions of (E) EPSC amplitude, (F) EPSC area and (G) EPSC half-width during DA application for the example trace shown in Figure 6F. (H) Profile plots showing no significant change in the EPSC half-width during DA application for 6 voltage clamp recordings. Mean ± SD (red squares) is shown to the right of individual data (open black circles). In order to utilize all available data points, two-tailed paired t-tests were performed separately between ‘before’ and ‘DA’ group (n = 6) and between ‘DA’ and ‘after’ group (n = 5), n.s. not significant.
Tables
Key resources table
| Reagent type (species) or resource | Designation | Source or reference | Identifiers | Additional information |
|---|---|---|---|---|
| Strain (M. musculus) | C57BL/6J WT | Jackson Laboratory | Stock #: 000664 RRID:IMSR_JAX:000664 | |
| Strain (Rattus norvegicus domestica) | Sprague Dawley rat | Charles River | RGD Cat# 734476 RRID:RGD_734476 | |
| Genetic reagent (M. musculus) | ChATiresCre | Jackson Laboratory | Stock #: 028861 RRID:IMSR_JAX:028861 | |
| Genetic reagent (M. musculus) | Th2A-CreER | PMID: 28041852 | MGI: 98735 | Dr. David Ginty (Harvard Medical School) |
| Genetic reagent (M. musculus) | Ai3 (B6.Cg-Gt(ROSA)26Sortm3(CAG-EYFP)Hze/J) | Jackson Laboratory | Stock #: 007903 RRID:IMSR_JAX:007903 | |
| Genetic reagent (M. musculus) | Ai9 (B6.Cg-Gt(ROSA)26Sortm9(CAG-tdTomato)Hze/J) | Jackson Laboratory | Stock #: 007909 RRID:IMSR_JAX:007909 | |
| Antibody | Polyclonal rabbit anti-TH | Millipore | Cat# 657012–15 UG, RRID:AB_566341 | 1:500 – 1:1000 |
| Antibody | Polyclonal goat anti-GFP | Sicgen | Cat# AB0020-200; RRID:AB_2333099 | 1:5000 |
| Antibody | Polyclonal goat anti-ChAT | Millipore | Cat# AB144P RRID:AB_2079751 | 1:20 – 1:50 |
| Antibody | Polyclonal guinea pig anti-VAChT | Millipore | Cat# AB1588, RRID:AB_11214110 | 1:500 – 1:1000 |
| Antibody | Polyclonal goat anti-mCherry | Sicgen | Cat# AB0040-200; RRID:AB_2333092 | 1:1000 |
| Antibody | Monoclonal mouse anti-Myosin VIIa | DSHB | Cat# MYO7A 138–1, RRID:AB_2282417 | 1:200 - 1:500 |
| Chemical compound, drug | Dopamine Hydrochloride | Sigma-Aldrich | Cat# H8502 | |
| Chemical compound, drug | Sodium L-Ascorbate | Sigma-Aldrich | Cat# A7631 | |
| Chemical compound, drug | Tetrodotoxin | Tocris | Cat# 1078/1 | |
| Chemical compound, drug | Tetrodotoxin Citrate | Tocris | Cat# 1069/1 | |
| Chemical compound, drug | Tamoxifen | Sigma-Aldrich | Cat# T5648 | |
| Chemical compound, drug | Corn Oil | Sigma-Aldrich | Cat# C8267 | |
| Software, algorithm | ZEN Blue/Black | Zeiss | RRID:SCR_013672 | |
| Software, algorithm | ImageJ | NIH | RRID:SCR_003070 | |
| Software, algorithm | ImageJ plugin: Measure_line | Mass Eye and Ear | https://research.meei.harvard.edu/Otopathology/3dmodels/other_tools.html | |
| Software, algorithm | Fiji | http://fiji.sc | RRID:SCR_002285 | |
| Software, algorithm | MATLAB | MathWorks | RRID:SCR_001622 | |
| Software, algorithm | Adobe Photoshop CS6 | Adobe | RRID:SCR_014199 | |
| Software, algorithm | Adobe Illustrator CS6 | Adobe | RRID:SCR_014198 | |
| Software, algorithm | R Project for Statistical Computing | Open Source | RRID:SCR_001905 | |
| Software, algorithm | RStudio | Open Source | RRID:SCR_000432 | |
| Software, algorithm | SPSS Statistics 25 | IBM | RRID:SCR_002865 | |
| Software, algorithm | SigmaPlot | Systat Software Inc | RRID:SCR_003210 | |
| Software, algorithm | Origin 9.1 | OriginLab | RRID:SCR_014212 | |
| Software, algorithm | MiniAnalysis | Synaptosoft | RRID:SCR_014441 | |
| Software, algorithm | STATA | StataCorp | RRID:SCR_012763 | |
| Software, algorithm | pClamp 9.2 - Clampex | Molecular Devices | RRID:SCR_011323 | |
| Software, algorithm | pClamp 9.2 -Clampfit | Molecular Devices | RRID:SCR_011323 | |
| Software, algorithm | BatSound Touch Lite | Pettersson Elektronik | ||
| Software, algorithm | Adobe Audition CC 2018 | Adobe | RRID:SCR_015796 |
Additional files
Download links
A two-part list of links to download the article, or parts of the article, in various formats.
Downloads (link to download the article as PDF)
Open citations (links to open the citations from this article in various online reference manager services)
Cite this article (links to download the citations from this article in formats compatible with various reference manager tools)
Sound exposure dynamically induces dopamine synthesis in cholinergic LOC efferents for feedback to auditory nerve fibers
eLife 9:e52419.
https://doi.org/10.7554/eLife.52419


