Lamina-specific AMPA receptor dynamics following visual deprivation in vivo
- Solomon H Snyder Department of Neuroscience and Kavli Neuroscience Discovery Institute, Johns Hopkins University School of Medicine, United States
- Department of Physiology and Membrane Biology, University of California School of Medicine, United States
Figures
Figure 1 with 1 supplement
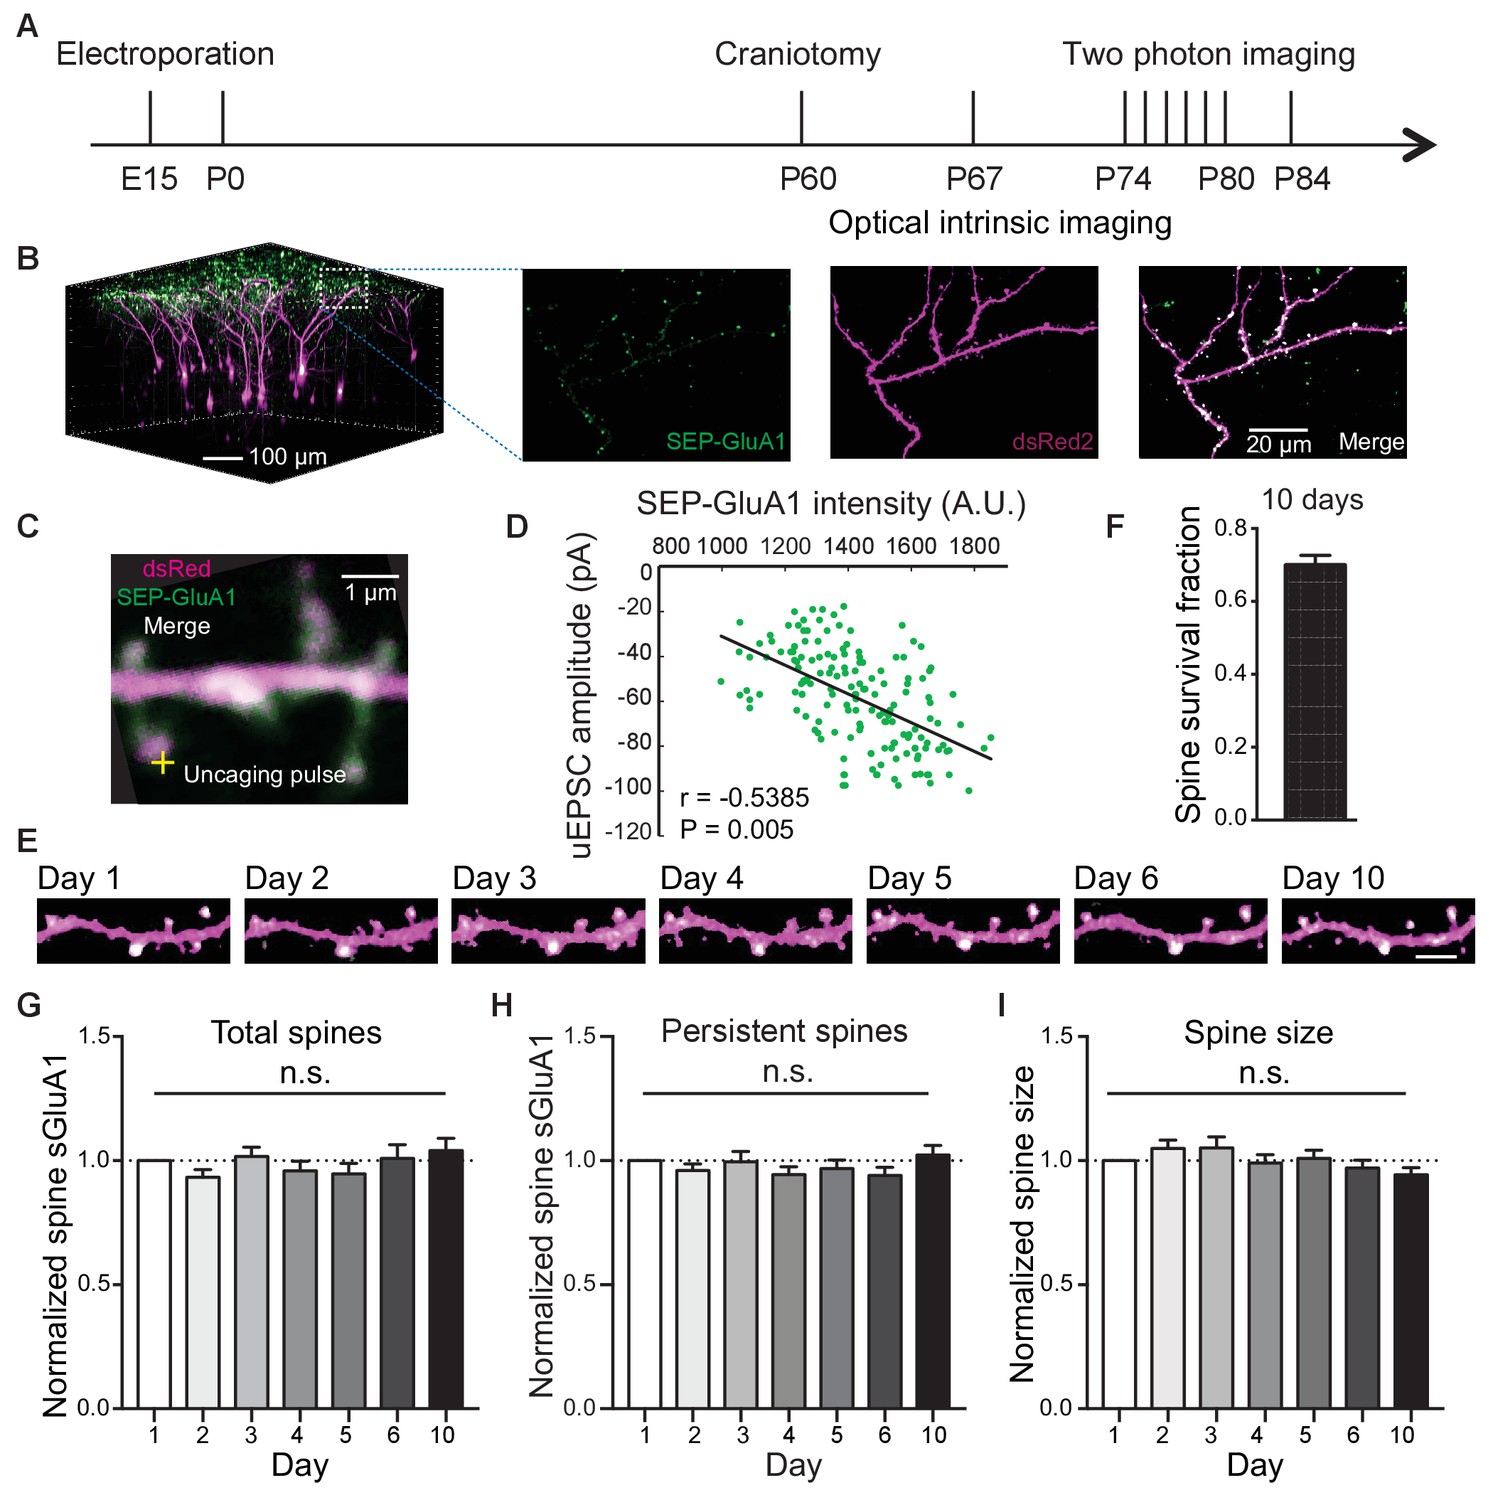
Long-term detection of spine SEP-GluA1 in V1 L2/3 neurons in vivo.
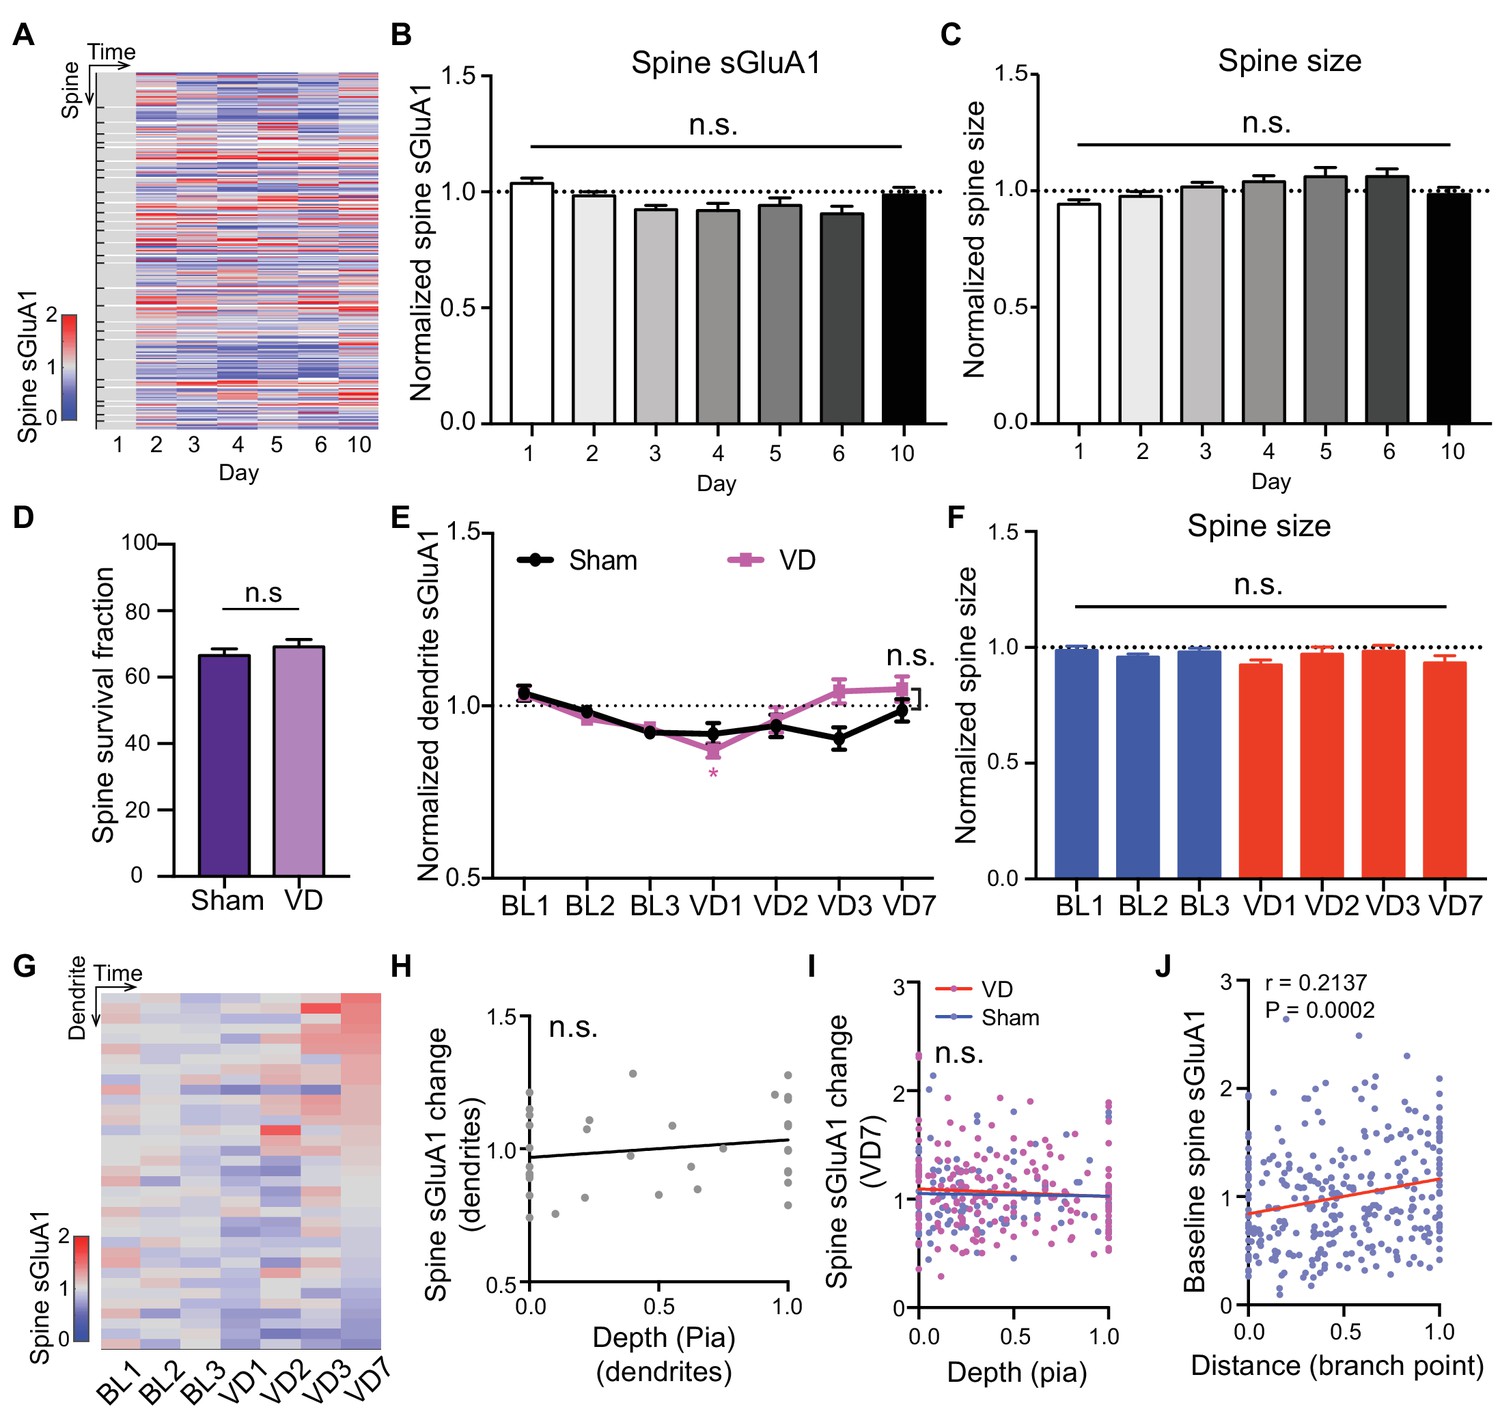
(A) Experimental timeline. (B) (Left) 3D reconstruction of L2/3 neurons of visual cortex transfected with SEP-GluA1 (green) and dsRed2 (magenta), merged in white. (Right) Z projection of imaging volume in white box. (C) Example of a whole-cell recording and glutamate uncaging at a spine with high sGluA1 enrichment. (D) Correlation between spine sGluA1 intensity and uEPSC amplitude (n = 146 spines; Pearson). (E) Representative time-lapse images of V1 L2/3 apical dendrites. Scale bar: 5 μm. (F) Percentage of spines that persist across 10 imaging days. (G) Total spine sGluA1 level on the dendrite did not change significantly with time. Total spine sGluA1 level on a dendrite was calculated by summing all spines on the same dendrite (n = 19 dendrites from five mice; one-way ANOVA). (H) Stable expression of average spine sGluA1 in persistent spines over 10 days (n = 23 dendrites from six mice; one-way ANOVA). (I) Average spine size in persistent spines had no significant change over days (n = 23 dendrites from six mice; one-way ANOVA).
Figure 1—figure supplement 1
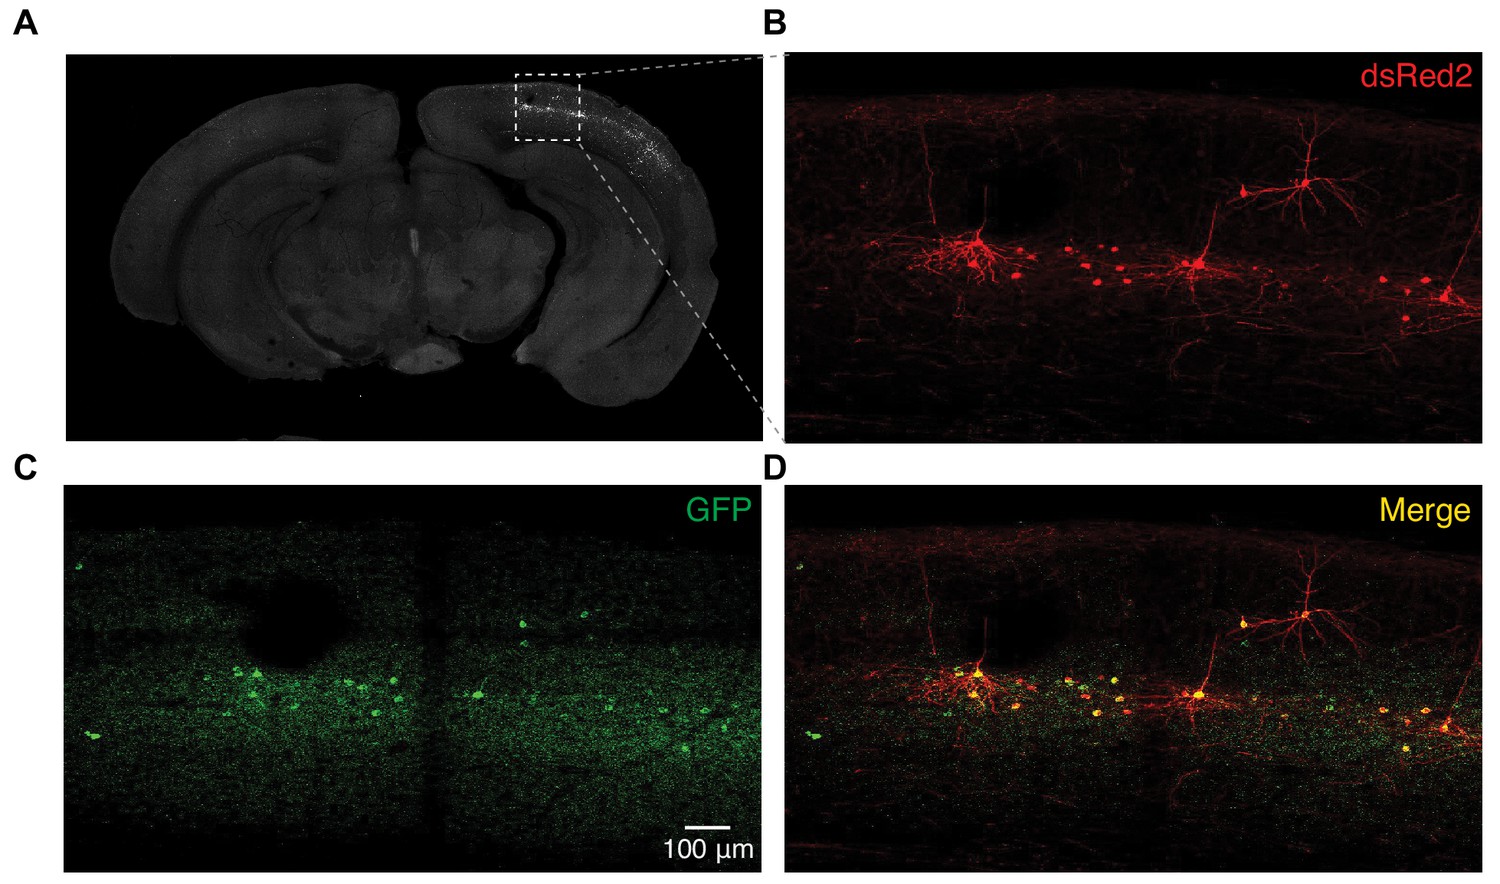
Expression of SEP-GluA1 in L2/3 neurons.
(A) Immunostaining of SEP and dsRed2 in brain slices from mice with in utero electroporation. SEP-GluA1 expressing neurons were located in L2/3 of the electroporated hemisphere but not in the control hemisphere. (B–D) High-magnification view of sGluA1/dsRed2 expressing neurons in V1 L2/3.
Figure 2 with 1 supplement
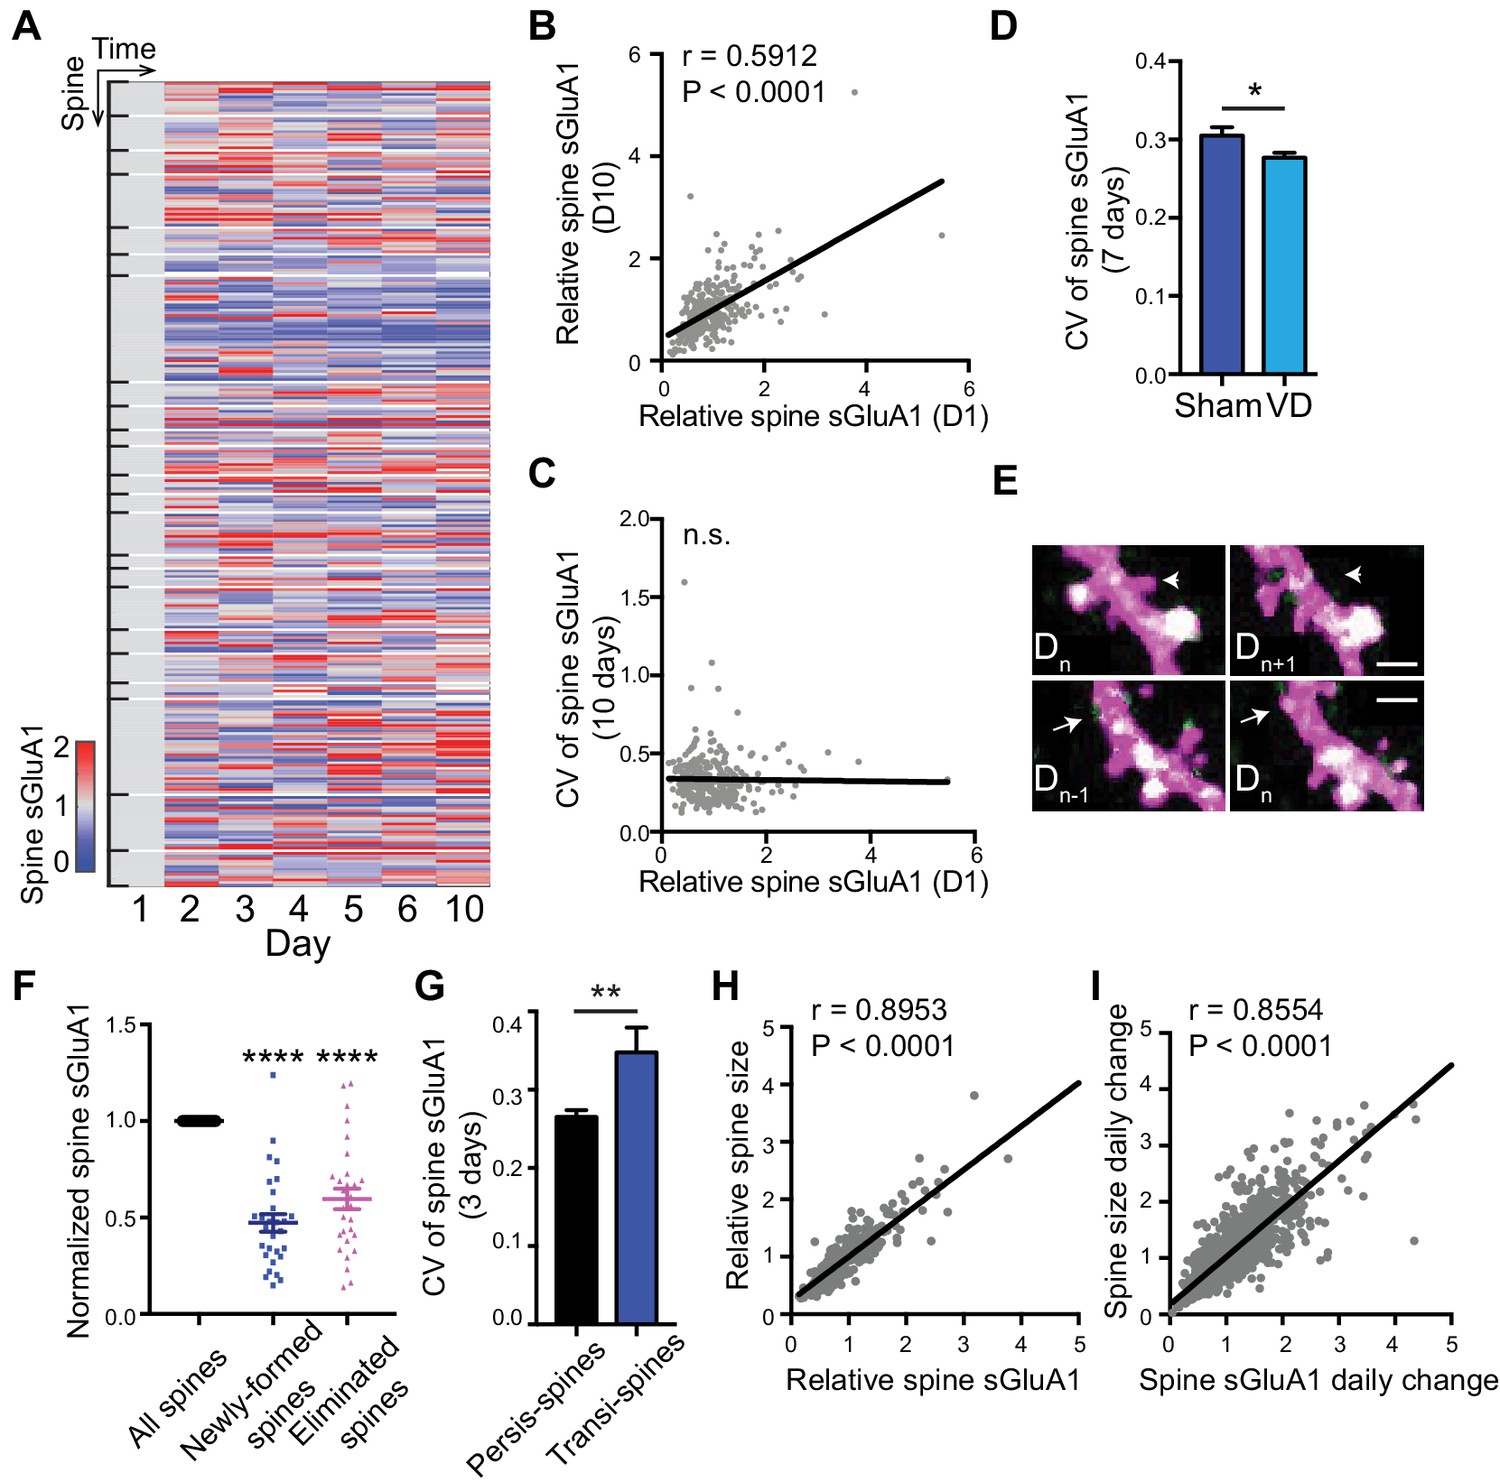
Dynamic baseline expression of sGluA1 within individual spines.
(A) Heat map of sGluA1 expression within individual spines. Spines on the same dendrites were grouped together. (B) Correlation of spine sGluA1 level between day 1 and day 10 in V1 L2/3 neurons (n = 279 spines; Pearson). (C) Correlation between spine sGluA1 level at day 1 and its CV in V1 L2/3 neurons (n = 280 spines; Pearson). (D) The CV of spine sGluA1 signal in V1 L2/3 neurons before and after visual deprivation (VD) (n = 280/520 (Sham/VD) spines in V1 L2/3 neurons; Student’s t-test). (E) Representative images of newly-formed spines (bottom) and eliminated spines (upper). Scale bars: 2 μm. (F) sGluA1 levels in newly-formed spines and eliminated spines (n = 29 spines; Student’s t-test). (G) The CV of spine sGluA1 expression in persistent and transient spines in V1 L2/3 neurons (n = 327 persistent spines; n = 34 transient spines). (H) Correlation between spine size and spine sGluA1 intensity on imaging day 1 (n = 280 spines; Pearson). (I) Correlation between daily change in spine size and daily change in spine sGluA1 level (n = 1384 spines; Pearson). Data are presented as mean ± SEM. n.s., not significant; *p<0.05; **p<0.01; ****p<0.0001.
Figure 2—figure supplement 1
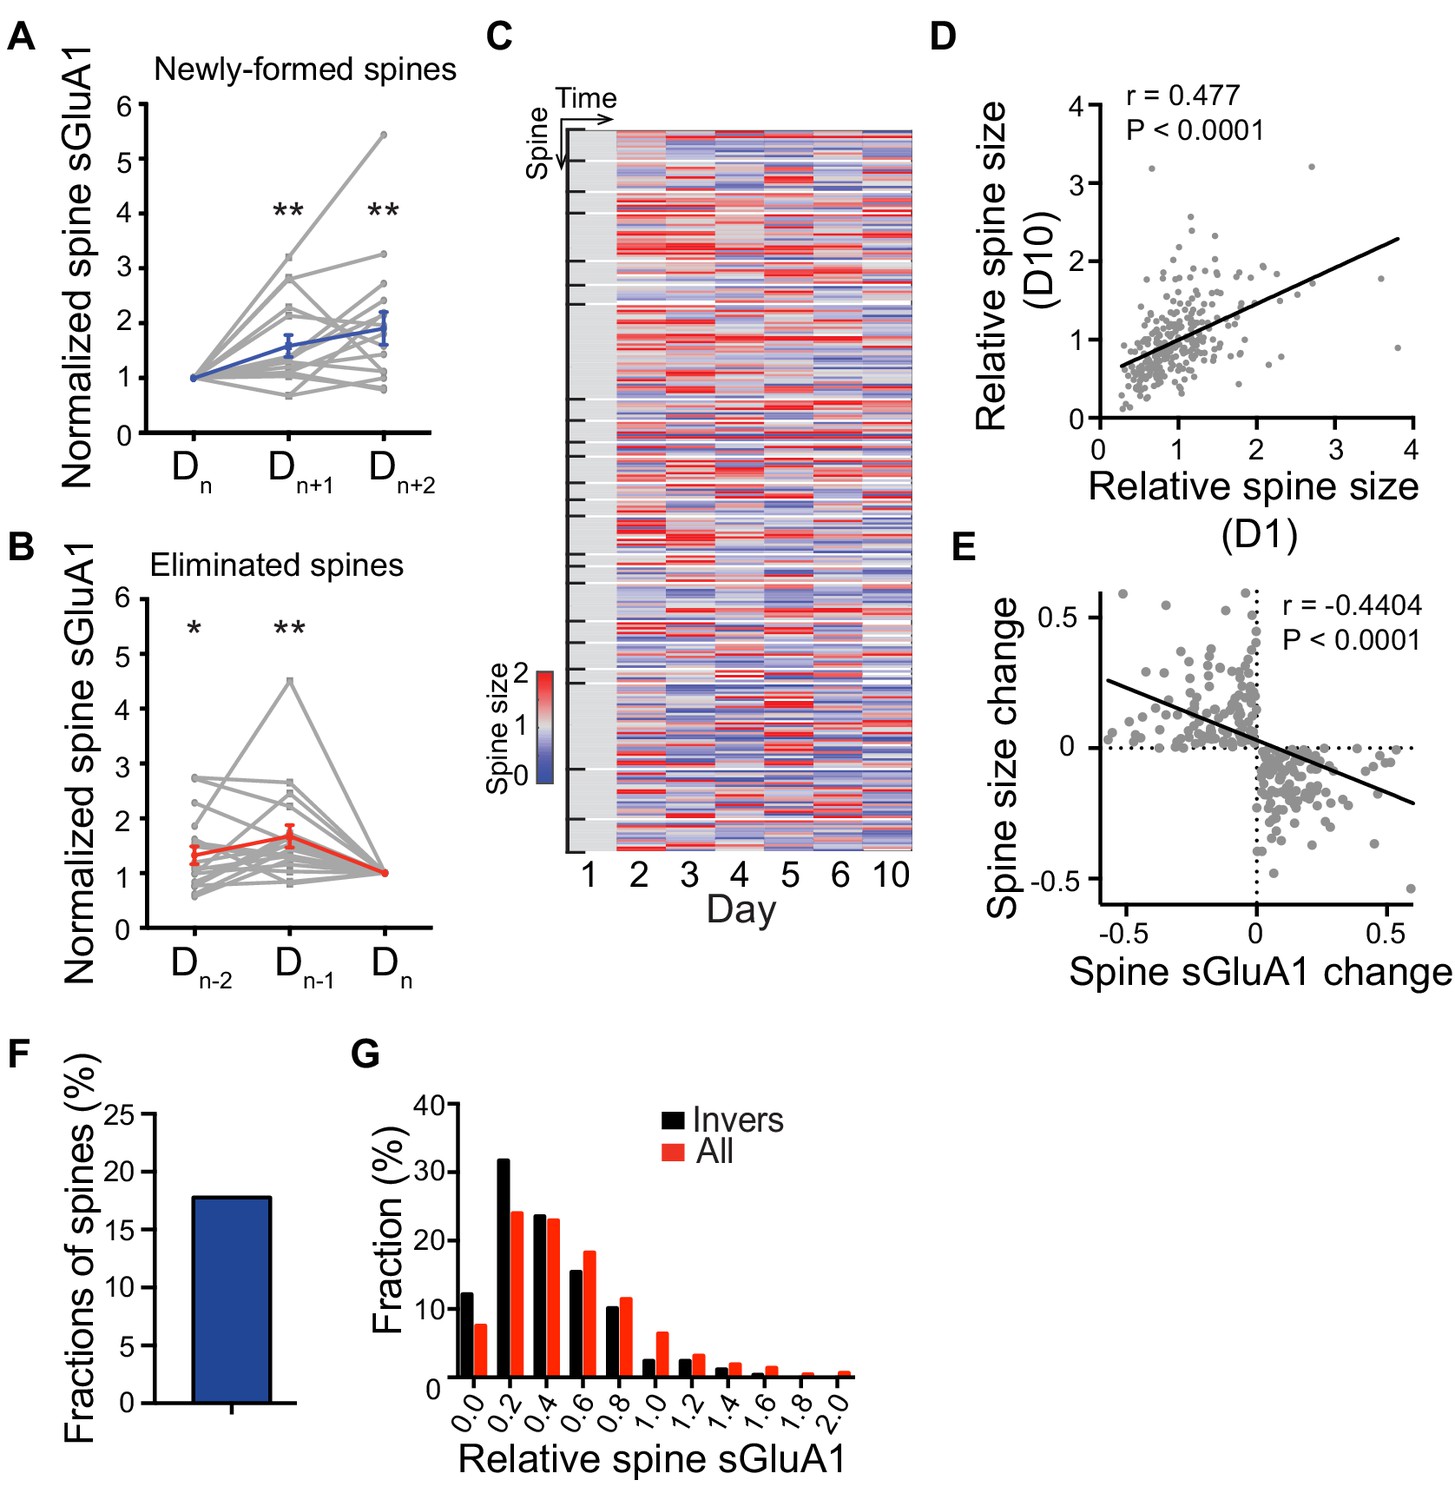
Dynamic sGluA1 expression within individual spines.
(A) Gradual increases of sGluA1 level in newly-formed spines after they were first detected on Dn (n = 16 spines; Student’s t-test); (B) Gradual decreases of sGluA1 level in eliminated spines in days prior to elimination (Dn) (n = 19 spines; Student’s t-test). Blue, average. Grey, individual spines. (C) Heat map of change in spine size within individual spines. (D) Correlation of spine size between day 1 and day 10 in V1 L2/3 neurons (n = 278 spines; Pearson). (E) Correlation between daily change in spine size and daily change in spine sGluA1 level in the subset of spines that have inverse correlations between daily spine size change and sGluA1 change (n = 246 spines; Pearson). (F) Percentage of spines that show an inverse correlation between daily spine size change and spine sGluA1 change (17.77%). (G) Spine sGluA1 level distribution of all spines and spines that have inverse correlations between daily spine size change and sGluA1 change (Invers) (Kolmogorov-Smirnov test, p=0.0013). Data are presented as mean ± SEM. *p<0.05; **p<0.01.
Figure 3 with 1 supplement
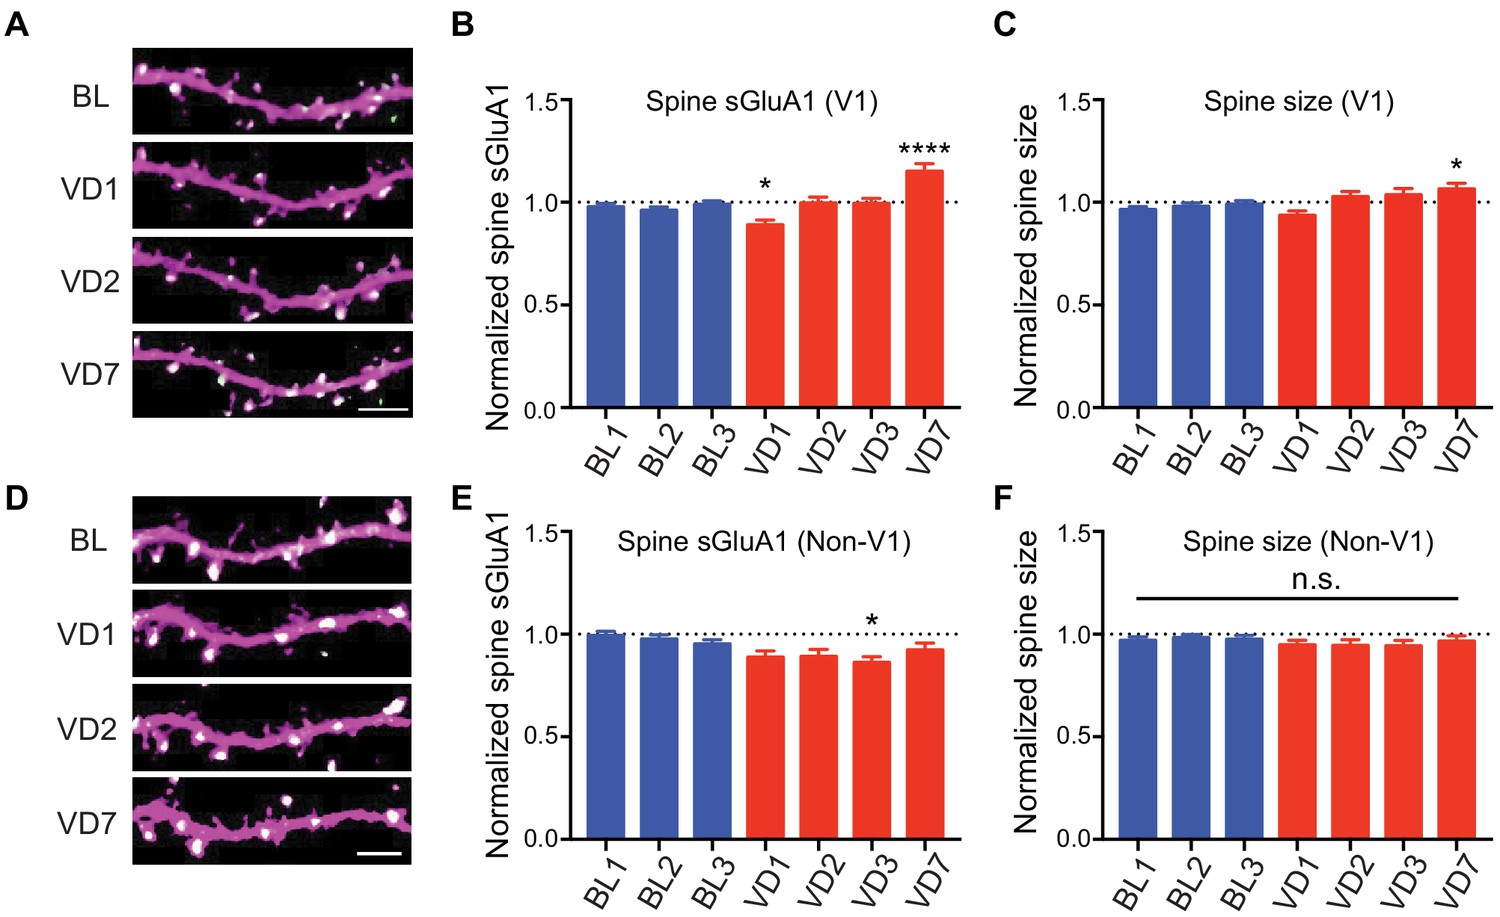
V1-specific spine sGluA1 increases following binocular deprivation.
(A–C) Changes in spine sGluA1 expression and spine size before (baseline, BL) and after visual deprivation (VD) in V1 L2/3 neurons (n = 49 dendrites from eight mice; one-way ANOVA). Scale bar: 5 μm. (D–F) Changes in spine sGluA1 expression and spine size following VD in non-V1 visual cortex (n = 33 dendrites from six mice; one-way ANOVA). Scale bar: 5 μm. Data are presented as mean ± SEM. n.s., not significant; *p<0.05; ****p<0.0001.
Figure 3—figure supplement 1
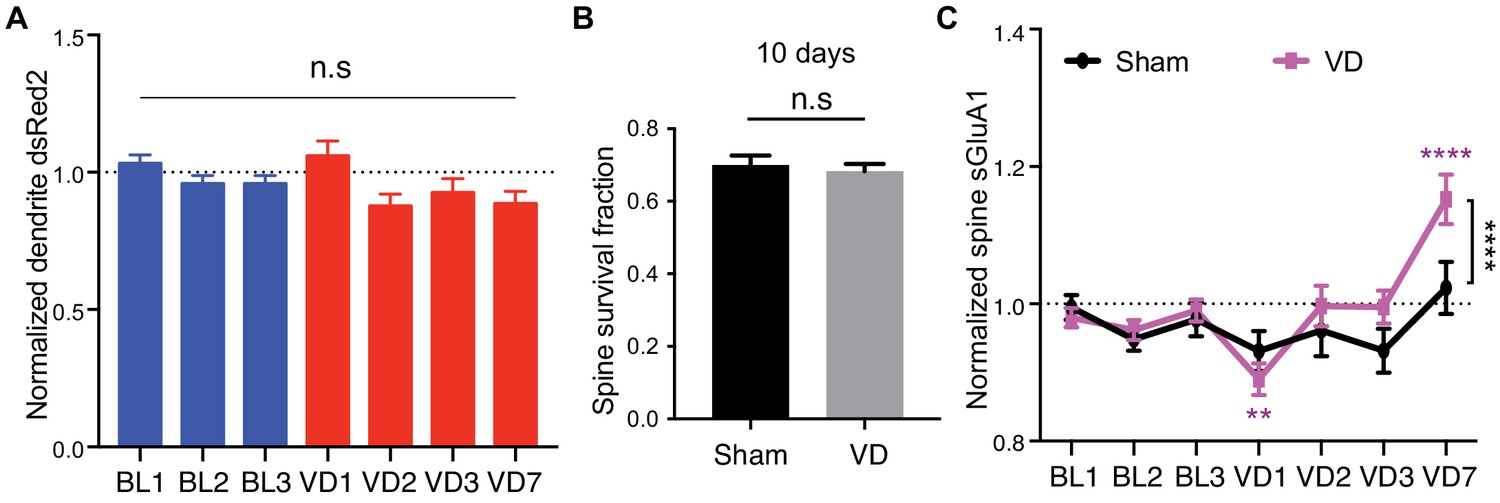
V1-specific spine sGluA1 increases following binocular deprivation.
(A) Changes in dendrite dsRed2 level in mice following VD (n = 49 dendrites from eight mice; one-way ANOVA). (B) 10 days’ spine survival rate in mice with VD or sham-surgery (Sham-surgery: n = 23 dendrites from six mice; VD: n = 49 dendrites from eight mice. two-way ANOVA). (C) Changes in spine sGluA1 signal in mice with VD or sham-surgery (Sham-surgery: n = 23 dendrites from six mice; VD: n = 49 dendrites from eight mice. two-way ANOVA). Data are presented as mean ± SEM. n.s., not significant. **p<0.01; ****p<0.0001.
Figure 4 with 1 supplement
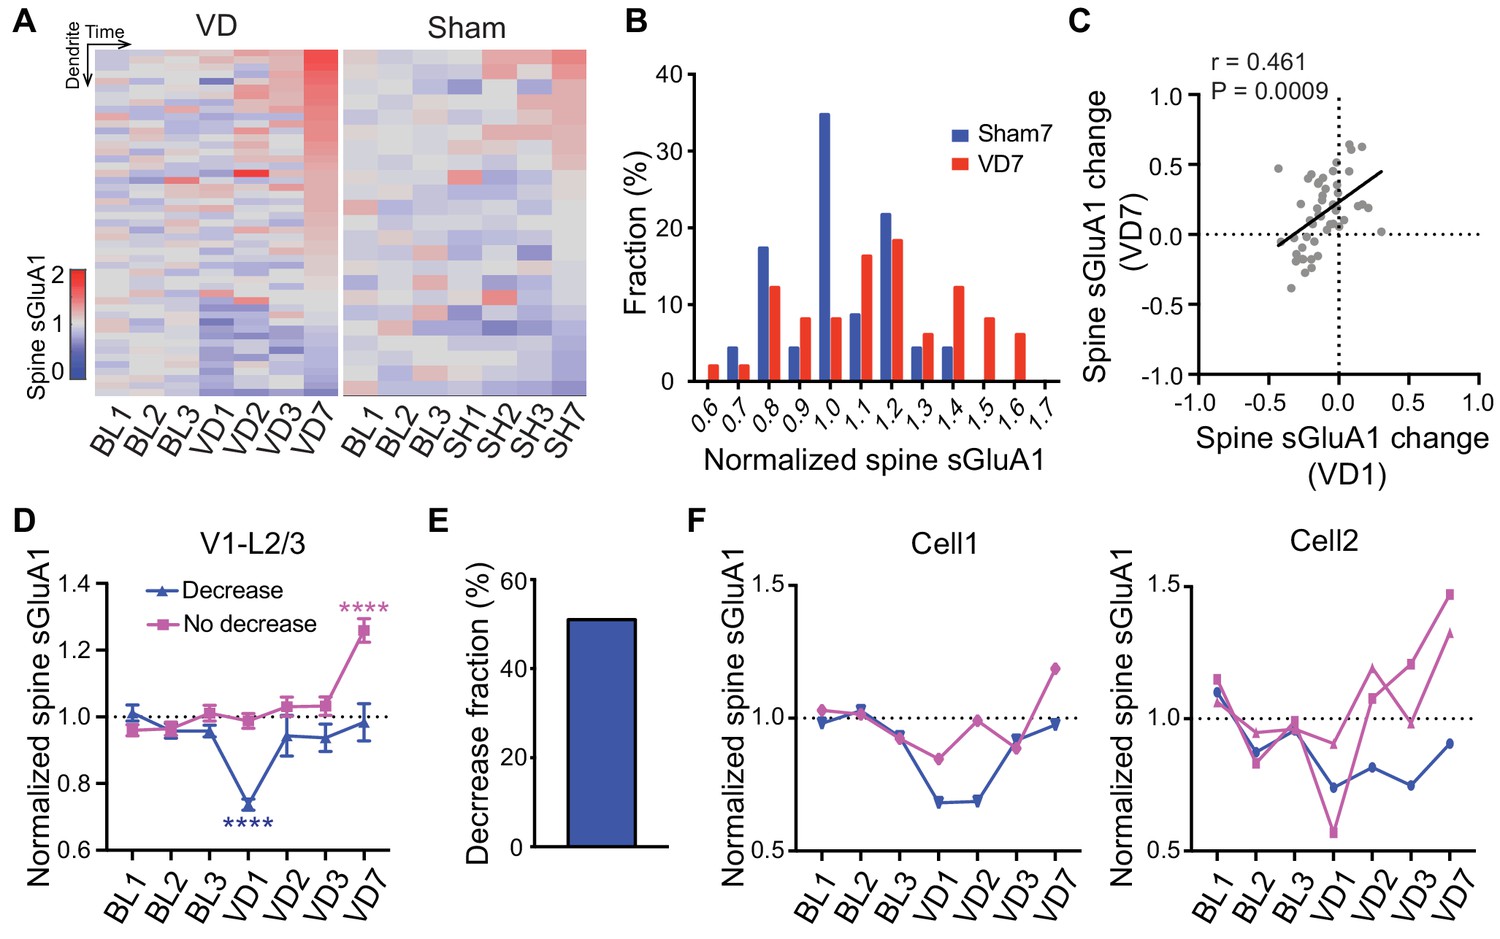
Heterogeneous responses of individual spines to visual deprivation.
(A) Heat map of change in sGluA1 level within individual dendrites in VD and sham-surgery (SH) groups. (B) Histogram of spine sGluA1 changes in dendrites 7 days after VD or sham-surgery (n = 23 dendrites in sham group; n = 49 dendrites in VD group; Kolmogorov-Smirnov test, p=0.079). (C) Correlation between spine sGluA1 changes of individual dendrites at day 1 and day 7 after VD (n = 49 dendrites; Pearson). (D) Changes of spine sGluA1 expression in dendrites that show decrease or no decrease at day 1 following VD in V1 L2/3 neurons. (n = 25 decrease dendrites and n = 24 no decrease dendrites from eight mice; one-way ANOVA). (E) Percentage of dendrites that decrease spine sGluA1 after 1 day of VD (51.02%). (F) Changes in spine sGluA1 of individual dendritic segments from the same V1 L2/3 neuron following binocular enucleation. Each line indicates individual dendritic segment. Data are presented as mean ± SEM. ****p<0.0001.
Figure 4—figure supplement 1
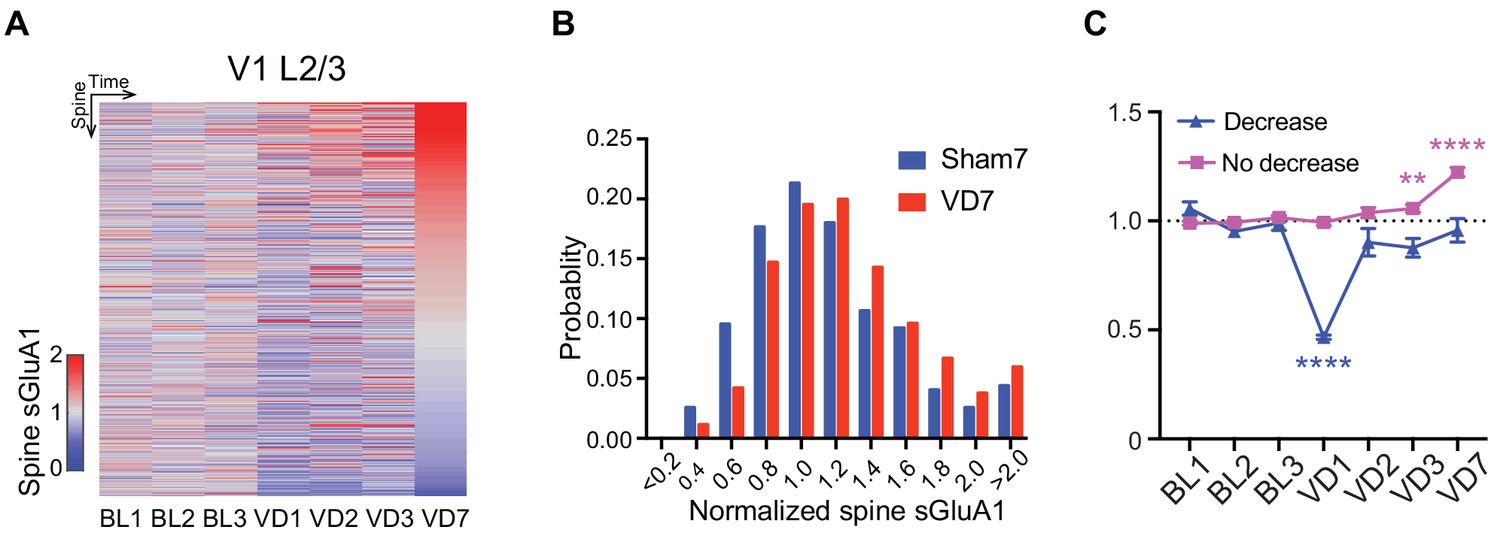
Heterogeneous responses of individual spines to visual deprivation.
(A) Heat map of change in sGluA1 level within individual spines in L2/3 neurons following visual deprivation. (B) Histogram of spine sGluA1 changes in mice with or without 7 days of visual deprivation (n = 272 spines in sham group; n = 690 spines in VD group; Kolmogorov-Smirnov test, p=0.0007). (C) Changes of spine sGluA1 expression in spines that show decrease or no decrease at day 1 following VD in V1 L2/3 neurons. (n = 64 decrease spines and n = 584 no decrease spines from eight mice; one-way ANOVA). **p<0.01; ****p<0.0001.
Figure 5 with 1 supplement
Depth-dependent changes in spine sGluA1 expression after visual deprivation.
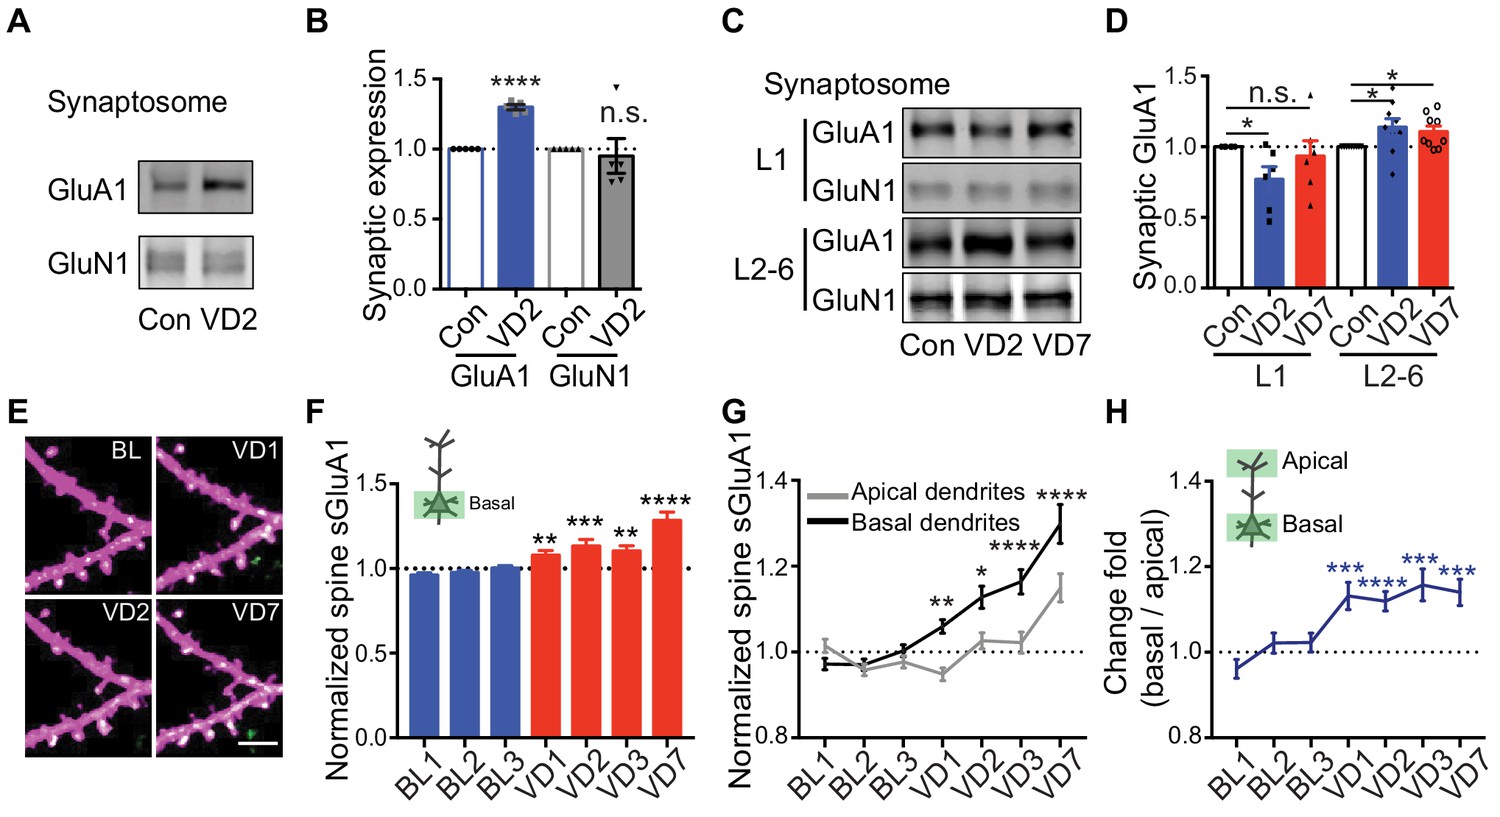
(A and B) Synaptic GluA1 and GluN1 levels in V1 from 2 days’ enucleated or sham-surgery mice (n = 5; Student’s t-test). (C and D) Synaptic GluA1 levels from superficial (L1) and deep (L2-6) layers of V1 (n = 6–9; Student’s t-test). (E and F) Changes in spine sGluA1 on basal dendrites of V1 L2/3 neurons following VD (n = 40 dendrites from six mice; one-way ANOVA). Scale bar: 5 μm. (G) Changes in spine sGluA1 on basal and apical dendrites from the same neurons following VD (n = 16 neurons from seven mice; repeated measure two-way ANOVA). (H) Change ratios of basal dendrites to apical dendrites of the same neurons following VD were significantly larger than 1 (n = 16 neurons from seven mice. one sample t-test). Data are presented as mean ± SEM. n.s., not significant; *p<0.05; **p<0.01; ***p<0.001; ****p<0.0001.
Figure 5—figure supplement 1
Depth-dependent increase of spine sGluA1 in V1-L2/3 neurons.
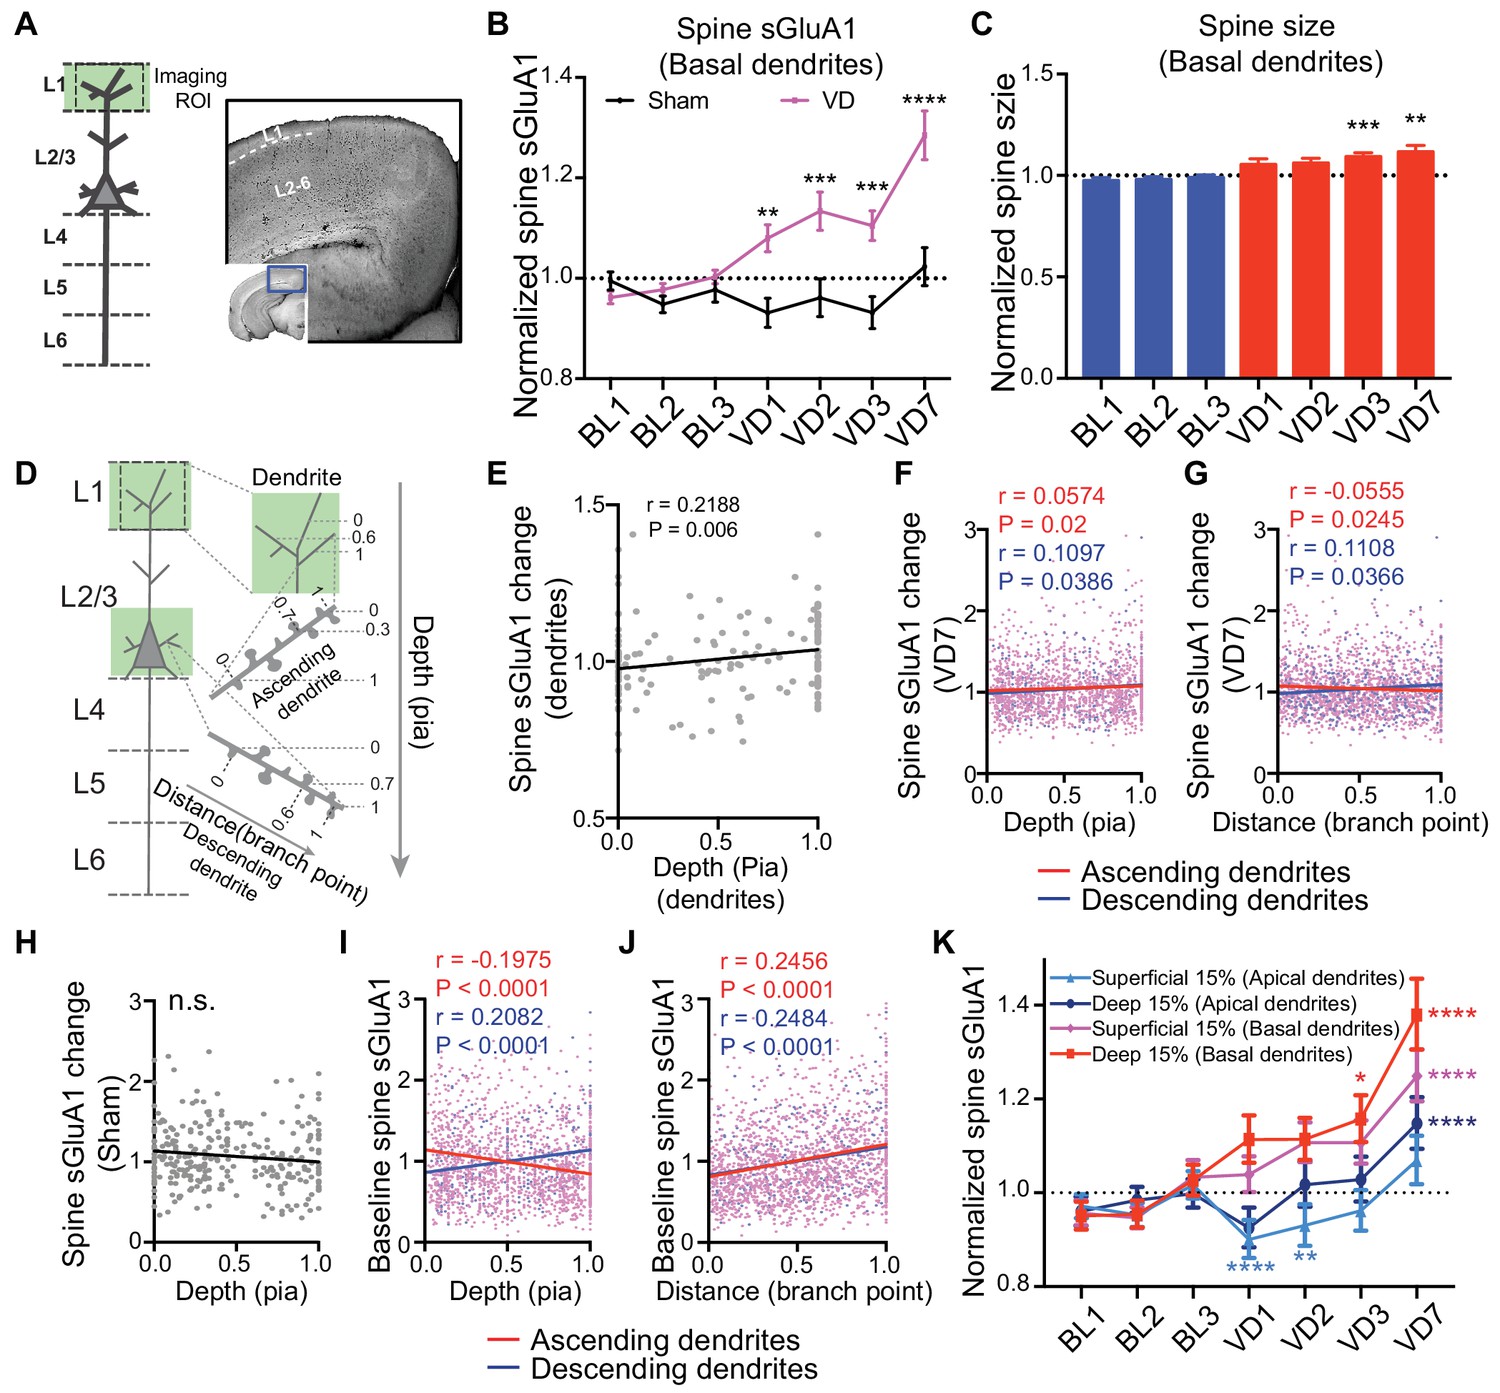
(A) (Left) Schematic of imaging region of interest (ROI); (Right) Staining with trypan blue dye to distinguish L1 from L2-6 for micro-dissection. (B) Changes of spine sGluA1 on basal dendrites in mice with VD or sham-surgery (Sham-surgery: n = 23 dendrites from six mice; VD: n = 40 dendrites from six mice; two-way ANOVA). (C) Changes in spine size on basal dendrites before and after VD (n = 40 dendrites from six mice; one-way ANOVA). (D) Schematic of ascending and descending dendrites from L2/3 neurons. 0 indicates the most superficial dendrite within an imaging ROI or most superficial/proximal spine on a dendritic segment; one indicates the deepest dendrite in an imaging ROI or deepest/most distal spine along a dendrite. (E) Correlation between changes of average sGluA1 level on dendrites and the depth of dendrites from the pia (n = 167 dendrites; Pearson). (F) Correlations between change in spine sGluA1 expression 7 days after VD and spine depth from pia in ascending and descending dendrites (n = 1642 spines from ascending dendrites; n = 1998 spines from descending dendrites; Pearson). (G) Correlations between change in spine sGluA1 signal 7 days after VD and spine distance from dendrite branch point in ascending and descending dendrites (n = 1642 spines from ascending dendrites; n = 1998 spines from descending dendrites; Pearson). (H) Correlation between change in spine sGluA1 expression after 7 days of sham-surgery and spine depth (n = 293 spines; Pearson). (I) Correlations between baseline spine sGluA1 level (imaging day 1) and spine depth (n = 1642 spines from ascending dendrites; n = 1998 spines from descending dendrites; Pearson). (J) Correlations between baseline spine sGluA1 expression (imaging day 1) and spine distance from branch point (n = 1642 spines from ascending dendrites; n = 1998 spines from descending dendrites; Pearson). (K) Changes of spine sGluA1 level in spines located at different depths following 7 days of visual deprivation (n = 188–237 spines; Friedman test). Data are presented as mean ± SEM. n.s., not significant; *p<0.05; **p<0.01; ***p<0.001; ****p<0.0001.
Figure 6 with 1 supplement
Lamina-specific increases of spine sGluA1 following visual deprivation.
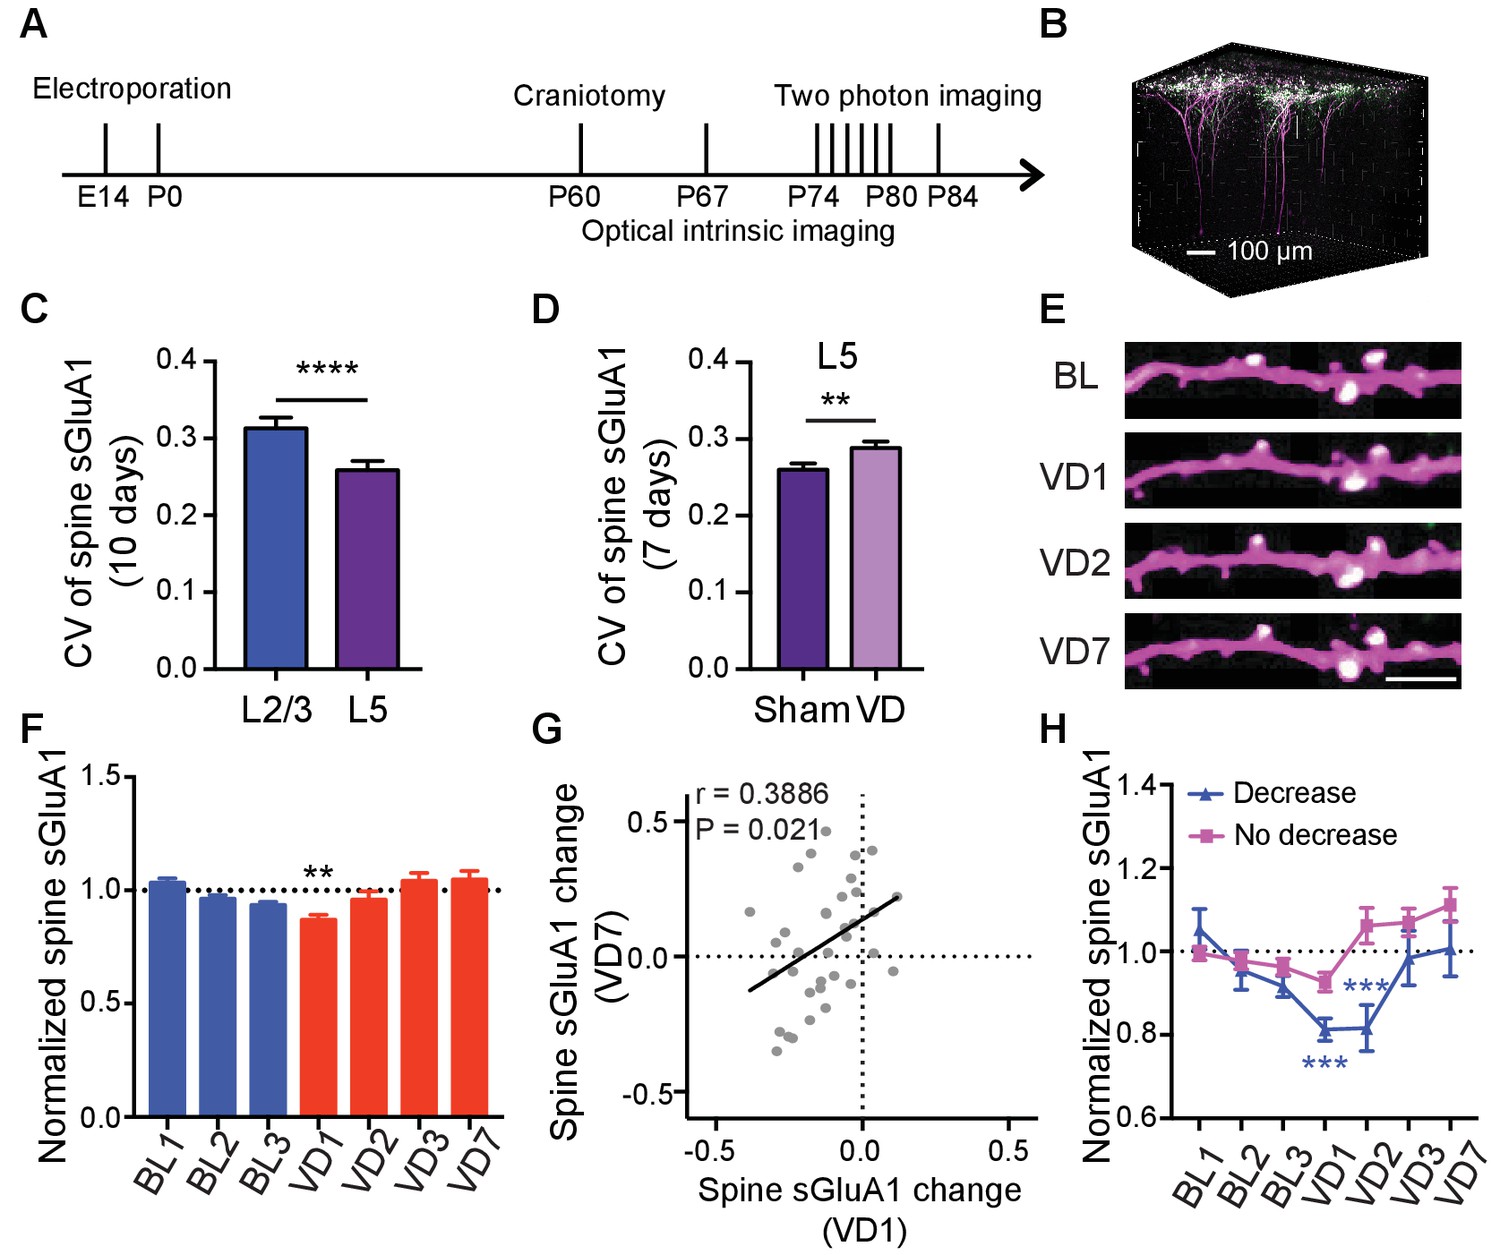
(A) Experimental timeline. (B) 3D reconstruction of L5 neurons of visual cortex transfected with sGluA1 (green) and dsRed2 (magenta), merged in white. (C) Average CV of spine sGluA1 expression in V1 L2/3 and L5 neurons under baseline conditions. (n = 280 spines, L2/3 neurons; n = 256 spines, L5 neurons; Student’s t-test). (D) The CV of spine sGluA1 in L5 neurons before and after visual deprivation. (n = 256/277 (Sham/VD) spines in L5 neurons; Student’s t-test). (E) Representative time-lapse images of L5 apical dendrites. Scale bar: 5 μm. (F) Changes in spine sGluA1 expression on apical dendrites of V1 L5 neurons following VD (n = 35 dendrites from four mice; one-way ANOVA). (G) Correlation between spine sGluA1 changes of individual dendrites in L5 neurons at day 1 and day 7 after VD (n = 35 dendrites; Pearson). (H) Changes of spine sGluA1 expression in cells that show decrease or no decrease at day 1 following VD in L5 neurons. (n = 6 decrease cells and n = 6 no decrease cells from four mice; one-way ANOVA). Data are presented as mean ± SEM. **p<0.01; ***p<0.001; ****p<0.0001.
Figure 6—figure supplement 1
Lamina-specific increases of spine sGluA1 following visual deprivation.
(A) Heat map of sGluA1 expression within individual spines of V1 L5 neurons. Spines on the same dendrites were grouped together. (B) Changes in spine sGluA1 expression in V1 L5 neurons under basal states (n = 29 dendrites from four mice; one-way ANOVA). (C) Changes in spine size in V1 L5 neurons under basal states (n = 29 dendrites from four mice; one-way ANOVA). (D) Percentage of spines that persist across 10 imaging days in L5 neurons from mice with or with visual deprivation. (n = 23/49 (Sham/VD) dendrites). (E) Changes in spine sGluA1 level in mice with sham-surgery or visual deprivation (Sham-surgery: n = 29 dendrites from four mice; VD: n = 35 dendrites from four mice; two-way ANOVA). (F) Changes in spine size in V1 L5 neurons before and after visual deprivation (n = 35 dendrites from four mice; one-way ANOVA). (G) Heat map of change in sGluA1 level within individual dendrites in V1 L5 neurons following visual deprivation. (H) Correlation between changes of average sGluA1 level on dendrites and the depth of dendrites from pia in V1 L5 neurons (n = 34 dendrites; Pearson). (I) Correlations between change in spine sGluA1 level 7 days after VD or sham-surgery and spine depth from the pia in ascending dendrites (n = 181 spines from VD group; n = 268 spines from sham group; Pearson). (J) Correlations between baseline spine sGluA1 expression (imaging day 1) and spine distance from dendrite branch point (n = 298 spines; Pearson). Data are presented as mean ± SEM. n.s., not significant; *p<0.05.
Figure 7 with 1 supplement
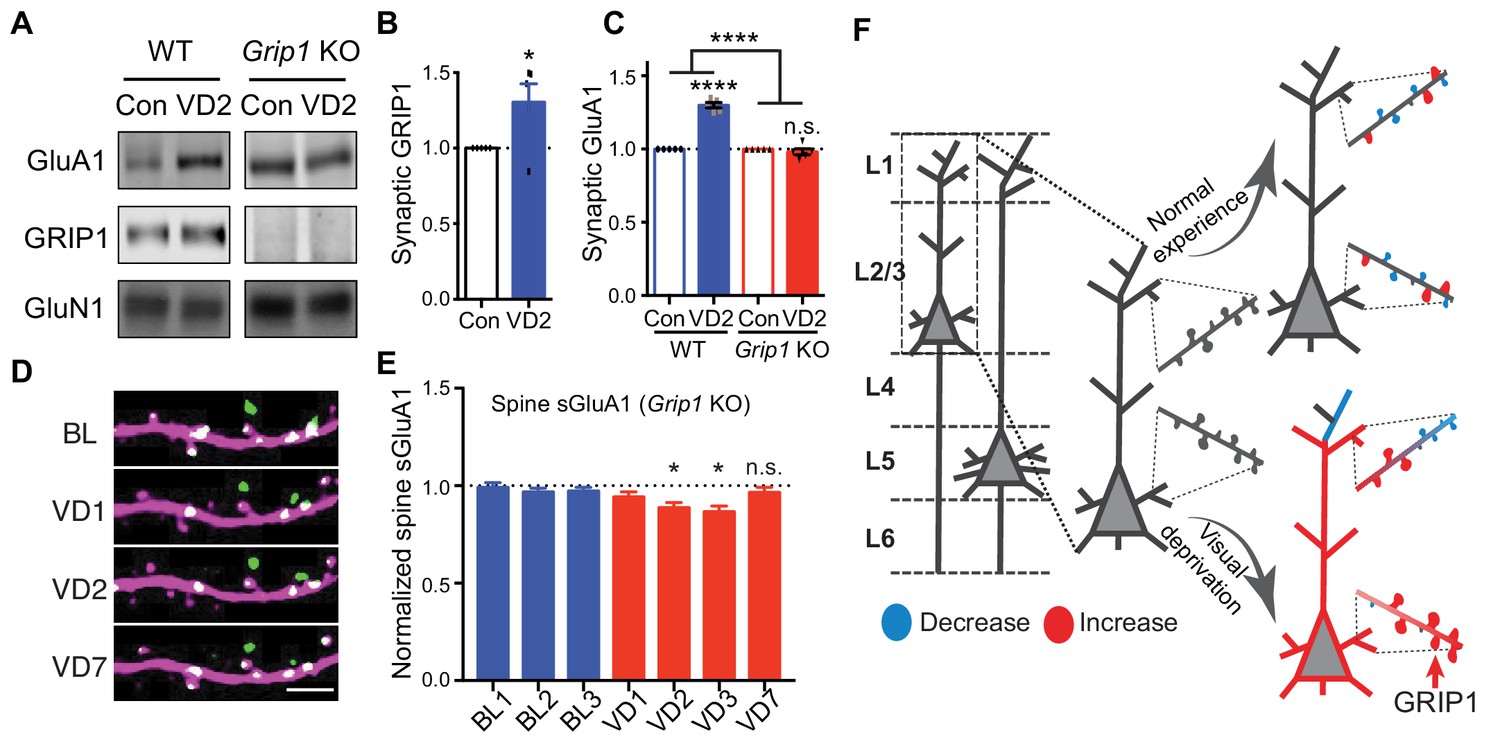
GRIP1-dependent increases of sGluA1 following deprivation.
(A–C) Synaptic GluA1 and GRIP1 levels in V1 from WT and Grip1 knockout (KO) mice with 2 days of sham-surgery or VD (n = 5; Student’s t-test and two-way ANOVA). (D–E) Changes in spine sGluA1 expression on apical dendrites of V1 L2/3 neurons from Grip1 KO mice following VD (n = 32 dendrites from five mice; one-way ANOVA). Scale bar: 5 μm. (F) Model of spine GluA1 dynamics in mice with normal experience or visual deprivation. Data are presented as mean ± SEM. n.s., not significant; *p<0.05; ****p<0.0001.
Figure 7—figure supplement 1
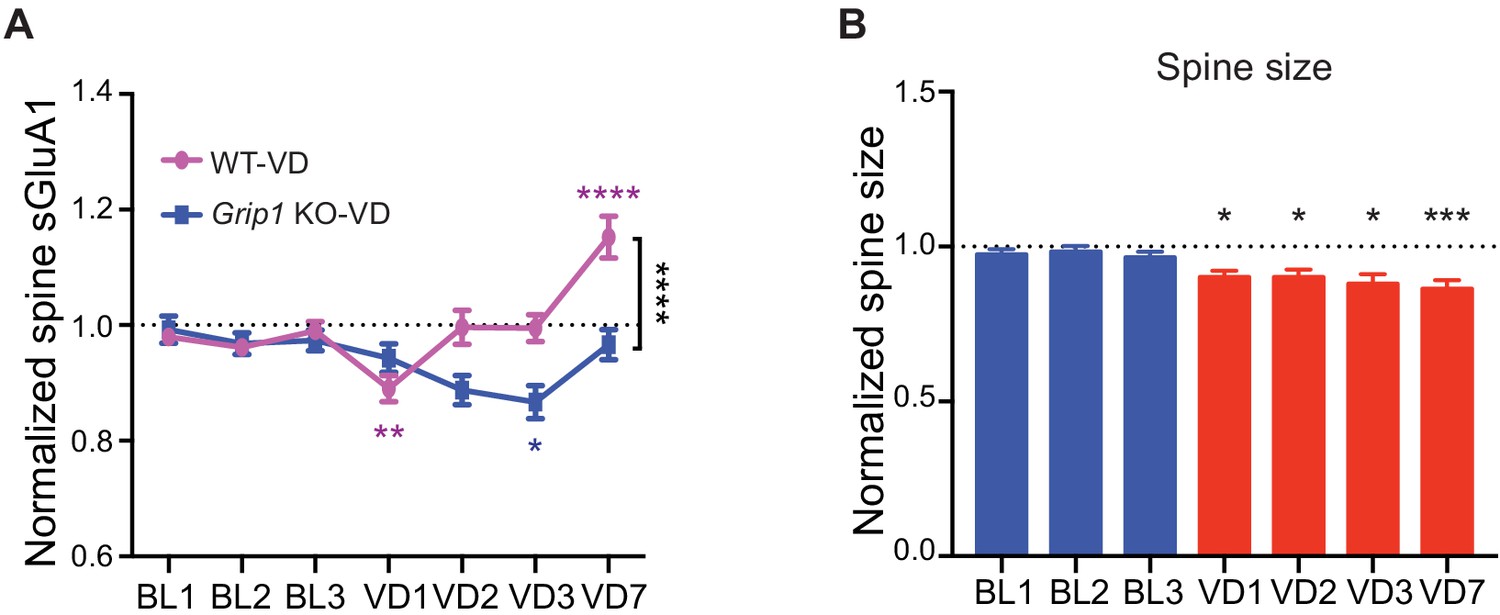
GRIP1-dependent changes in V1 L2/3 neurons following visual deprivation.
(A) Changes in spine sGluA1 following VD in WT mice and Grip1 KO mice (WT-VD: n = 49 dendrites from eight mice; Grip1 KO-VD: n = 32 dendrites from five mice; two-way ANOVA). (B) Changes in spine size following VD in Grip1 KO mice (n = 32 dendrites from five mice; one-way ANOVA). Data are presented as mean ± SEM. *p<0.05; **p<0.01. ***p<0.001. ****p<0.0001.
Scheme 1
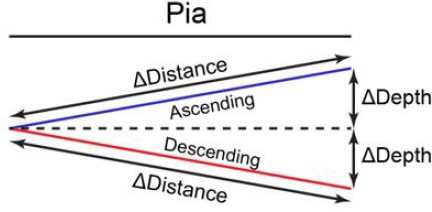
Definitions of ascending dendrites and descending dendrites.
Tables
Key resources table
| Reagent type (species) or resource | Designation | Source or reference | Identifiers | Additional information |
|---|---|---|---|---|
| Antibody | Anti-dsRed2 (rabbit polyclonal) | Clontech | Cat# 632496, RRID:AB_10013483 | 1:1000 |
| Antibody | Anti-GFP (chicken polyclonal) | Abcam | Cat# ab13970, RRID:AB_300798 | 1:1000 |
| Antibody | Alexa Fluor 568 goat anti-rabbit | Thermo Fisher Scientific | Cat# A-11011, RRID:AB_143157 | 1:500 |
| Antibody | Alexa Fluor 488 goat anti-chicken | Thermo Fisher Scientific | Cat# A-11039, RRID:AB_2534096 | 1:500 |
| Antibody | Anti-GluA1 (JH4294) | (Oku and Huganir, 2013) | N/A | |
| Antibody | Anti-GluN1 (JH2590) | (Liao et al., 1999) | N/A | |
| Chemical compound, drug | MNI-caged-L-glutamate | Tocris | Cat#0218, N/A | |
| Strain, strain background | Mouse: WT C57BL/6N | Charles River | Strain #027, RRID:IMSR_CRL:027 | |
| Strain, strain background | Nestin-Grip1 fl/fl mouse | (Takamiya et al., 2008) | N/A | |
| Recombinant DNA reagent | SEP-GluA1 | (Zhang et al., 2015) | N/A | |
| Recombinant DNA reagent | Myc-GluA2 | (Zhang et al., 2015) | N/A | |
| Recombinant DNA reagent | DsRed2 | Clontech | Cat# 632405 | |
| Software, algorithms | MATLAB | Mathworks | https://www.mathworks.com,RRID:SCR_001622 | |
| Software, algorithms | ScanImage | (Pologruto et al., 2003) | https://www.vidriotechnologies.com, RRID:SCR_014307 | |
| Software, algorithms | IGOR Pro | WaveMetrics | https://www.wavemetrics.com /products/igorpro, RRID:SCR_000325 | |
| Software, algorithms | MapManager | (Zhang et al., 2015) | https://mapmanager.net/ | |
| Software, algorithms | ImageJ | (Schneider et al., 2012) | https://imageJ.net/, RRID:SCR_003070 |
Additional files
-
Supplementary file 1
Two-photon imaging of apical dendrites from V1 L2/3 neurons.
Channel 1 (SEP-GluA1 signal).
- https://cdn.elifesciences.org/articles/52420/elife-52420-supp1-v1.zip
-
Supplementary file 2
Two-photon imaging of apical dendrites from V1 L2/3 neurons.
Channel 2 (dsRed2 signal).
- https://cdn.elifesciences.org/articles/52420/elife-52420-supp2-v1.zip
-
Supplementary file 3
Source data of spine sGluA1.
- https://cdn.elifesciences.org/articles/52420/elife-52420-supp3-v1.xlsx
-
Transparent reporting form
- https://cdn.elifesciences.org/articles/52420/elife-52420-transrepform-v1.docx
Download links
A two-part list of links to download the article, or parts of the article, in various formats.
Downloads (link to download the article as PDF)
Open citations (links to open the citations from this article in various online reference manager services)
Cite this article (links to download the citations from this article in formats compatible with various reference manager tools)
Lamina-specific AMPA receptor dynamics following visual deprivation in vivo
eLife 9:e52420.
https://doi.org/10.7554/eLife.52420


