The GTPase Nog1 co-ordinates the assembly, maturation and quality control of distant ribosomal functional centers
- University of Zurich, Switzerland
- ETH Zurich, Switzerland
Figures
Figure 1

Nog1DN accumulates on a cytoplasmic pre-60S.
(A) Domain organization and location of Nog1 on a pre-60S (PDB-3JCT). NTD: N-terminal domain; CTT: C-terminal tail. The black arrow points to the G223A mutation in the G3 motif within the G-domain of Nog1. Selected assembly factors (Mrt4, Nsa2, Tif6, Rlp24, Bud20 and Arx1) that are bound to the pre-60S are shown in color. (B) NOG1-G223A (NOG1DN) is dominant negative. Wild-type cells were transformed with a plasmid encoding NOG1 or NOG1DN under control of the galactose-inducible GAL1 promoter and spotted in 10-fold dilutions on glucose- or galactose-containing media. Plates were incubated at 30°C for 2–4 days. (C) Nog1DN accumulates on a cytoplasmic pre-60S. Early nucleolar (Ssf1-TAP) and cytoplasmic (Lsg1-TAP) particles were isolated from either Nog1- or Nog1DN-expressing cells. Co-enrichment of Nog1 was investigated by Western blotting. Whole-cell extracts (WCEs) depict Nog1 protein levels in the indicated strains. (D) Nog1DN-GFP accumulates in the cytoplasm. Wild-type cells expressing either Nog1-GFP or Nog1DN-GFP under control of GAL1 were grown in raffinose-containing synthetic medium to early log phase and then supplemented with 2% galactose. After 30 min incubation, cells were washed, incubated in YPD for 3 hr and then visualized by fluorescence microscopy. Scale bar = 5 µm. Quantification is listed in Supplementary file 3. WCEs depict Nog1 protein levels in the indicated strains.
Figure 2 with 1 supplement
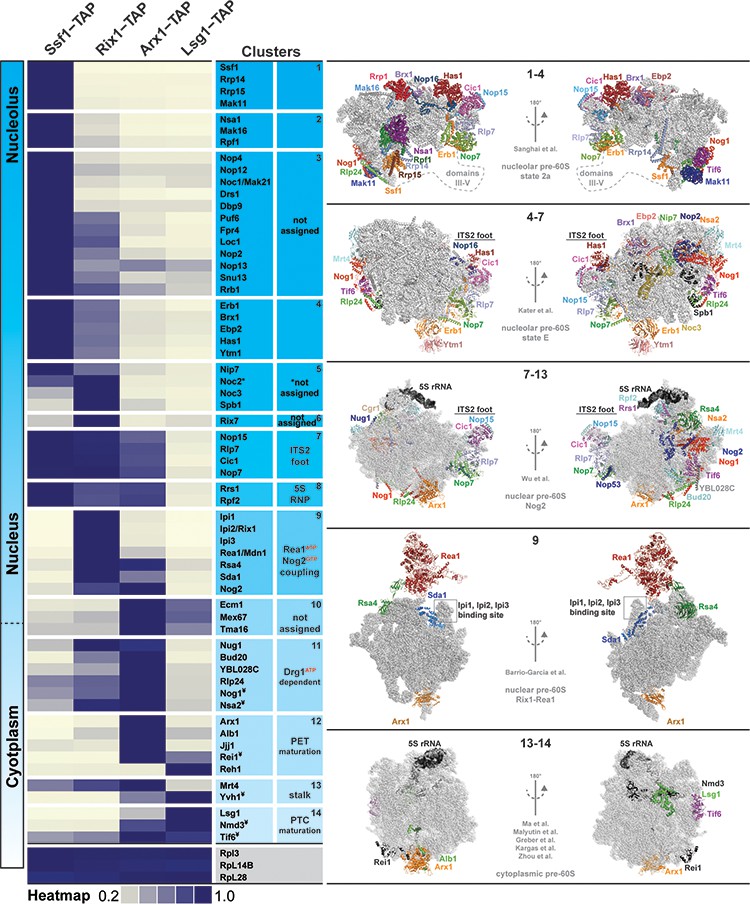
Association of assembly factors with pre-60S at different maturation stages revealed by SWATH-MS.
Pre-60S particles representing nucleolar (Ssf1-TAP), nuclear (Rix1-TAP), nuclear to cytoplasmic (Arx1-TAP) and cytoplasmic (Lsg1-TAP) stages were analyzed by SWATH-MS. A heat map was generated on the basis of the average of three independent biological replicates and depicts the relative and individual enrichment of assembly factors with maturing pre-60S particles. The acquired SWATH data were normalized on the basis of the average intensities of three depicted 60S r-proteins, and the intensity of each factor was scaled to the highest intensity of that factor in the selected condition represented in the heat map. Maximum enrichment is depicted in purple and minimum enrichment in gold. Assembly factors with similar maximum enrichment profiles were then manually grouped into clusters on the basis of the available cryo-EM data (nucleolar pre-60S: PDB-6C0F and PDB-6ELZ; nuclear pre-60S: PDB-3JCT and PDB-5FL8; cytoplasmic pre-60S: PDB-5H4P, PDB-5T62, PDB-5APN, PDB-6RZZ and PDB-6N8N). ¥ depicts factors whose protein levels were analyzed by Western blotting (Figure 2—figure supplement 1).
Figure 2—figure supplement 1
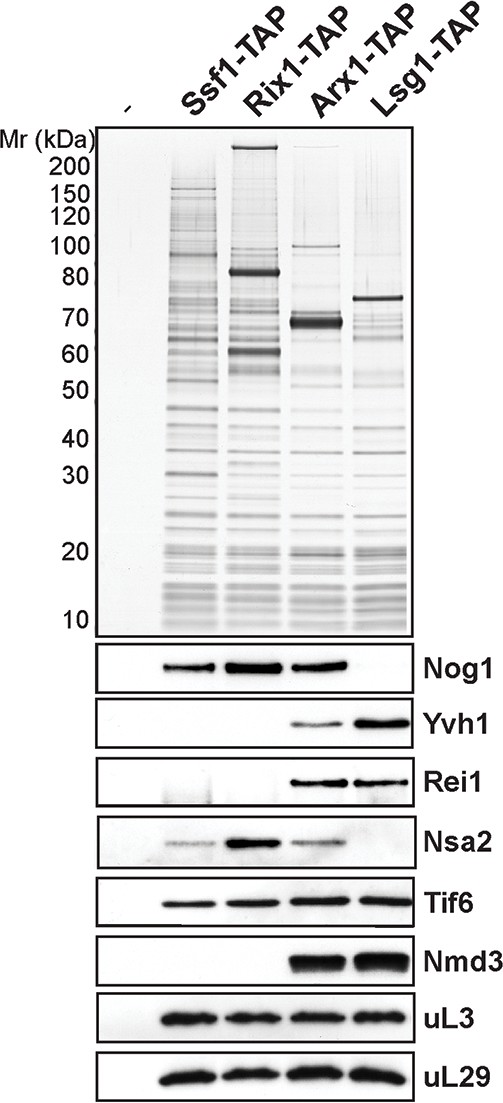
Co-enrichment of assembly factors with a maturing pre-60S subunit.
60S pre-ribosomes representing different maturation stages: nucleolar (Ssf1-TAP), nuclear (Rix1-TAP), nuclear and cytoplasmic (Arx1-TAP) and cytoplasmic (Lsg1-TAP) were purified, and selected assembly factors were analyzed by Western blotting.
Figure 3
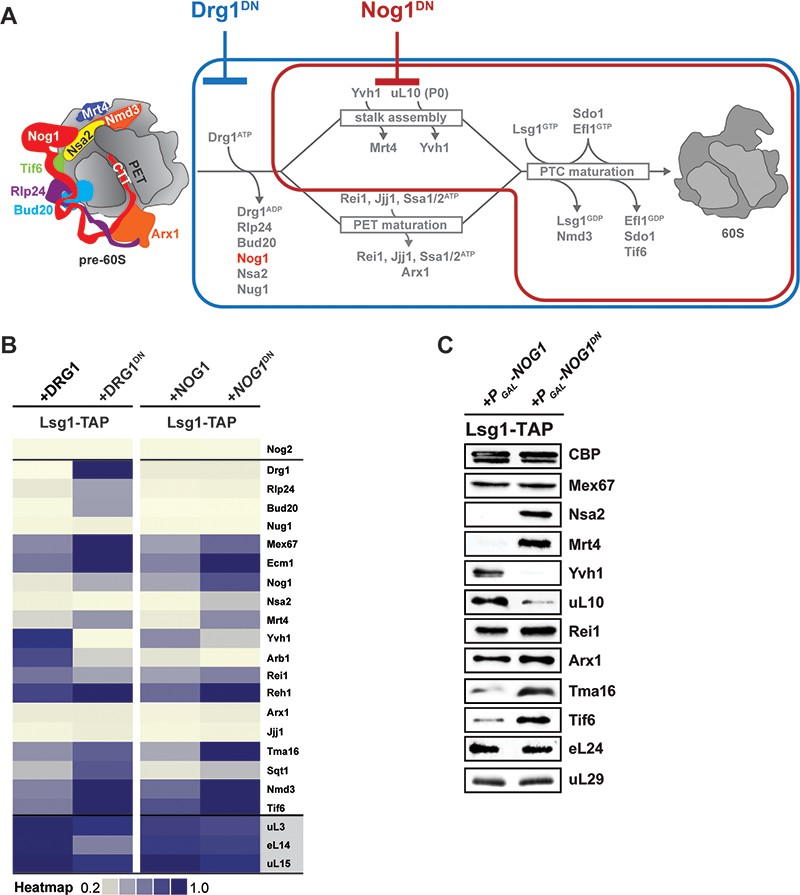
Nog1DN impairs cytoplasmic maturation of a pre-60S.
(A) Current model for the cytoplasmic maturation pathway of a pre-60S. A cytoplasmic pre-60S at different maturation stages is represented as a cartoon. Energy-consuming assembly factors are indicated with ATP or GTP. Events that are impaired by Drg1DN and Nog1DN expression are highlighted in blue and red, respectively. (B) SWATH-MS analysis of Lsg1-TAP pre-60S in Drg1DN- and Nog1DN-expressing cells. Assembly factors accumulating on the pre-60S particle in a Drg1- or Nog1-dependent manner were clustered on the basis of their increased enrichment. (C) Western analyses of selected pre-60S assembly factors involved in cytoplasmic maturation. Nog1DN-trapped Lsg1-TAP particles were subjected to Western analysis using the indicated antibodies. CBP: calmodulin-binding peptide present in the Lsg1 TAP-tag.
Figure 4
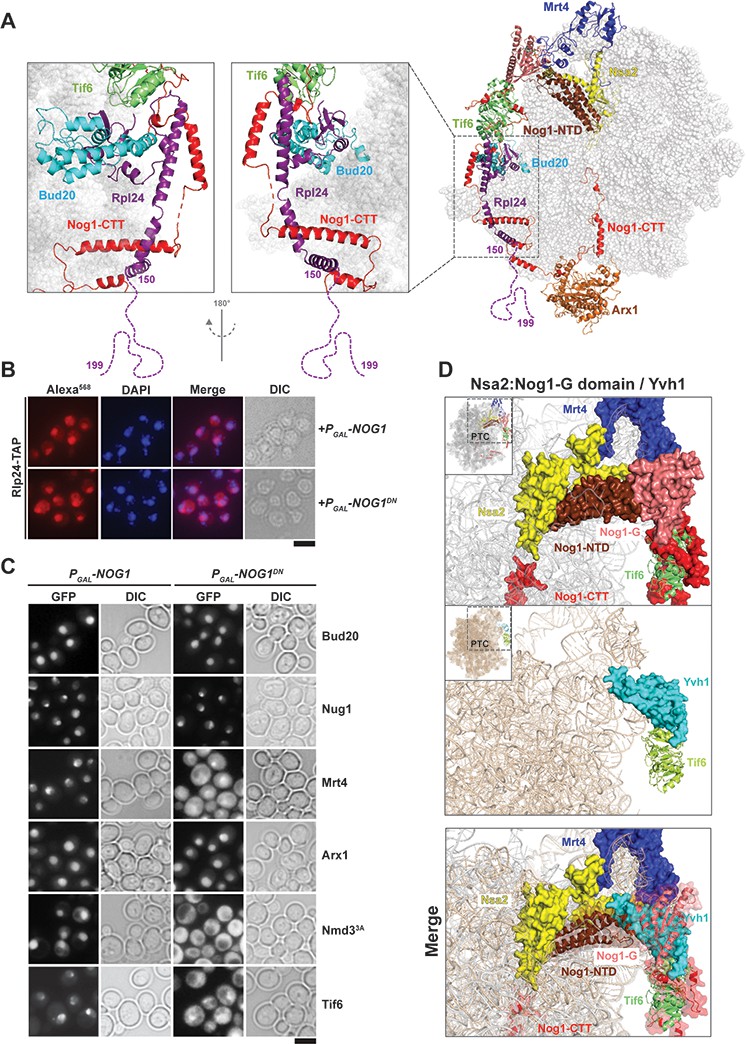
Nog1DN impairs stalk assembly and terminal maturation steps.
(A) Cryo-EM structure (PDB-3JCT) of a Nog1-containing pre-60S particle, depicting the interaction between Rlp24 and Nog1. (B) A RLP24-TAP strain expressing NOG1 or NOG1DN under the control of GAL1 was grown in raffinose-containing synthetic medium to early log phase, then supplemented with 2% galactose, and further grown for 3 hr. Cells were then fixed and prepared for indirect immunofluorescence using an anti-Protein A antibody. Cells were visualized by fluorescence microscopy. Scale bar = 5 µm. Quantification is listed in Supplementary file 3. (C) The indicated GFP-tagged strains expressing NOG1 or NOG1DN under control of GAL1 were grown as in panel (B) and then visualized by fluorescence microscopy. Scale bar = 5 µm. Quantification of the data is listed in Supplementary Table 2. (D) Yvh1 clashes with the Nsa2:Nog1-G domain. Cryo-EM structures of nuclear Nog1-containing (PDB-3JCT) and late cytoplasmic Yvh1-containing (PDB-6RZZ) pre-60S particles were superimposed. Release of the Nsa2:Nog1-G domain complex allows recruitment of Yvh1 to the pre-60S.
Figure 5
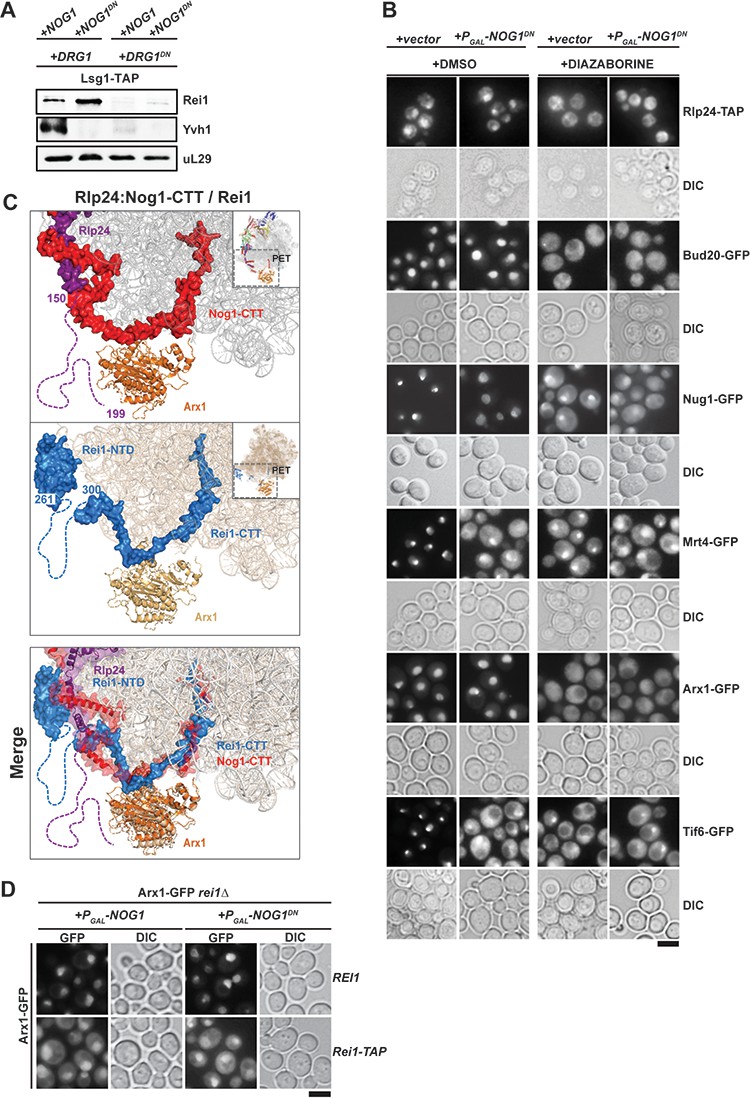
Nog1DN does not impair PET maturation and quality control.
(A) Drg1DN impairs Yvh1 and Rei1 recruitment, whereas Nog1DN impairs only Yvh1 and not Rei1 recruitment. Lsg1-TAP was co-transformed with plasmids each expressing copper-inducible Drg1 or Drg1DN and galactose-inducible Nog1 or Nog1DN, respectively. Cells were grown in raffinose-containing synthetic medium to early log phase and then supplemented with 0.5 mM copper sulphate and 2% galactose. After 3 hr, cells were lysed, and the Lsg1-TAP particle was isolated and subjected to Western analyses using indicated antibodies. (B) Indicated strains expressing Nog1DN under the control of GAL1 were treated with DMSO or diazaborine to block Drg1 activity and visualized by fluorescence microscopy as in Figure 4. Scale bar = 5 µm. Quantification of the data is listed in Supplementary Table 2. (C) The Rei1-binding site on the pre-60S clashes with the Nog1-CTT:Rlp24 complex. Cryo-EM structures of Nog1-containing (PDB-3JCT) pre-60S and a Rei1-containing (PDB-6RZZ) pre-60S were superimposed. Release of Rlp24 allows recruitment of Rei1 to the pre-60S. (D) Arx1 mislocalizes to the cytoplasm in a rei1-TAP mutant expressing NOG1DN. The ARX1-GFP rei1Δ strain was transformed with either REI1- or rei1-TAP-encoding plasmids under control of their natural promoter. Subsequently, the resultant strains were transformed with plasmids encoding galactose-inducible NOG1 or NOG1DN, respectively. The transformants were grown in raffinose-containing medium to early log phase and then supplemented with 2% galactose. After 3 hr, cells were visualized by fluorescence microscopy. Scale bar = 5 µm. Quantifications are listed in Supplementary file 3.
Figure 6

The Nog1-CTT:Rlp24 complex negatively regulates PET maturation.
(A) Domain organization of Nog1 and Rlp24 showing interaction surfaces, and sites for truncation analyses. (B) Growth analysis of Nog1 truncations. Left panel: a Nog1 shuffle strain was transformed with the indicated constructs and spotted in 10-fold dilutions 5′-fluoroorotic acid (5-FOA) (SD) plates and incubated for 2–6 days at the indicated temperatures. Right panel: a nog1Δ shuffle strain was transformed with the indicated plasmids. After shuffling out the URA3-NOG1 plasmid on FOA-containing plates, strains were spotted in 10-fold serial dilutions on YPD plates and incubated for 2–4 days at the indicated temperatures. (C) Rlp24:Nog1 interactions contribute to early nucleolar/nuclear maturation. Left panel: BY wild-type cells were transformed with the indicated plasmids under control of the galactose-inducible GAL1 promoter and spotted in 10-fold dilutions on glucose- or galactose-containing media. Plates were incubated at 30°C for 2–4 days. Right panel: Mrt4-GFP, Arx1-GFP and Tif6-GFP strains were transformed with the indicated plasmids under control of the GAL1 promoter. Cells were grown in raffinose-containing synthetic medium to early log phase and then supplemented with 2% galactose. After 3 hr, cells were visualized by fluorescence microscopy. Scale bar = 5 µm. Quantifications are listed in Supplementary file 3. (D) Drg1-mediated release of Rlp24 from Nog1 is required for PET assembly. Nog1 shuffle strains containing GFP-tagged versions of assembly factors were transformed with Nog1 and Nog11–479 encoding plasmids. After shuffling out URA3-NOG1 plasmid on 5-FOA, the resultant strains were grown in YPD and were treated with DMSO or diazaborine (DIA) for 30 mins to inhibit Drg1-ATPase activity. The GFP tagged assembly factor was visualized by fluorescence microscopy. Scale bar = 5 µm. Quantifications are listed in Supplementary file 3.
Figure 7

Nog1DN blocks the terminal cytoplasmic maturation steps.
(A) Nog1DN impairs recycling of Mrt4 and Tif6. The mrt4Δyvh1Δ strain was co-transformed with plasmids encoding Mrt4-GFP or Mrt4G68E-GFP and Yvh1 or galactose-inducible Nog1DN, respectively. To monitor Tif6 localization, the strain was co-transformed with plasmids encoding Tif6-GFP, Mrt4 or Mrt4G68E-GFP and Yvh1 or galactose-inducible Nog1DN, respectively. Cells were grown in raffinose-containing synthetic medium to early log phase and then supplemented with 2% galactose. After 3 hr, cells were visualized by fluorescence microscopy. Scale bar = 5 µm. Quantifications are listed in Supplementary file 3. (B) Mrt4G68E bypasses the need for YVH1, but does not rescue lethality associated with Nog1DN expression. The depicted strains were spotted in 10-fold dilutions on galactose-containing media and incubated at 30°C for 2–4 days. (C) Nog1DN impairs recruitment of Yvh1, but not release of the Mrt4-G68E gain-of-function mutant. A Lsg1-TAP mrt4Δ strain was co-transformed with plasmids encoding Mrt4 or Mrt4G68E and empty vector or galactose-inducible Nog1DN, respectively. Cells were grown in raffinose-containing synthetic medium to early log phase and then supplemented with 2% galactose. After 3 hr, cells were lysed, purified through Lsg1-TAP and subjected to western analyses using the indicated antibodies. (D) Nog1 release permits uL16 recruitment. Superimposition of the cryo-EM structures of a nuclear Nog1-containing pre-60S particle (PDB-3JCT) and uL16 on a mature 60S subunit (PDB-6R84) show how the Nog1-NTD and Nog1 G-domain prevent recruitment of uL16 to the pre-60S.
Figure 8

A revised model for cytoplasmic maturation of the pre-60S.
Drg1 initiates the 60S cytoplasmic maturation pathway by binding to and releasing Rlp24 from the pre-60S bound Rlp24:Nog1-CTT complex in an ATP-dependent manner (State I to State II). Removal of Rlp24 also releases its interacting partner Bud20, and consequently extracts the Nog1 C-terminal tail out of the polypeptide exit tunnel (PET) (State II). Extraction of Nog1-CTT from the PET, permits Rei1-CTT to probe PET integrity (State III). Successful Rei1-CTT insertion into the PET triggers ATP-dependent release of Arx1 by Ssa1/2 and Jjj1, and concurrent Rei1 eviction (State III to State IV). This permits Reh1-CTT insertion into the PET (State IV). Nog1 release permits Yvh1 recruitment to evict Mrt4 and to initiate stalk assembly (State IV to State V). Nog1 eviction also permits eL40 and uL16 incorporation, and Nsa2 release. Stable uL16 accommodation into the pre-60S leads to Lsg1 mediated Nmd3 release, and thereby completes PET maturation. Nmd3 release triggers Reh1 release, and also licenses the GTPase Efl1 and co-factor Sdo1 to evict Tif6 (State V to State VI), thus driving a pre-60S towards translation competence.
Author response image 1
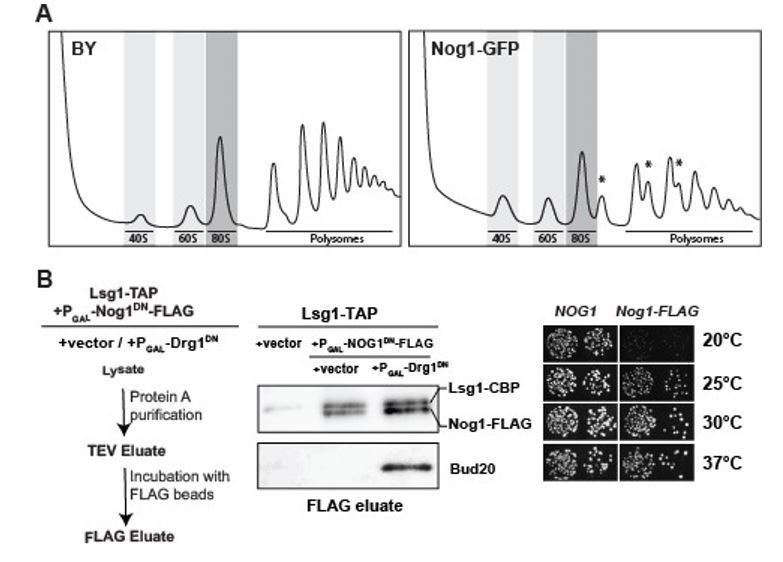
Functional analyses of yeast mutants expressing Nog1-GFP and Nog1-FLAG.
(A) Polysome profile analysis of Nog1-GFP. Wild-type and Nog1-GFP strains were grown in YPD at 30°C to mid-log-phase. Cell extracts were prepared after cycloheximide treatment and subjected to sedimentation centrifugation on 7-50% sucrose density gradients (Altvater et al., 2012). Halfmers are indicated with asterisks. (B) Left panel: Work flow depicting sequential ProteinA (Lsg1-TAP) and FLAG purification (Nog1DN-FLAG) from the indicated strains. Middle panel: Nog1DN-FLAG tail remains accessible for purification. Lsg1-TAP strain was transformed with either vector or Nog1DNFLAG under GAL1 promoter. Subsequently, either vector or with Drg1DN under GAL1 promoter were transformed. The resultant strains were grown in raffinose-containing synthetic medium and induced with 2% galactose for 3 hours. After sequential ProteinA and FLAG purifications, the eluates were analyzed by Western blotting using indicated antibodies. Right panel: Nog1-FLAG strain is growth impaired at 20 and 25 degrees. A nog1Δ shuffle strain was transformed with plasmids encoding either Nog1 or Nog1-FLAG plasmids. After shuffling out the URA3-NOG1 plasmid on FOA-containing plates, the resultant strains were spotted in 10-fold serial dilutions on YPD plates and incubated for 2-4 days at the indicated temperatures.
Author response image 2
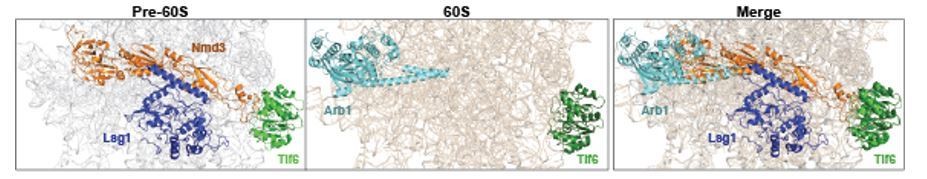
Arb1 location on a mature 60S clashes with Nmd3 binding site on a pre-60S.
Cryo-EM structures of Nmd3-containing (PDB-6RZZ, Kargas et al., 2019) pre-60S and Arb1-containing (PDB-6R84, Su et al., 2019) mature 60S subunit were superimposed. Surprisingly, Arb1 binds to a region of rRNA, which overlaps with the binding site of Nmd3 on the pre-60S. We speculate that Nmd3 release allows Arb1 recruitment to the pre-60S during final cytoplasmic maturation.
Additional files
-
Supplementary file 1
List of yeast strains used in this study.
- https://cdn.elifesciences.org/articles/52474/elife-52474-supp1-v2.docx
-
Supplementary file 2
List of plasmids used in this study.
- https://cdn.elifesciences.org/articles/52474/elife-52474-supp2-v2.docx
-
Supplementary file 3
Quantification of microscopy data.
The average fraction of >1000 cells showing stronger nuclear fluorescence than cytoplasmic (fn) from three independent experiments.
- https://cdn.elifesciences.org/articles/52474/elife-52474-supp3-v2.docx
-
Transparent reporting form
- https://cdn.elifesciences.org/articles/52474/elife-52474-transrepform-v2.pdf
Download links
A two-part list of links to download the article, or parts of the article, in various formats.
Downloads (link to download the article as PDF)
Open citations (links to open the citations from this article in various online reference manager services)
Cite this article (links to download the citations from this article in formats compatible with various reference manager tools)
The GTPase Nog1 co-ordinates the assembly, maturation and quality control of distant ribosomal functional centers
eLife 9:e52474.
https://doi.org/10.7554/eLife.52474


