c-Maf restrains T-bet-driven programming of CCR6-negative group 3 innate lymphoid cells
- Laboratory of Innate Immunity, Department of Microbiology, Infectious Diseases and Immunology, Charité-Universitätsmedizin Berlin, Germany
- Mucosal and Developmental Immunology, Deutsches Rheuma-Forschungszentrum, Germany
- Chronic Immune Reactions, Deutsches Rheuma-Forschungszentrum, Germany
- Therapeutic Gene Regulation, Deutsches Rheuma-Forschungszentrum, Germany
- Chronic Inflammation, Deutsches Rheuma-Forschungszentrum, Germany
- Belozersky Institute of Physico-Chemical Biology and Biological Faculty, M.V. Lomonosov Moscow State University, Russian Federation
Figures
Figure 1 with 1 supplement
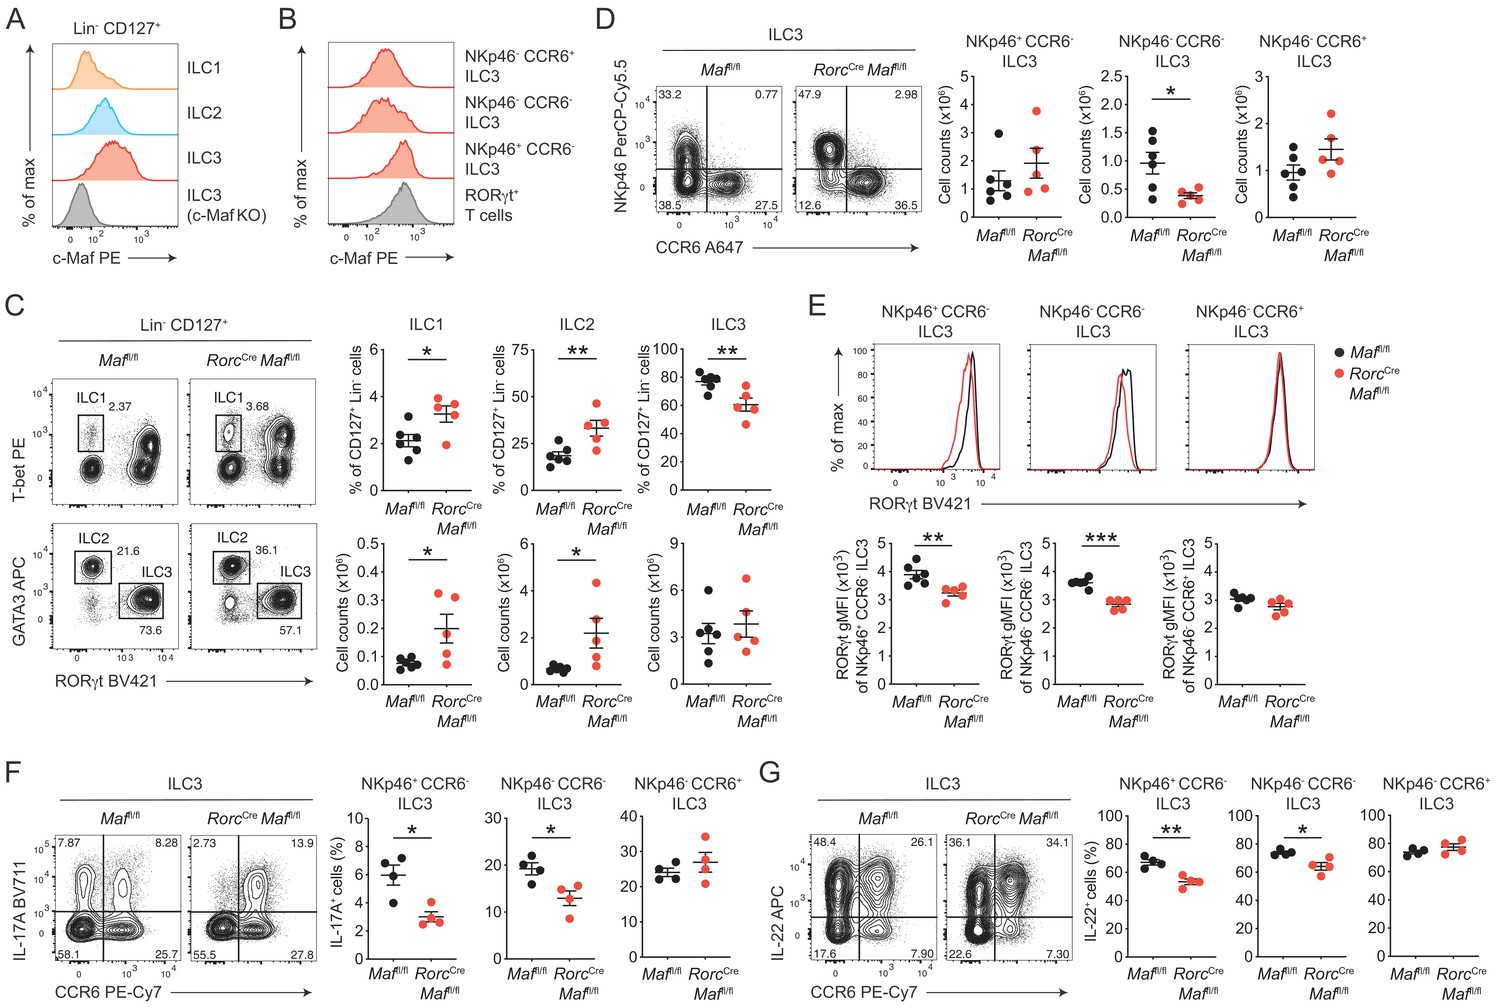
c-Maf is required to maintain the type 3 phenotype of CCR6- ILC3s.
(A) Protein expression of c-Maf by ILC1s, ILC2s and ILC3s isolated from the siLP of naïve C57BL/6N wild-type mice as measured by flow cytometry (pregated on viable Lin- CD127+ cells). Representative histograms show c-Maf expression. (B) Representative histograms showing expression of c-Maf by different siLP ILC3 subsets and RORγt+ T cells as comparison. (C) Frequencies and total numbers of ILC1s, ILC2s and ILC3s from siLP of RorcCre Maffl/fl and control mice as measured by flow cytometry (pregated on viable Lin- CD127+ cells). Representative flow cytometric profiles of RORγt vs. T-bet and GATA3 expression (left); right, quantification (n = 5–6, mean ± SEM, *p<0.05, **p<0.01). (D) Total numbers of different siLP ILC3 subsets of RorcCre Maffl/fl and control mice as measured by flow cytometry. Representative flow cytometric profiles of NKp46 vs. CCR6 expression (left); right, quantification (n = 5–6, mean ± SEM, *p<0.05). (E) Expression of RORγt by different siLP ILC3 subsets from RorcCre Maffl/fl and control mice. Representative histograms (upper panel) show RORγt expression. Graphs below show quantification of RORγt gMFI (n = 5–6, mean ± SEM, **p<0.01, ***p<0.001). (F, G) Frequencies of IL-17A and IL-22 positive cells among different siLP ILC3 subsets of RorcCreMaffl/fl and control mice after ex vivo restimulation with PMA/ionomycin and IL-23. Representative flow cytometric profiles of IL-17A or IL-22 vs. CCR6 are shown on the left; quantification on the right (n = 4, mean ± SEM, *p<0.05, **p<0.01). Data are representative of three independent experiments. Statistical differences were tested using an unpaired Students’ t-test (two-tailed).
Figure 1—figure supplement 1
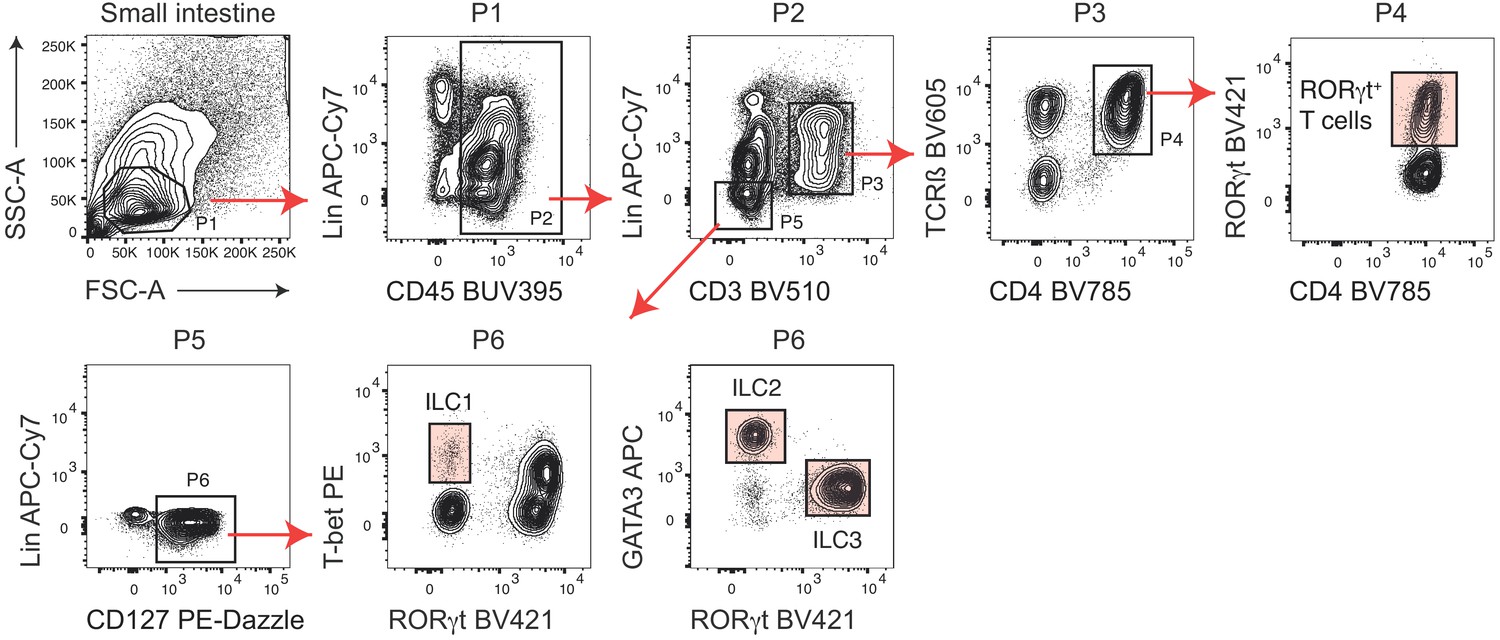
Gating strategy to identify intestinal ILC1s, ILC2s, ILC3s and RORγt+ T cells.
Representative flow cytometric staining of siLP cells with different lineage-defining surface markers and transcription factors. ILCs were defined as CD45+ Lineage- (Lin-) CD3- CD127+ cells. ILC1s were additionally defined as RORγt- T-bet+, ILC2s as RORγt- GATA3+ and ILC3s as RORγt+. Lineage includes anti-B220, anti-Gr1, anti-FcεRIα, anti-F4/80, anti-CD11c, anti-CD11b and anti-CD5. RORγt+ T cells were pregated on CD45+ CD3+ CD4+ TCRß+ cells.
Figure 2 with 2 supplements
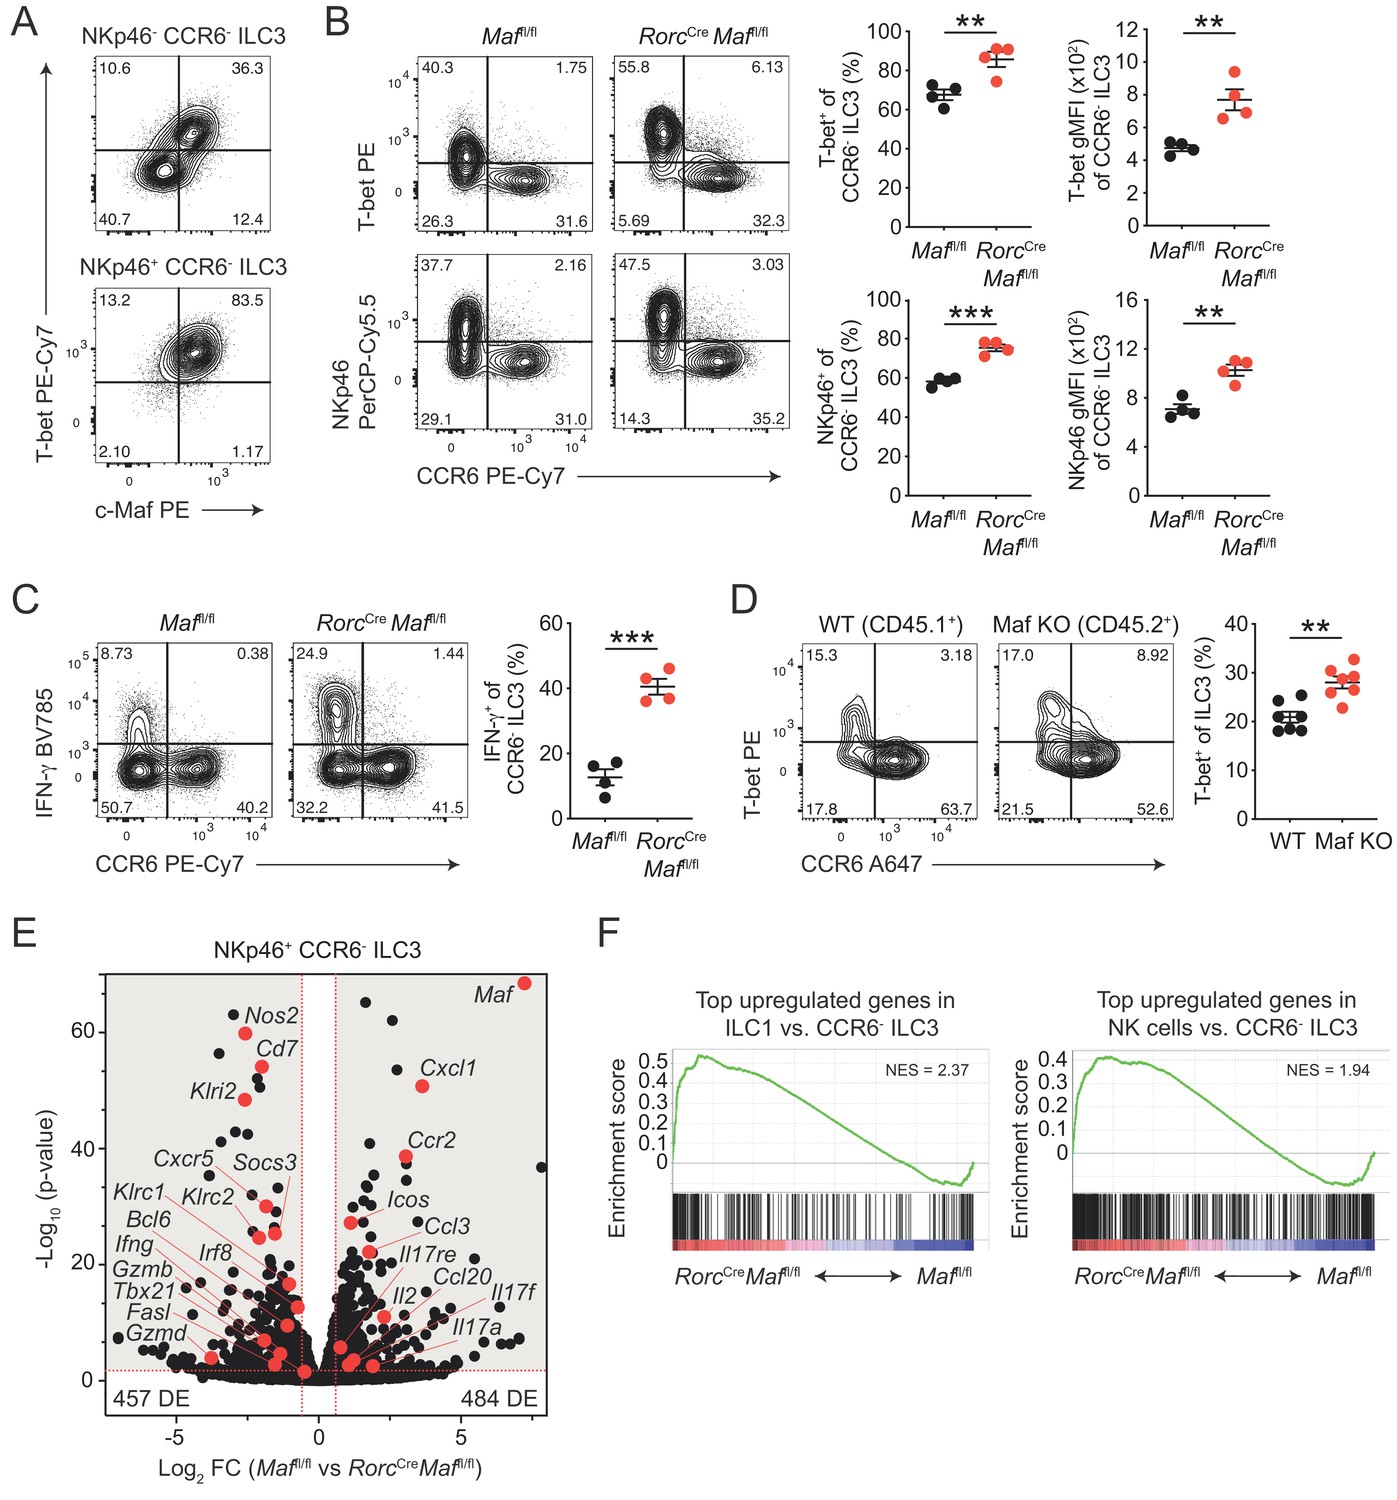
CCR6- ILC3s acquire a hyper type 1 phenotype in the absence of c-Maf.
(A) Representative flow cytometric profiles of T-bet vs. c-Maf expression by siLP NKp46+ and NKp46- CCR6- ILC3s. (B) T-bet and NKp46 expression (frequency and gMFI) by siLP CCR6- ILC3s of RorcCreMaffl/fl and control mice. Representative flow cytometric profiles are shown on the left; quantification on the right (n = 4, mean ± SEM, **p<0.01, ***p<0.001). (C) Frequency of IFN-γ positive cells among siLP CCR6- ILC3s of RorcCreMaffl/fl and control mice after ex vivo restimulation with PMA/ionomycin and IL-23. Representative flow cytometric profiles are shown on the left; quantification on the right (n = 4, mean ± SEM, ***p<0.001). (D) Analysis of mixed bone marrow chimeras of CD45.1+ wild-type and CD45.2+ RorcCreMaffl/f (Maf KO) bone marrow cells. Pregated on viable Lin- CD127+ CD90.2+ RORγt+ cells. Recipient mice were CD90.1 positive. Representative flow cytometric profiles of T-bet vs. CCR6 expression are shown left; quantification on the right (n = 7, mean ± SEM, **p<0.01). All statistical differences were tested using an unpaired Students’ t-test (two-tailed). (E) NKp46+ CCR6- ILC3s were sorted from siLP of RorcCreMaffl/fl and control mice and subjected to RNA sequencing. Vulcano plot showing comparison of gene expression between c-Maf-deficient and control NKp46+ CCR6- ILC3s. Data represent the combined analysis of three biologically independent samples. Genes considered significant (FC > 1.5, FDR < 0.05) fall into the grey background, while selected genes are highlighted in red. (F) Gene set enrichment plots showing enrichment of ILC1 and NK cell signature genes in c-Maf-deficient vs. control NKp46+ CCR6- ILC3s (FDR < 0.01). Normalized enrichment score (NES).
Figure 2—figure supplement 1
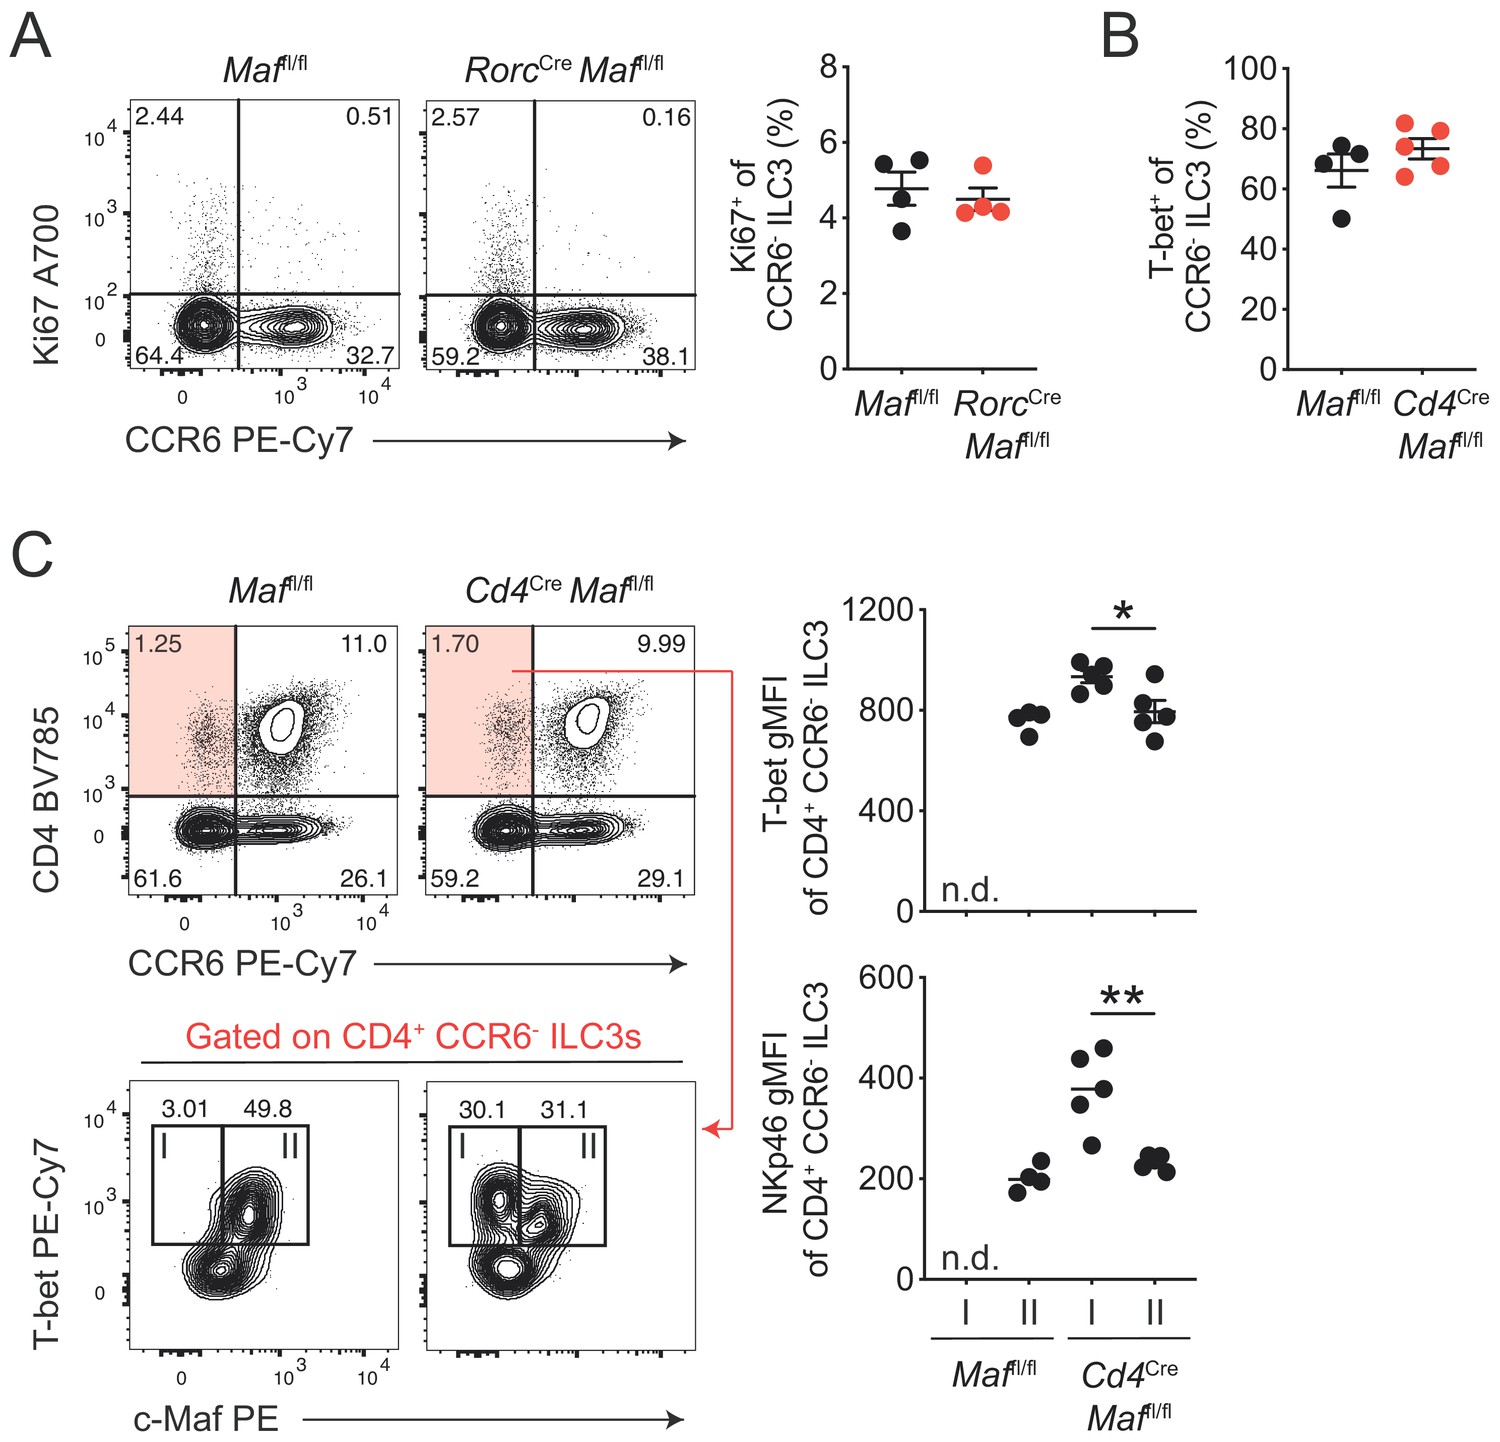
c-Maf cell-intrinsically restrains the type 1 conversion of CCR6- ILC3s.
(A) Frequencies of Ki67+ cells among siLP CCR6- ILC3s from RorcCre Maffl/fl and control mice. Representative contour plots are shown left; graph on the right shows quantification (n = 4). (B) Frequency of T-bet+ cells among siLP CCR6- ILC3s from CD4Cre Maffl/fl and control mice (n = 4). (C) T-bet and NKp46 expression level (gMFI) of siLP c-Maf- (I) and c-Maf+ (II) CD4+ T-bet+ CCR6- ILC3s from Cd4Cre Maffl/fl and control mice. Representative flow cytometric profiles of CD4 vs. CCR6 and T-bet vs. c-Maf expression (left); right, quantification (n = 4, mean ± SEM, *p<0.05, **p<0.01). All statistical differences were tested using an unpaired Students’ t-test (two-tailed).
Figure 2—figure supplement 2
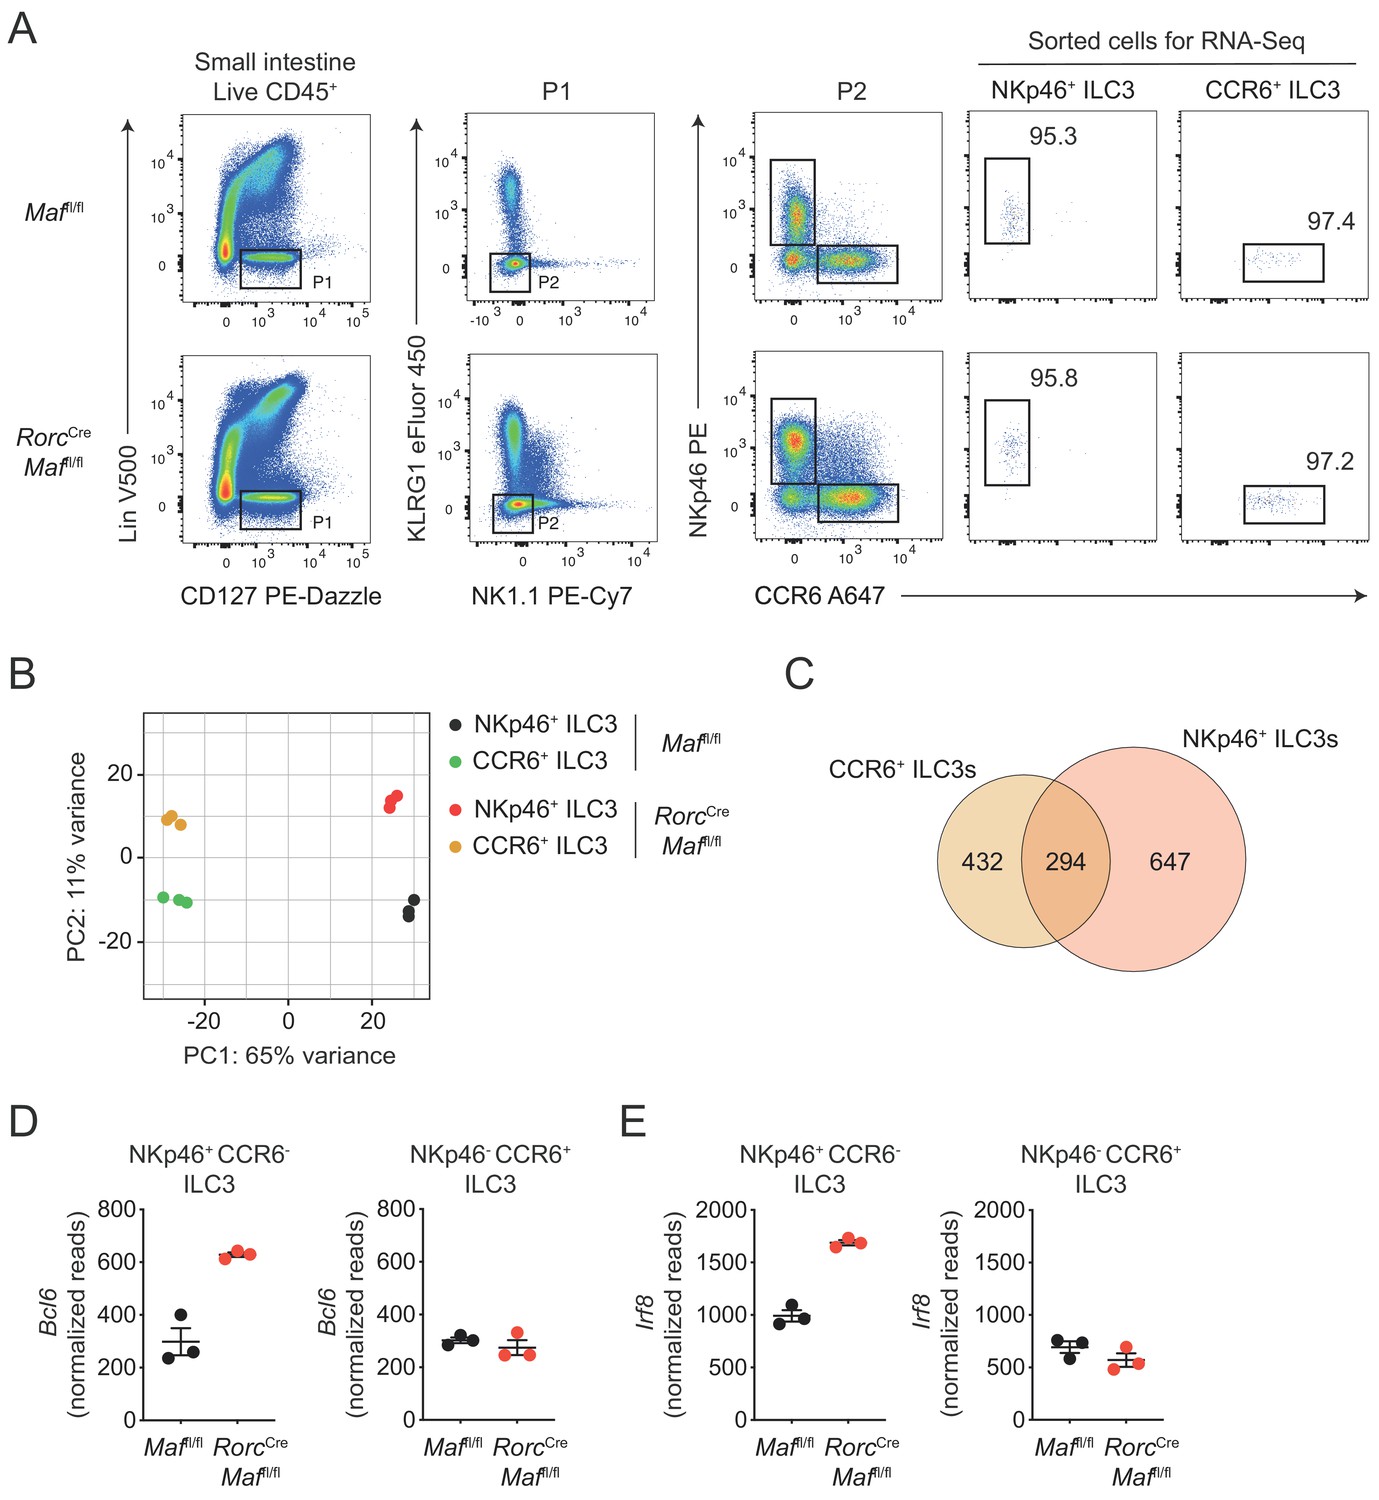
RNA-Seq analysis of intestinal NKp46+ CCR6- ILC3s and CCR6+ ILC3s.
(A) Gating strategy for FACS-sorting of siLP ILC3s from RorcCre Maffl/fl and Maffl/fl control mice for RNA-seq analysis. ILC3s were defined as viable CD45+ Lin- CD127+ KLRG1- NK1.1- cells. Lineage includes anti-CD5, anti-CD8α, anti-CD3, anti-Gr-1, anti-TCRγδ, anti-FcεRIα, anti-CD19 and anti-CD11c. (B) RNA-seq based principal component analysis (PCA) of FACS-sorted ILC3s. Each dot represents an individual biological replicate. (C) Venn diagram displaying the overlap between genes differentially expressed between c-Maf-deficient and control NKp46+ CCR6- ILC3s and CCR6+ ILC3s. (D, E) RNA-seq based expression of Bcl6 (D) and Irf8 (E) in c-Maf-deficient vs. control NKp46+ CCR6- ILC3s and CCR6+ ILC3s. Each dot represents an individual biological replicate.
Figure 3 with 3 supplements
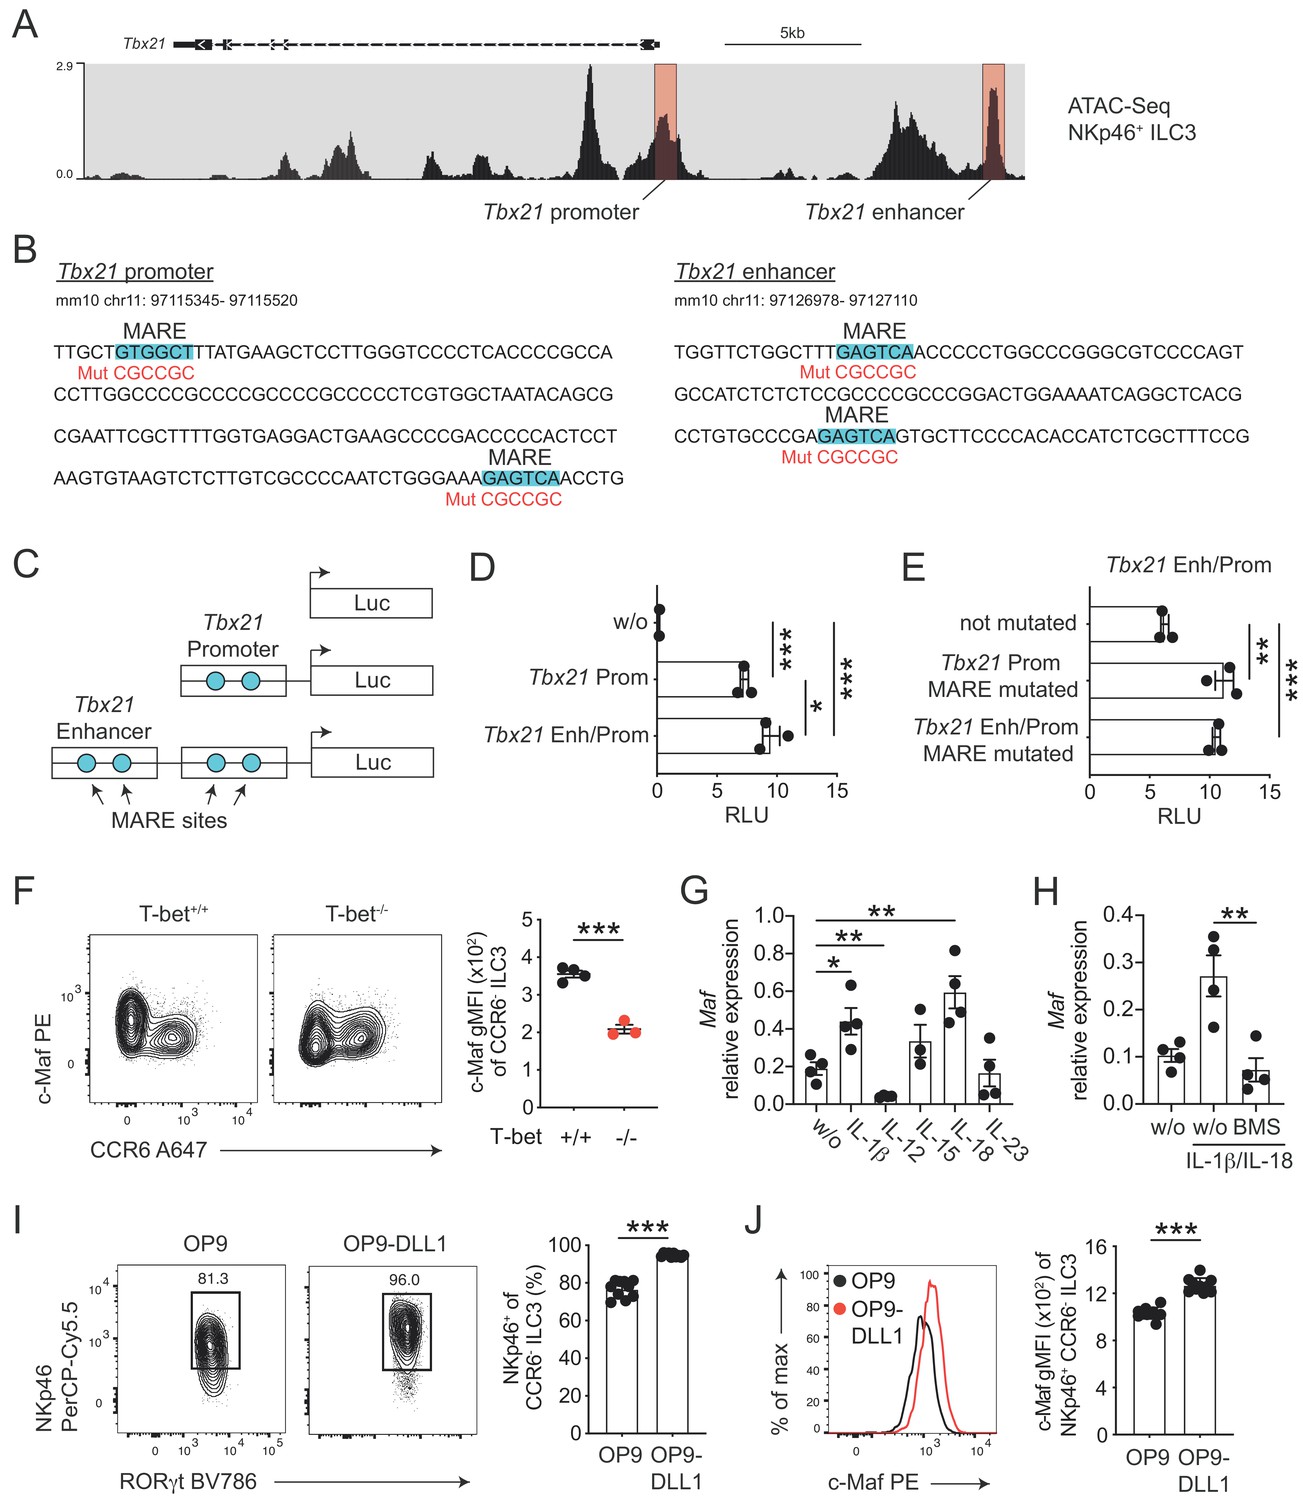
c-Maf directly represses T-bet as part of a negative feedback loop.
(A) Representative ATAC sequencing tracks across the Tbx21 locus of NKp46+ ILC3s (Shih et al., 2016). The Tbx21 promoter and enhancer regions are highlighted in red (Yang et al., 2007). ATAC sequencing tracks were visualized using the WashU browser from the Cistrome project (Mei et al., 2017). (B) Positioning of putative Maf response elements (MARE) within the Tbx21 promoter and enhancer (highlighted in blue). Depicted sequences represent selected regions of the Tbx21 promoter and enhancer. Mutated sequences are shown in lower lines in red. (C) Schematic representation of plasmids containing the Tbx21 promoter/enhancer linked to the firefly luciferase reporter gene (Luc). Blue dots indicate MARE sites within the Tbx21 promoter and enhancer region. (D) Relative luciferase activity (RLU) of different reporter constructs driven by the Tbx21 promoter alone or in combination with an enhancer sequence compared to a promoterless (w/o) control vector (pGL3 basic) (n = 3, mean ± SEM, *p<0.05, ***p<0.001). (E) Analysis of c-Maf-dependent suppression of luciferase activity. The MARE sites within the Tbx21 promoter or the Tbx21 promoter and enhancer were mutated in the Tbx21 enhancer/promoter construct. Comparison of RLU between unmutated and mutated Tbx21 enhancer/promoter constructs upon c-Maf overexpression (n = 3, mean ± SEM, ***p<0.001). All reporter assay data are pooled from three independent experiments. (F) Expression of c-Maf by siLP CCR6- ILC3s from T-bet-deficient (T-bet-/-) and -sufficient (T-bet+/+) mice. Representative flow cytometric profiles are shown on the left; graph on the right shows quantification of c-Maf gMFI (n = 4, mean ± SEM, ***p<0.001). (G–H) Sort-purified siLP NKp46+ CCR6- ILC3s from RorcCre R26EYFP mice were cultured in vitro for 36 hr in the presence of IL-7/SCF (w/o) or IL-7/SCF plus indicated cytokines. Subsequently, Maf expression was measured by qPCR (n = 4, mean ± SEM, *p<0.05, **p<0.01, ***p<0.001). In one condition the NF-κb inhibitor BMS-345541 (BMS) was added at 1 μM to the culture. Data are pooled from two independent experiments each with two replicate wells. (I) Sort-purified siLP NKp46+ CCR6- ILC3s from RorcCre R26EYFP mice were cultured in the presence of IL-7/SCF on OP9 or OP9-DLL1 stromal cells as indicated. After 12 days, cells were analysed by flow cytometry for the cell surface expression of NKp46. Representative contour plots are shown on the left (pregated on CCR6- ILC3s); graph on the right shows quantification of the frequency of NKp46+ cell among CCR6- ILC3s (n = 10, mean ± SEM, ***p<0.001). Data are pooled from two independent experiments with 4 to 6 replicate wells. (J) Expression of c-Maf by NKp46+ CCR6- ILC3s cultured on OP9 or OP9-DLL1 cells. Representative histogram is shown left; graph on the right shows quantification of c-Maf gMFI (n = 10, mean ± SEM, ***p<0.001). All statistical differences were tested using an unpaired Students’ t-test (two-tailed).
Figure 3—figure supplement 1

Evidence for direct binding of T-bet to Maf in NKp46+ ILC3s.
(A) Representative ATAC sequencing tracks across the Maf locus of NKp46+ ILC3s (Shih et al., 2016). ATAC sequencing peaks overlap with two conserved non-coding sequences 0.5 kb (CNS-0.5) and 1 kb (CNS-1) upstream of Maf (red boxes). (B) Representative T-bet ChIP sequencing tracks across the Maf locus of Th1 cells (Gökmen et al., 2013). Prominent T-bet binding peaks overlap with ATAC sequencing peaks within Maf CNS-0.5 and CNS-1 regions (red boxes). (C) T-bet and NF-κb binding motifs as defined by HOMER software (Heinz et al., 2010). (D) In silico analysis identifies T-bet and NF-κb binding sites within Maf CNS-0.5 and CNS-1 regions (highlighted in blue). ATAC and ChIP sequencing tracks were visualized using the WashU browser from the Cistrome project (Mei et al., 2017).
Figure 3—figure supplement 2
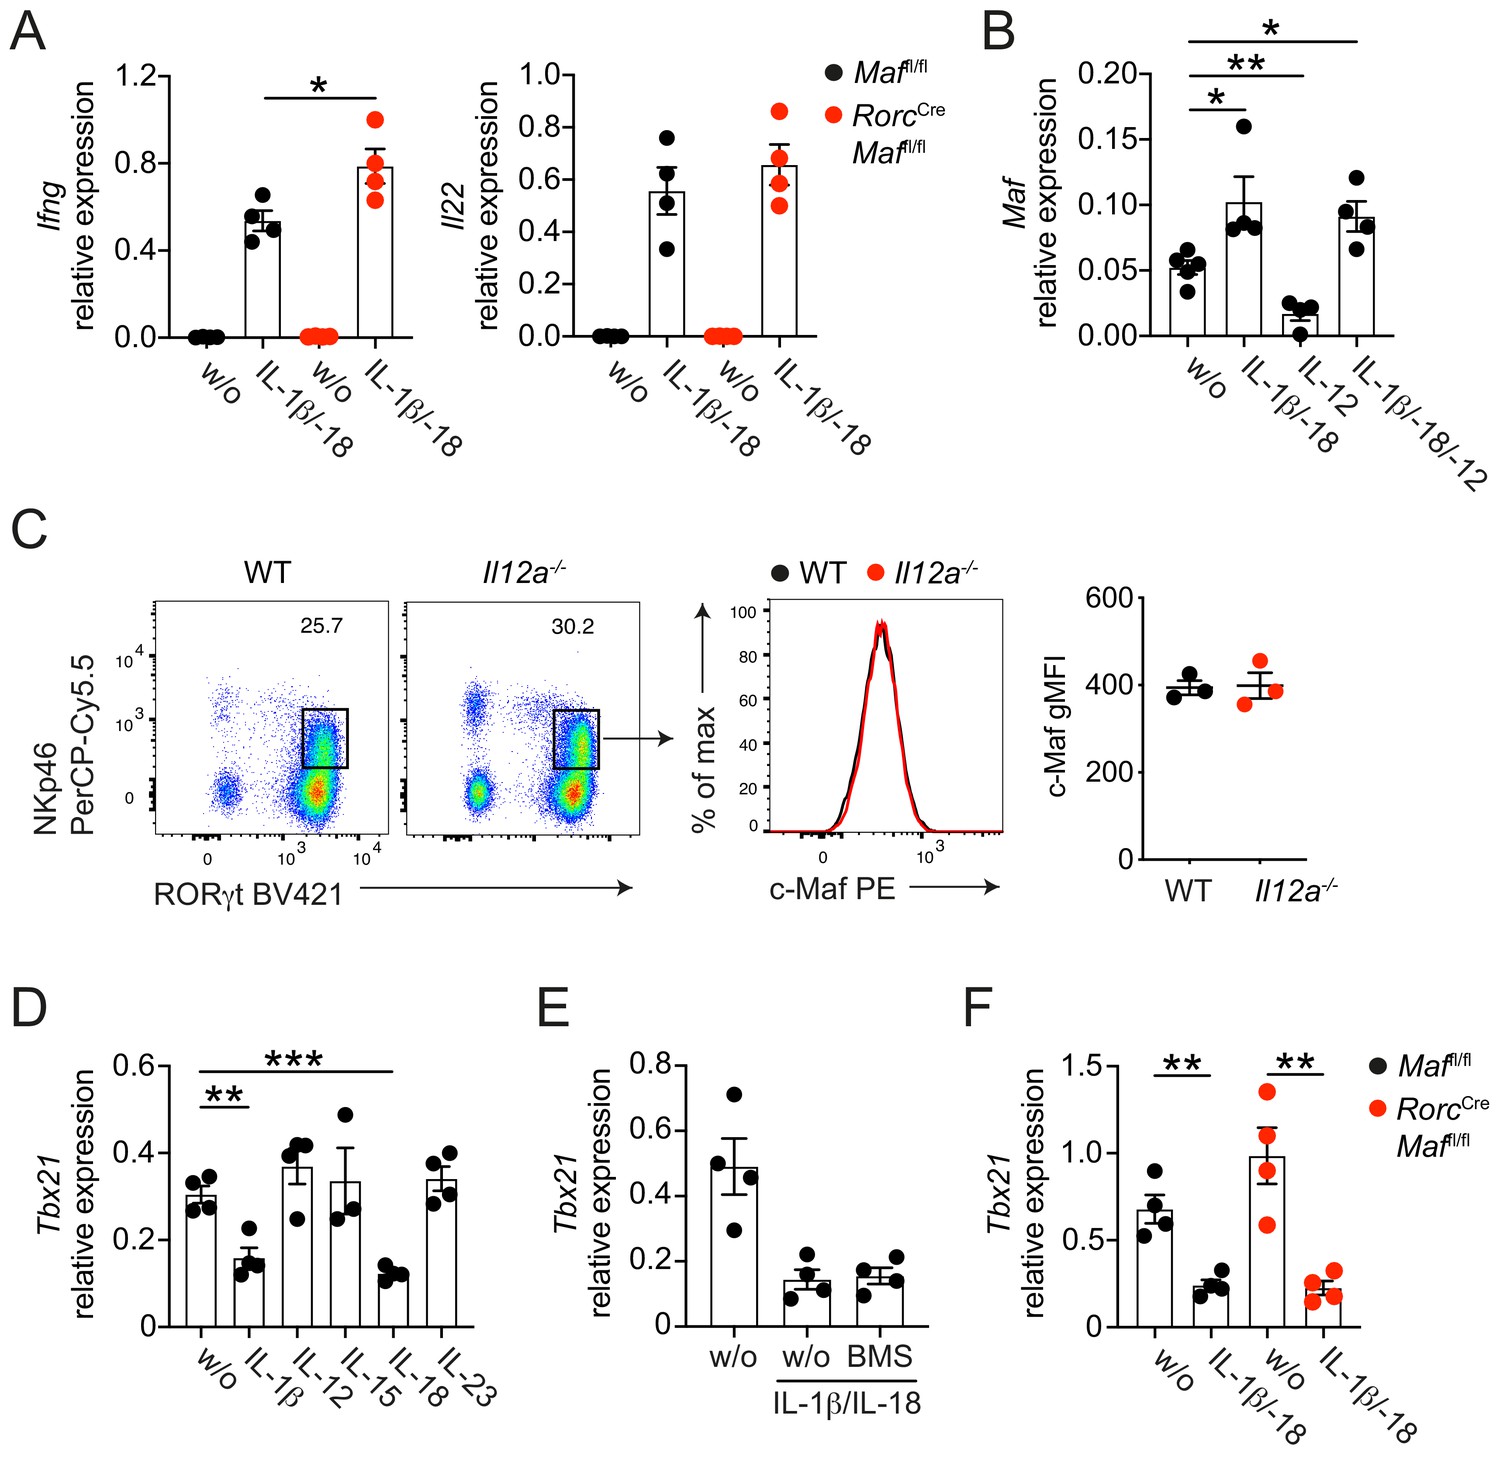
Cytokine-mediated regulation of c-Maf and T-bet expression.
(A) Sort-purified siLP NKp46+ CCR6- ILC3s from RorcCre Maffl/fl or control mice were cultured in vitro for 36 hr in the presence of IL-7/SCF (w/o) or IL-7/SCF plus IL-1ß and IL-18. Subsequently, Ifng and Il22 expression was measured by qPCR (n = 4, mean ± SEM, *p<0.05). (B) Sort-purified siLP NKp46+ CCR6- ILC3s from RorcCre R26EYFP mice were cultured in vitro for 36 hr in the presence of IL-7/SCF (w/o) or IL-7/SCF plus indicated cytokines. Subsequently, Maf expression was measured by qPCR (n = 4, mean ± SEM, *p<0.05, **p<0.01). (C) Protein expression of c-Maf by siLP NKp46+ ILC3s isolated from Il12a-/- or wild-type mice as measured by flow cytometry (pregated on viable Lin- CD127+ cells). Representative flow cytometric profiles of RORγt vs. NKp46 expression (left); representative histograms showing c-Maf expression (middle); right, quantification of c-Maf gMFI (n = 3, mean ± SEM). (D–E) Sort-purified siLP NKp46+ CCR6- ILC3s from RorcCre R26EYFP mice were cultured in vitro for 36 hr in the presence of IL-7/SCF (w/o) or IL-7/SCF plus indicated cytokines. Subsequently, Tbx21 expression was measured by qPCR (n = 4, mean ± SEM, **p<0.01, ***p<0.001). The NF-κb inhibitor BMS-345541 (BMS) was added at 1 μM to the culture. (F) Sort-purified siLP NKp46+ CCR6- ILC3s from RorcCre Maffl/fl or control mice were cultured in vitro for 36 hr in the presence of IL-7/SCF (w/o) or IL-7/SCF plus IL-1ß and IL-18. Subsequently, Tbx21 expression was measured by qPCR (n = 4, mean ± SEM, **p<0.01). All in vitro data are pooled from two independent experiments each with two replicate wells.
Figure 3—figure supplement 3
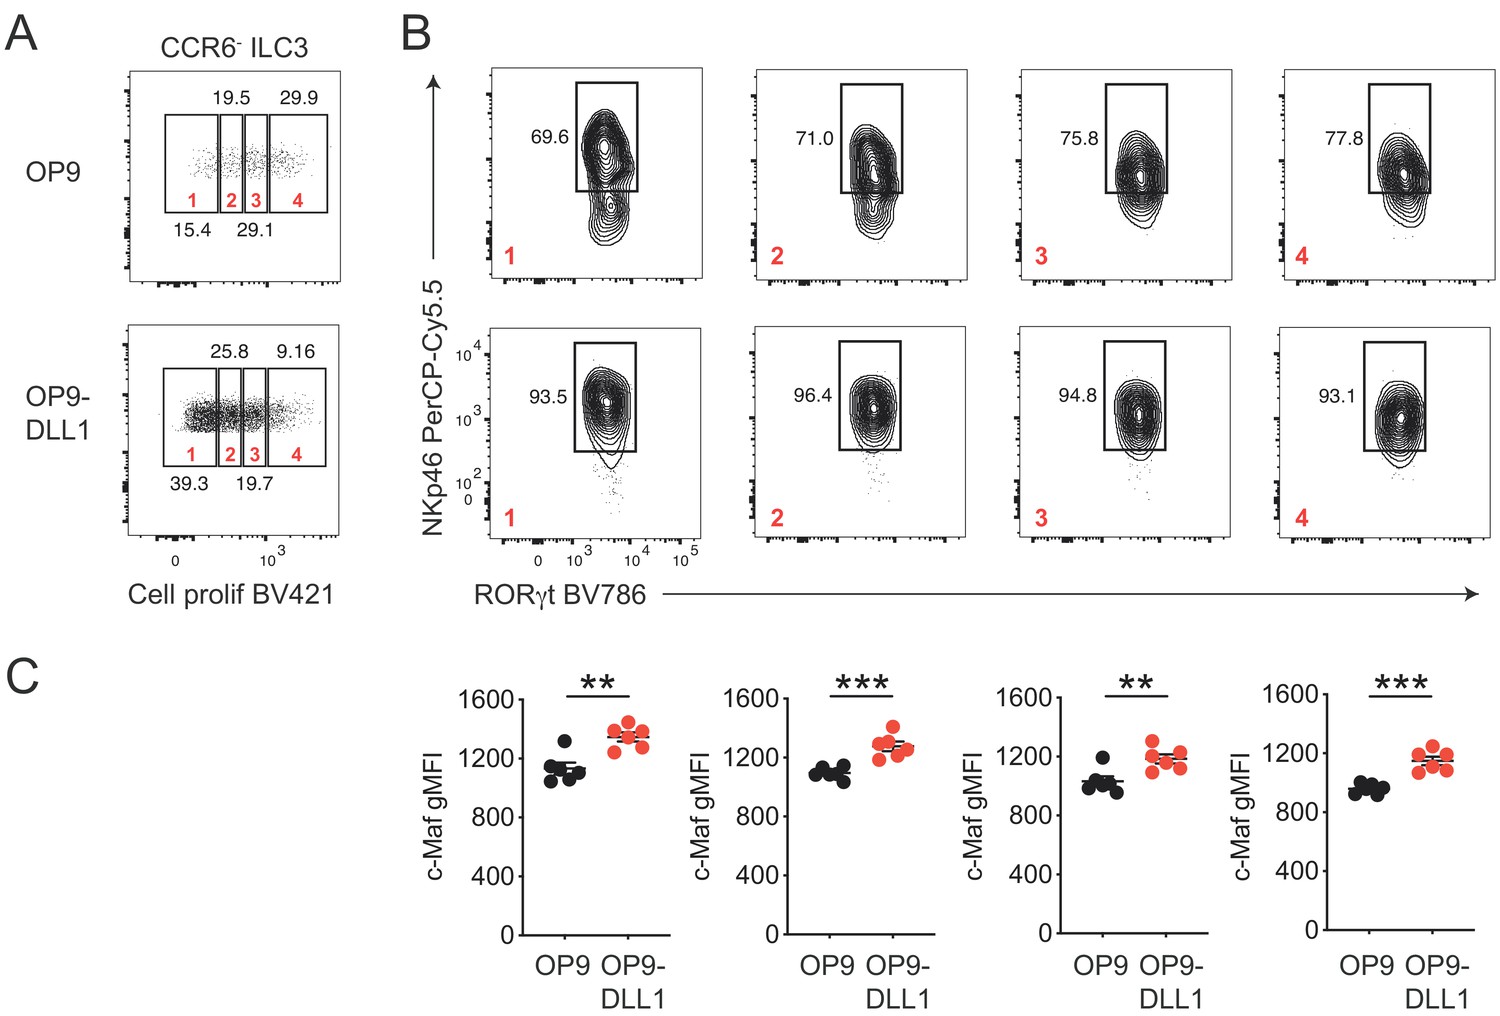
Notch signaling maintains NKp46 and c-Maf expression in NKp46+ CCR6- ILC3s independent of cell proliferation.
(A) Small intestinal NKp46+ CCR6- ILC3s were FACS-purified, labeled with a cell proliferation dye and cultured on OP9 or OP9-DLL1 feeder cells for 12 days. Representative dot plots show cell proliferation dye dilution (pre-gated on CCR6- ILC3s). Gates 1 to 4 indicate different generations of proliferating cells. (B) Representative contour plots showing NKp46 expression by distinct generations of OP9 or OP9-DLL1 cultured NKp46+ CCR6- ILC3s (gates 1 to 4). (C) Quantitative comparison of c-Maf expression (gMFI) within different generations (gates 1 to 4) of OP9 vs. OP9-DLL1 cultured NKp46+ CCR6- ILC3s (gates 1 to 4; n = 6, mean ± SEM, **p<0.01, ***p<0.001). Statistical differences were tested using an unpaired Students’ t-test (two-tailed).
Additional files
-
Supplementary file 1
Differentially expressed genes between c-Maf-deficient and -sufficient NKp46+ CCR6- ILC3s.
NKp46+ CCR6- ILC3s were sorted from siLP of RorcCreMaffl/fl and control mice and subjected to RNA sequencing. 941 genes were identified as differentially expressed (FC >1.5, p-value<0.05). Data represent the combined analysis of three biologically independent samples.
- https://cdn.elifesciences.org/articles/52549/elife-52549-supp1-v2.xlsx
-
Supplementary file 2
Genes differentially expressed in c-Maf-deficient NKp46+ CCR6- and NKp46- CCR6+ ILC3s.
NKp46+ CCR6- ILC3s and NKp46- CCR6+ ILC3s were sorted from siLP of RorcCreMaffl/fl and control mice and subjected to RNA sequencing. 294 genes were found to be differentially expressed (FC >1.5, p-value<0.05) in both subsets.
- https://cdn.elifesciences.org/articles/52549/elife-52549-supp2-v2.xlsx
-
Supplementary file 3
List of antibodies used in this study.
- https://cdn.elifesciences.org/articles/52549/elife-52549-supp3-v2.xlsx
-
Supplementary file 4
qPCR Primer used in this study.
- https://cdn.elifesciences.org/articles/52549/elife-52549-supp4-v2.xlsx
-
Transparent reporting form
- https://cdn.elifesciences.org/articles/52549/elife-52549-transrepform-v2.pdf
Download links
A two-part list of links to download the article, or parts of the article, in various formats.
Downloads (link to download the article as PDF)
Open citations (links to open the citations from this article in various online reference manager services)
Cite this article (links to download the citations from this article in formats compatible with various reference manager tools)
c-Maf restrains T-bet-driven programming of CCR6-negative group 3 innate lymphoid cells
eLife 9:e52549.
https://doi.org/10.7554/eLife.52549


