Mitochondrial pyruvate carrier is required for optimal brown fat thermogenesis
- Department of Biochemistry, University of Utah, United States
- Department of Nutrition and Integrative Physiology, University of Utah, United States
- Howard Hughes Medical Institute, University of Utah, United States
- Department of Integrative Biology and Physiology, University of California, Los Angeles, United States
Figures
Figure 1 with 1 supplement
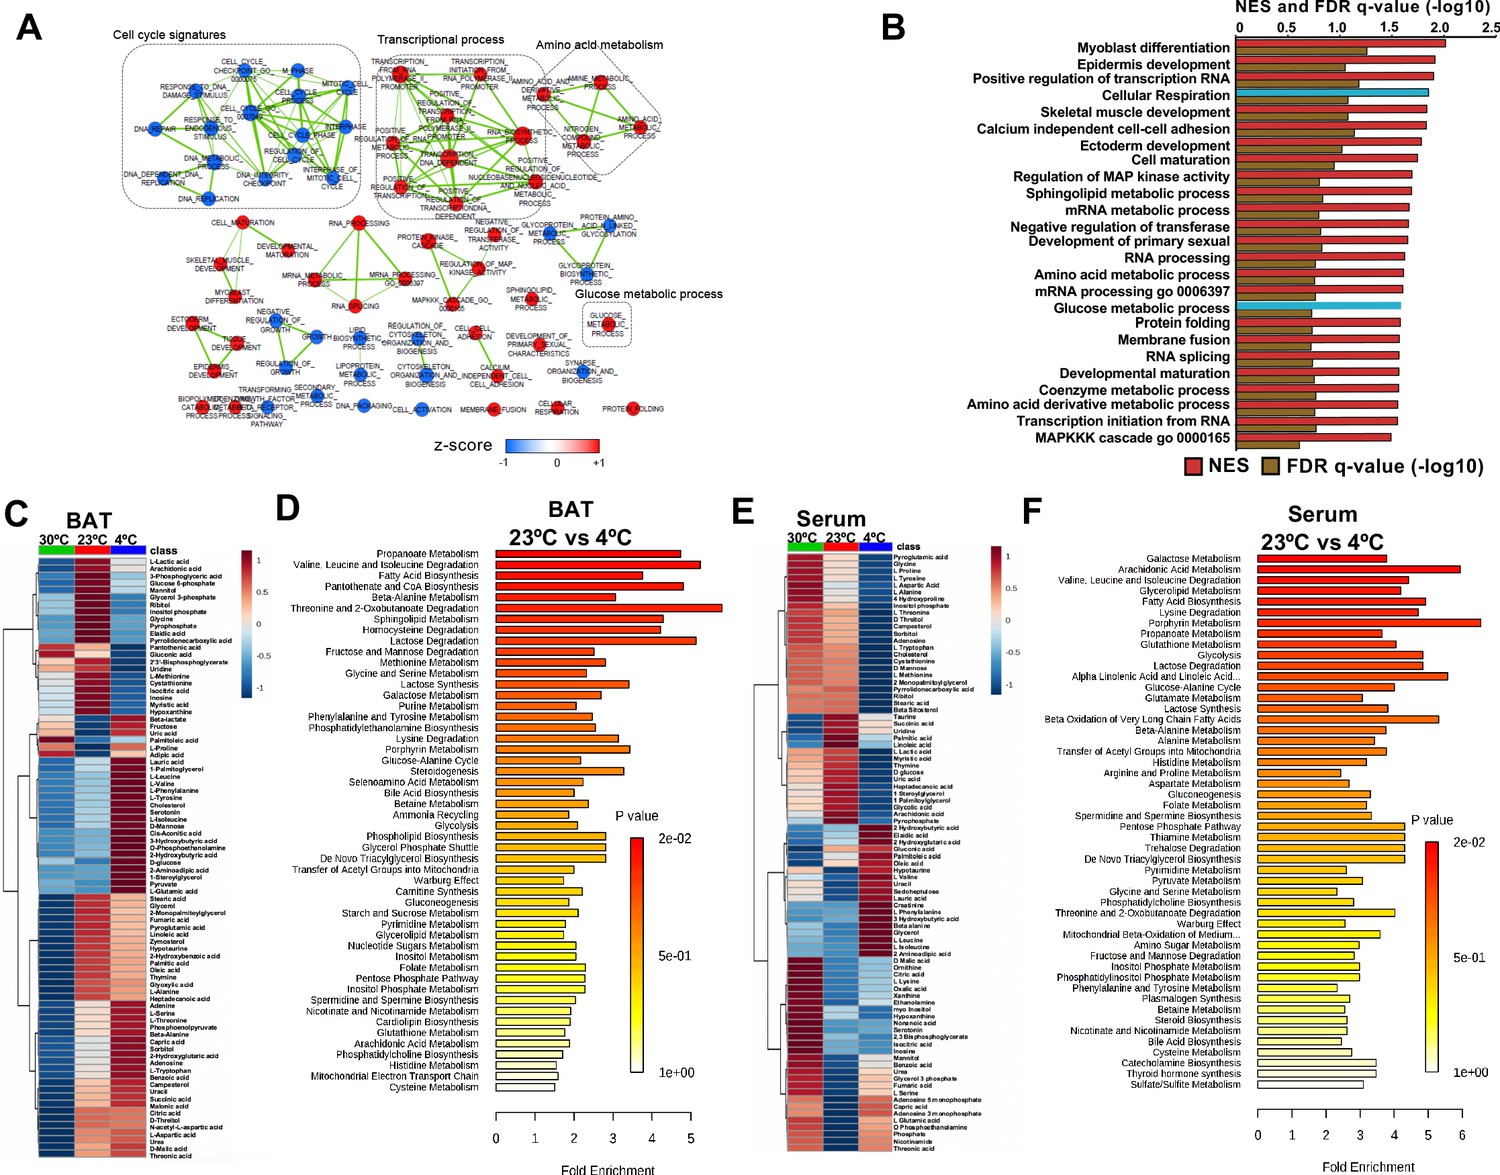
Transcriptome and metabolomics analysis of brown fat shows increased carbohydrate metabolism and glycolytic metabolism during cold exposure.
(a) Network visualization of enriched biological pathways altered with cold exposure in BAT (N = 5). (b) GSEA pathway analysis of differentially expressing genes (FDR < 0.05) in BAT at 4°C versus room temperature (N = 5). (c) Heat map of relative normalized changes in BAT (c) and serum (e) metabolites at 30°C, 23°C, and 4°C. Dendograms illustrate hierarchical clustering of pattern similarity across metabolites (left) and conditions (top). Each column represents average within the group (N = 5 per group). Data was sum normalized, log transformed, and autoscaled. (d) MSEA pathway analysis of metabolites in BAT (d) and serum (f) from mice at 4°C versus room temperature (N = 5).
Figure 1—figure supplement 1
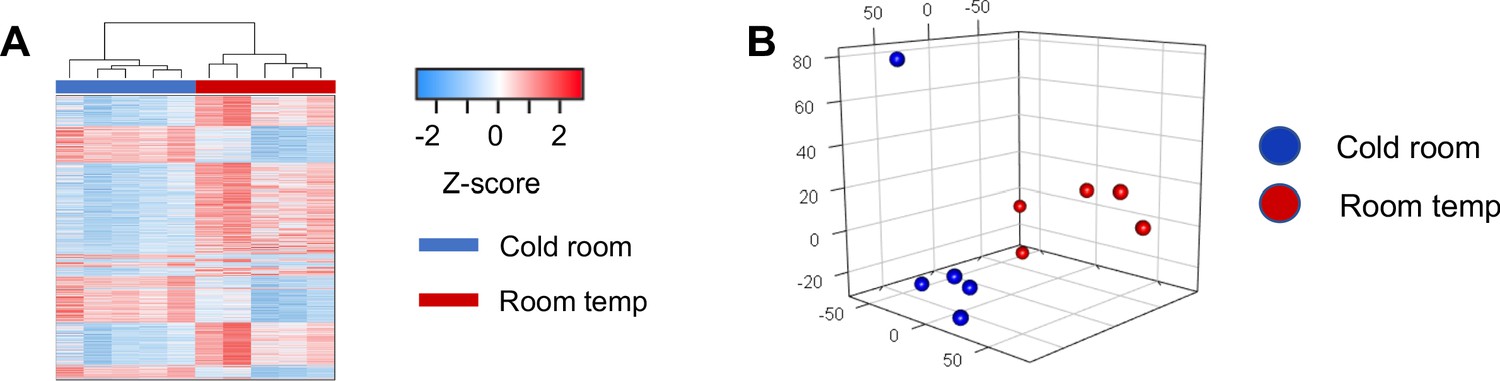
RNRNA-seq analysis of brown adipose tissue from mice at room temperature or with cold exposure.
(a) Hierarchical clustering illustrates large-scale differences in gene expression between cold room and room temperature exposed BAT. (b) Unsupervised principal component analysis (PCA) shows that cold room and room temperature exposed BATs are separated and form distinctive clusters in principal components. The first three principal components were used to present the samples in the 3-dimentional PCA plot.
Figure 2 with 1 supplement
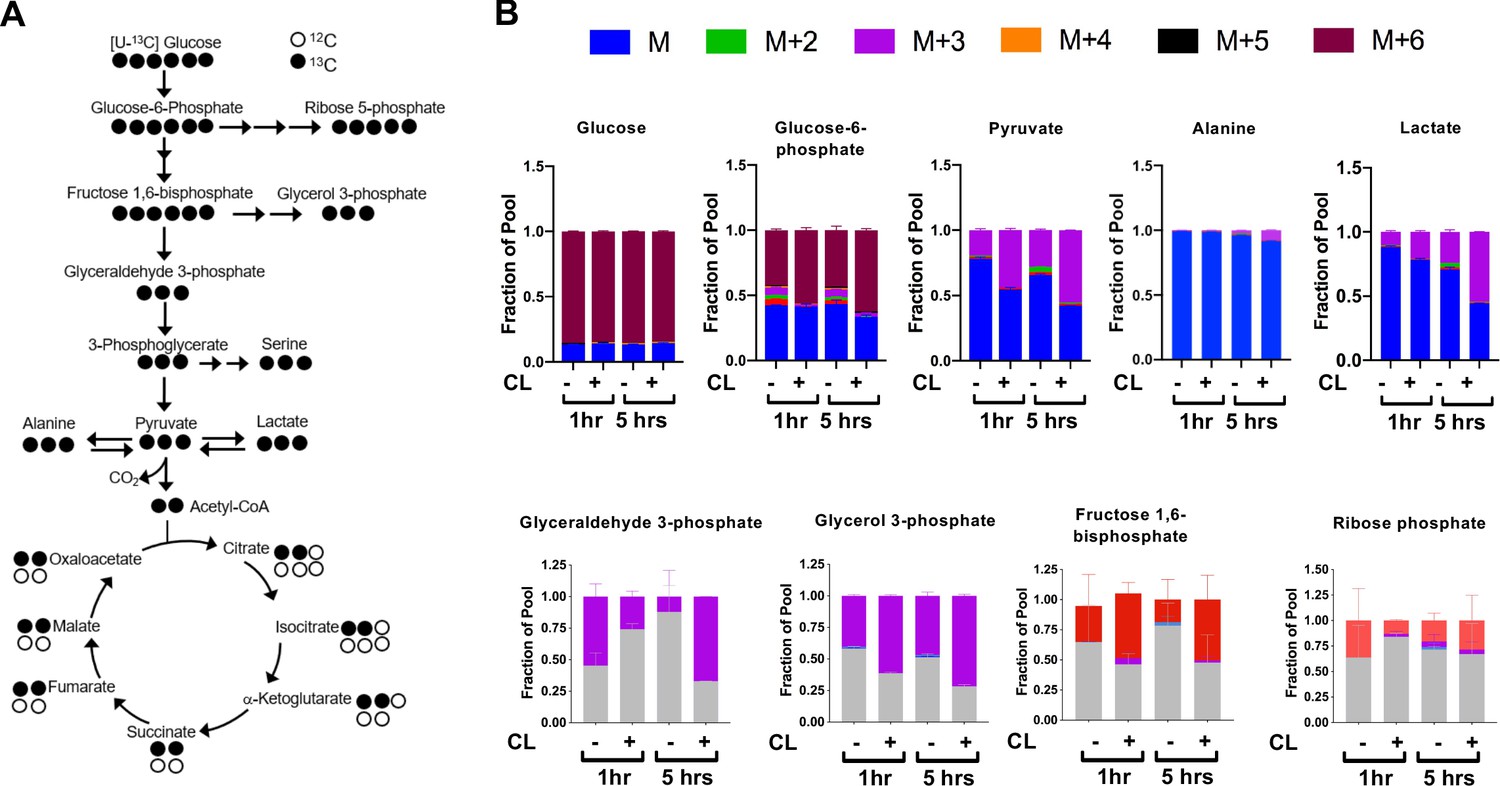
CL-316,243 stimulation of brown adipocytes leads to increased 13C-glucose flux.
(a) Atom mapping for [U-13C] glucose tracing into glycolysis and the TCA cycle. White balls are 12C atoms. Black balls are 13C atoms. (b) Tracing analysis from U-13C glucose in differentiated brown adipocytes treated with vehicle or 100 nM CL-316,243 for 5 hours(N = 3).
Figure 2—figure supplement 1
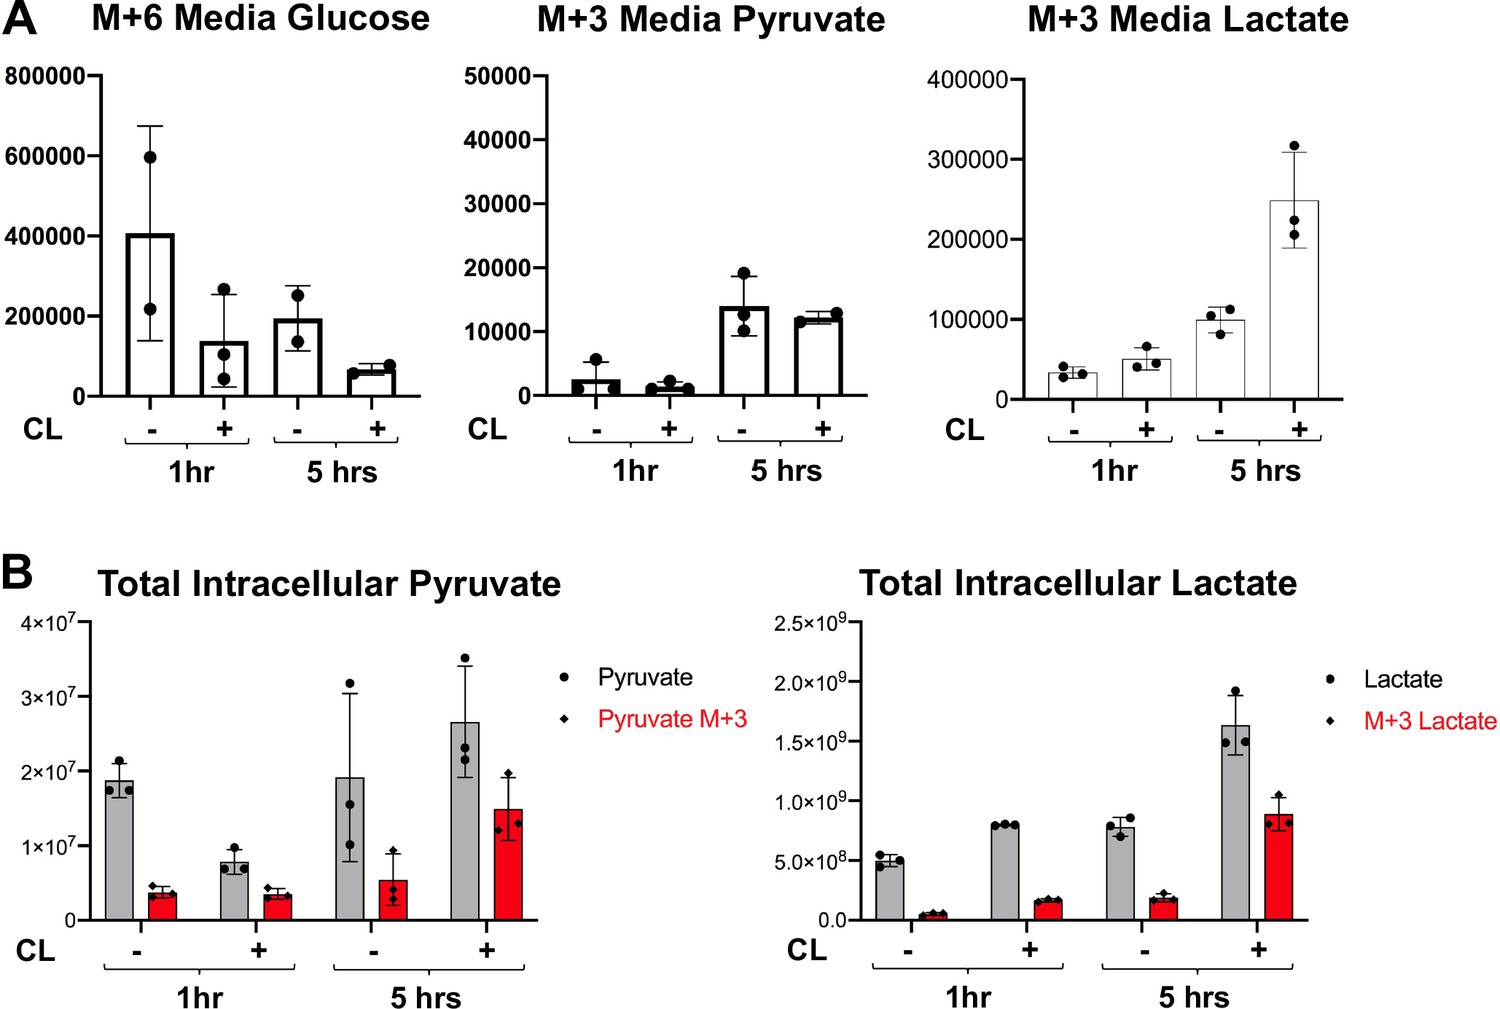
Metabolite tracing of brown adipocytes in response to β3-Adrenergic Receptor agonist.
(a) 13C labeling of M+6 glucose and M+three pyruvate and lactate in the media of brown adipocytes treated with vehicle or 100 nM CL-316,243 for 1 or 5 hours (N = 3). (b) Total intracellular pyruvate and lactate (M and M+3) of brown adipocytes treated with vehicle or 100 nM CL-316,243 for 1 or 5 hours(N = 3).
Figure 3 with 1 supplement
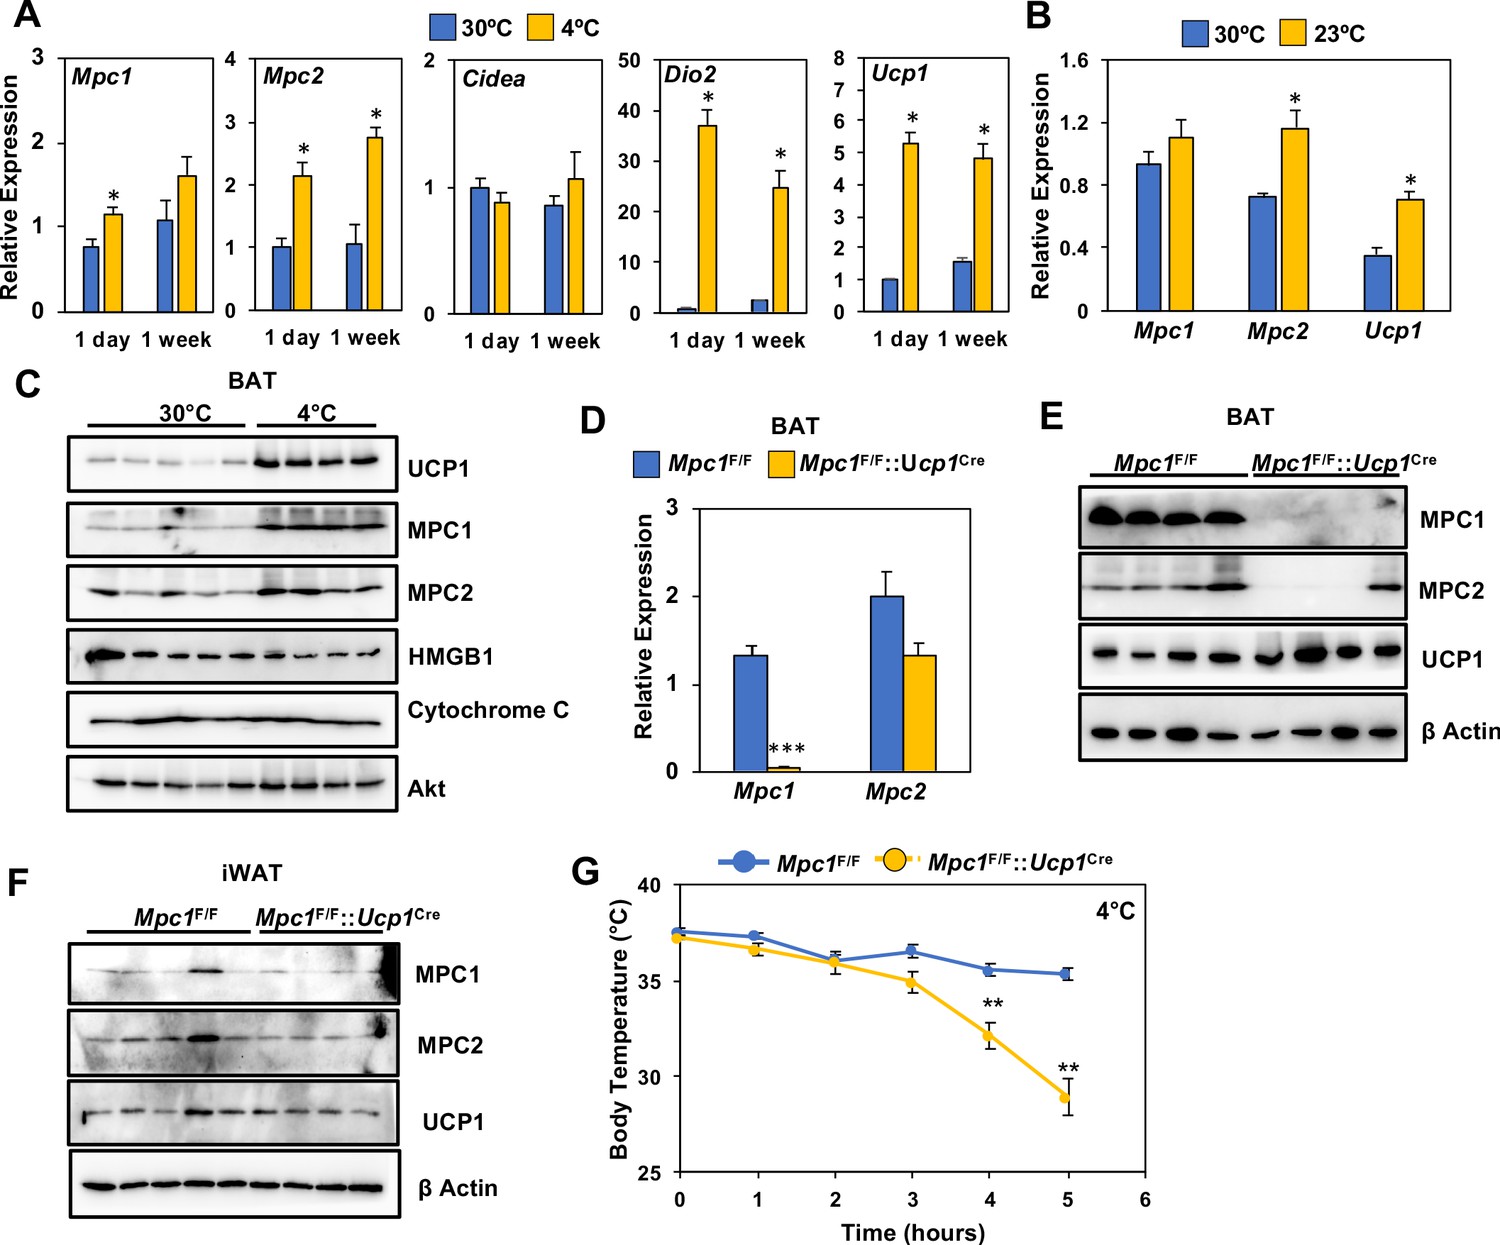
Loss of MPC1 in BAT impairs thermogenesis and leads to cold sensitivity.
(a) Relative gene expression in brown adipose tissue from mice adapted to 30°C or 4°C for 1 day or 1 week. N = 4–5. (b) Relative gene expression in brown adipose tissue from mice adapted to 30°C or 23°C for 1 week. N = 4–5 (c) Western blot analysis of brown adipose tissue of mice adapted to 30°C or 4°C for 1 week. N = 4–5. (d) Gene expression of MPC1 and MPC2 in brown adipose tissue after 6 hr of cold exposure. N = 7. (e) Western blot analysis of brown adipose tissue and white adipose tissue (f) at 4°C. N = 4. (g) Core body temperature during cold challenge at 4°C. N = 7.
Figure 3—figure supplement 1
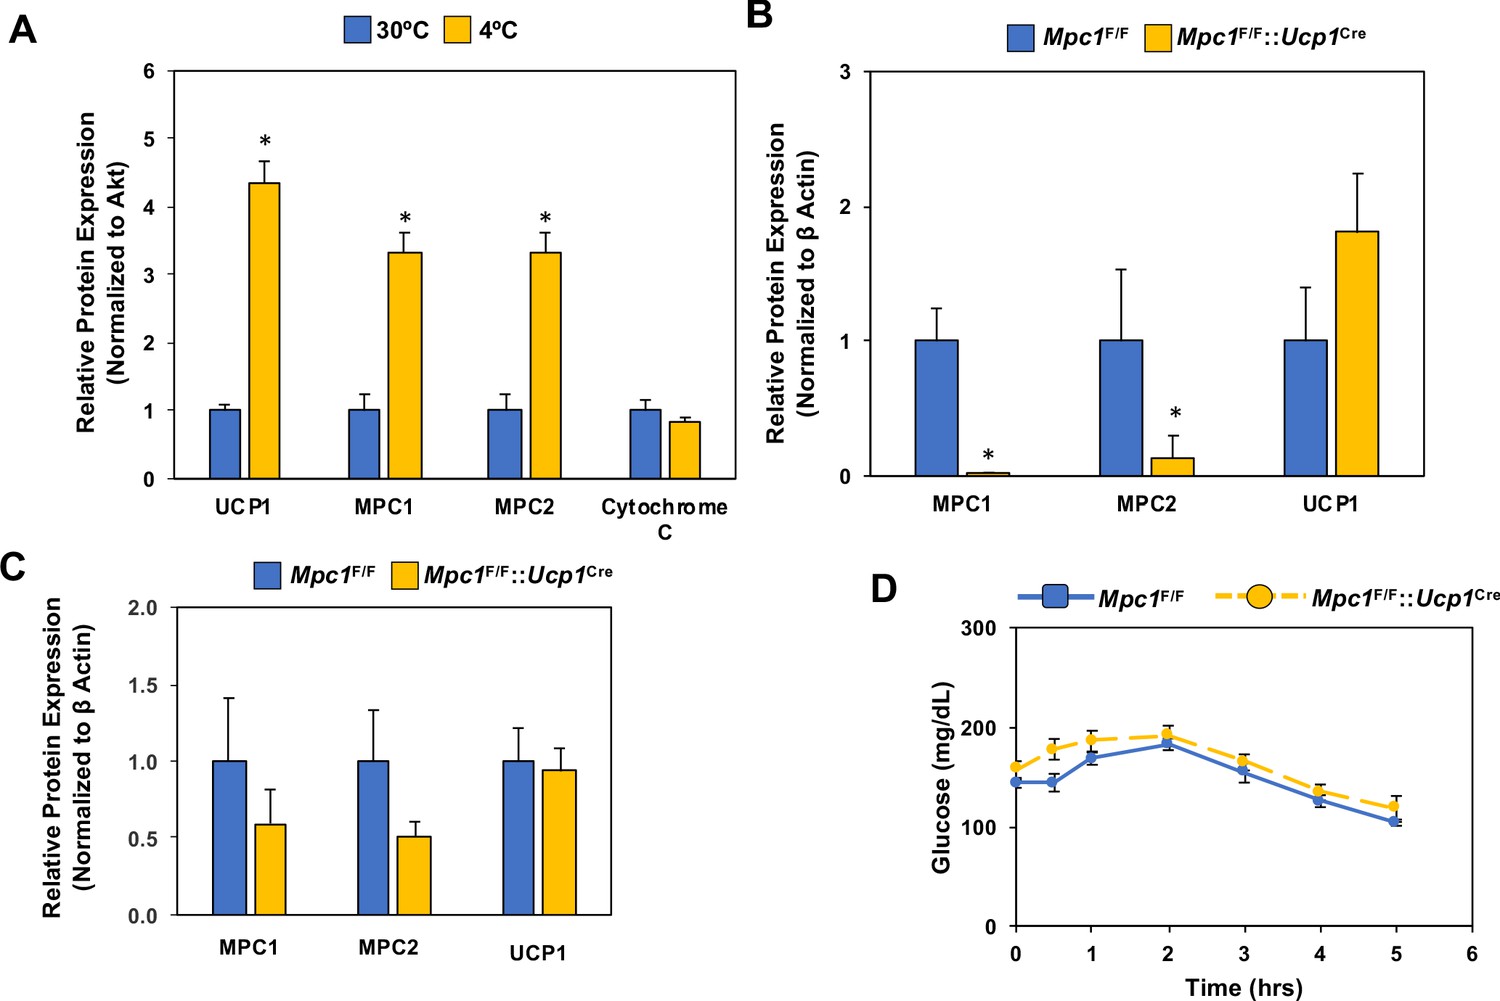
Regulation of Mpc1 in response to the cold and the conditional deletion of Mpc1 in brown fat.
(a) Quantification of western blot analysis of brown adipose tissue of mice adapted to 30°C or 4°C for 1 week (N = 4–5), (p<0.05). (b) Quantification of western blot analysis of brown adipose tissue (b) and white adipose tissue (c) at 4°C from Mpc1F/F and Mpc1F/F::Ucp1Cre mice (N = 4). (d) Blood glucose levels in Mpc1F/F and Mpc1F/F::Ucp1Cre mice during cold challenge at 4°C. N = 6.
Figure 4 with 1 supplement
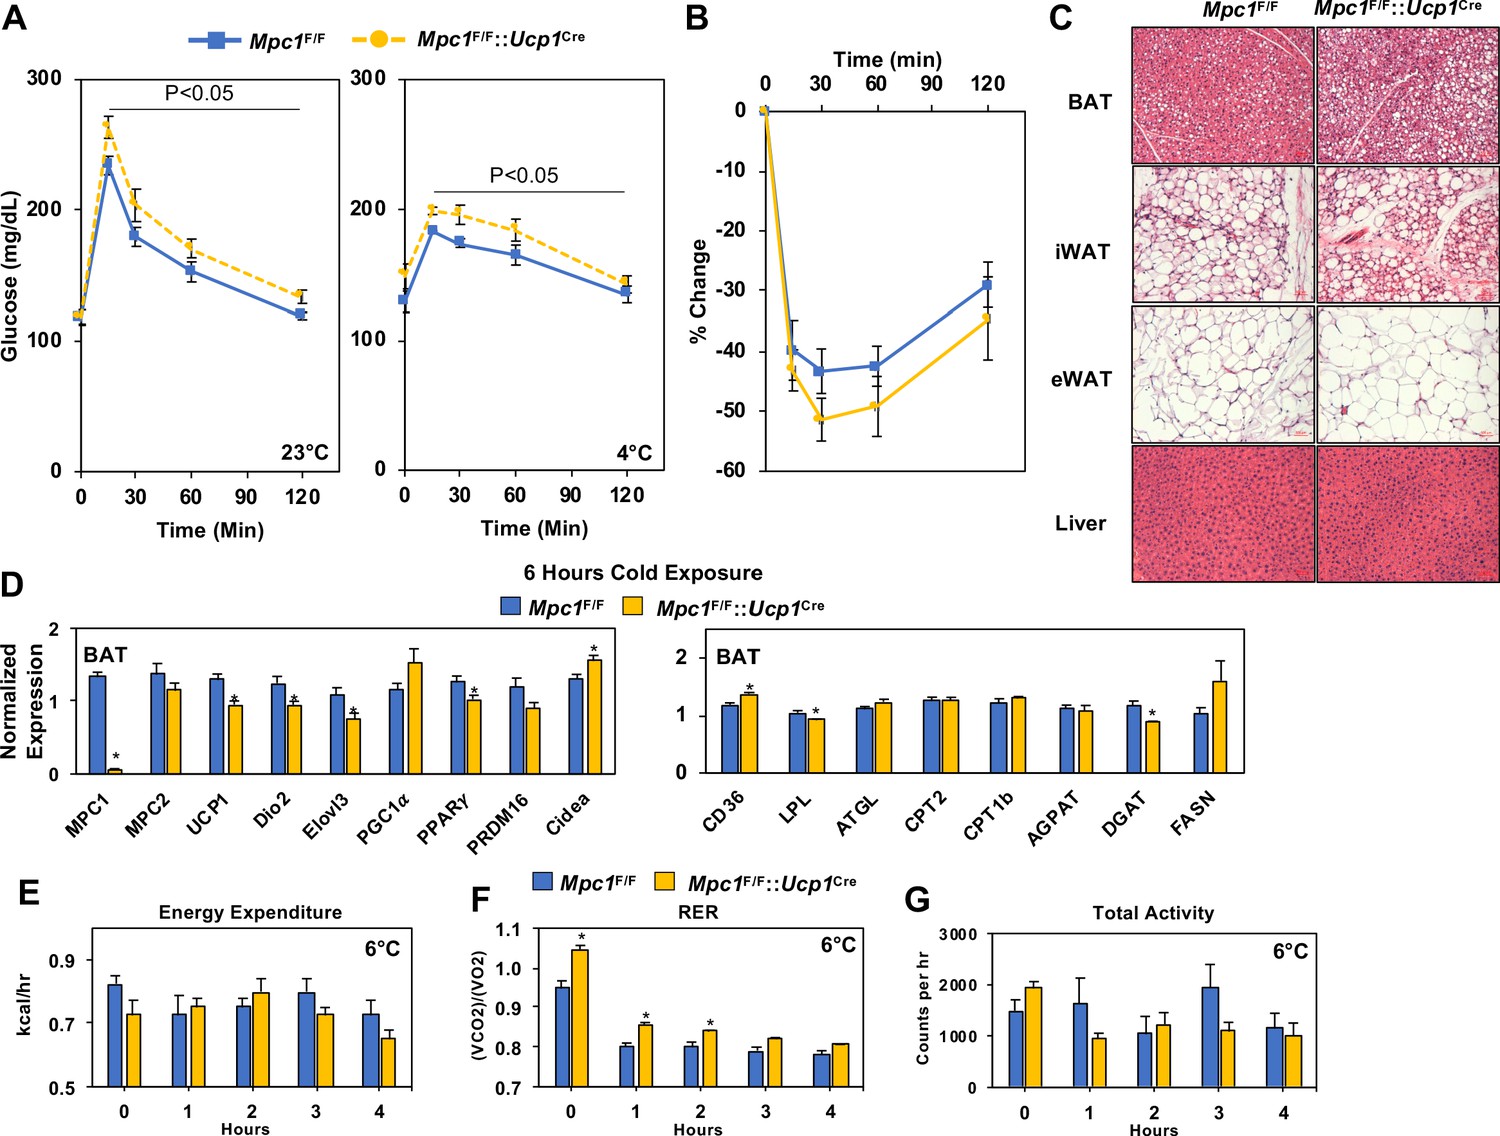
Conditional deletion of Mpc1 in BAT impairs systemic glucose metabolism.
(a) Glucose tolerance test at room temperature (23°C) and cold (4°C) in Mpc1F/F and Mpc1F/F::Ucp1Cre3–4 months old, N = 5. (b) Insulin tolerance test at room temperature (23°C) in Mpc1F/F and Mpc1F/F::Ucp1Cre, 3–4 months old, N = 6. (c). Representative H and E images of BAT, iWAT, eWAT, and liver from Mpc1F/F and Mpc1F/F::Ucp1Cre mice exposed to 4°C for 6 hr. (d) Gene expression in BAT from Mpc1F/F and Mpc1F/F::Ucp1Cre mice exposed to 4°C for 6 hr. N = 6. (e–g) Energy expenditure, RER, and locomotor activity of Mpc1F/F and Mpc1F/F::Ucp1Cre mice at 6°C. N = 4.
Figure 4—figure supplement 1
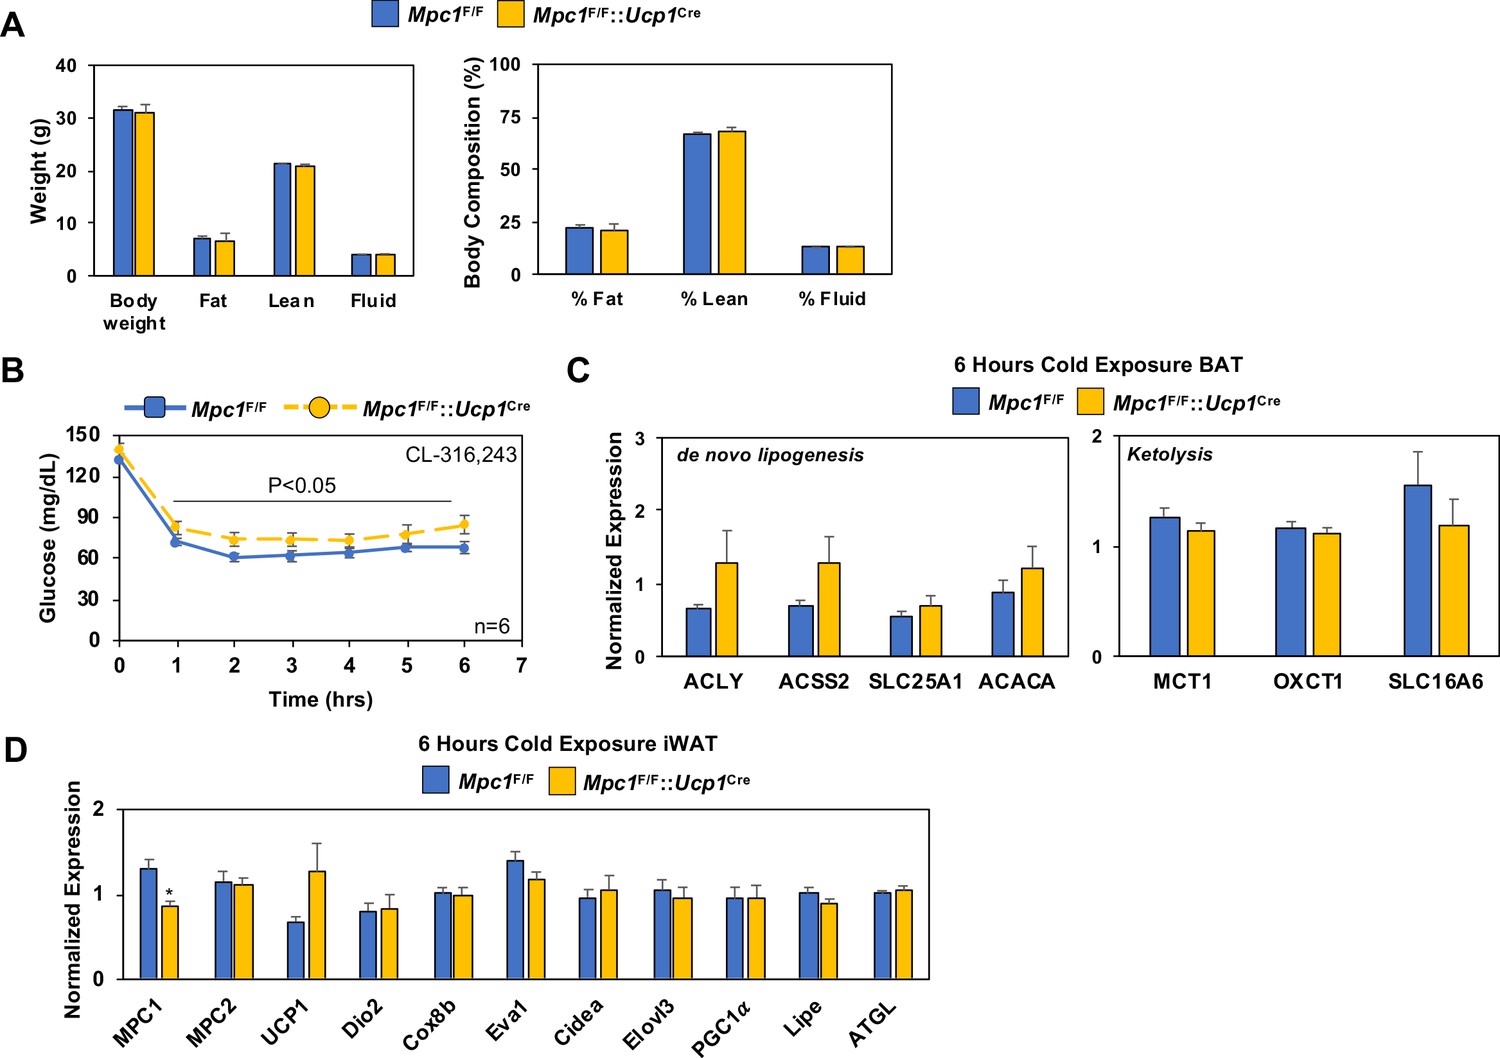
Conditional deletion of Mpc1 in BAT and the impact on body composition and blood glucose.
(a) Body composition of Mpc1F/F and Mpc1F/F::Ucp1Cre mice housed at room temperature by NMR. (b) Time-dependent changes in blood glucose levels in Mpc1F/F and Mpc1F/F::Ucp1Cre mice mice 3–4 months old treated with 1 mg/kg CL-316,243 (N = 6). (c) Gene expression in BAT from Mpc1F/F and Mpc1F/F::Ucp1Cre mice housed at 4°C for 6 hr. (d) Gene expression in iWAT from Mpc1F/F and Mpc1F/F::Ucp1Cre mice housed at 4°C for 6 hr.
Figure 5 with 1 supplement
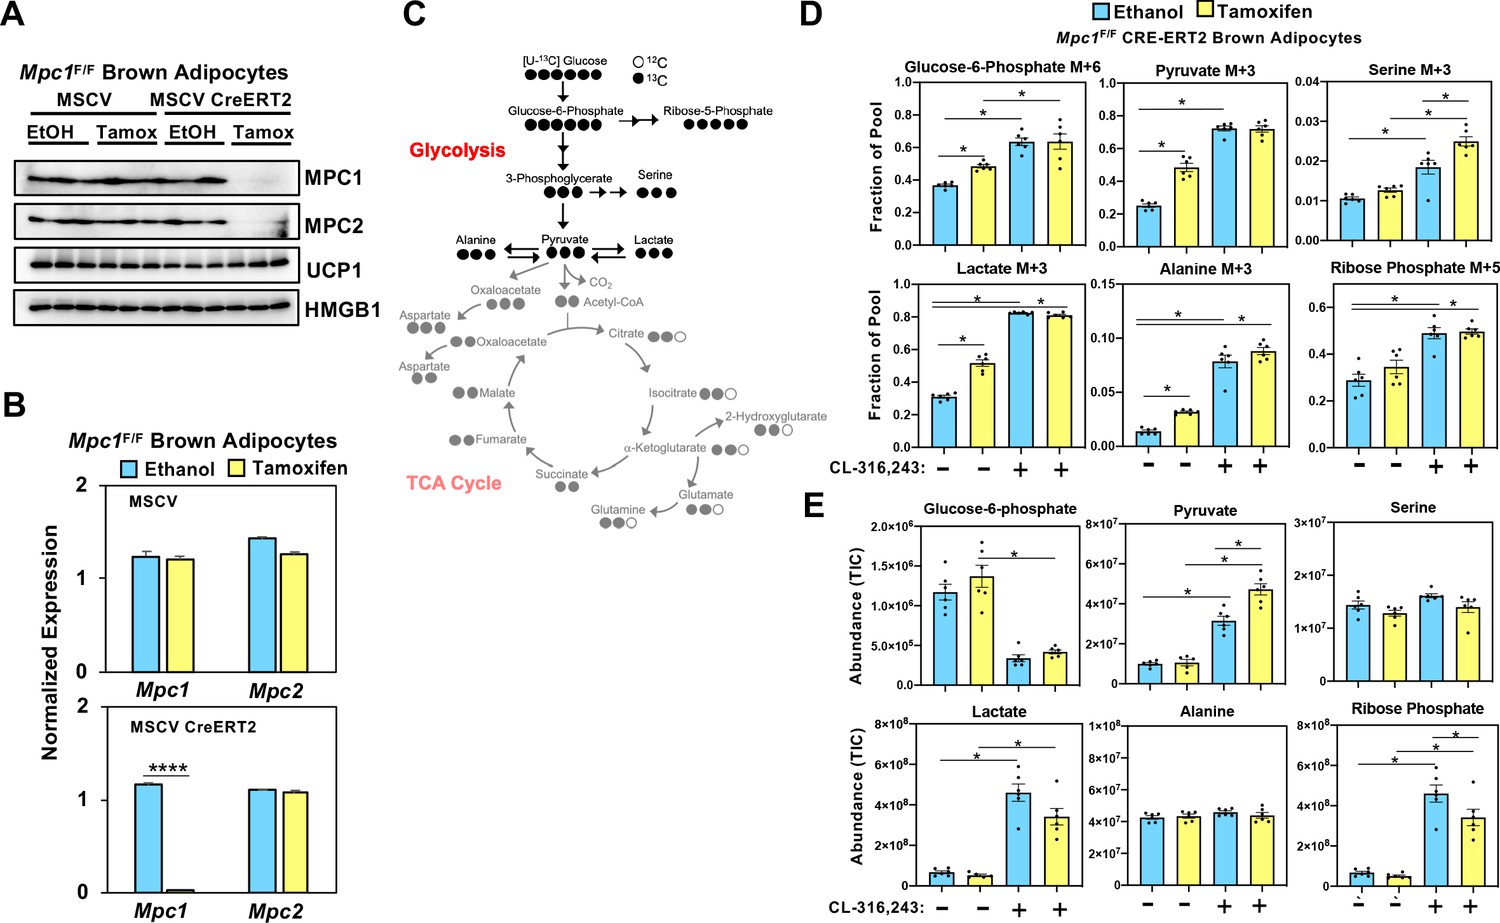
Loss of mitochondrial pyruvate carrier does not affect CL-316,243-stimulated increase in 13C-glycolytic flux.
(a) Western blot analysis of differentiated brown Mpc1F/F adipocytes expressing pMSCV2 or CreERT2 treated with ethanol or 4-hydroxy tamoxifen. N = 3. (b) Gene expression analysis in differentiated brown Mpc1F/F adipocytes expressing pMSCV2 or CreERT2 treated with ethanol or 4-hydroxy tamoxifen N = 3. (c) Atom mapping for [U-13C]-glucose tracing incorporation into the glycolytic intermediates. White circles are 12C atoms. Black circles are 13C atoms. (d) [U-13C]-glucose labeling in Mpc1F/F adipocytes expressing CreERT2 treated with ethanol or 4-hydroxy tamoxifen, with/without 100 nM CL-316,243 for 5 hours(N = 6). (e) Steady state levels of glycolytic intermediates in Mpc1F/F adipocytes expressing CreERT2 treated with ethanol or 4-hydroxy tamoxifen, with/without 100 nM CL-316,243 for 5 hours (N = 6).
Figure 5—figure supplement 1
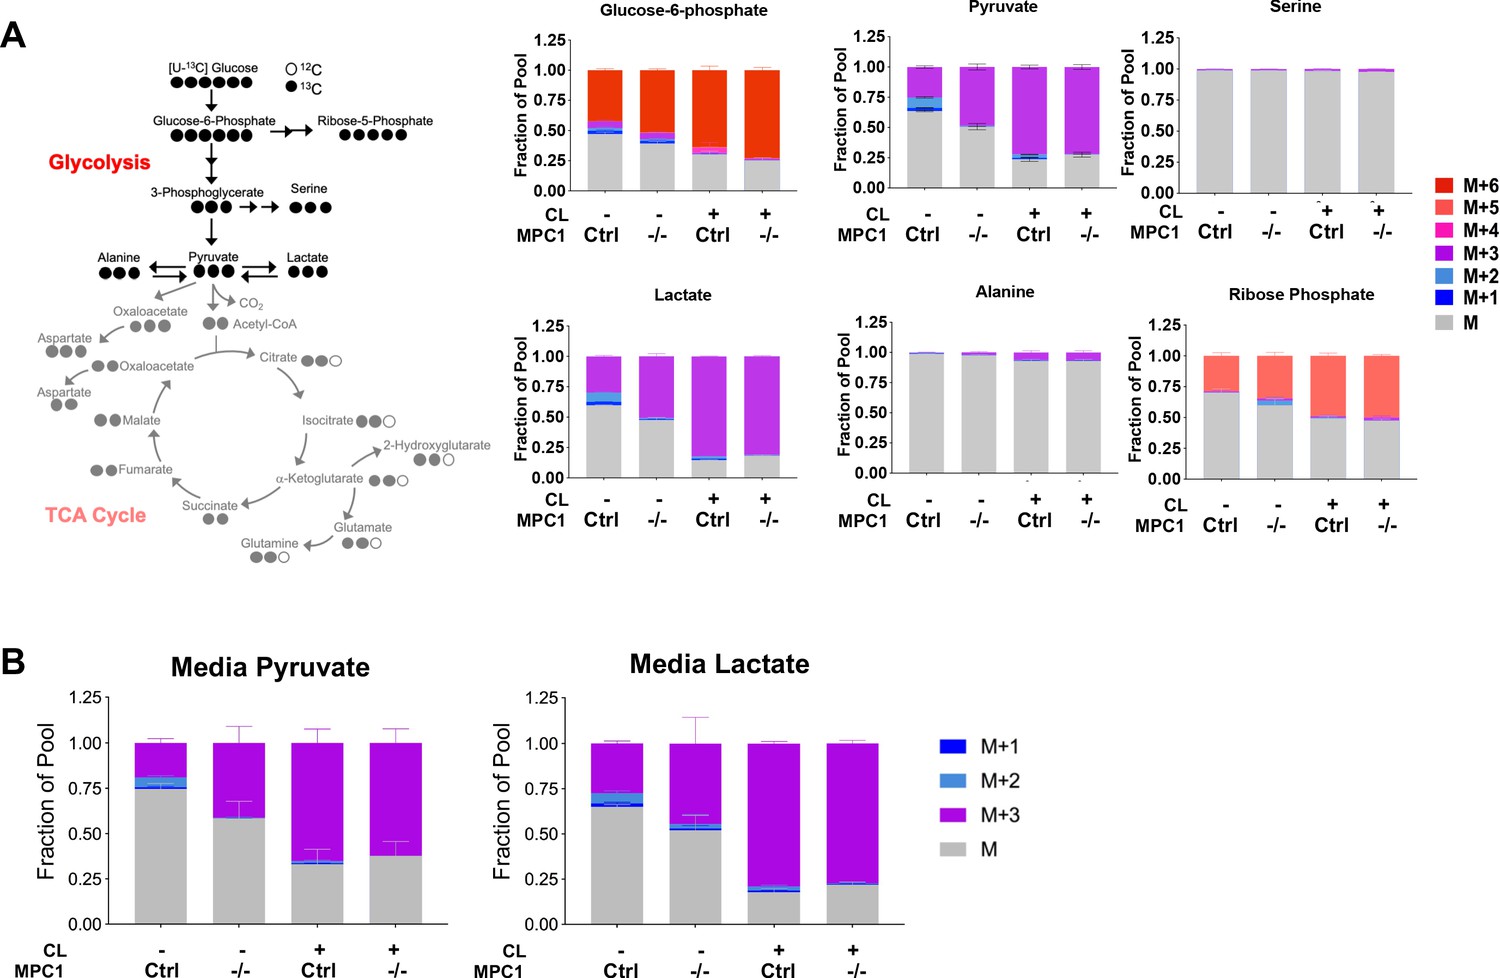
Isotopic labeling of glycolitic intermediates in brown adiopcytes labeled with [U-13C]-glucose.
(a) Labeling pattern of [U-13C]-glucose incorporation into the glycolytic intermediates in MPC1F/F adipocytes expressing CreERT2 treated with ethanol or 4-hydroxy tamoxifen, with/without 100 nM CL-316,243 for 5 hours (N = 6). Results are expressed as fraction of pool. (b) Total media pyruvate and lactate from Mpc1F/F adipocytes expressing CreERT2 treated with ethanol or 4-hydroxy tamoxifen, with/without 100 nM CL-316,243 for 5 hours in [U-13C] glucose (N = 6).
Figure 6 with 1 supplement
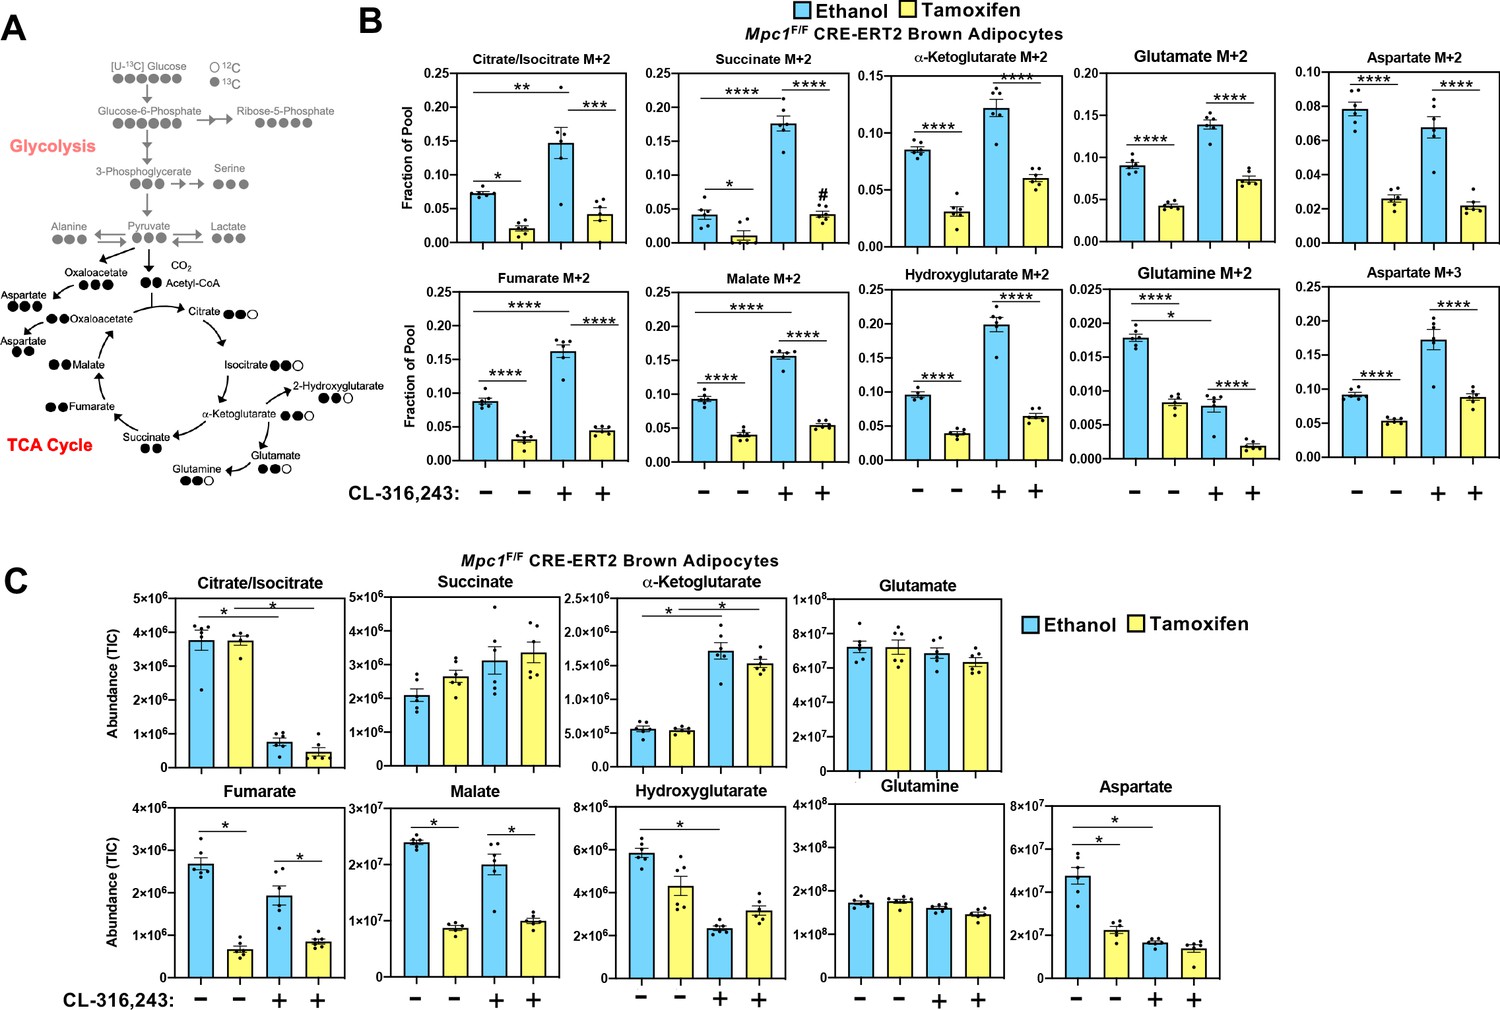
Mitochondrial pyruvate transport is required for 13C-glucose-derived TCA cycle intermediates.
(a) Atom mapping for [U-13C]-glucose tracing incorporation into the TCA cycle intermediates. White circles are 12C atoms. Black circles are 13C atoms. (b) [U-13C]-glucose labeling in Mpc1F/F adipocytes expressing CreERT2 treated with ethanol or 4-hydroxy tamoxifen, with/without 100 nM CL-316,243 for 5 hours (N = 6). (c) Steady state levels of TCA-cycle intermediates in Mpc1F/F adipocytes expressing CreERT2 treated with ethanol or 4-hydroxy tamoxifen, with/without 100 nM CL-316,243 for 5 hours (N = 6).
Figure 6—figure supplement 1

Loss of Mpc1 in brown adipocytes impairs incorporation of glucose-derived TCA-cycle intermediates.
(a) Labeling pattern of [U-13C]-glucose incorporation into the TCA-cycle intermediates in Mpc1F/F adipocytes expressing CreERT2 treated with ethanol or 4-hydroxy tamoxifen, with/without 100 nM CL-316,243 for 5 hours (N = 6). Results are expressed as fraction of pool.
Figure 7 with 1 supplement
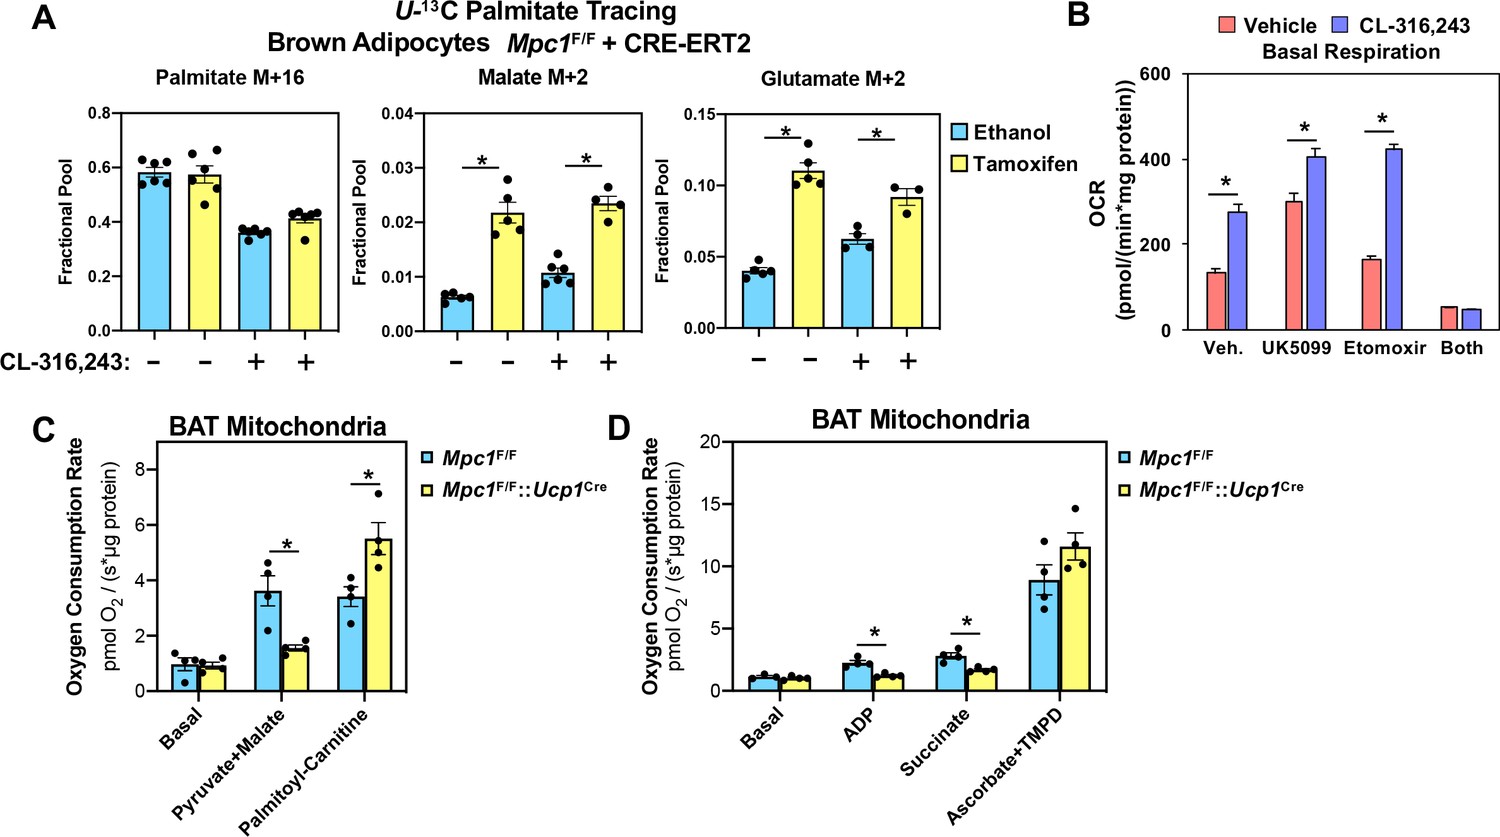
Conditional deletion of MPC1 in brown fat leads to compensatory increase in fatty acid oxidation.
(a) U-13C palmitate-tracing experiments in Mpc1F/F cells expressing CRE-ERT2. Cells were treated with ethanol or 4-hydroxy tamoxifen, with/without 100 nM CL-316,243 for 5 hours (N = 6). (b) Oxygen consumption rate in differentiated brown adipocytes treated with/without 100 nM CL-316,243 ± vehicle, 10 µM UK5099, 10 µM Etomoxir, or both (N = 10–12). (c) Oxygen consumption in mitochondria isolated from BAT of Mpc1F/F and Mpc1F/F::Ucp1Cre mice with 5 mM pyruvate and 0.5 mM malate or 5 mM L-Carnitine (N = 4). (d) Oxygen consumption in mitochondria isolated from BAT of Mpc1F/F and Mpc1F/F::Ucp1Cre mice with 1 mM ADP, 2 mM ascorbate and 0.5 mM TMPD (N = 4).
Figure 7—figure supplement 1
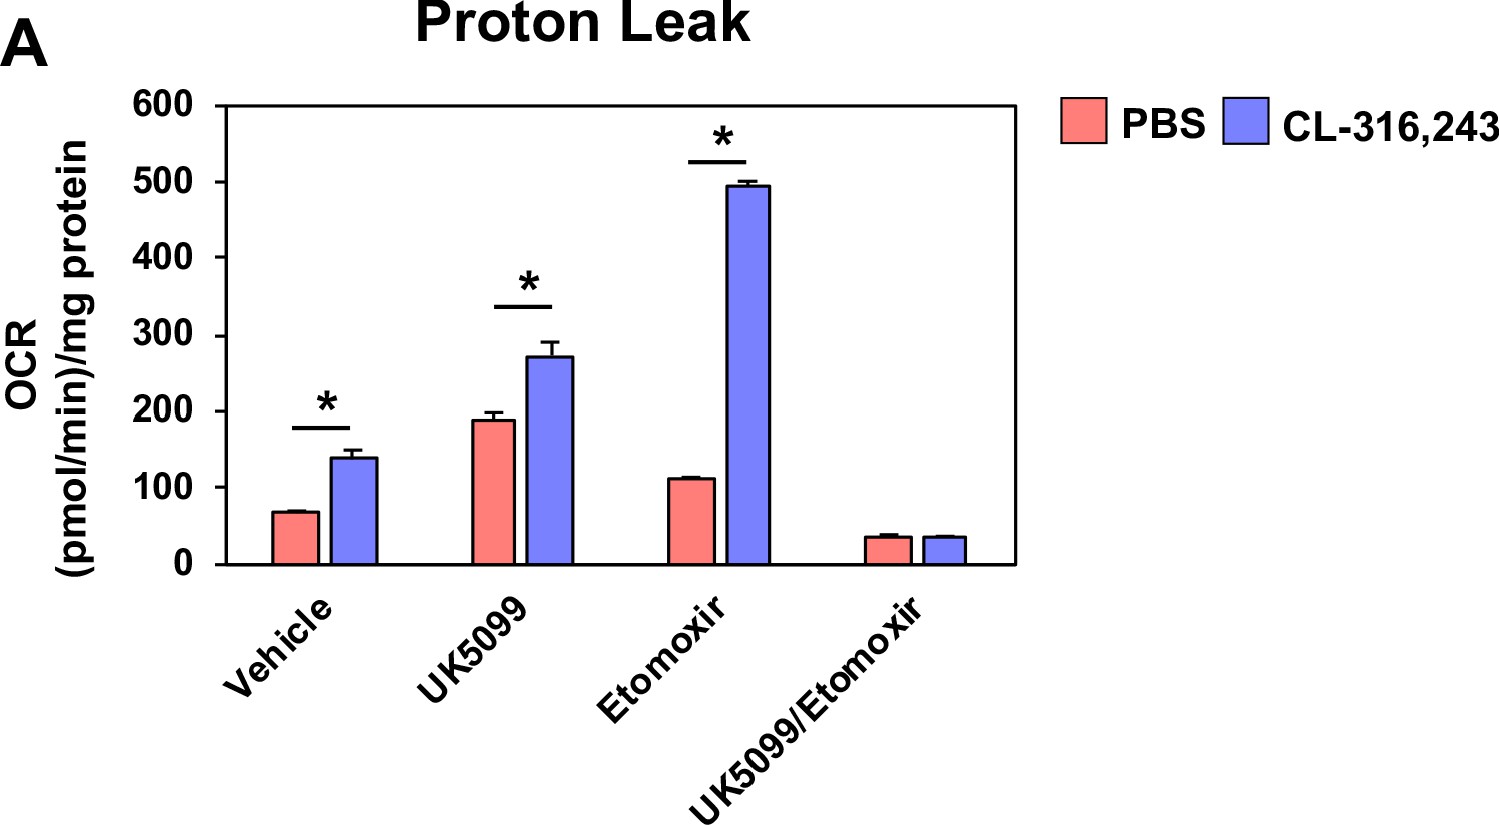
Proton leak in response to UK5099, etomoxir, or both.
(a) Seahorse analysis of proton leak in differentiated brown adipocytes treated with/without 100 nM CL-316,243 ± vehicle, 10 µM UK5099, 10 µM Etomoxir, or both (N = 10–12).
Figure 8 with 1 supplement

Conditional deletion of Mpc1 in brown fat leads to increased ketogenesis.
(a) Volcano plot showing changes in serum metabolites between Mpc1F/F and Mpc1F/F::Ucp1Cre mice housed at 4°C for 6 hr. N = 6. (b) Heat map of top 25 metabolites in BAT from Mpc1F/F and Mpc1F/F::Ucp1Cre mice housed at 4°C for 6 hr. Dendograms illustrate hierarchical clustering across metabolites (left) and genotypes (top). N = 6. Data was sum normalized, log transformed, and autoscaled. (c) Serum 3-hydroxybutyrate levels from Mpc1F/F and Mpc1F/F::Ucp1Cre mice housed at 23°C or 4°C for 6 hr. N = 6. (d) Gene expression analysis of livers from Mpc1F/F and Mpc1F/F::Ucp1Cre mice housed at 4°C for 6 hr. N = 6.
Figure 8—figure supplement 1
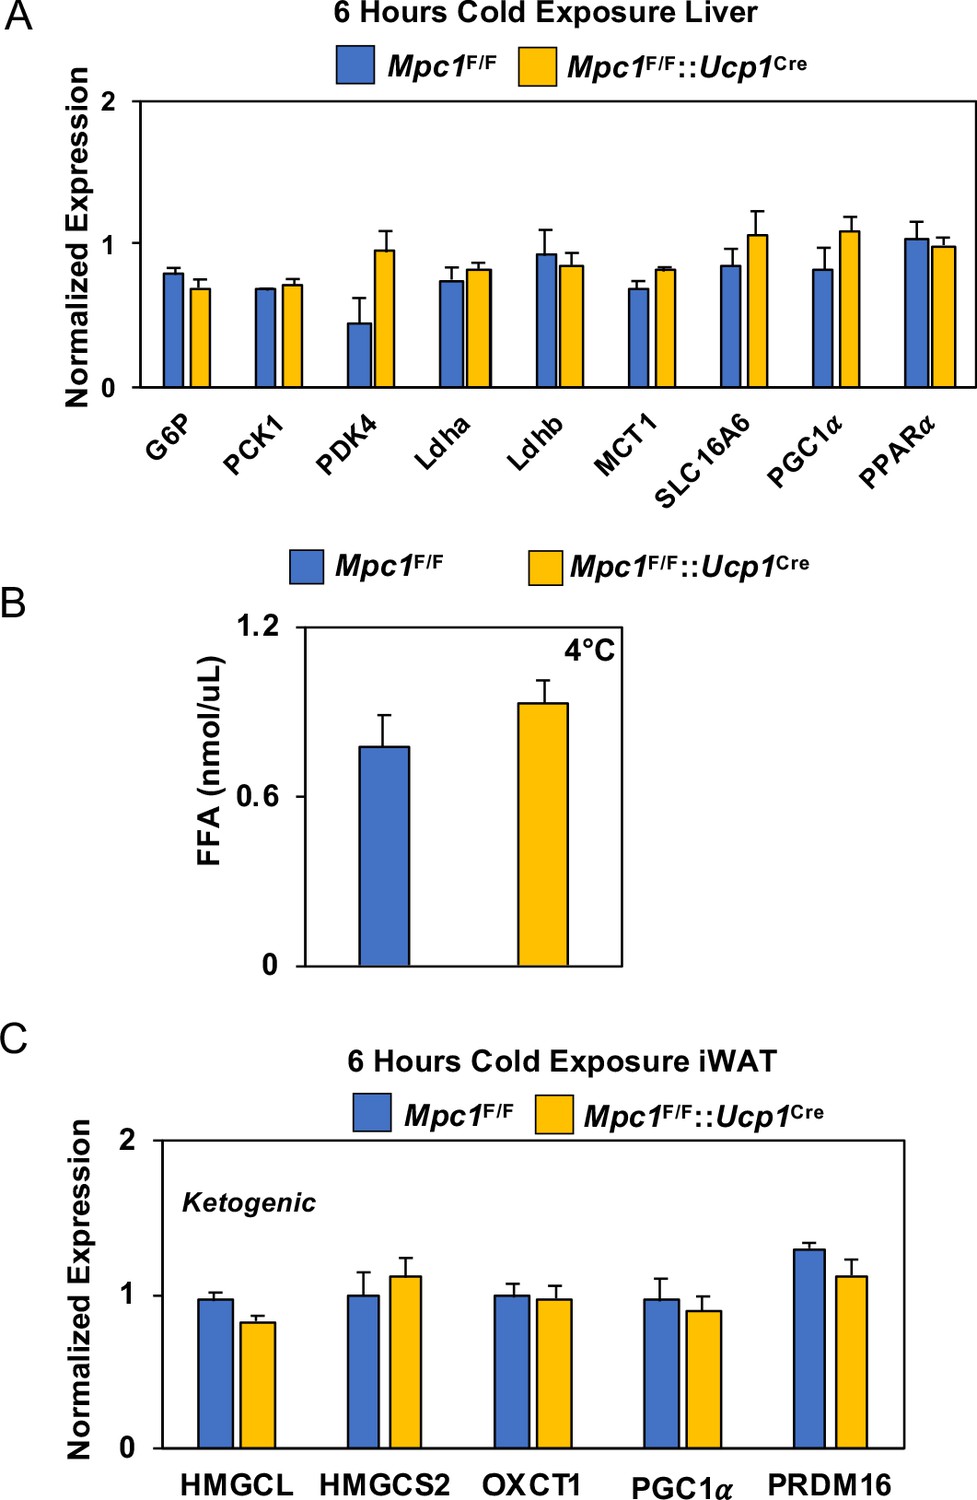
Gene expression analysis and serum FFA levels.
(a) Gene expression in liver from Mpc1F/F and Mpc1F/F::Ucp1Cre mice housed at 4°C for 6 hr. Data was analyzed by Student’s t-test. Values are shown as mean + s.e.m. (p<0.05). (b) Free fatty acid levels in serum of Mpc1F/F and Mpc1F/F::Ucp1Cre mice housed at 4°C for 6 hr (N = 6) (c) Ketogenic gene expression in iWAT from Mpc1F/F and Mpc1F/F::Ucp1Cre mice housed at 4°C for 6 hr. Data was analyzed by Student’s t-test. Values are shown as mean + s.e.m. (N = 6).
Additional files
-
Supplementary file 1
List of 1907 genes up-regulated in response to the cold.
- https://cdn.elifesciences.org/articles/52558/elife-52558-supp1-v2.xlsx
-
Supplementary file 2
List of 3273 genes down-regulated in response to the cold.
- https://cdn.elifesciences.org/articles/52558/elife-52558-supp2-v2.xlsx
-
Supplementary file 3
Metabolite analysis in brown adipose tissue at 30°C, 23°C, and 4°C.
- https://cdn.elifesciences.org/articles/52558/elife-52558-supp3-v2.xlsx
-
Supplementary file 4
Metabolite analysis of serum at 30°C, 23°C, and 4°C.
- https://cdn.elifesciences.org/articles/52558/elife-52558-supp4-v2.xlsx
-
Supplementary file 5
List of metabolites from serum of MPC1 F/F and MPC1 F/F::UCP1-Cre mice housed at 4°C for 6 hr.
- https://cdn.elifesciences.org/articles/52558/elife-52558-supp5-v2.xlsx
-
Supplementary file 6
List of metabolites from BAT of MPC1 F/F and MPC1 F/F UCP1 Cre mice housed at 4°C for 6 hr.
- https://cdn.elifesciences.org/articles/52558/elife-52558-supp6-v2.xlsx
-
Supplementary file 7
Real-time PCR primer list.
- https://cdn.elifesciences.org/articles/52558/elife-52558-supp7-v2.xlsx
-
Transparent reporting form
- https://cdn.elifesciences.org/articles/52558/elife-52558-transrepform-v2.docx
Download links
A two-part list of links to download the article, or parts of the article, in various formats.
Downloads (link to download the article as PDF)
Open citations (links to open the citations from this article in various online reference manager services)
Cite this article (links to download the citations from this article in formats compatible with various reference manager tools)
Mitochondrial pyruvate carrier is required for optimal brown fat thermogenesis
eLife 9:e52558.
https://doi.org/10.7554/eLife.52558


