p16 deficiency attenuates intervertebral disc degeneration by adjusting oxidative stress and nucleus pulposus cell cycle
- Department of Orthopaedics, The First Affiliated Hospital of Nanjing Medical University, China
- University Medical Center, Albert-Ludwigs-University, Germany
- Department of Orthopaedics, Xuzhou Central Hospital, Xuzhou Clinical College of Nanjing Medical University, The Affiliated Xuzhou Hospital of Southeast University, China
- The Affiliated Huai’an No.1 People’s Hospital of Nanjing Medical University, China
- Suzhou Institute of Nano-Tech and Nano-Bionics, Chinese Academy of Sciences, China
- Department of Hand Surgery, Department of Plastic Reconstructive Surgery, China
- School of Pharmacy and Medical Sciences and UniSA Cancer Research Institute, University of South Australia, Australia
- State Key Laboratory of Reproductive Medicine, The Research Center for Bone and Stem Cells, Department of Anatomy, Histology and Embryology, Nanjing Medical University, China
Figures
Figure 1 with 2 supplements
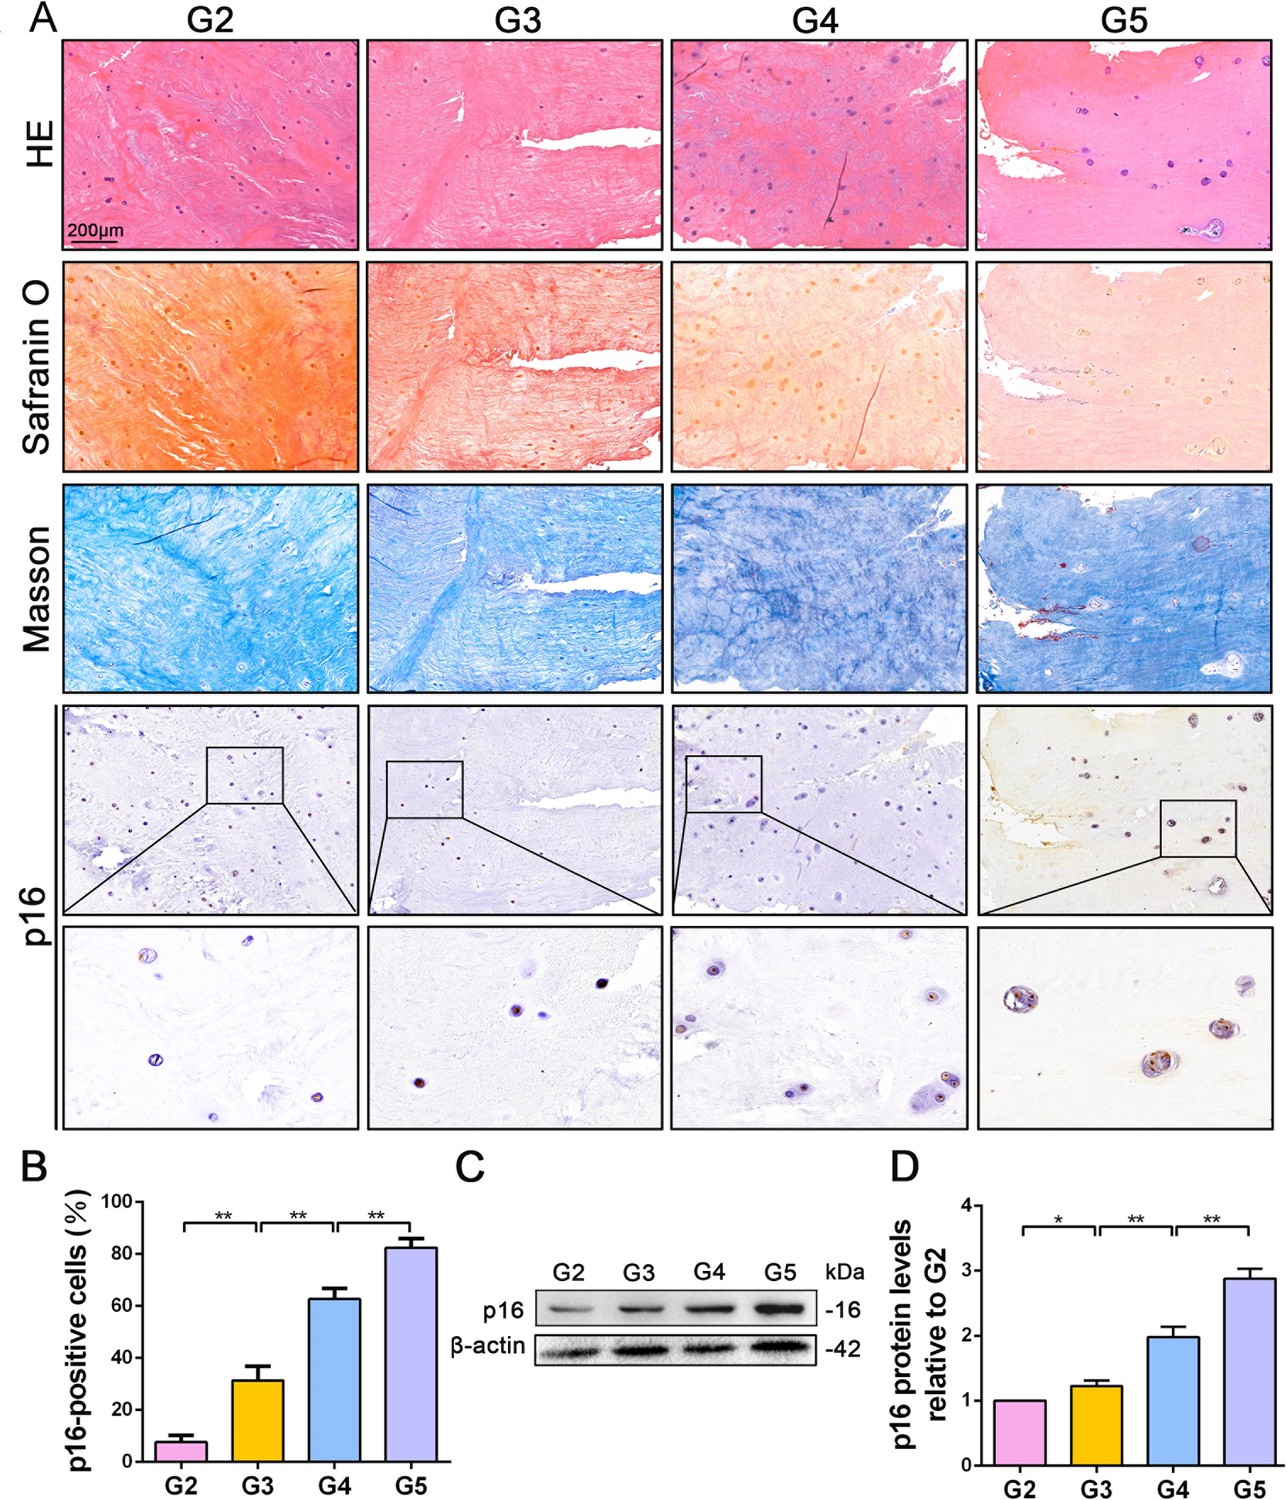
p16 expression in NP cells from human interverbal discs with different degrees of degeneration (G2–G5 groups according to Pfirrmann grade).
(A) Representative images of H and E staining showing cell/tissue general morphology. Safranin O staining with collagen and NP cells appearing orange and fibers blue/violet. Masson staining with collagen and NP cells appearing blue and fibers red; and immunohistochemical staining for p16. (B) Quantification of p16-positive cells (%). p16 protein levels were assessed by (C) western blotting and (D) measured by densitometric analyses and expressed as folds relative to grade 2 (G2) NP samples. Data are presented as mean ± SD (n = 3); *p<0.05; **p<0.01.
-
Figure 1—source data 1
Source data and related summary statistics for Figure 1A and C.
- https://cdn.elifesciences.org/articles/52570/elife-52570-fig1-data1-v2.xlsx
Figure 1—figure supplement 1

Representative magnetic resonance imaging (MRI) scans of patients with different categories of disc degeneration according to Pfirrmann grade.
Grades 2–5: G2–5. The yellow arrow indicates the surgical site.
Figure 1—figure supplement 2
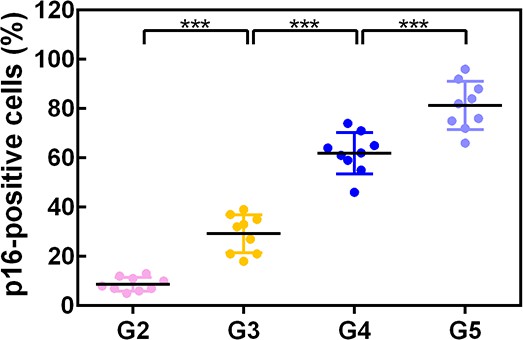
Pffirmann grade of the degenerated disc from the human specimens correlates individually with p16 expression. ***p<0.001.
-
Figure 1—figure supplement 2—source data 1
Related summary statistics.
- https://cdn.elifesciences.org/articles/52570/elife-52570-fig1-figsupp2-data1-v2.xlsx
Figure 2 with 1 supplement
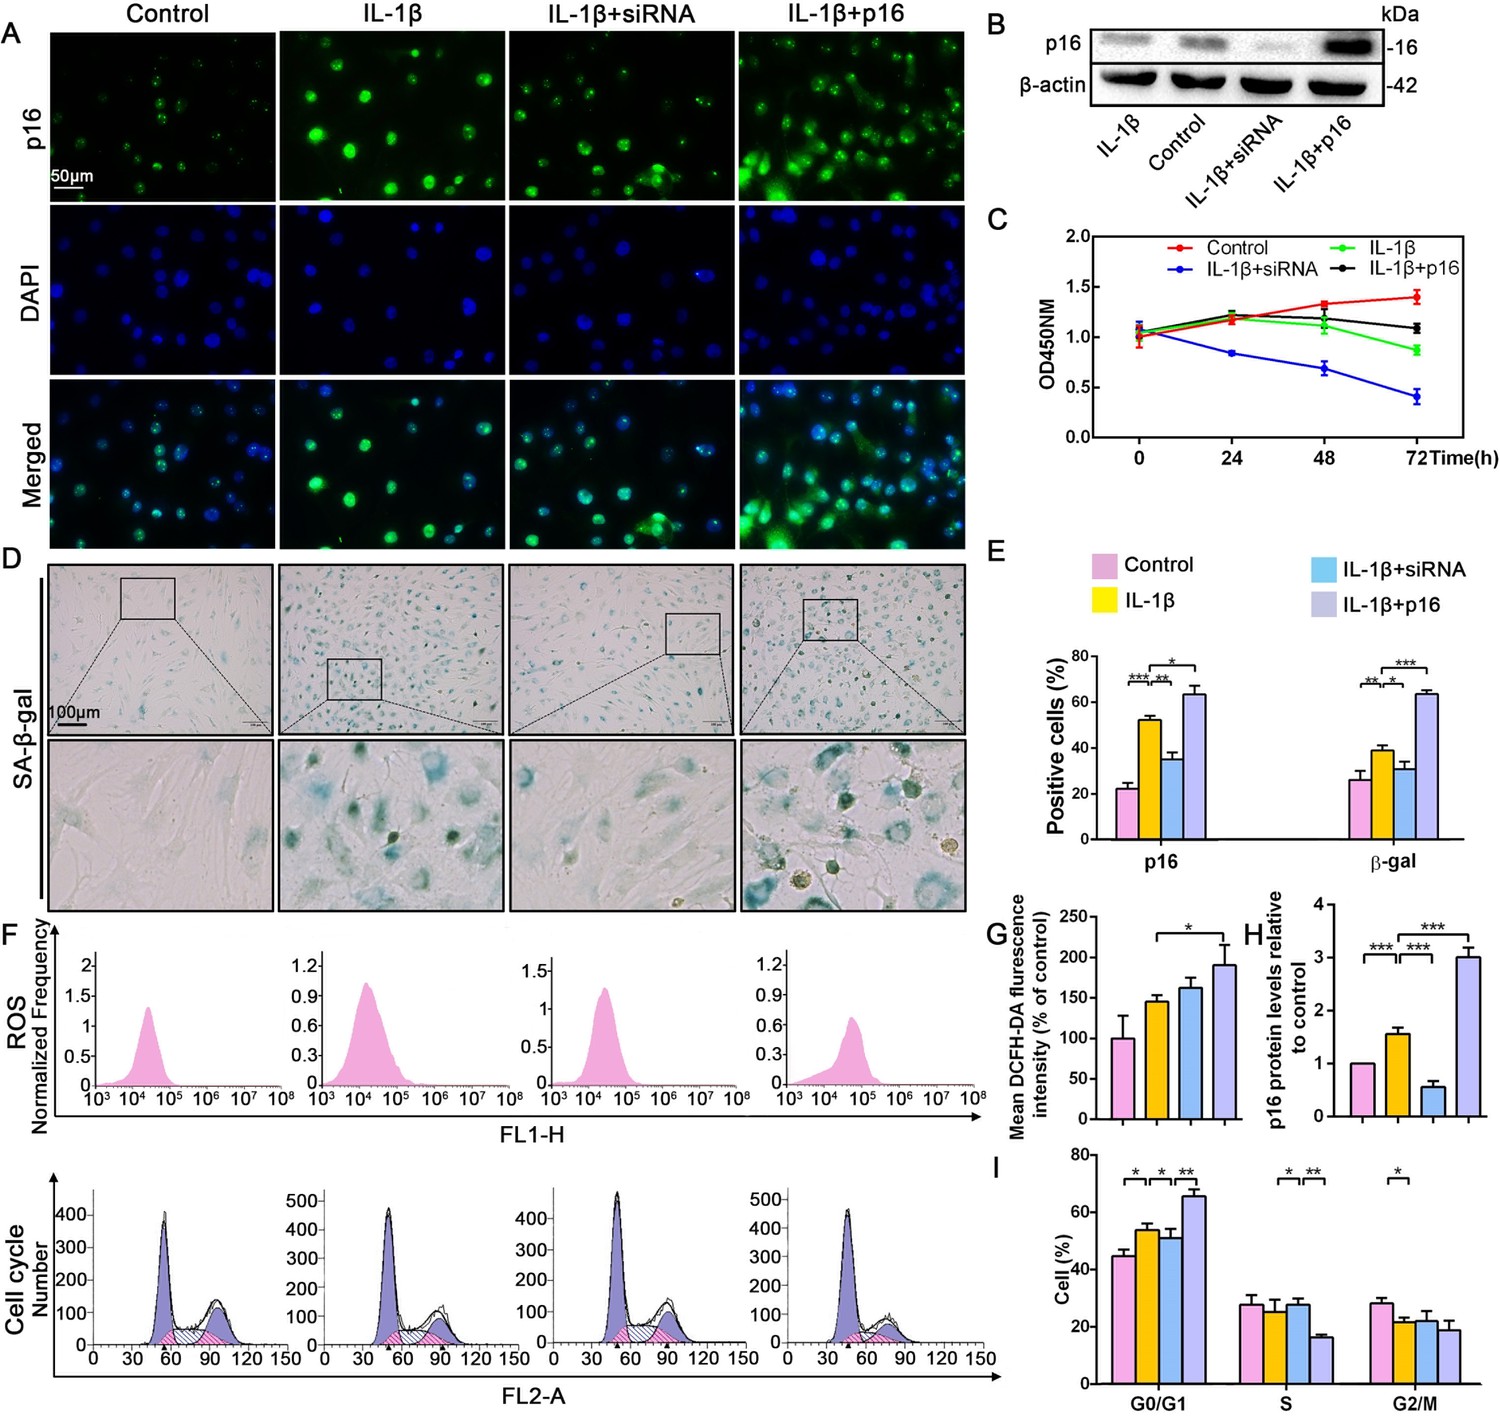
Effect of p16 on senescence, reactive oxygen species (ROS) levels and NP cell proliferation upon IL-1β stimulation (10 ng/mL).
Human NP cells were grouped as follows: normal cultured cells (control), IL-1β treated cells (IL-1β), p16-siRNA-transfected cells treated with IL-1β (IL-1β+siRNA), and p16 plasmid-transfected cells treated with IL-1β (IL-1β+p16). (A) Representative immunofluorescent micrographs stained for p16. (B) p16 protein levels as assessed by western blotting. (C) Cell proliferation as assessed by CCK-8 assays. (D) SA-β-gal staining. (E) Total p16‐positive and β-gal‐positive cells (%). (F) ROS levels and the cell-cycle distribution of freshly collected human NP cells as determined by flow cytometry. (G) Quantitation of ROS levels. (H) p16 level measured by densitometric analysis and expressed relative to the control. (I) Cell-cycle distribution. Data are presented as mean ± SD (n = 3); *p<0.05; **p<0.01; ***p<0.001.
-
Figure 2—source data 1
Source data and related summary statistics for Figure 2B, C, D and F.
- https://cdn.elifesciences.org/articles/52570/elife-52570-fig2-data1-v2.xlsx
Figure 2—figure supplement 1
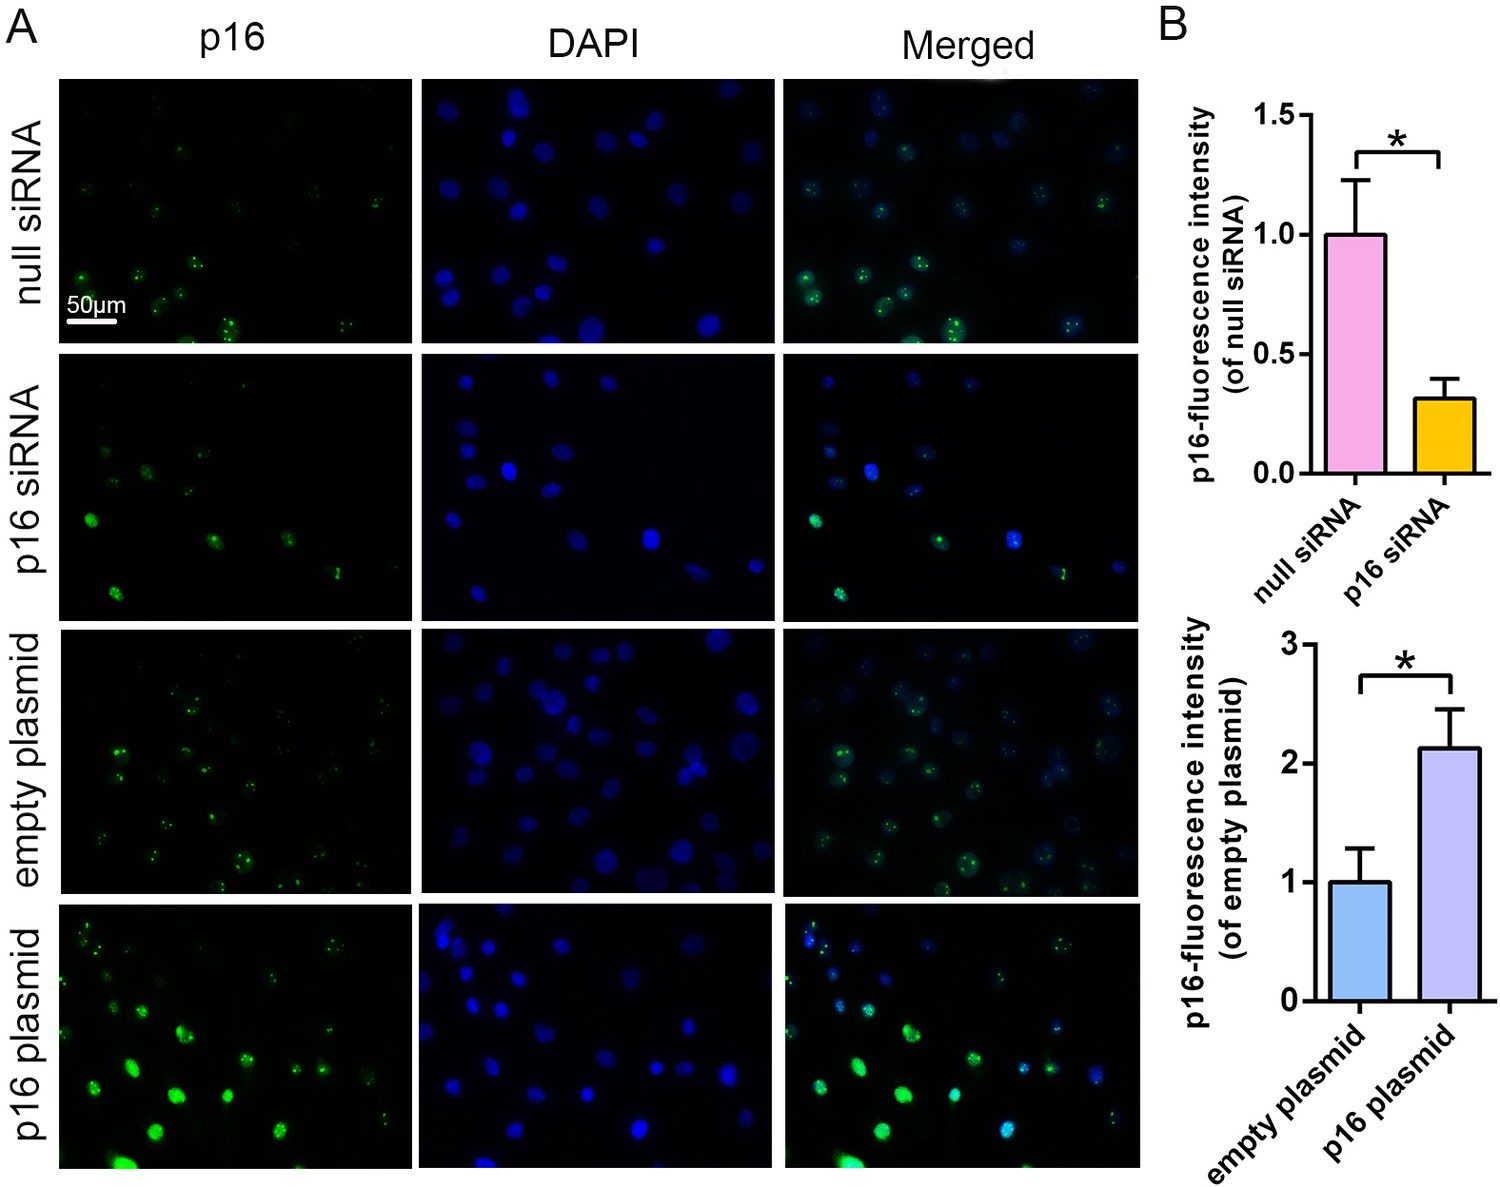
Efficiency of transfection with p16 siRNA and the p16 plasmid compared with that with null siRNA and empty plasmid.
(A) Representative immunofluorescence micrographs stained for null siRNA, p16 siRNA, empty plasmid, and p16 plasmid. (B) Total p16-positive cells (%). P16 expression is significantly different between NP cells transfected with null siRNA and p16 siRNA or with empty plasmid and p16 plasmid. Data are presented as the mean ± SD (n = 3); *p<0.05.
Figure 3
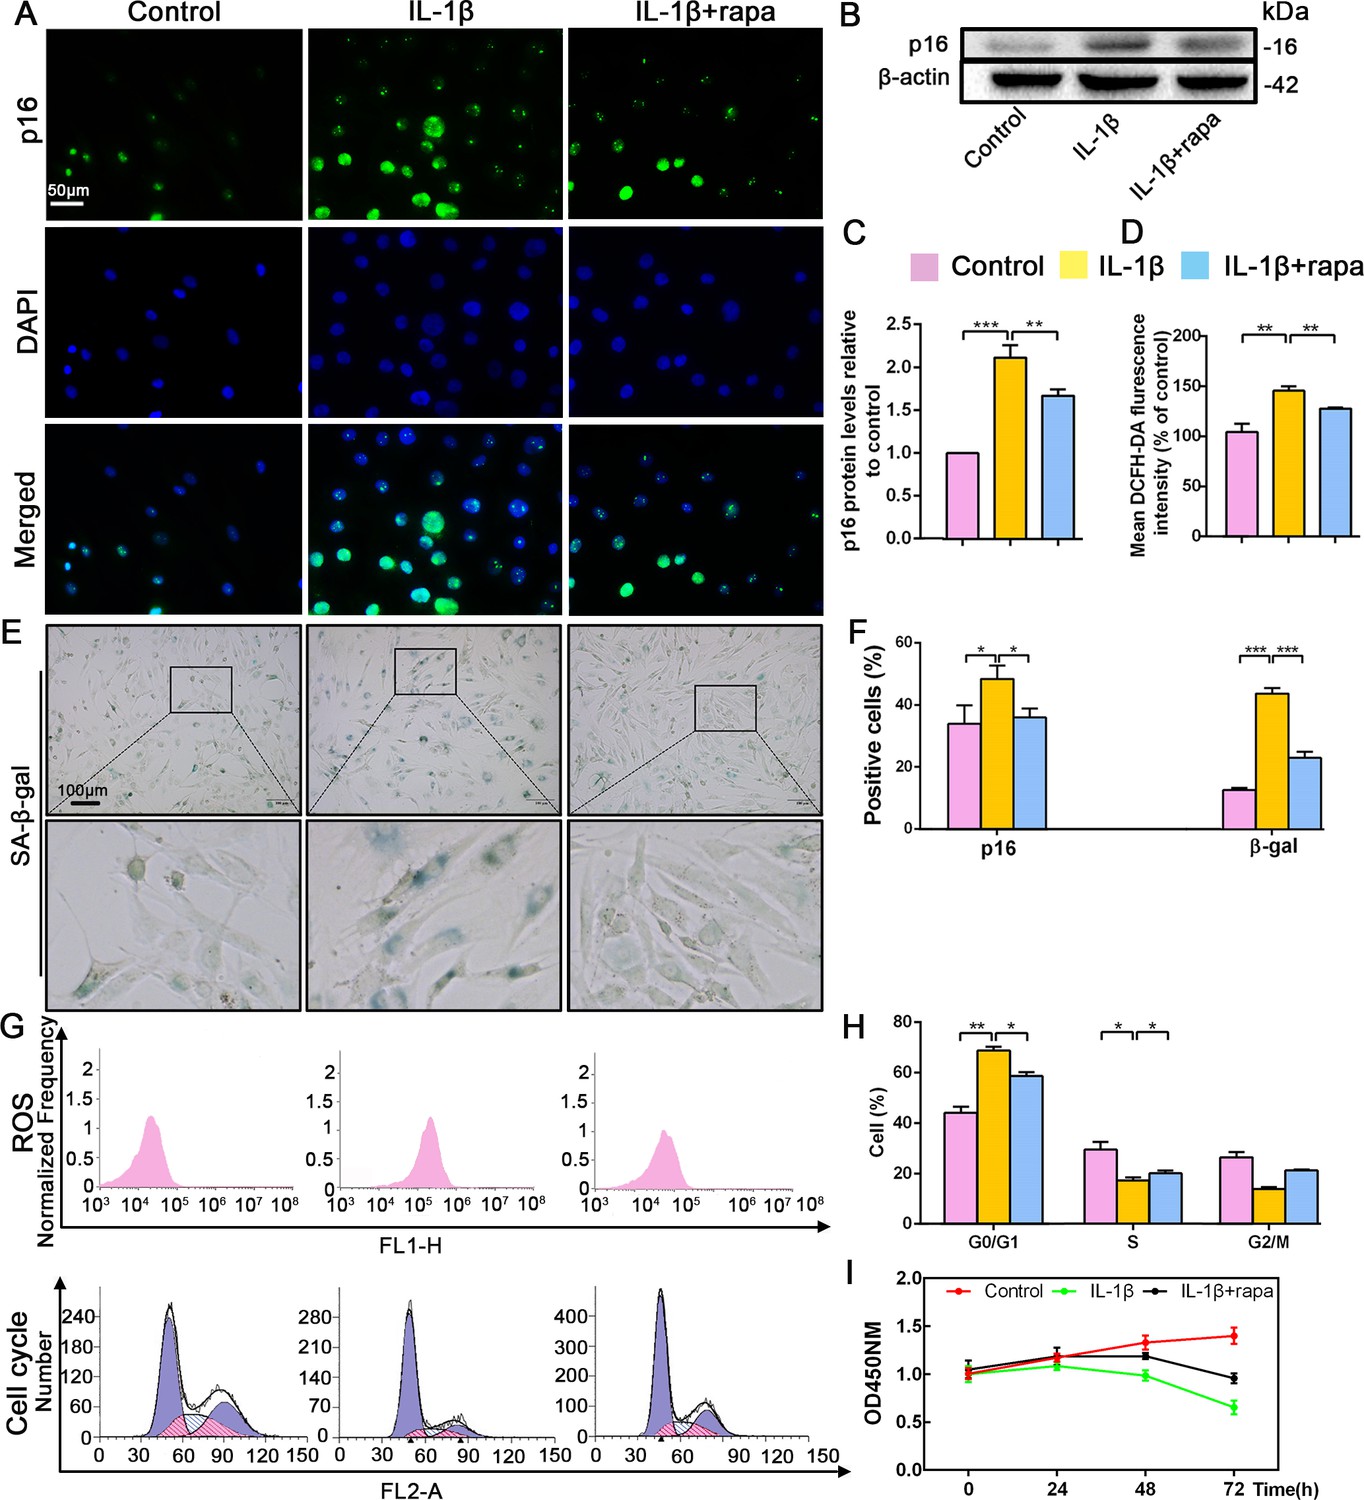
Effect of rapamycin (50 nM) on senescence, reactive oxygen species (ROS) levels and NP cell proliferation upon IL-1β stimulation (10 ng/mL).
Human NP cells were grouped as follows: normal cultured cells (control), IL-1β treated cells (IL-1β), and rapamycin-stimulated cells treated with IL-1β (IL-1β+rapa). (A) Representative immunofluorescent micrographs stained for p16. p16 protein levels as (B) assessed by western blotting and (C) measured by densitometric analysis, with results expressed relative to the control. (D) Quantitation of ROS levels. (E) SA-β-gal staining. (F) Total p16‐positive and β-gal‐positive cells (%). (G) ROS levels and the cell-cycle distribution of freshly collected human NP cells as determined by flow cytometry. (H) Cell-cycle distribution. (I) Cell proliferation as assessed by CCK-8 assays. Data are presented as mean ± SD (n = 3). *p<0.05; **p<0.01; ***p<0.001.
-
Figure 3—source data 1
Source data and related summary statistics Figure 3B, E, G and I.
- https://cdn.elifesciences.org/articles/52570/elife-52570-fig3-data1-v2.xlsx
Figure 4 with 4 supplements

p16 deletion delayed mouse intervertebral disc degeneration (IVDD).
WT and p16 KO mice were fed on the ground or with tail suspension (TS). (A) Radiographs of overall mouse length. (B) After H and E staining and Safranin O staining, collagen and NP cells are orange, and fibers are blue. (C) The intervertebral disc height index as calculated on the basis of lumbar vertebrae. (D) Associated protein levels as assessed by western blotting and (E) as measured by densitometric analysis, with results expressed relative to those in WT mice. (F) Target mRNA expression assessed by RT-PCR relative to GAPDH expression. (G) IL-1β, IL-6 and TNF-α levels in disc tissues as determined by ELISA. (H) The modified Thompson classification as assessed on the basis of lumbar disc signals. (I) Safranin O-positive area (%). Data are presented as mean ± SD (n = 3); *p<0.05; **p<0.01; ***p<0.001.
-
Figure 4—source data 1
Source data and related summary statistics for Figure 4B, C, D, G and H.
- https://cdn.elifesciences.org/articles/52570/elife-52570-fig4-data1-v2.xlsx
Figure 4—figure supplement 1
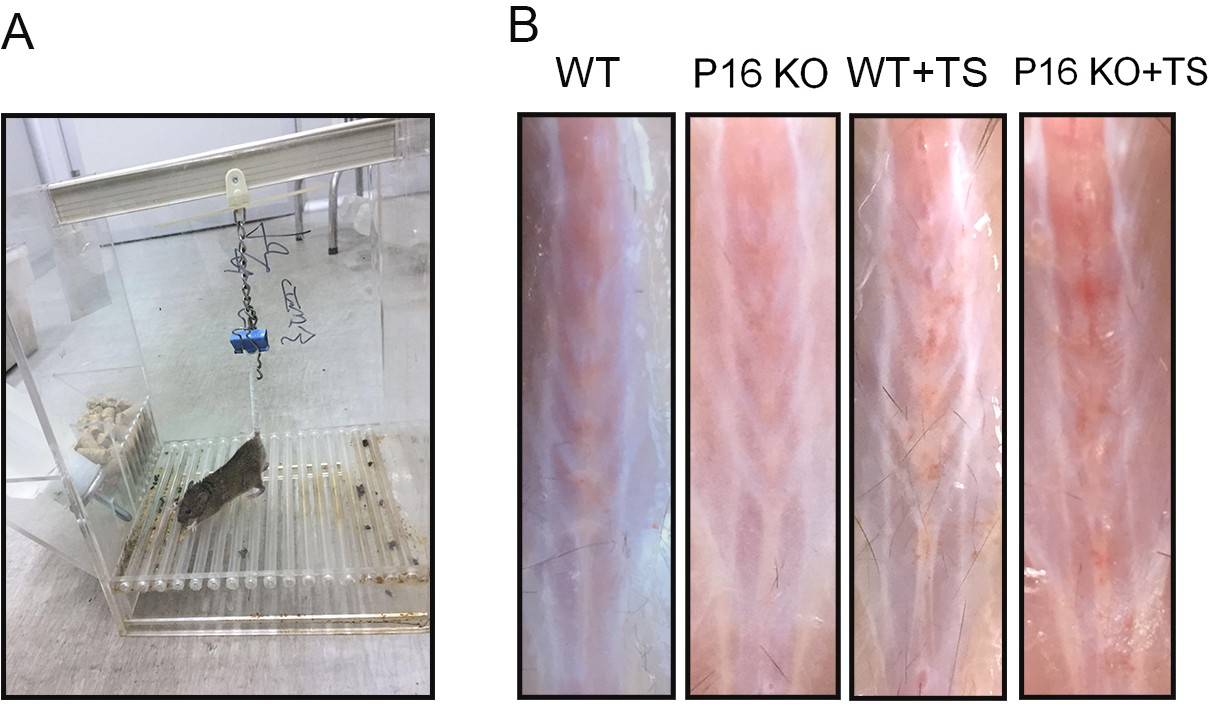
Establishment of TS-induced mouse IVDD model.
(A) A specialized cage used to suspend the tails of mice. The mice could obtain food and water freely in the cage. (B) Mice were sacrificed after 4 weeks of suspension. The muscles around the spine were bloodshot with varying degrees of injury. Tail suspension (TS) caused visibly bloodshot muscles, which were alleviated by p16 KO.
Figure 4—figure supplement 2
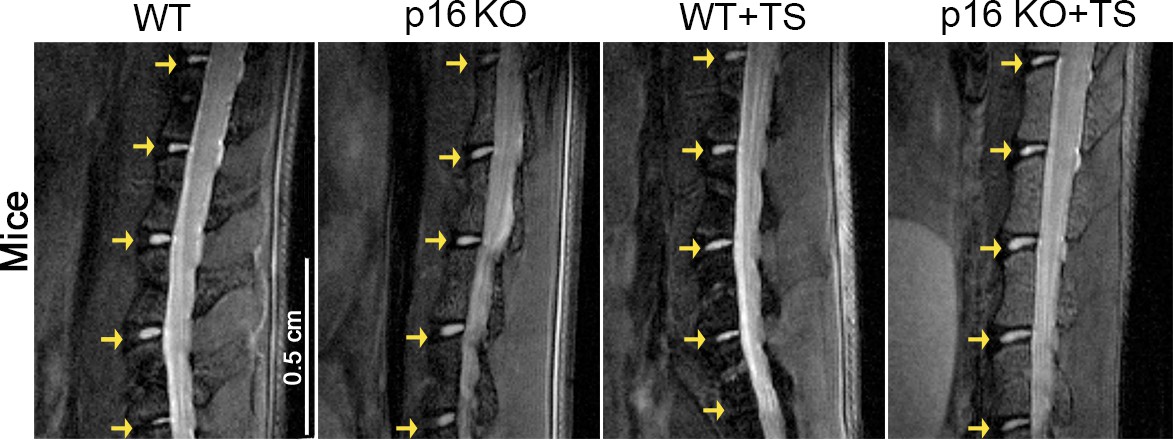
Representative micro-MRI of mouse intervertebral discs.
The larger white area that the disc has, the more water it contains, and this is positively related to the degree of disc degeneration. The yellow arrow indicates the disc site.
Figure 4—figure supplement 3
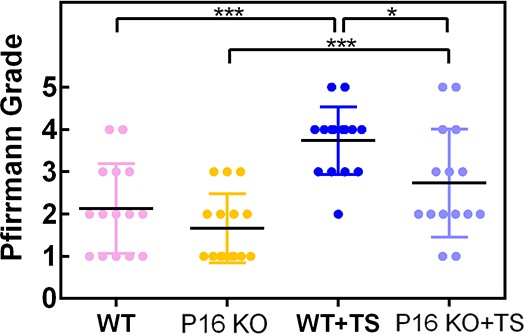
Pffirmann grade of degenerated disc from the mice specimens.
*p<0.05; ***p<0.001.
-
Figure 4—figure supplement 3—source data 1
Related summary statistics.
- https://cdn.elifesciences.org/articles/52570/elife-52570-fig4-figsupp3-data1-v2.xlsx
Figure 4—figure supplement 4
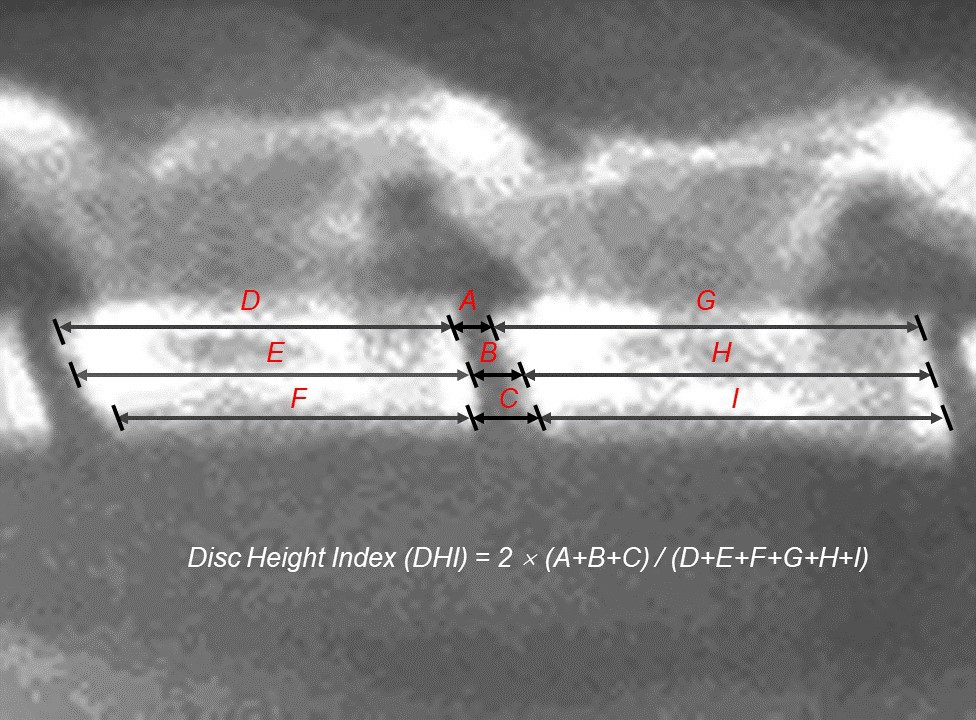
The intervertebral disc height index (DHI) was calculated by averaging the measurements obtained from the (A) posterior, (B) middle, and (C) anterior portions of the intervertebral disc and dividing these values by the average height of the adjacent (D–I) posterior, middle, and anterior portions of the vertebral body.
Figure 5
p16 deletion exerted an antioxidant effect and promoted mouse NP cell proliferation in vivo.
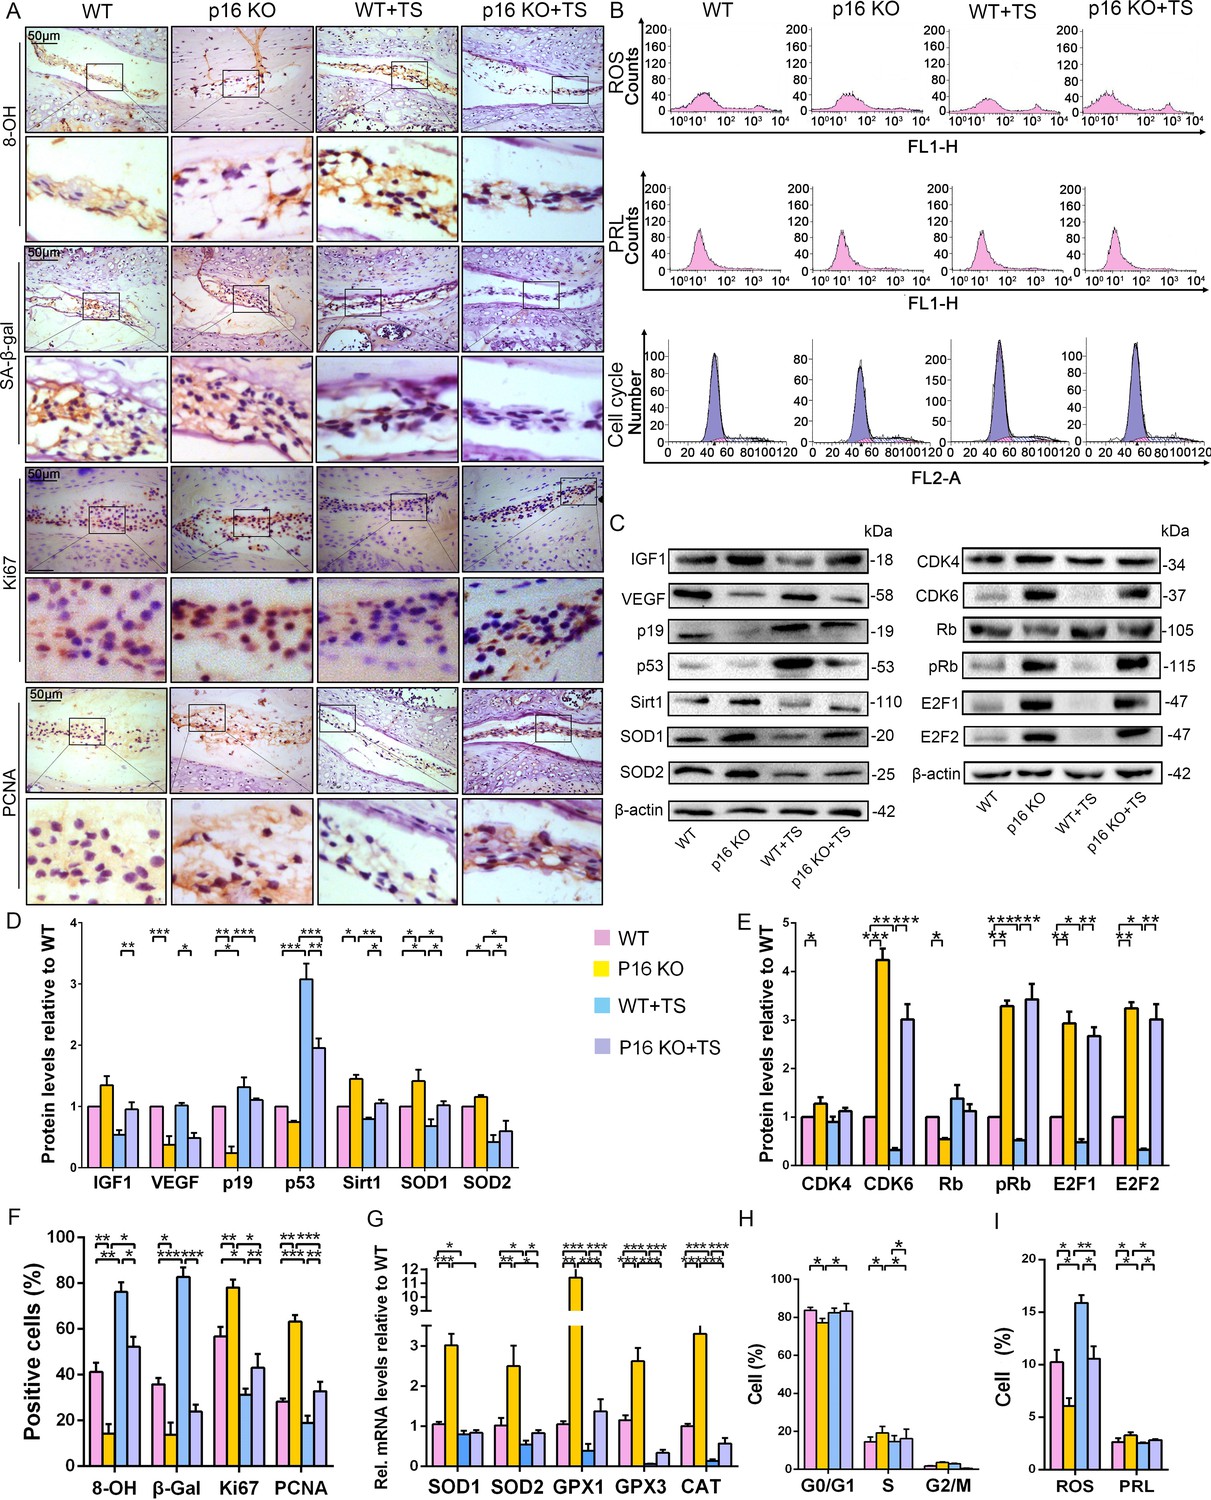
WT and p16 KO mice were fed on the ground or with tail suspension (TS). (A) Representative micrographs of slices stained immunohistochemically for 8-hydroxy-2 deoxyguanosine (8-OHdG), senescence-associated β-galactosidase (SA-β-gal), Ki67 and proliferating cell nuclear antigen (PCNA). (B) Reactive oxygen species (ROS) levels, cell proliferation (PRL) and cell-cycle distribution in freshly collected mouse NP cells, as measured by flow cytometry. (C) Associated protein levels were assessed by western blotting and (D, E) measured by densitometric analysis with results expressed relative to those in WT mice. (F) Percentage of total immuno-positive cells (%). (G) Target mRNA expression as assessed by RT-PCR relative to GAPDH expression. (H) Cell-cycle distribution. (I) ROS and PRL (%) quantitation. Data are presented with mean ± SD (n = 3); *p<0.05, **p<0.01, ***p<0.001.
-
Figure 5—source data 1
Source data and related summary statistics for Figure 5A, B and C.
- https://cdn.elifesciences.org/articles/52570/elife-52570-fig5-data1-v2.xlsx
Figure 6 with 1 supplement
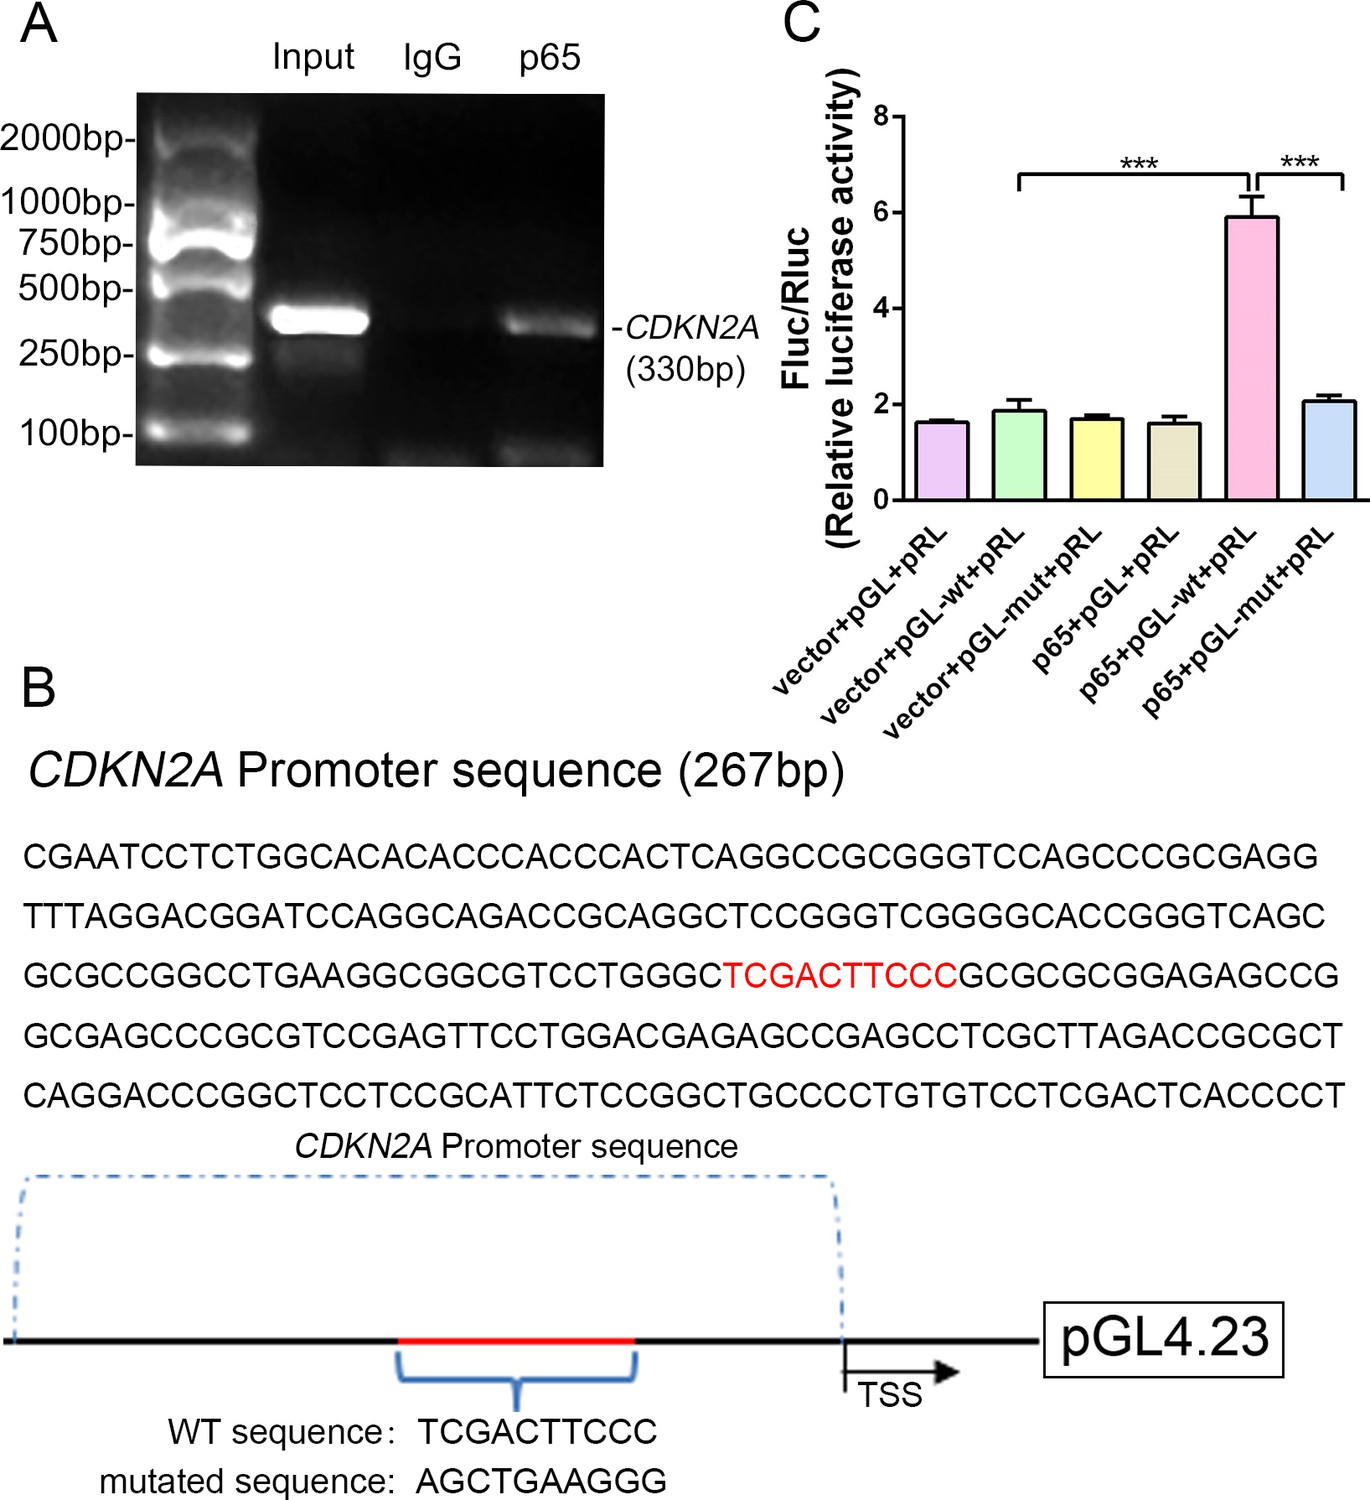
NF-κB-p65 bound the CDKN2A gene promoter and promoted p16 expression in human NP cells.
(A) CDKN2A promoter sequences were recovered by PCR from p65 immunoprecipitates. (B) p65‐like elements in the human CDKN2A promoter region and the mutated sequence are marked in red (upper panels). Below: structural schematic of the WT and mutant pGL4.23-p16 promoter reporter plasmids. (C) Luciferase activity driven by the CDKN2A promoter was more pronounced following NF-κB treatment. By contrast, luciferase activity that was not driven by the CDKN2A luciferase reporter decreased in the absence of NF-κB, and luciferase activity not driven by the mutant CDKN2A luciferase reporter decreased upon NF-κB treatment. Data are shown with mean ± SD (n = 3); ***p<0.001.
-
Figure 6—source data 1
Source data and related summary statistics for Figure 6C.
- https://cdn.elifesciences.org/articles/52570/elife-52570-fig6-data1-v2.xlsx
Figure 6—figure supplement 1
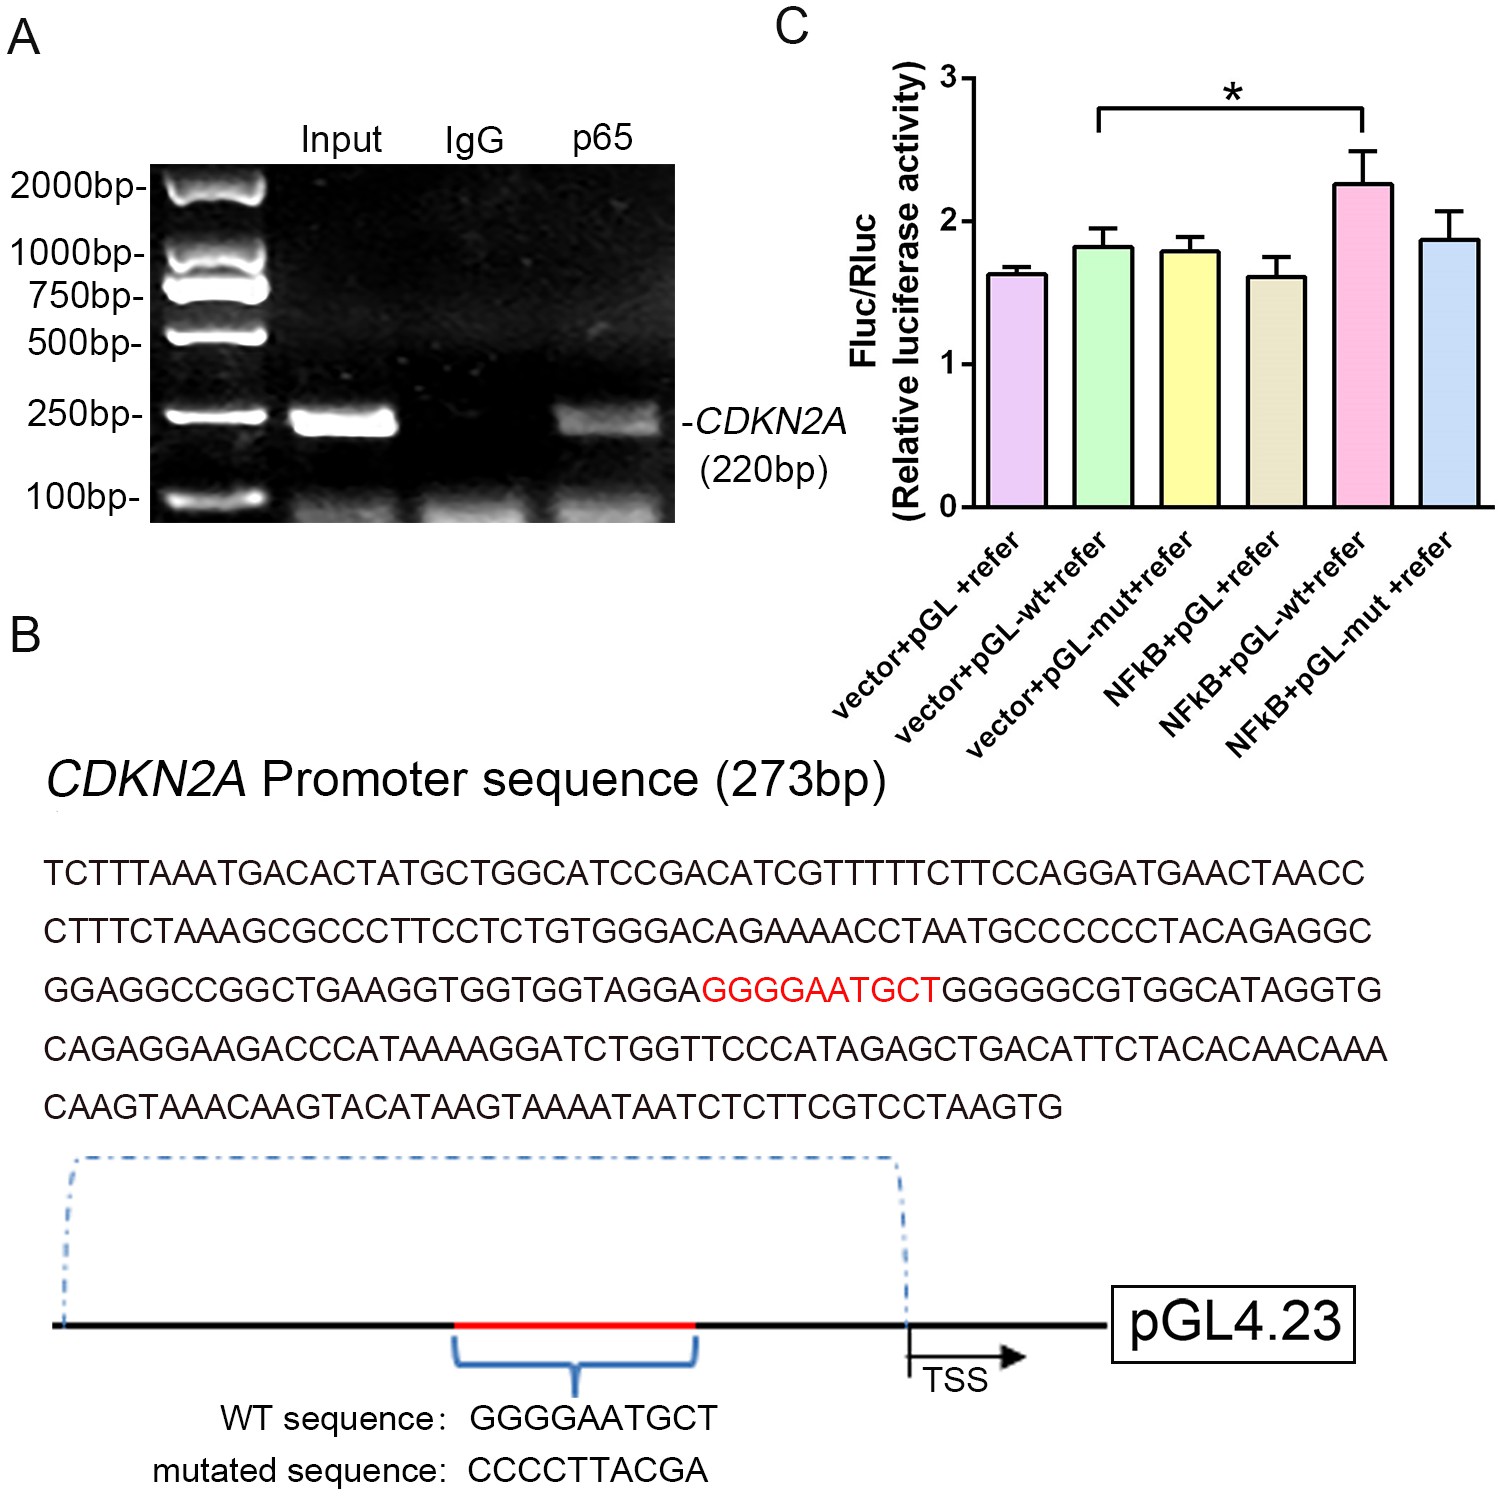
Another site in NF-κB-p65 that is predicted to bind the CDKN2A promoter.
(A) p16 promoter sequences were recovered by PCR from p65 immunoprecipitates but not preimmune IgG immunoprecipitates. (B) p65-like elements in the human CDKN2A promoter region and the mutated sequence are highlighted in red (upper panels). Below: structural schematic of the pGL4.23-p16 promoter reporter plasmid and the mutant pGL4.23-p16 promoter reporter plasmid. (C) Luciferase activity was driven by the CDKN2A promoter, and was more dramatic following NF-κB treatment, but not by the CDKN2A luciferase reporter without NF-κB treatment. No significant difference in luciferase activity was observed following NF-κB treatment when the CDKN2A luciferase reporter was mutated. Data are presented as the mean ± SD (n = 3); *p<0.05.
-
Figure 6—figure supplement 1—source data 1
Source data and related summary statistics for Figure 6—figure supplement 1C.
- https://cdn.elifesciences.org/articles/52570/elife-52570-fig6-figsupp1-data1-v2.xlsx
Figure 7
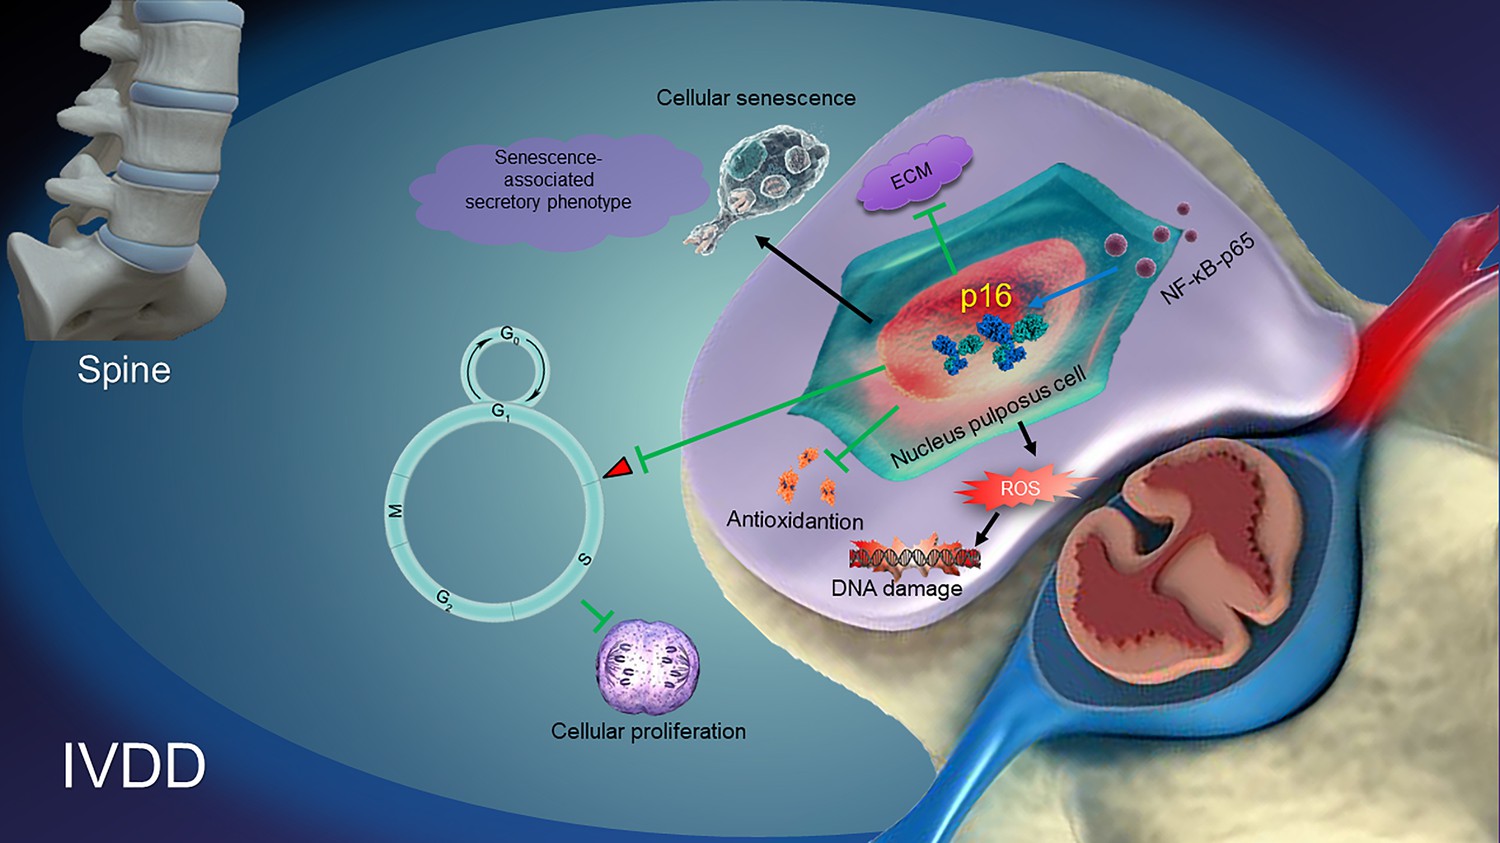
A proposed model for the mechanism of p16 in regulating intervertebral disc degeneration (IVDD).
NF-κB-p65 activates p16 expression. p16 deficiency alleviates the reactive oxygen species (ROS) levels, senescence-associated secretory phenotype (SASP) and cellular senescence. Subsequently, p16 deficiency promotes the activity of cellular antioxidation, and the proliferation and stability of ECM, like aggrecan and collagen II. All of the pathways ultimately protect against the development of IVDD.
Tables
Key resources table
| Reagent type (species) or resource | Designation | Source or reference | Identifiers | Additional information |
|---|---|---|---|---|
| Transfected construct (human) | p16 plasmid | Invitrogen | Addgene plasmid # 10916; RRID: Addgene_10916 | Vector backbone: pcDNA3 |
| Transfected construct (human) | Empty plasmid | Invitrogen | Addgene plasmid # 45346; RRID: Addgene_45346 | Vector backbone: pcDNA3 |
| Transfected construct (human) | p16 siRNA | GenePharma; Lau et al., 2007 | A09004 | |
| Transfected construct (human) | Null siRNA | GenePharma | A06001 | |
| Transfected construct (human) | pGL4.23-p16-wt plasmids | Promoterbio Lab | pGL4.23‐basic luciferase vector | |
| Transfected construct (human) | pGL4.23-p16-mut plasmids | Promoterbio Lab | pGL4.23‐basic luciferase vector | |
| Biological sample (human) | Nucleus pulposus cells | This paper | Freshly isolated from human nucleus pulposus | |
| Antibody | Anti-p16 ARC antibody (rabbit monoclonal) | Abcam | Cat# ab51243, RRID: AB_2059963 | IF (1:100); WB (1:1000) |
| Antibody | Anti-GLB1/beta-galactosidase antibody (rabbit polyclonal) | Abcam | Cat# ab203749 | IHC (1:200) |
| Antibody | Anti-8-hydroxy-2'-deoxyguanosine antibody (mouse monoclonal) | Abcam | Cat# ab48508, RRID: AB_867461 | IHC (1:200) |
| Antibody | Anti-Ki67 antibody (rabbit polyclonal) | Abcam | Cat# ab15580, RRID: AB_443209 | IHC (1:200) |
| Antibody | Anti-PCNA antibody (rabbit monoclonal) | Abcam | Cat# ab92552, RRID: AB_10561973 | IHC (1:500) |
| Antibody | Anti-collagen I antibody (rabbit polyclonal) | Abcam | Cat# ab34710, RRID: AB_731684 | WB (1:1000) |
| Antibody | Anti-collagen X (rabbit polyclonal) | Abcam | Cat# ab58632, RRID: AB_879742 | WB (1:300) |
| Antibody | Anti-collagen II antibody (rabbit polyclonal) | Abcam | Cat# ab34712, RRID: AB_731688) | WB (1:1000) |
| Antibody | Anti-SIRT1 antibody (mouse monoclonal) | Abcam | Cat# ab110304, RRID: AB_10864359 | WB (1:500) |
| Antibody | Anti-superoxide dismutase one antibody (rabbit polyclonal) | Abcam | Cat# ab13498, RRID: AB_300402 | WB (1:500) |
| Antibody | Anti-SOD2/MnSOD antibody (rabbit polyclonal) | Abcam | Cat# ab13533, RRID: AB_300434 | WB (1:1000) |
| Antibody | Anti-MMP3 antibody (rabbit monoclonal) | Abcam | Cat# ab52915, RRID: AB_881243 | WB (1:1000) |
| Antibody | Anti-MMP13 antibody (rabbit polyclonal) | Abcam | Cat# ab39012, RRID: AB_776416 | WB (1:3000) |
| Antibody | Anti-beta actin antibody (mouse monoclonal) | Abcam | Cat# ab8226, RRID: AB_306371 | WB (1:1000) |
| Antibody | Anti-IGF1 antibody (rabbit polyclonal) | Abcam | Cat# ab9572, RRID: AB_308724 | WB (1:500) |
| Antibody | Anti-VEGF 165A antibody (mouse monoclonal) | Abcam | Cat# ab69479, RRID: AB_1271452 | WB (1:1000) |
| Antibody | Anti-Cdk6 (rabbit polyclonal) | Abcam | Cat# ab131469, RRID: AB_11156738 | WB (1:1000) |
| Antibody | Anti-Cdk4 (rabbit monoclonal) | Abcam | ab199728 | WB (1:2000) |
| Antibody | Anti-p53 antibodies (mouse monoclonal) | Santa Cruz Biotechnology | Cat# sc-126, RRID: AB_628082 | WB (1:1000) |
| Antibody | Anti-p19 antibody (mouse monoclonal) | Santa Cruz Biotechnology | Cat# sc-1665, RRID: AB_628069 | WB (1:1000) |
| Antibody | Anti-Rb antibody (mouse Monoclonal) | Santa Cruz Biotechnology | Cat# sc-74562, RRID: AB_2177334) | WB (1:1000) |
| Antibody | Anti-p-Rb antibody (rat monoclonal) | Santa Cruz Biotechnology | Cat# sc-56175, RRID: AB_785453 | WB (1:1000) |
| Antibody | Anti-E2F-1 antibody (mouse monoclonal) | Santa Cruz Biotechnology | Cat# sc-137059, RRID: AB_2096771 | WB (1:1000) |
| Antibody | Anti-E2F-2 antibody (rabbit polyclonal) | Santa Cruz Biotechnology | Cat# sc-633, RRID: AB_2096793 | WB (1:1000) |
| Antibody | Anti-NFκB p65 antibody (mouse monoclonal) | Santa Cruz Biotechnology | Cat# sc-71675, RRID: AB_1126640 | WB (1:1000) |
| Peptide, recombinant protein | IL-1β human | Sigma Aldrich | SRP6169 | 10 ng/mL |
| Commercial assay or kit | Diacetyl dichlorofluorescein staining | Sigma Aldrich | 35848 | |
| Commercial assay or kit | EdU Flow Cytometry Assay Kits | Invitrogen | C10425 | |
| Commercial assay or kit | CCK-8 assay | KeyGen | KGA317s-3000 | |
| Commercial assay or kit | Propidium iodide staining | KeyGen | KGA512 | |
| Commercial assay or kit | IL-1β, IL-6 and TNF-α ELISA kit | KeyGen | KGEMC001b-1; KGEMC004-1; KGEMC102a-1. | |
| Commercial assay or kit | Vectastain Elite ABC reagent | Fisher Scientific | NC9461324 | |
| Commercial assay or kit | Protein Extraction Kit | Thermo Fisher | AM1556 | |
| Commercial assay or kit | Lipofectamine2000 | Thermo Fisher | 11668019 | |
| Commercial assay or kit | ECL | Beyotime | P0018FS | |
| Commercial assay or kit | TRIzol reagent | Beyotime | R0016 | |
| Commercial assay or kit | PrimeScript RT Master Mix | TaKaRa | Cat. #RR036Q | |
| Commercial assay or kit | ChIP kit | Cell Signaling Technology | #9005 | |
| Chemical compound, drug | Rapamycin | Sigma Aldrich | R8781 | 50 nM |
| Software, algorithm | SPSS | SPSS | RRID: SCR_002865 | |
| Software, algorithm | GraphPad | GraphPad Prism | RRID: SCR_002798 |
Additional files
-
Supplementary file 1
Primer sequences for CHIP.
- https://cdn.elifesciences.org/articles/52570/elife-52570-supp1-v2.docx
-
Supplementary file 2
Patients’ information.
- https://cdn.elifesciences.org/articles/52570/elife-52570-supp2-v2.docx
-
Supplementary file 3
Primer sequences for RT-PCR.
- https://cdn.elifesciences.org/articles/52570/elife-52570-supp3-v2.docx
-
Transparent reporting form
- https://cdn.elifesciences.org/articles/52570/elife-52570-transrepform-v2.docx
Download links
A two-part list of links to download the article, or parts of the article, in various formats.
Downloads (link to download the article as PDF)
Open citations (links to open the citations from this article in various online reference manager services)
Cite this article (links to download the citations from this article in formats compatible with various reference manager tools)
p16 deficiency attenuates intervertebral disc degeneration by adjusting oxidative stress and nucleus pulposus cell cycle
eLife 9:e52570.
https://doi.org/10.7554/eLife.52570


