Multifaceted secretion of htNSC-derived hypothalamic islets induces survival and antidiabetic effect via peripheral implantation in mice
- Department of Molecular Pharmacology, Diabetes Research Center, Institute for Aging Research, Albert Einstein College of Medicine, United States
Figures
Figure 1 with 5 supplements
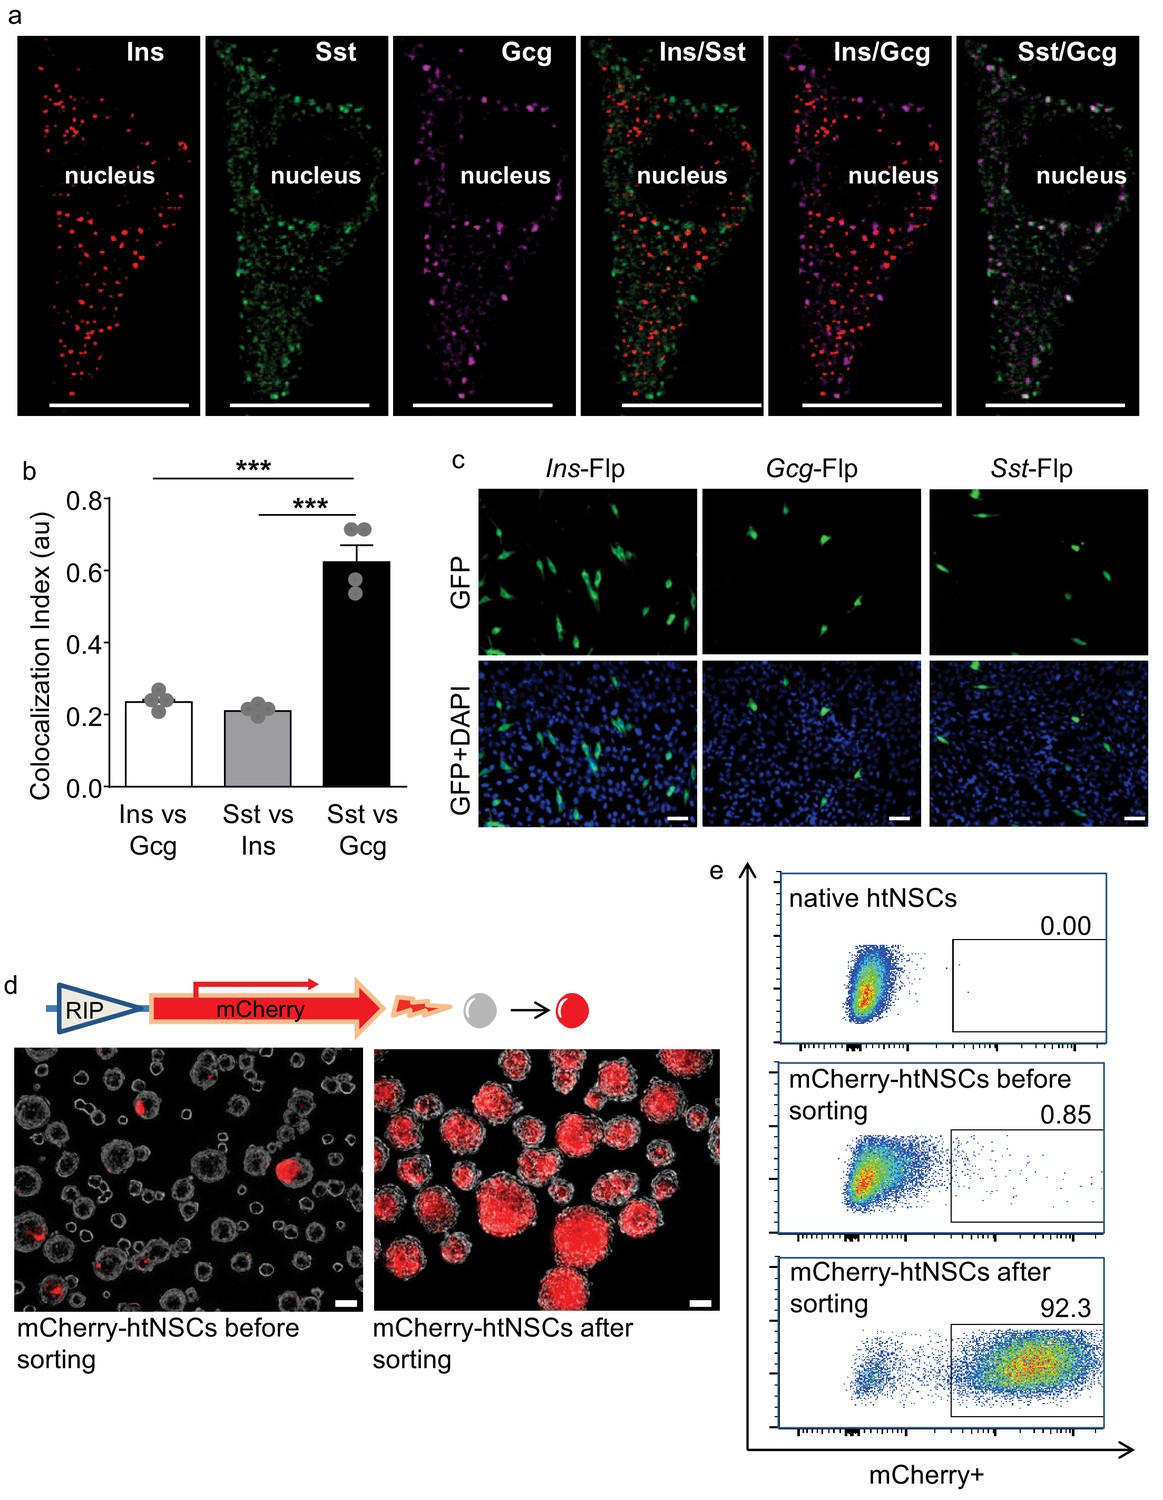
Some htNSCs expressing pancreatic hormones and cell selection via insulin promoter.
(a–b) Representative immunostaining of single-cell confocal images. Cultured htNSCs were co-immunostained for somatostatin (Sst), insulin (Ins) and glucagon (Gcg); images were merged to show co-localization of these peptides in the same single cell (a) while co-localization index (au: arbitrary unit) of any two peptide types were calculated (b). (c) Cultured htNSCs were transfected with Flp-dependent GFP expressing plasmid together with Flp plasmid driven by insulin promoter (Ins-Flp), glucagon prompter (Gcg-Flp) and somatostatin promoter (Sst-Flp). (d) A line of htNSCs was virally infected to stably express RIP-driven mCherry and transiently infected by adenoviral cocktail of expressing Ngn3, Pdx-1 and MafA (d left panel) leading to the establishment of mCherry-positive subpopulation (d right panel). (e) FACS for the established subpopulation of mCherry-positive cells compared to native htNSCs and these cells after cocktail induction prior to sorting. Scale Bar: 10 μm (a) or 50 µm (c, d). ***p<0.001 (ANOVA and post-hoc test), n = 4 independent biological samples per group (b); data are mean ± s.e.m.
Figure 1—figure supplement 1
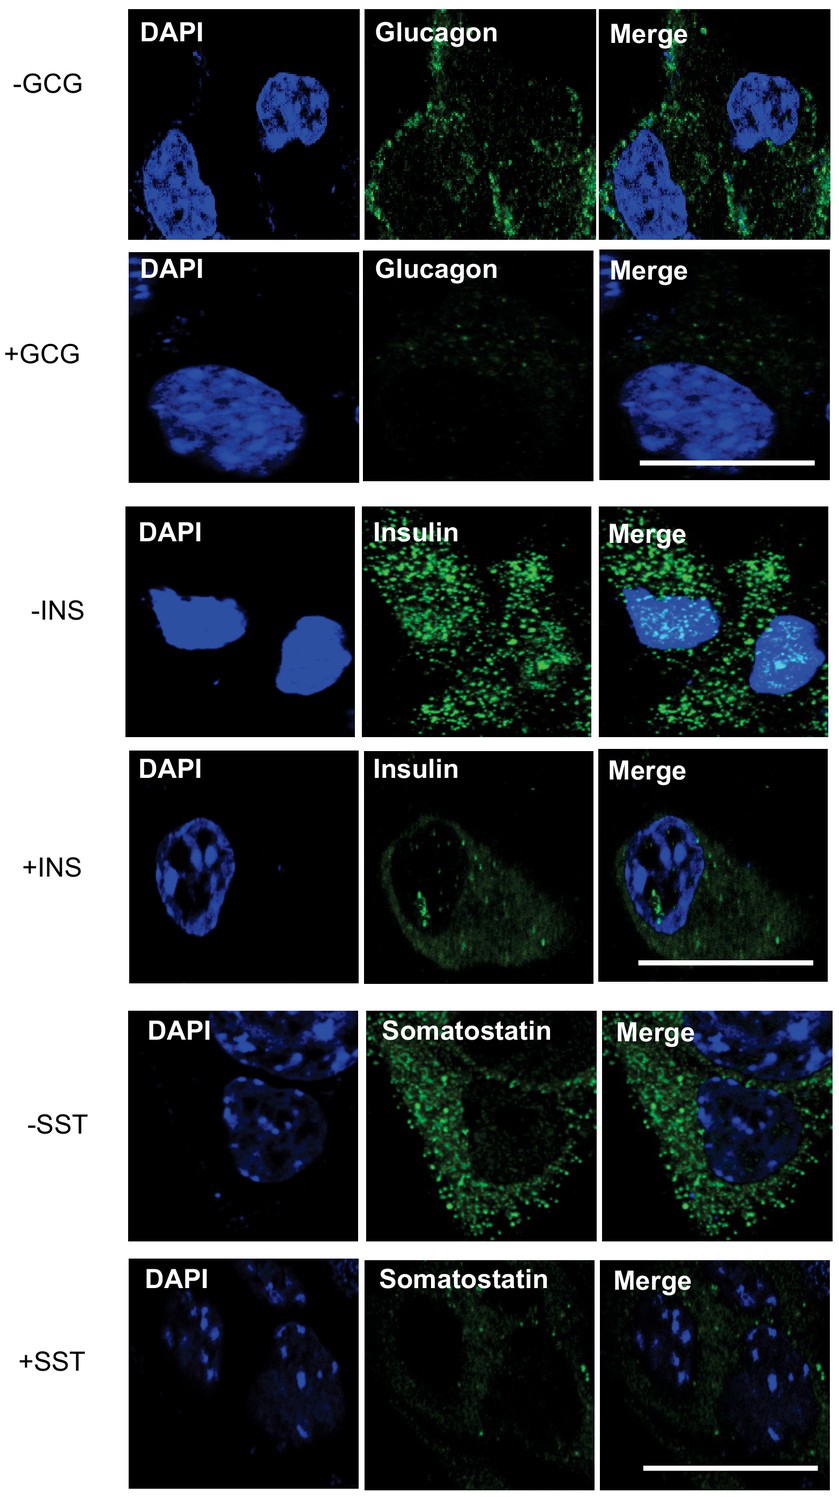
Insulin, glucagon and somatostatin staining of htNSCs.
Representative immunostaining of single-cell confocal images. Cultured htNSCs were immunostained for insulin, glucagon and Somatostatin antibodies with (+) or without (-) prior antibody blocking treatment with excess purified insulin (Ins), glucagon (Gcg) and somatostatin (Sst), respectively. Scale bar, 10 μm.
Figure 1—figure supplement 2

Vesicle markers for pancreatic peptidyl hormones in htNSCs.
Representative immunostaining of single-cell confocal images. (a) Cultured htNSCs were co-immunostained for LDCV marker secretogranin 2 (Sg2) or SLMV marker synaptophysin (Syn) to display different puncta pattern and intracellular localization. (b) Cultured htNSCs were immunostained for insulin (Ins), glucagon (Gcg) or somatostain (Sst) and co-stained for Sg two or Syn. High-magnification (High-mag) images show vesicle co-localization in the regions outlined by rectangles (a, b). Scale bar: 10 μm (low magnification) and 1 μm (high magnification). (c) Co- localization index of pancreatic islet peptides with LDCV vs. SLMV marker. **p<0.01 (ANOVA and post-hoc), n = 8–10 independent samples per group.
Figure 1—figure supplement 3

Cre/Flp dual fluorescence reporter system.
(a) Dual reporter system containing Flp recombinase-dependent EGFP and Cre recombinase- dependent mCherry expression. (b) HEK293T cells were co-transfected with this dual fluorescence reporter plasmid and CMV promoter-driven Flp- or Cre-expressing plasmid, and were examined for EGFP and mCherry fluorescence.
Bar = 50 μm.
Figure 1—figure supplement 4
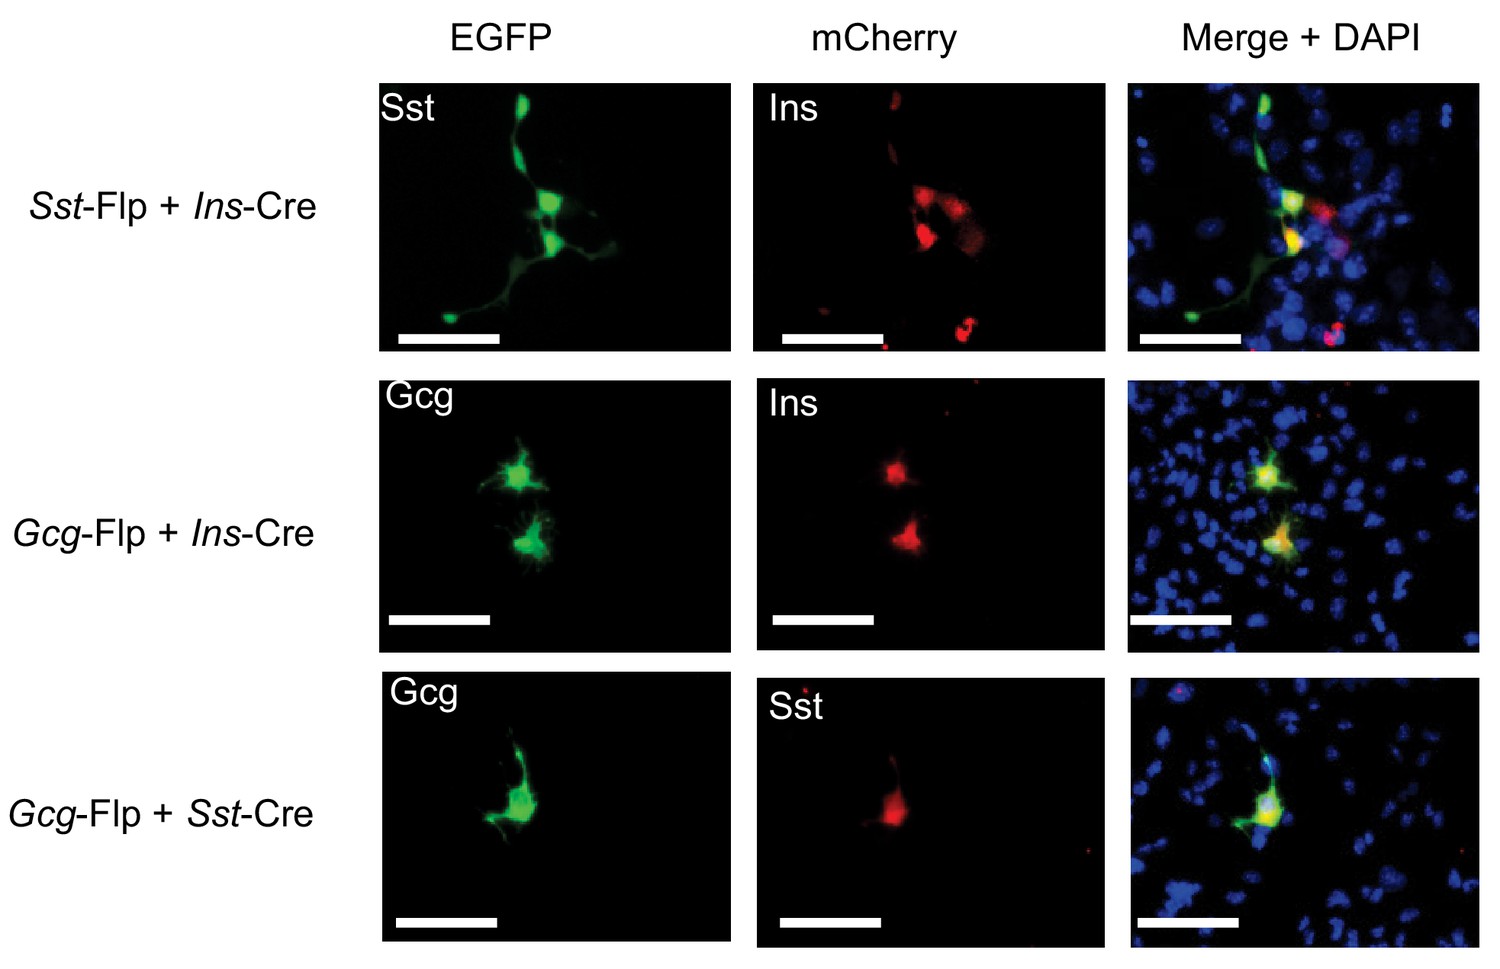
Co-expression of pancreatic peptidyl hormones in htNSCs.
Cultured htNSCs were co-transfected with Flp/Cre dual fluorescence reporter plasmid together with the indicated combination of Flp- and Cre-expressing plasmids under the control of Sst, Ins or Gcg gene promoter. Scale bar: 50 μm.
Figure 1—figure supplement 5

Vesicle localization of gastrointestinal and hypothalamic peptides in htNSCs.
Representative immunostaining of single-cell confocal images. Cultured htNSCs were immunostained with indicated peptide antibodies. Note that GnRH was present in the nucleus in addition to the cytoplasm (as we appreciated in our prior study). DAPI staining indicates the nucleus of the cell. Scale bar, 10 μm.
Figure 2
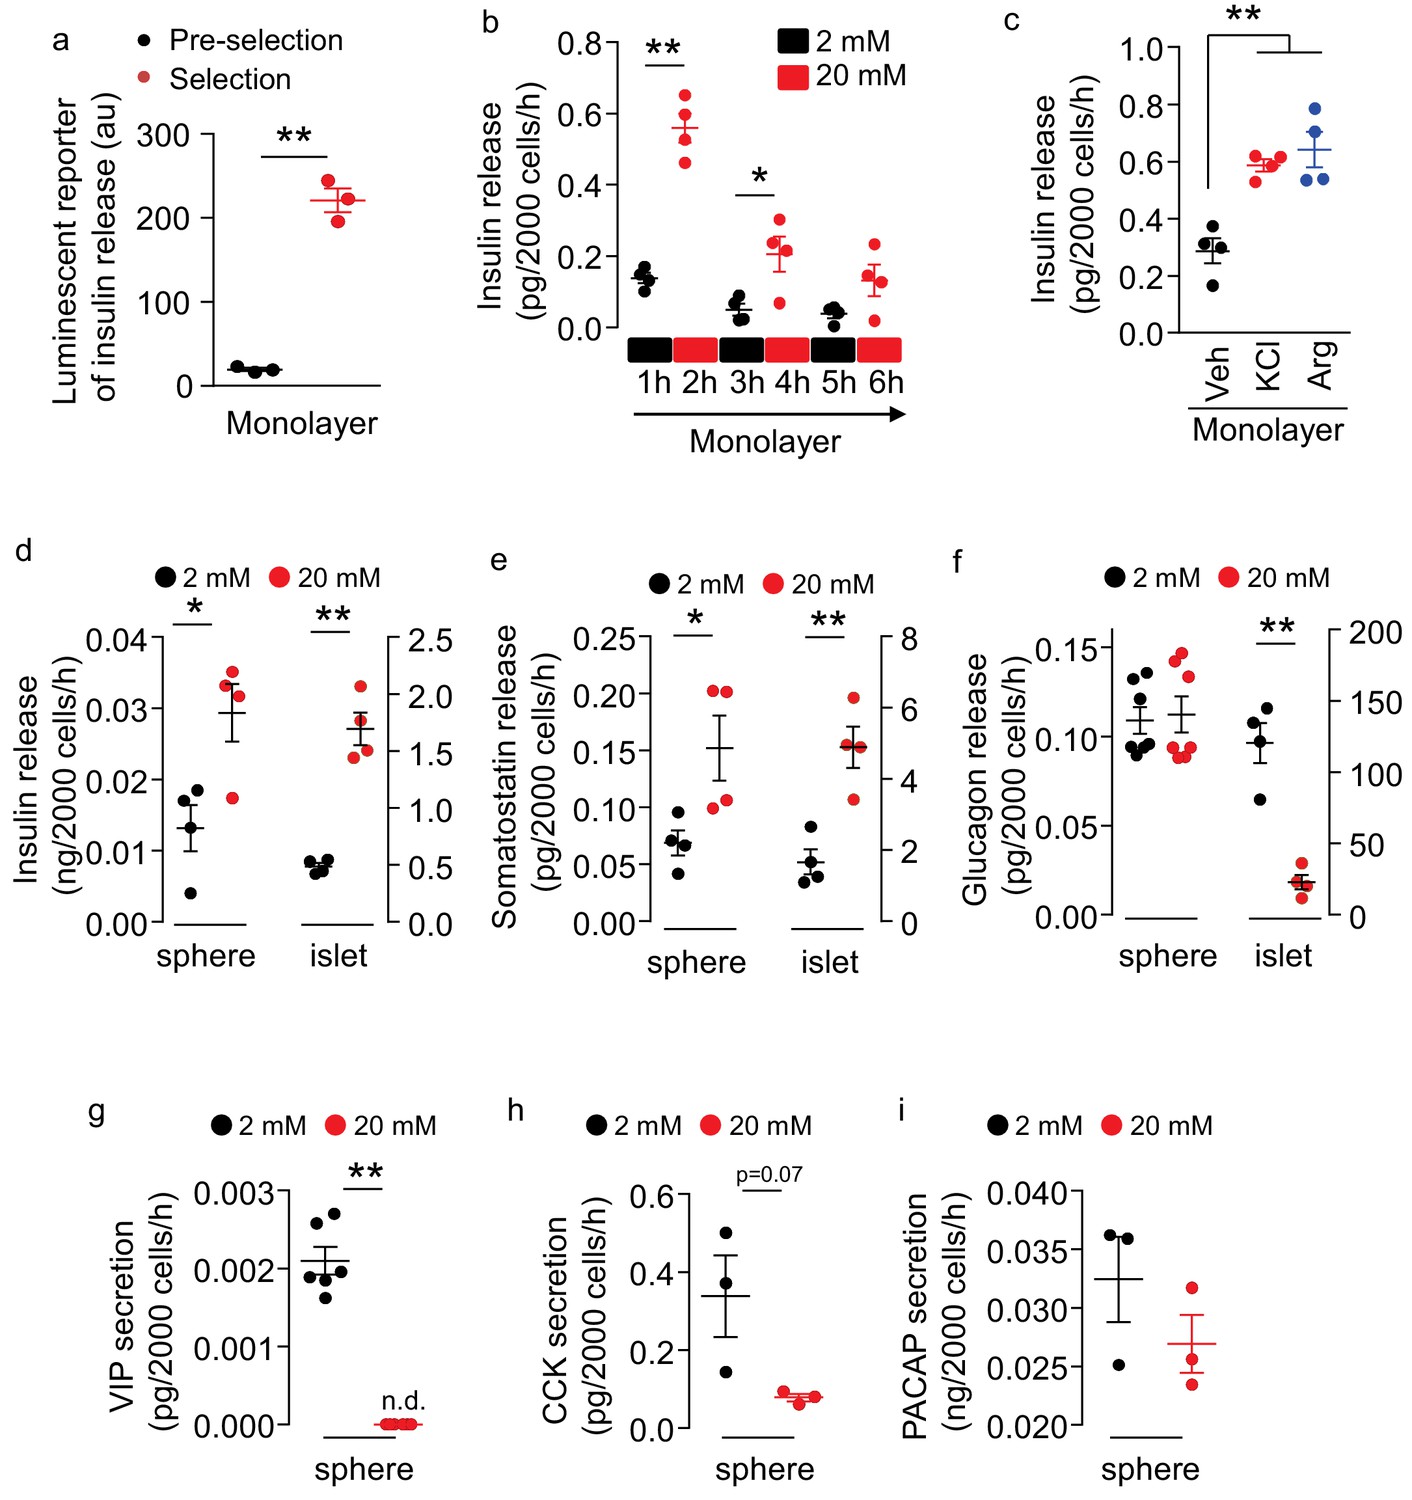
Secretion of multiple peptides by insulin promoter-selected htNSC spheres.
(a) Insulin secretion from insulin promoter-selected htNSCs in monolayer assessed by means of luminescent reporter (au: arbitrary unit). (b–c) ELISA measurement of insulin secretion from monolayer culture of insulin promoter-selected htNSCs in serum-free medium under low- vs. high-concentration glucose (b) or under stimulation by KCl or Arginine (Arg) vs. vehicle (Veh) (c). (d–f) Secretion of insulin (d), somatostatin (e), glucagon (f) by mCherry-posiitve htNSC spheres (labeled as spheres) compared to mouse pancreatic islets (labeled as islet). (g–i) Secretion of VIP (g), CCK (h), and PACAP (i) by mCherry-posiitve htNSC spheres under low- vs. high-concentration glucose stimulation. *p<0.05, **p<0.01 (Student's t-test for a, g–i, and ANOVA/post-hoc for b–f), n = 3–7 independent biological samples per group (a–i); data are mean ± s.e.m.
Figure 3 with 2 supplements
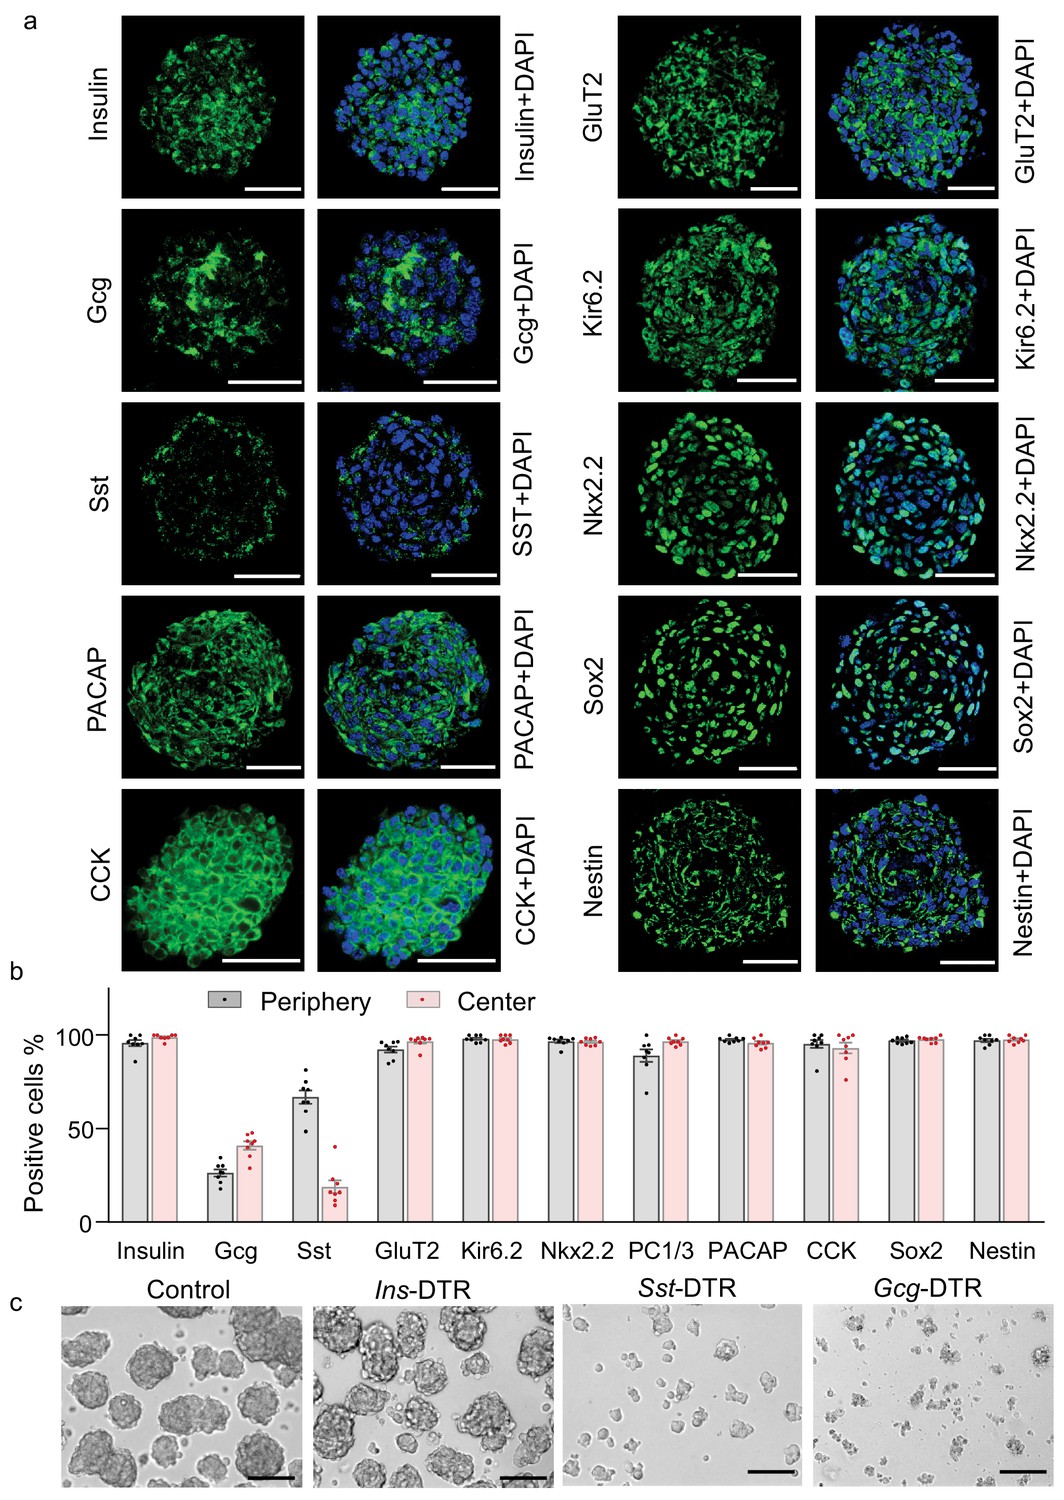
Multifaceted endocrine features of insulin promoter-selected htNSC spheres.
(a–b) Cultured insulin promoter-selected htNSC spheres were immunostained for molecular markers of pancreatic islets and hypothalamic stem cells (a), and percentage of positive cells located within the center versus the periphery of spheres were calculated (b). All data in (a–b) were based on large-sized htNSC spheres (please see Figure 3—figure supplement 1 for small-sized htNSC spheres). Sst: somatostatin; Gcg: glucagon. Scale bar, 50 µm. (c) Insulin-, Sst- and Gcg-positive cells in insulin promoter-selected htNSC spheres were respectively ablated through lentiviral induction of diphtheria toxin receptor (DTR) driven by insulin (Ins-), somatostatin (Sst-) or glucagon (Gcg-) promoter and followed by 24 hr diphtheria toxin treatment, and the same number of surviving cells in each group were collected for forming spheres over 72 hr. Scale bar: 100 µm. Data in (b): n = 8 independent biological samples per group; data are mean ± s.e.m.
Figure 3—figure supplement 1
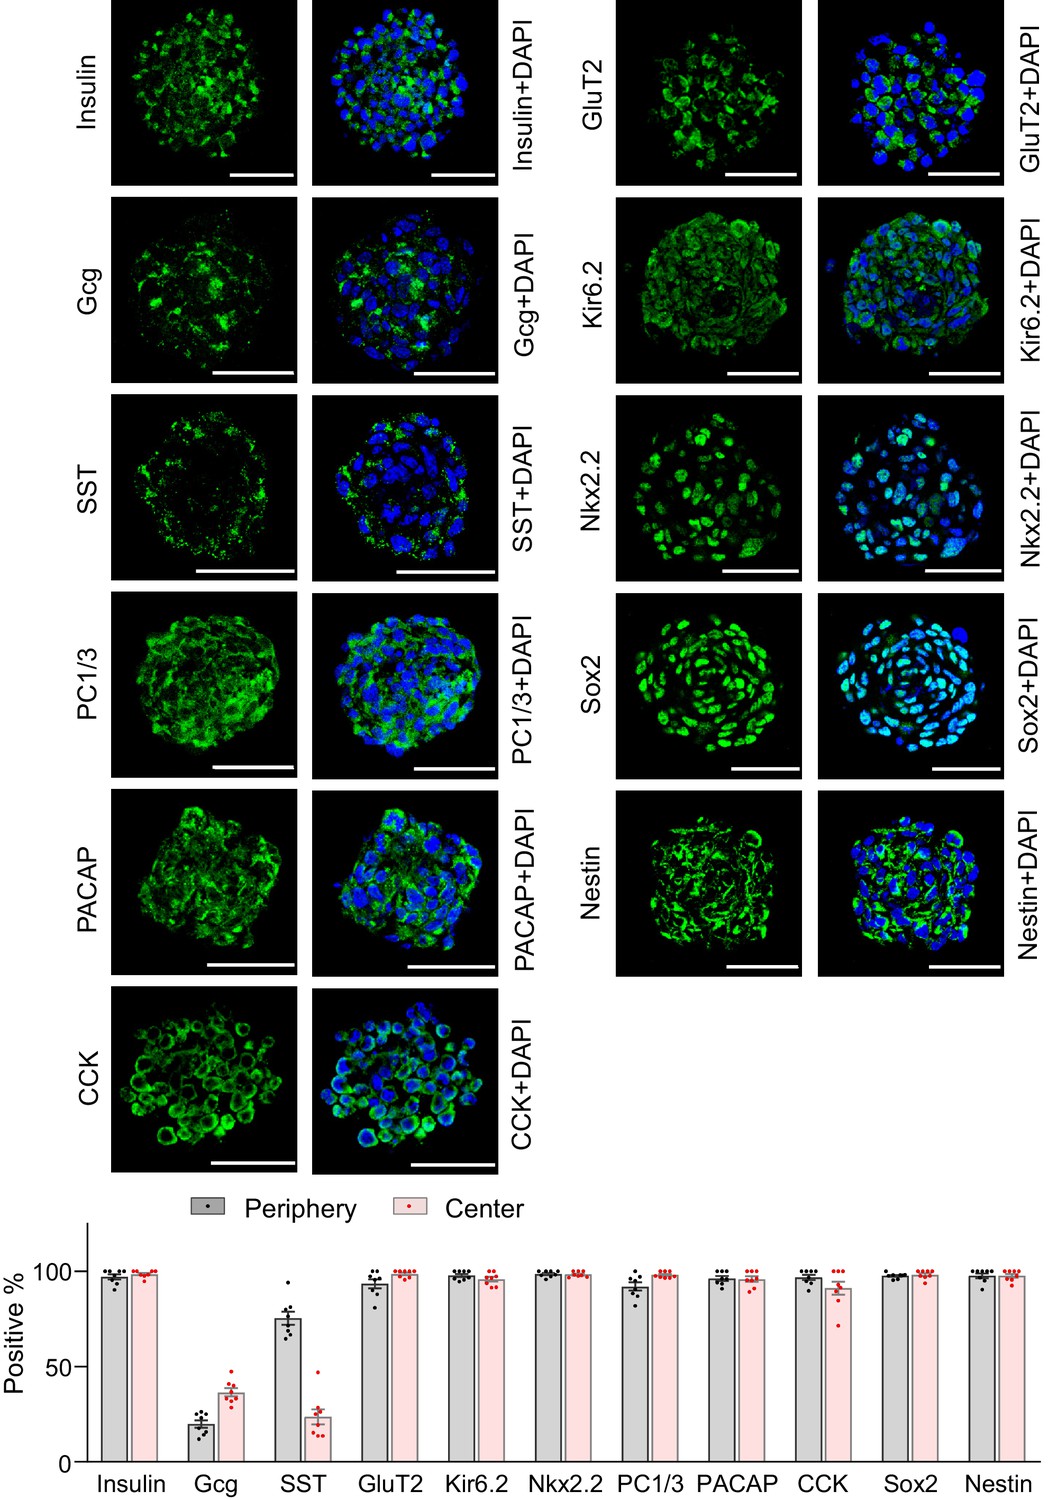
Multifaceted features of small-sized htNSCPGHM spheres.
Small-sized htNSCPGHMspheres were isolated as described in Materials and method and immunostained for molecular markers of pancreatic islets and hypothalamic stem cells (a), and cells expressing different markers in the center versus the periphery of spheres were counted and calculated according to the percentage over total spherical cells (b). Scale bar, 50 µm. Data in (b): n = 8 independent samples per group, and data are mean ± s.e.m.
Figure 3—figure supplement 2
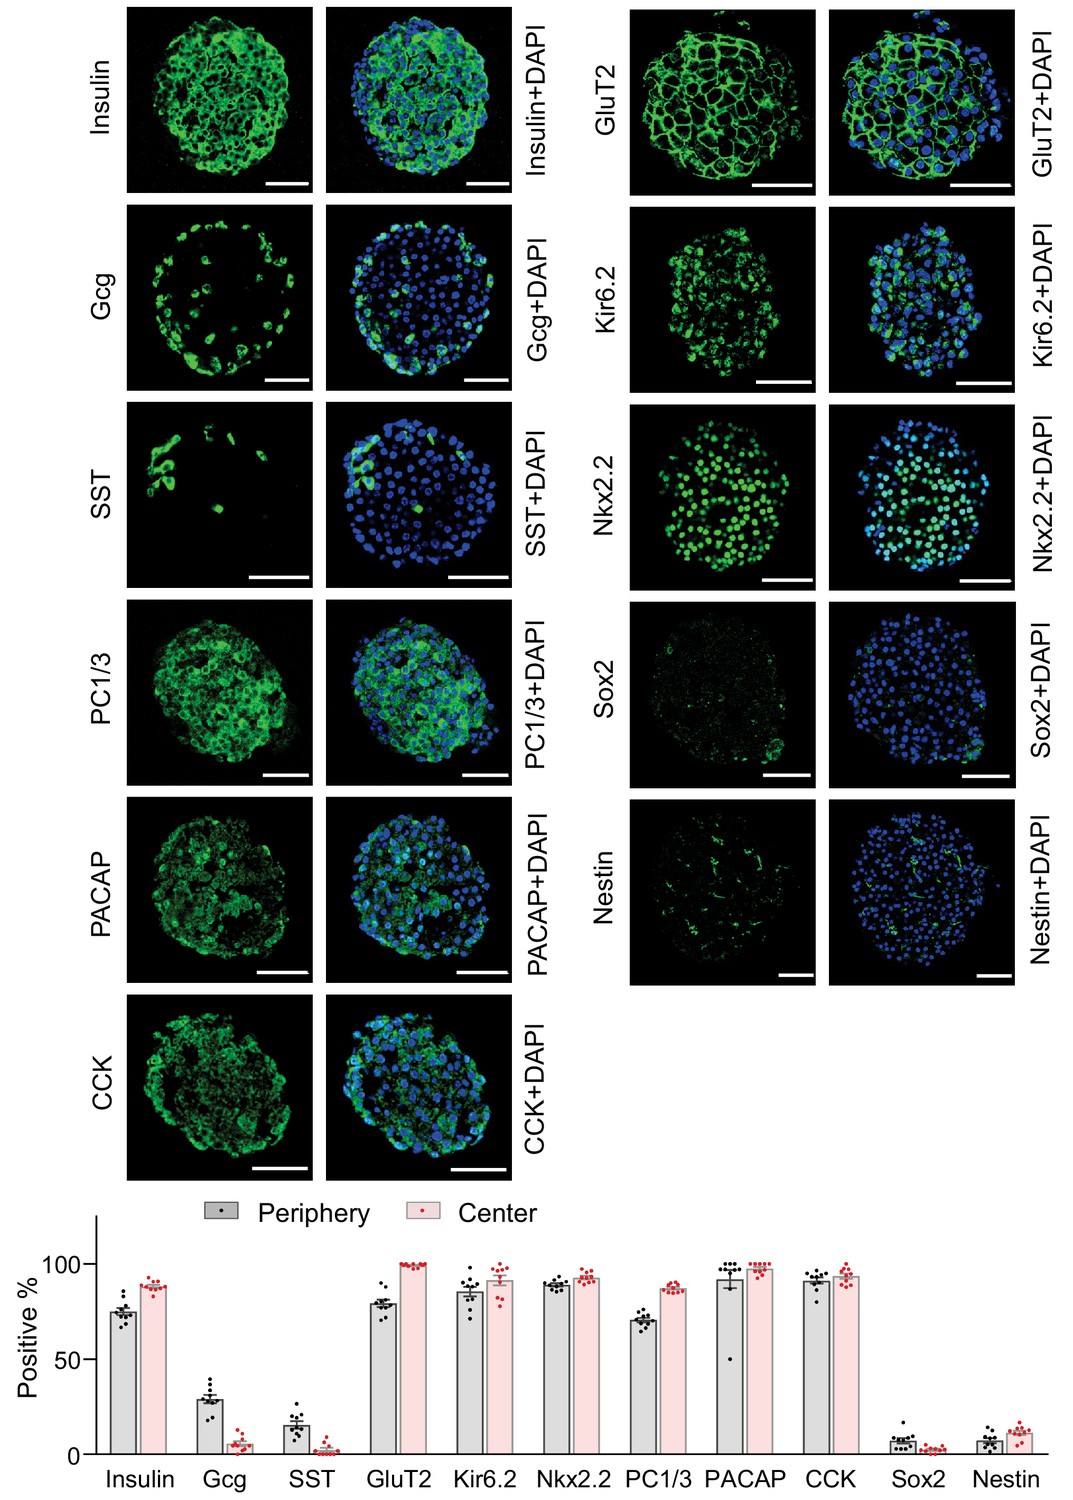
Immunostaining of pancreatic islets.
Pancreatic islets separated from C57BL/6 mice (3-month-old males) were immunostained for peptides and NSC markers as indicated in (a), and cells expressing each marker in the center and the periphery of islets were counted for the calculation of the percentage over total cells in the islets (b). Scale bar, 50 µm. Data in (b) were based on n = 10 independent samples per group, and data are mean ± s.e.m.
Figure 4
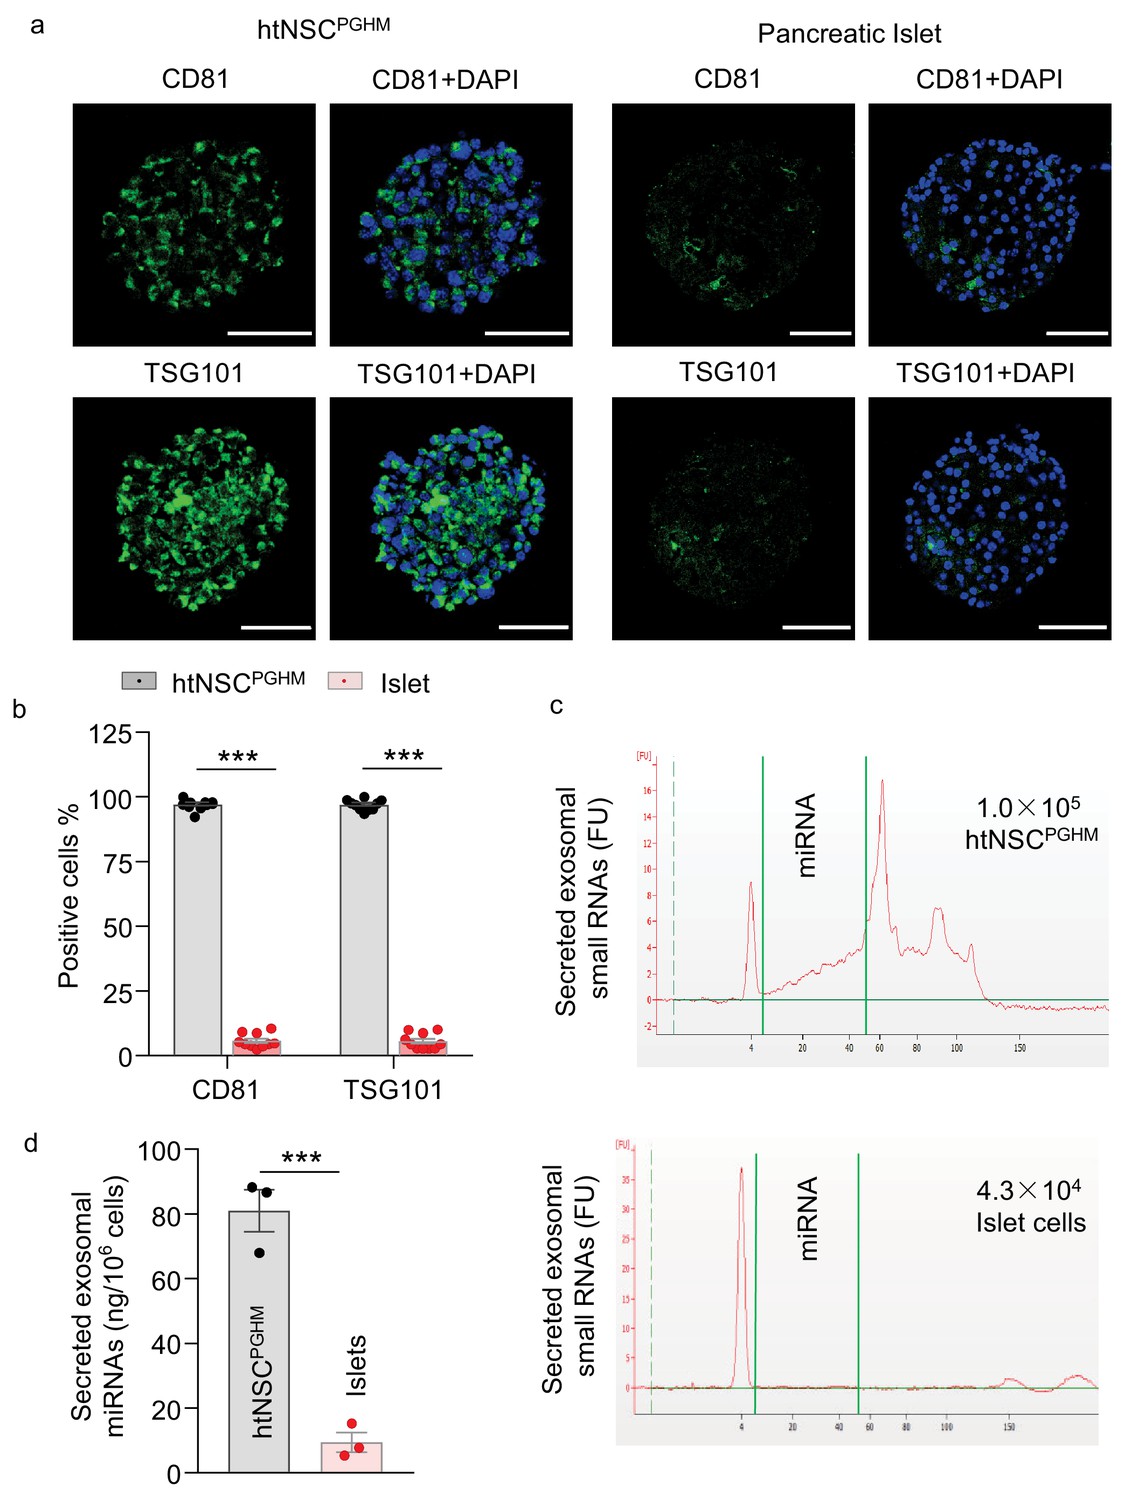
Exosomes in insulin promoter-selected htNSC spheres vs. pancreatic islets.
(a–b) Cultured insulin promoter-selected htNSC spheres vs. pancreatic islets obtained from mice (3-month-old C57BL/6J males) were immunostained for molecular markers of exosomal biomarkers (a), and percentage of cells positive for each biomarker over the entire spherical or islet cells were calculated (b). Scale bar, 50 µm. (c–d) Exosomal small RNA and miRNA secreted by insulin promoter-selected htNSC spheres vs. pancreatic islets. (c): Representative tracing; (d) Quantification of exosomal miRNAs secreted by insulin promoter-selected htNSC spheres vs. islets according to the same number of cells. ***p<0.001 ( ANOVA/post-hoc for b, and student's t-test for d), n = 10 (b) and n = 3 (d) independent biological samples per group, data are mean ± s.e.m.
Figure 5
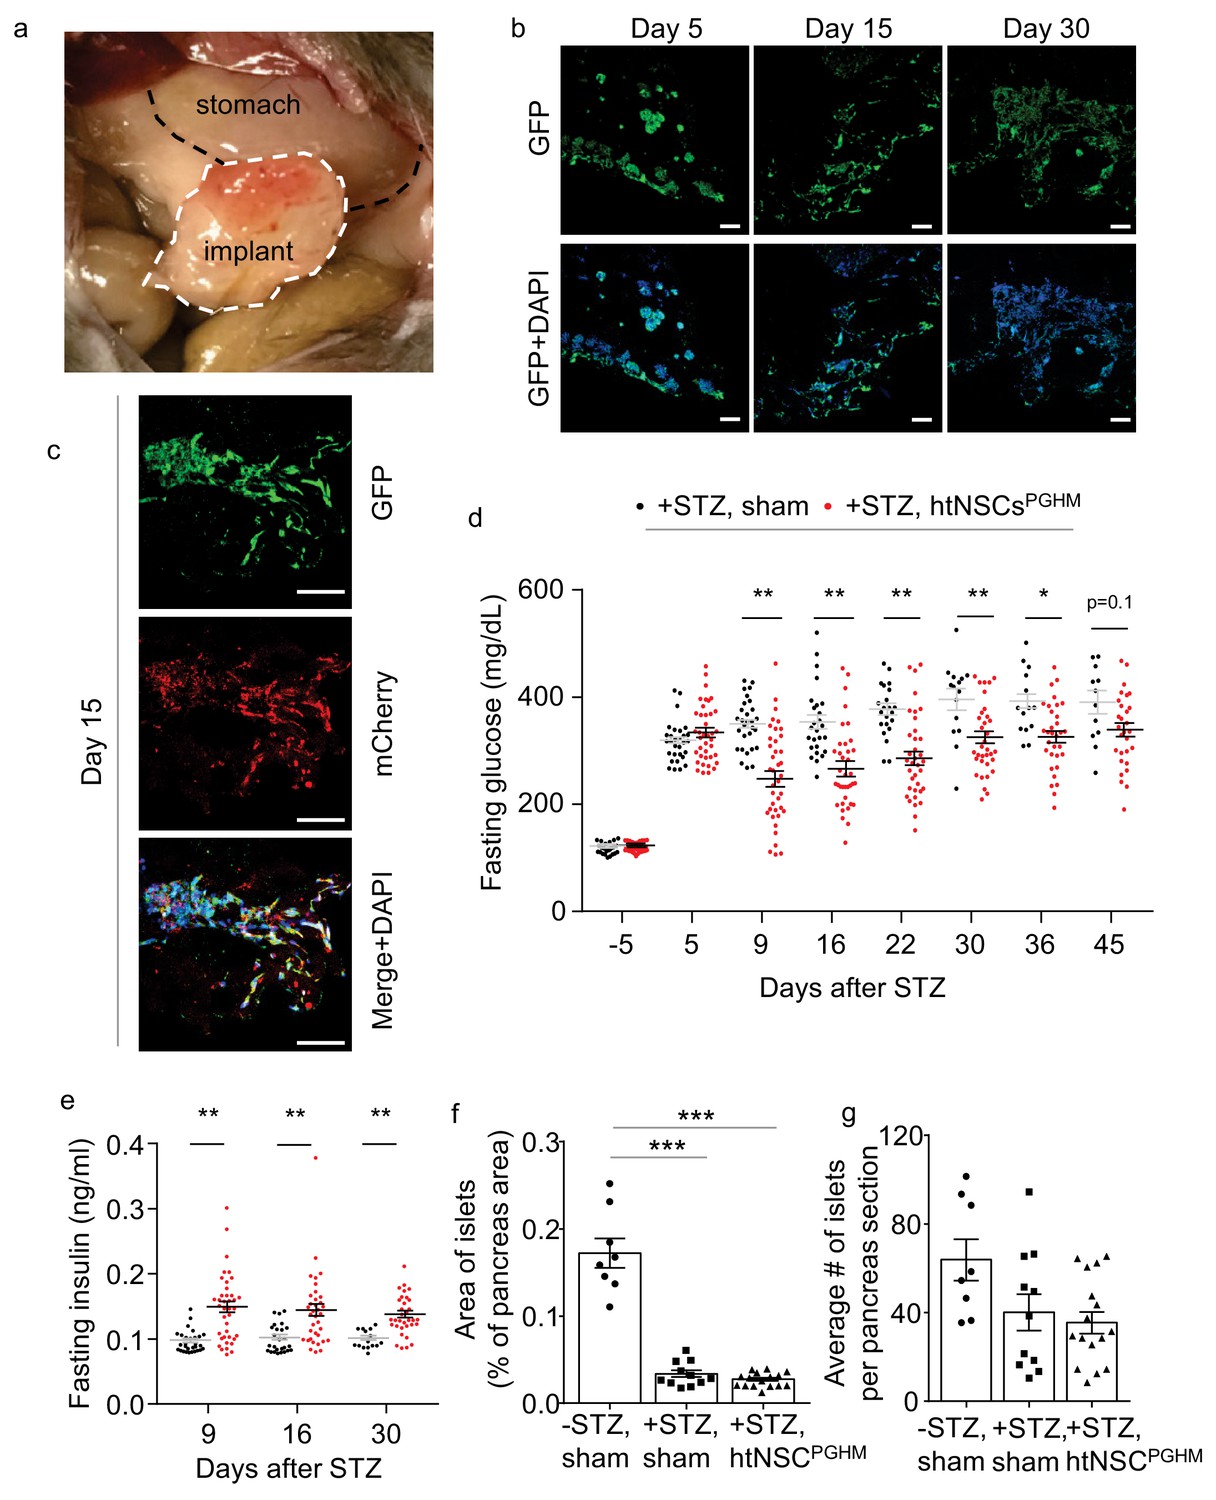
Moderate antidiabetic effect of htNSCsPGHM spheres in STZ model.
(a–c) Implants of htNSCPGHM in the great omentum of STZ mice were extracted and sectioned for examining cell survival. (a): representative implantation; (b–c): representative low-magnification sectional images of GFP expression at the indicated days post implantation (b) and representative high-magnification sectional images of GFP (controlled by CMV promoter) and mCherry (controlled by insulin promoter) co-expression (c). Scale bar, 100 µm. (d–e) Standard C57BL/6J mice (3-month-old males) were injected by STZ to develop severe diabetes (+STZ) and then received htNSCPGHM implantation (+STZ, htNSCPGHM) vs. sham implantation (+STZ, sham) at days 5–8, and survived mice were monitored for fasting blood glucose (d) and insulin (e) at the indicated time points. Survival mice in sham vs. htNSCPGHM group were n = 30, 30, 29, 26, 22, 15, 14 and 12 vs. n = 39, 39, 39, 37, 36, 34, 32 and 29 at day −5, 5, 9, 16, 22, 30, 36 and 45, respectively. (f–g) Separate groups of sham-implanted STZ mice (+STZ, sham; n = 11 mice) vs. htNSCPGHM-implanted STZ mice (+STZ, htNSCPGHM; n = 16 mice) with the same procedure and conditions as described in d-e were compared to sham-implanted normal control mice (-STZ, sham, n = 8 mice) for the histology of the pancreas (day 40 post implantation). *p<0.05, **p<0.01, ***p<0.001, (ANOVA/post-hoc); data are mean ± s.e.m.
Figure 6
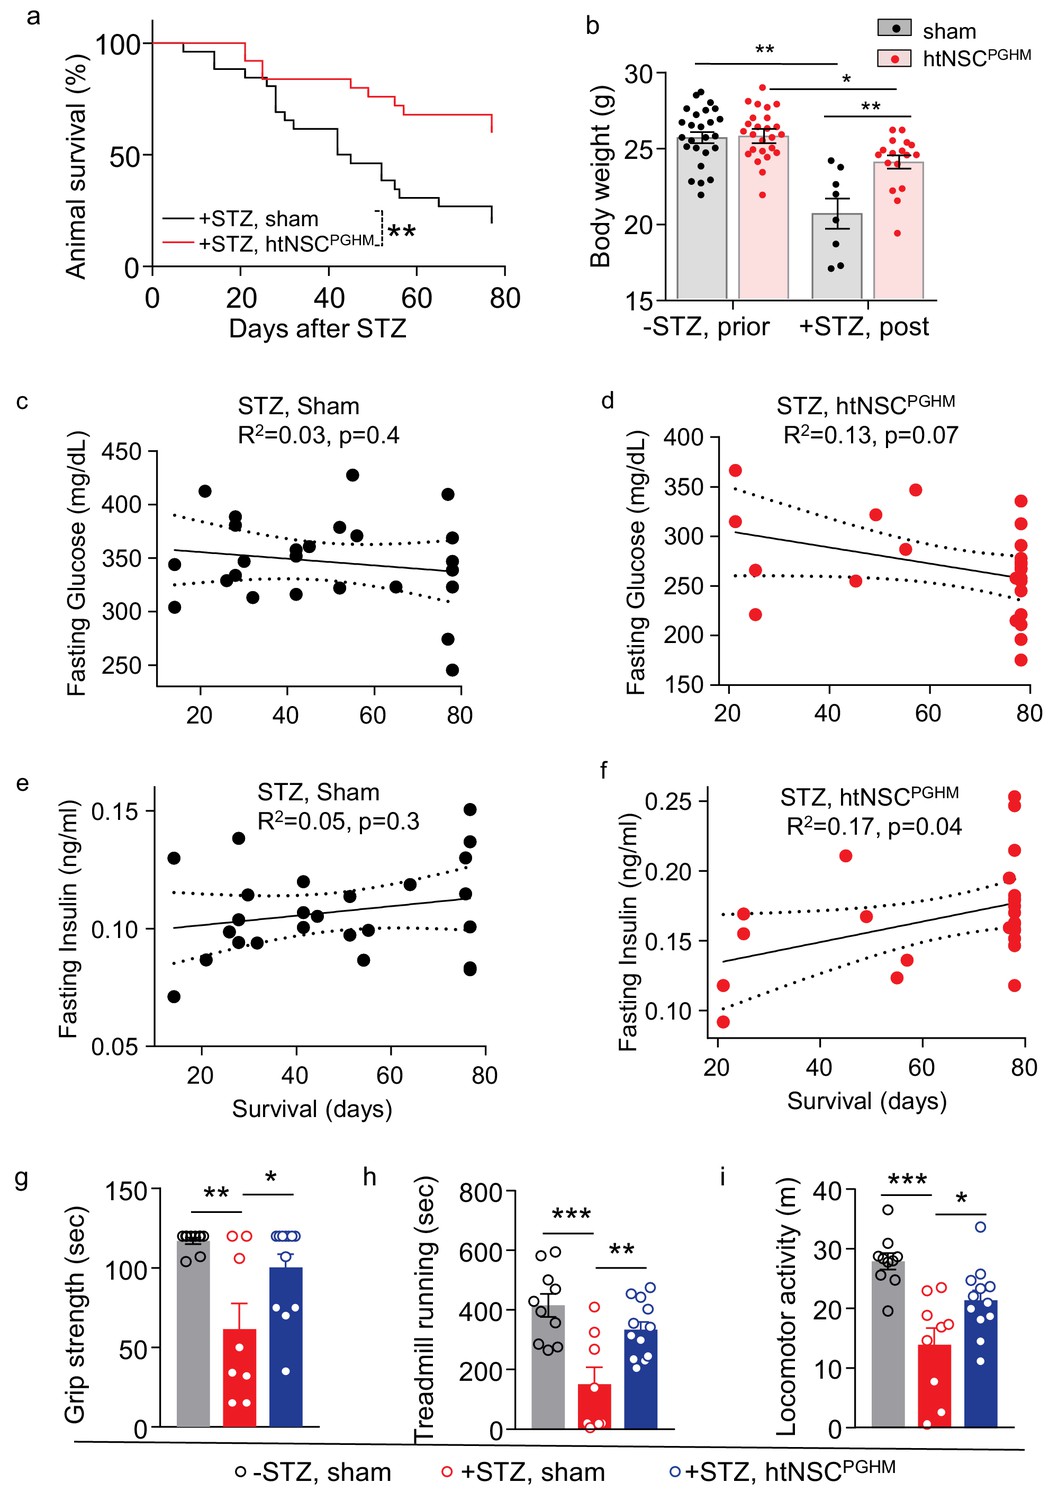
Pro-survival effect of htNSCsPGHM spheres in STZ model.
(a–f) STZ mice received htNSCPGHM implantation (+STZ, htNSCPGHM, n = 25 mice at day 0) vs. sham implantation (+STZ, sham, n = 26 mice at day 0) in the great omentum. (a): survival curve of mice over 80 day follow-up; (b): body weight of mice before (-STZ) and after (+STZ) induction of STZ diabetes prior to vs. 8 weeks post htNSCPGHM vs. sham implantation (n = 25 vs. 26 mice for ‘-STZ, prior’, and n = 17 vs. 8 mice for ‘+STZ, post’); (c–f) The correlation analysis between days of survival and blood glucose and insulin levels averaged within two weeks after implantation. (g–i) Separate groups of sham-implanted STZ mice (+STZ, sham; n = 8–9 mice) vs. htNSCPGHM-implanted STZ mice (+STZ, htNSCPGHM; n = 12 mice) were compared to sham-implanted normal control mice (-STZ, sham, n = 10 mice) for non-invasive behavioral performance at 3–4 weeks post implantation. *p<0.05, **p<0.01, ***p<0.001, Mantel-Cox survival test (a), linear regression (c–f), and ANOVA/post-hoc (b, g–i); data are mean ± s.e.m.
Figure 7
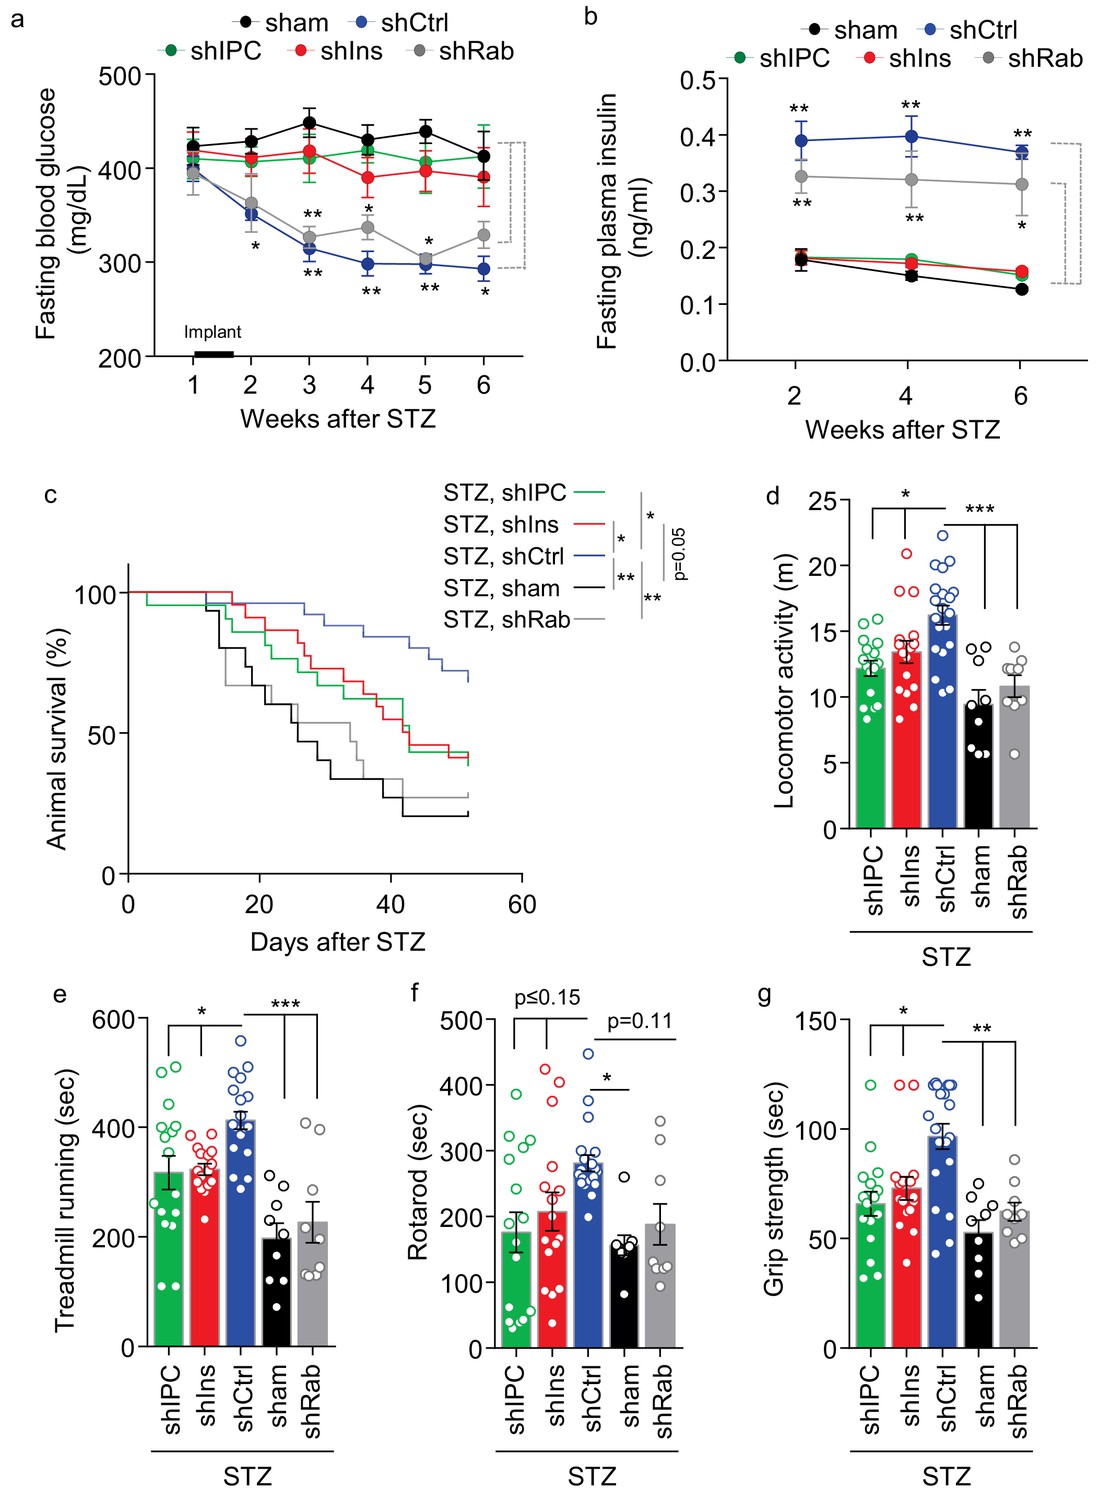
Role of multi-secretion of htNSCPGHM spheres for its anti-disease effects.
STZ mice received sham implantation (+STZ, sham) vs. implantation with htNSCPGHM expressing shRNAs against insulin (shIns), triple peptides including insulin, PACAP and CCK (shIPC) or Rab27a-positive exosomes (shRab) vs. scramble shRNA control (shCtrl). The mice at the starting point of this experiment were n = 15, 22, 21, 15 and 25 per group, respectively. These mice were periodically measured for fasting blood glucose (a) and insulin (b) while being followed up for survival (c), and subgroups of mice were subjected to non-invasive behavioral assays at 4 weeks post implantation (d–g). Changes of studied sample sizes over time in (b) and (c) were indicated by the survival rates in a. The studied sample sizes in (d–g) were n = 16–20 mice per group in shIPC, shIns, and shCtrl, and n = 9 mice per group in shRab and sham. *p<0.05, **p<0.01, ***p<0.001, ANOVA/post-hoc (a–b, d–g), and Log-rank (Mantel-Cox) survival test (c); compared between time-matched groups indicated by dash lines (a, b), or between indicated curves (c) or columns (d–g); data are mean ± s.e.m.
Tables
Author response table 1
| Figure 5D: animal number of each group and each time point | Figure 6A: animal number of each group and each time point (Please note that these cohorts were different from Figure 5D) | |||||
|---|---|---|---|---|---|---|
| Day | +STZ, Sham | +STZ, htNSCPGHM | Day | +STZ, Sham | +STZ, htNSCPGHM | |
| -5 | 30 | 39 | -5 | 26 | 25 | |
| 5 | 30 | 39 | 5 | 26 | 25 | |
| 9 | 29 | 39 | 7 | 25 | 25 | |
| 16 | 26 | 37 | 9 | 25 | 25 | |
| 22 | 22 | 36 | 14 | 23 | 25 | |
| 30 | 15 | 34 | 16 | 23 | 25 | |
| 36 | 14 | 32 | 21 | 22 | 23 | |
| 45 | 12 | 29 | 22 | 22 | 23 | |
| 25 | 22 | 21 | ||||
| 26 | 21 | 21 | ||||
| 28 | 18 | 21 | ||||
| 30 | 17 | 21 | ||||
| 32 | 16 | 21 | ||||
| 36 | 16 | 21 | ||||
| 42 | 13 | 21 | ||||
| 45 | 12 | 20 | ||||
| 52 | 10 | 20 | ||||
| 55 | 9 | 19 | ||||
| 56 | 8 | 19 | ||||
| 57 | 8 | 18 | ||||
| 65 | 7 | 17 | ||||
| 77 | 5 | 15 | ||||
Author response table 2
| Figure 7A: animal number of each group and each time point | Figure 7C: animal number of each group and each time point | |||||||||||
|---|---|---|---|---|---|---|---|---|---|---|---|---|
| Week | shIPC | shIns | shCtrl | Sham | shRab | Day | shIPC | shIns | shCtrl | Sham | shRab | |
| 1 | 20 | 22 | 25 | 15 | 15 | 0 | 21 | 22 | 25 | 15 | 15 | |
| 2 | 20 | 22 | 24 | 12 | 12 | 3 | 20 | 22 | 25 | 15 | 15 | |
| 3 | 17 | 19 | 24 | 9 | 10 | 7 | 20 | 22 | 25 | 15 | 15 | |
| 4 | 15 | 16 | 23 | 7 | 8 | 12 | 20 | 22 | 24 | 14 | 14 | |
| 5 | 13 | 15 | 22 | 5 | 6 | 14 | 20 | 22 | 24 | 12 | 12 | |
| 6 | 11 | 11 | 21 | 3 | 4 | 15 | 19 | 22 | 24 | 12 | 10 | |
| 16 | 18 | 21 | 24 | 12 | 10 | |||||||
| 18 | 18 | 20 | 24 | 11 | 10 | |||||||
| 19 | 18 | 20 | 24 | 10 | 10 | |||||||
| 21 | 17 | 19 | 24 | 9 | 10 | |||||||
| 22 | 16 | 19 | 24 | 9 | 9 | |||||||
| 25 | 16 | 19 | 24 | 8 | 9 | |||||||
| 26 | 15 | 18 | 24 | 7 | 8 | |||||||
| 27 | 15 | 17 | 23 | 7 | 8 | |||||||
| 28 | 15 | 16 | 23 | 7 | 8 | |||||||
| 29 | 14 | 16 | 23 | 6 | 8 | |||||||
| 30 | 14 | 16 | 22 | 6 | 8 | |||||||
| 31 | 14 | 16 | 22 | 5 | 8 | |||||||
| 33 | 13 | 15 | 22 | 5 | 8 | |||||||
| 34 | 13 | 15 | 22 | 5 | 7 | |||||||
| 35 | 13 | 15 | 22 | 5 | 6 | |||||||
| 36 | 13 | 14 | 21 | 5 | 5 | |||||||
| 38 | 13 | 13 | 21 | 5 | 5 | |||||||
| 39 | 13 | 12 | 21 | 4 | 5 | |||||||
| 42 | 11 | 11 | 21 | 3 | 4 | |||||||
| 43 | 9 | 10 | 20 | 3 | 4 | |||||||
| 46 | 9 | 10 | 19 | 3 | 4 | |||||||
| 48 | 9 | 10 | 18 | 3 | 4 | |||||||
| 49 | 9 | 9 | 18 | 3 | 4 | |||||||
| 52 | 8 | 9 | 17 | 3 | 4 | |||||||
Author response table 3
| Figure 7—figure supplement 1B: Animal number of each group and each time point | Figure 7—figure supplement 1D: Animal number of each group and each time point | |||||||
|---|---|---|---|---|---|---|---|---|
| Day | Veh+Sham | DSS+Sham | DSS+ htNSCPGHM | Day | Veh+Sham | DSS+Sham | DSS+ htNSCPGHM | |
| 0 | 10 | 9 | 9 | 0 | 10 | 9 | 9 | |
| 1 | 10 | 9 | 9 | 1 | 10 | 9 | 9 | |
| 2 | 10 | 9 | 9 | 2 | 10 | 9 | 9 | |
| 3 | 10 | 9 | 9 | 3 | 10 | 9 | 9 | |
| 4 | 10 | 9 | 9 | 4 | 10 | 9 | 9 | |
| 5 | 10 | 9 | 9 | 5 | 10 | 9 | 9 | |
| 6 | 10 | 9 | 9 | 6 | 10 | 9 | 9 | |
| 7 | 10 | 9 | 9 | 7 | 10 | 9 | 9 | |
| 8 | 10 | 9 | 9 | 8 | 10 | 9 | 9 | |
| 9 | 10 | 9 | 9 | 9 | 10 | 9 | 9 | |
| 10 | 10 | 9 | 9 | 10 | 10 | 9 | 9 | |
| 11 | 10 | 9 | 9 | 11 | 10 | 9 | 9 | |
| 12 | 10 | 9 | 9 | 12 | 10 | 9 | 9 | |
| 13 | 10 | 8 | 9 | 13 | 10 | 8 | 9 | |
| 14 | 10 | 6 | 9 | 14 | 10 | 6 | 9 | |
| 15 | 10 | 6 | 9 | 15 | 10 | 6 | 9 | |
| 16 | 10 | 6 | 9 | 16 | 10 | 6 | 9 | |
| 17 | 10 | 6 | 9 | 17 | 10 | 6 | 9 | |
| 18 | 10 | 5 | 9 | 18 | 10 | 5 | 9 | |
| 19 | 10 | 5 | 9 | 19 | 10 | 5 | 9 | |
| 20 | 10 | 5 | 9 | 20 | 10 | 5 | 9 | |
| 21 | 10 | 5 | 9 | 21 | 10 | 5 | 9 | |
| 22 | 10 | 5 | 9 | 22 | 10 | 5 | 9 | |
| 23 | 10 | 5 | 9 | 23 | 10 | 5 | 9 | |
| 24 | 10 | 5 | 9 | 24 | 10 | 5 | 9 | |
| 25 | 10 | 5 | 9 | 25 | 10 | 5 | 9 | |
| 26 | 10 | 5 | 9 | 26 | 10 | 5 | 9 | |
| 27 | 10 | 5 | 9 | 27 | 10 | 4 | 9 | |
| 28 | 10 | 4 | 9 | |||||
| 29 | 10 | 4 | 9 | |||||
| 30 | 10 | 4 | 9 | |||||
Additional files
Download links
A two-part list of links to download the article, or parts of the article, in various formats.
Downloads (link to download the article as PDF)
Open citations (links to open the citations from this article in various online reference manager services)
Cite this article (links to download the citations from this article in formats compatible with various reference manager tools)
Multifaceted secretion of htNSC-derived hypothalamic islets induces survival and antidiabetic effect via peripheral implantation in mice
eLife 9:e52580.
https://doi.org/10.7554/eLife.52580


