Opposite changes in APP processing and human Aβ levels in rats carrying either a protective or a pathogenic APP mutation
- Rutgers, The State University of New Jersey, United States
Figures
Figure 1
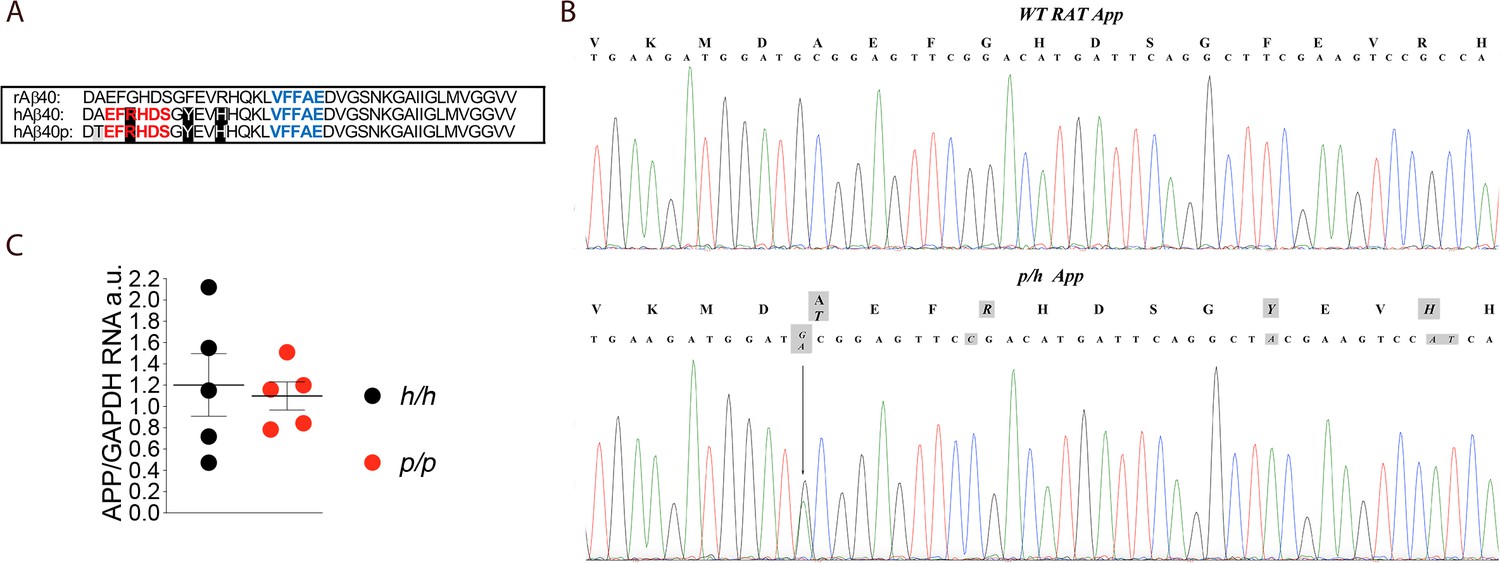
App is mutated to contain protective and humanizing mutations and App mRNA expression is normal in Appp KI rats.
(A) Alignment of Aβ40 region from wildtype rats (top), Apph rats (middle), and Appp rats (bottom). 6E10 epitopes are in red, 4G8 epitopes are in blue. Humanizing mutations are in highlighted in black. (B) PCR amplification of App gene exon-16 from Appw/w and Appp/h rats and sequencing of PCR product shows that the humanizing (G to C, T to A and GC to AT substitution) and protective (the G to A substitution) mutations were correctly inserted. Substituted nucleotides are highlighted in gray. The amino acid substitutions introduced by the mutations are highlighted in gray above the DNA sequences (G to T = A to T; G to C = G to R; T to A = Y to F; and GC to AT = R to H). (C) Levels of App mRNA were measured at p21 and normalized to Gapdh mRNA expression. We used the following male and female animals: Apph/h, 3 males and 2 females; Appp/p, 3 males and 2 females. Data were analyzed by unpaired student’s t-test, and presented as average (App/Gapdh)± SEM.
-
Figure 1—source data 1
Related to Figure 1C.
- https://cdn.elifesciences.org/articles/52612/elife-52612-fig1-data1-v2.xlsx
Figure 2
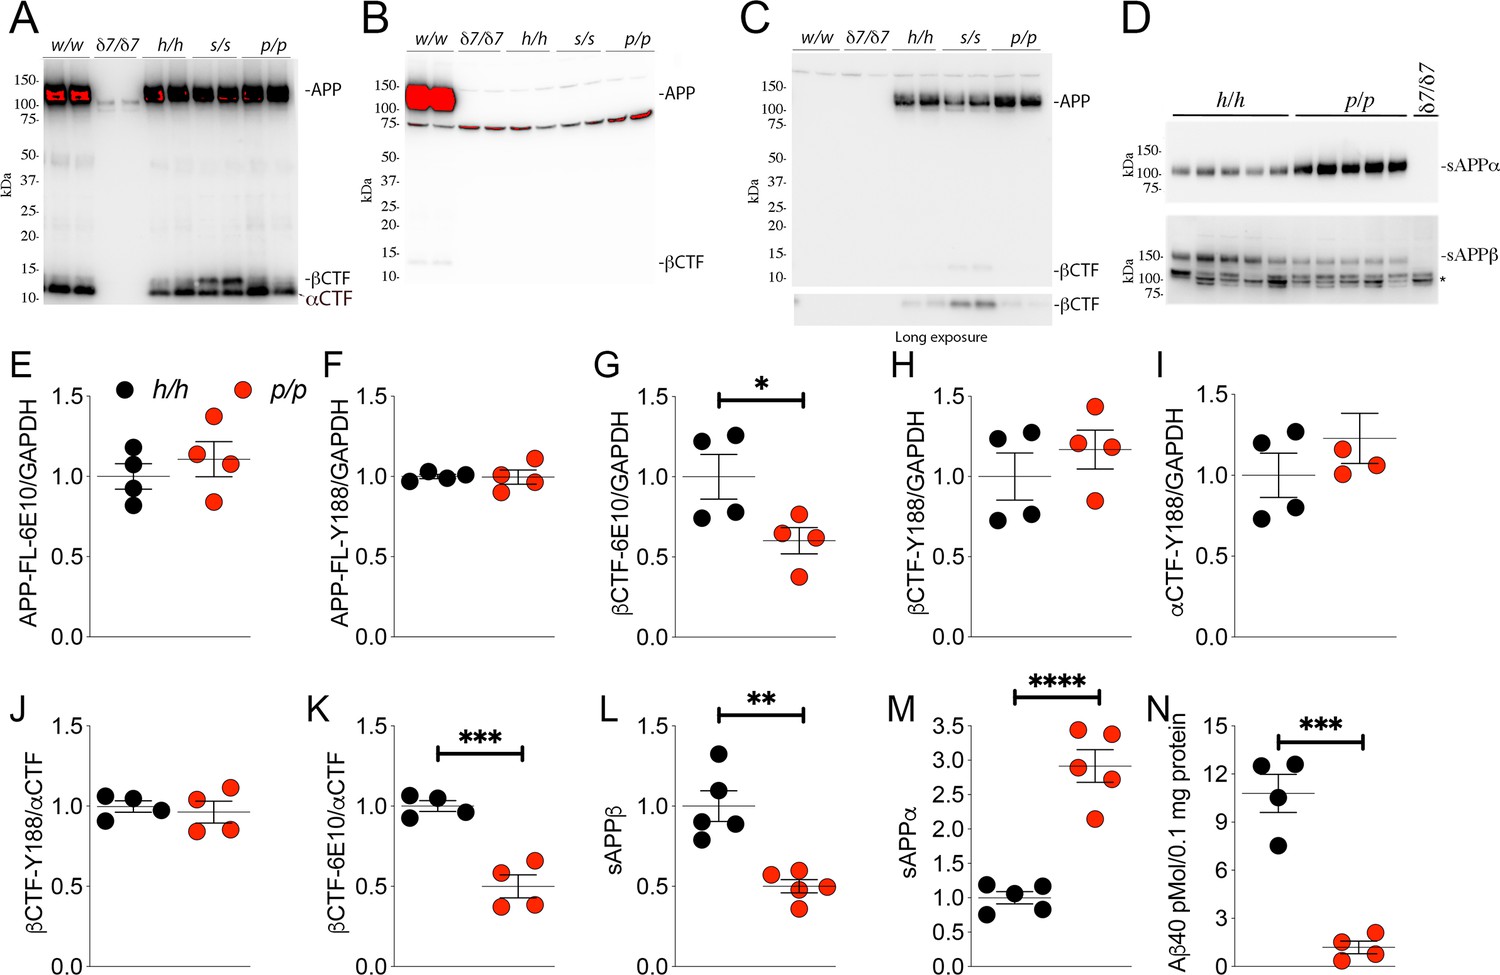
The protein encoded by the Appp allele contains the humanizing and protective mutations, which reduces β-processing and increases α-processing of APP.
Western blot (WB) analysis of brain lysate isolated from Appw/w, Appδ7/δ7, Apph/h, Apps/s, and Appp/p rats with: (A) Y188, an antibody that detects mAPP, imAPP, αCTF, and βCTF. Specific APP signals are detected from all animals except the Appδ7/δ7 rats); (B) M3.2, a mouse monoclonal antibody that detects only rat WT APP and βCTF; (C) 6E10, a mouse monoclonal antibody that detects only APP and βCTF carrying the humanizing mutations. (D) WB analysis with anti-sAPPα and anti-sAPPβ-WT (absent in Appδ7/δ7 controls, *=non specific signal). (E–K) Quantification of APP metabolites in Apph/h and Appp/p rats normalized to GAPDH; APP levels as detected by either 6E10 (E) or Y188 (F); βCTF levels as detected by either 6E10 (G) or Y188 (H); αCTF levels as detected by Y188 (I); βCTF/αCTF ratio as measured by either 6E10-βCTF (J) or Y188-βCTF (K) quantitation values. Quantification of sAPPβ (L) and sAPPα (M) WB levels. (N) Aβ40 levels in Apph/h and Appp/p samples measured by Wako ELISA. Overexposed WBs are provided in panels A-B to show CTF levels clearly. Quantitations were performed on non-saturated exposures. Data are represented as mean ± SEM. Statistical analyses are by unpaired student’s t-test (*p<0.05; **p<0.01; ***p<0.001; ****p<0.0001). Animals were analyzed at p21. We used the following male and female animals: 2E, F, G, H, I, J, K, N; Apph/h, 2 males and 2 females; Appp/p, 2 males and 2 females: 2L and 2M; Apph/h, 3 males and 2 females; Appp/p, 3 males and 2 females.
-
Figure 2—source data 1
Related to Figure 2E,F,G,H,I,J,K,L,M.
- https://cdn.elifesciences.org/articles/52612/elife-52612-fig2-data1-v2.xlsx
Figure 3
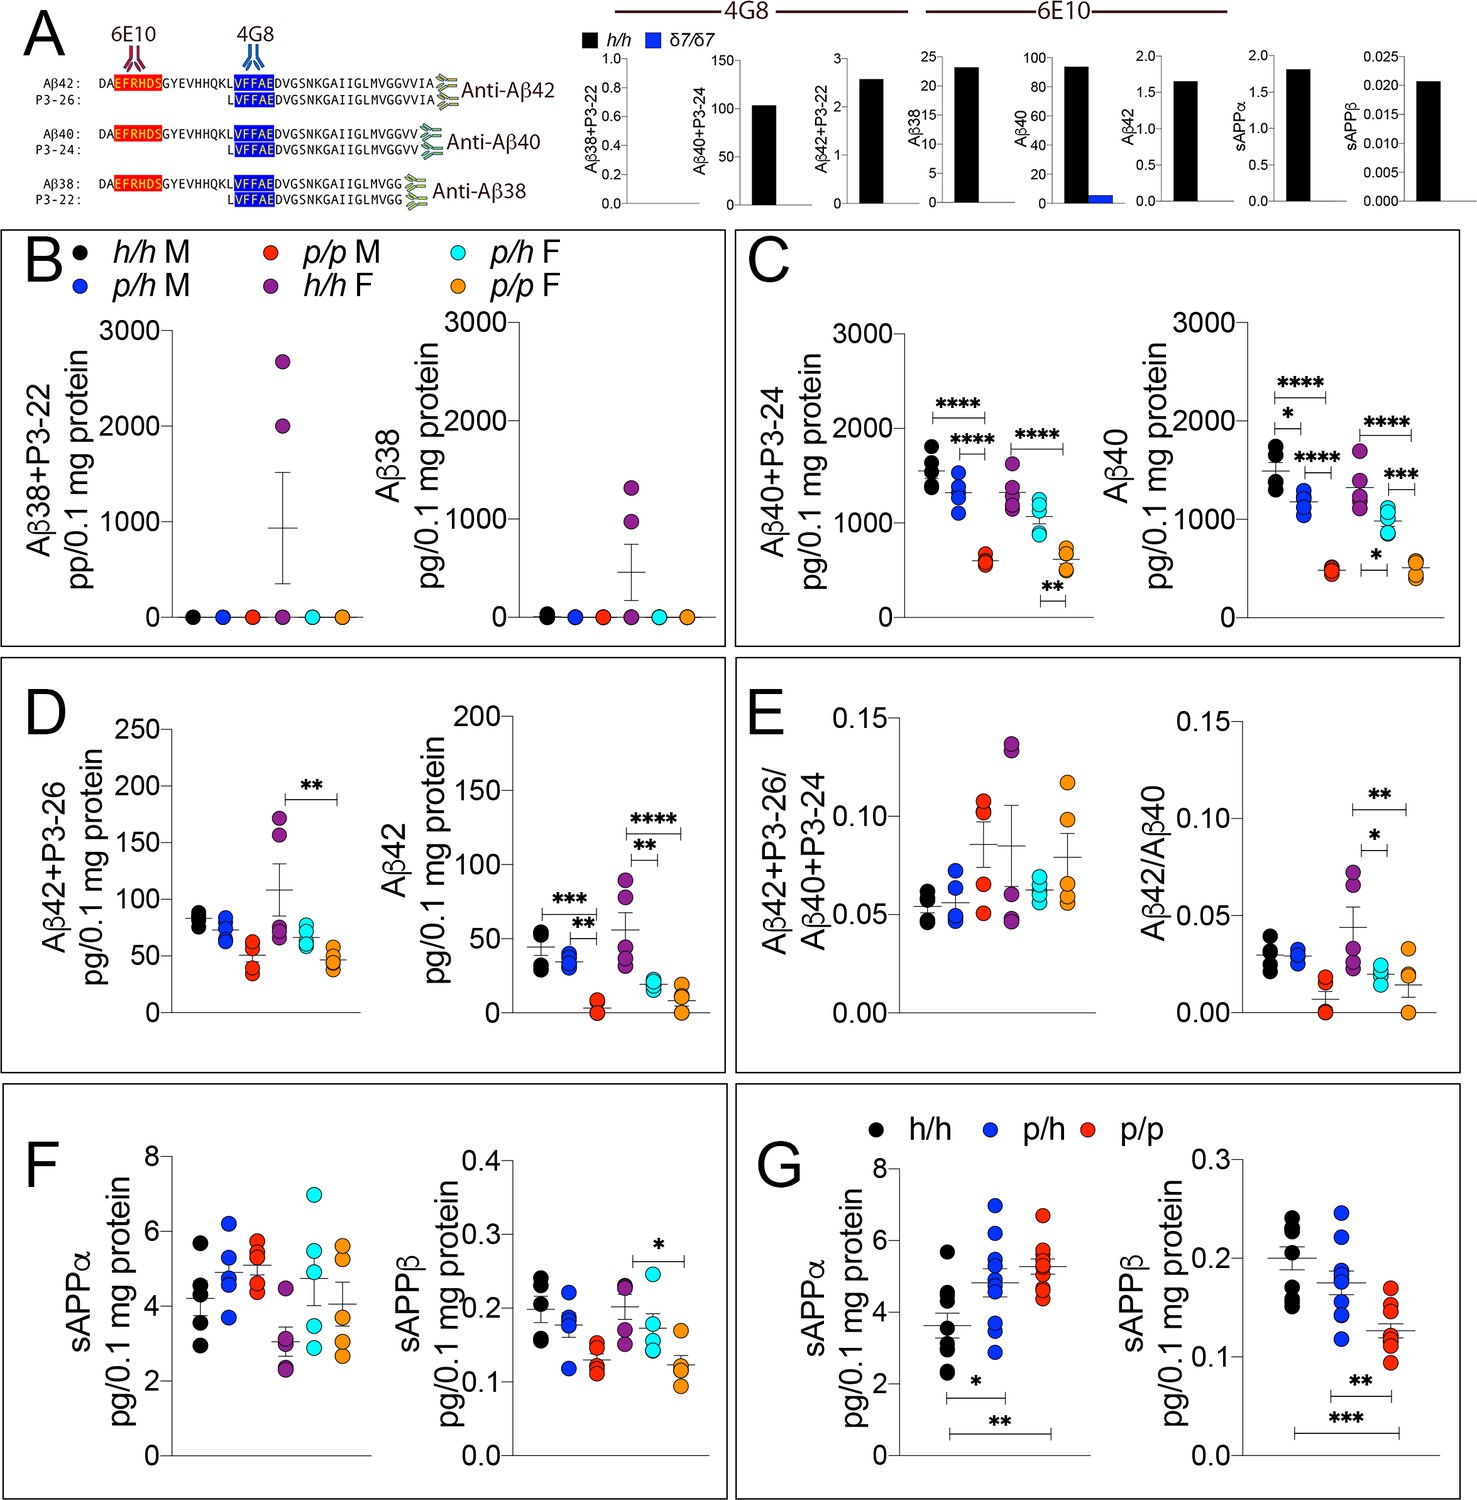
ELISA of APP metabolites in Appp rats shows decreased APP processing by β-secretase and increased processing by α-secretase.
To test whether the APP protective mutation results in the expected changes in APP metabolism, we extracted brain tissue from a larger cohort that can identify sex-dependent changes in Apph/h, Appp/h and Appp/p 28 day old rats. (A) Left panel, Amino acid sequence of Aβ and P3 peptides recognized by Meso Scale Discovery kits. Detection antibody epitopes for 6E10 (red) and 4G8 (blue) are shown. Capture antibodies recognize Aβ42 and P3-26 (top), Aβ40 and P3-24 (middle), and Aβ38 and P3-22 (bottom). Right panel, Validation of ELISAs of Aβ/P3-4G8, Aβ−6E10, sAPPα, and sAPPβ using Appδ7/δ7 and Apph/h brain lysates. (B) ELISA of brain lysates for Aβ38 and P3-22 (left) and Aβ38 (right) showed that no significant differences between in Apph/h, Appp/h and Appp/p rats. (C) ELISA of brain lysates for Aβ40 and P3-24 (left) and Aβ40 (right) showed a gene-dose dependent and sex independent decrease as follows: Apph/h > Apppp/h > Apppp/p. (D) ELISA of brain lysates for Aβ42 and P3-26 (left) and Aβ42 (right) showed a gene-dose dependent and sex independent decrease as follows: Apph/h > Apppp/h > Apppp/p. (E) Aβ42+P3-26/Aβ40+P3-24 ratio and Aβ42/Aβ40 ratio. (F) ELISA of sAPPα and sAPPβ of Apph/h, Appp/h, and Appp/p rat brains separated by sex and (G) with sexes pooled. Data are represented as mean ± SEM. Data were analyzed by Ordinary one-way ANOVA followed by post-hoc Tukey's multiple comparisons test when ANOVA showed statistically significant differences. Animals were analyzed at p28. We used 5 male and 5 female rats for each genotype. To reduce complexity of the panels, in the graphs with both sexes only intra-sex differences are shown (*p<0.05; **p<0.01; ***p<0.001; ****p<0.0001).
-
Figure 3—source data 1
Related to Figure 3B,C,D,E,F,G.
- https://cdn.elifesciences.org/articles/52612/elife-52612-fig3-data1-v2.xlsx
Figure 4 with 1 supplement
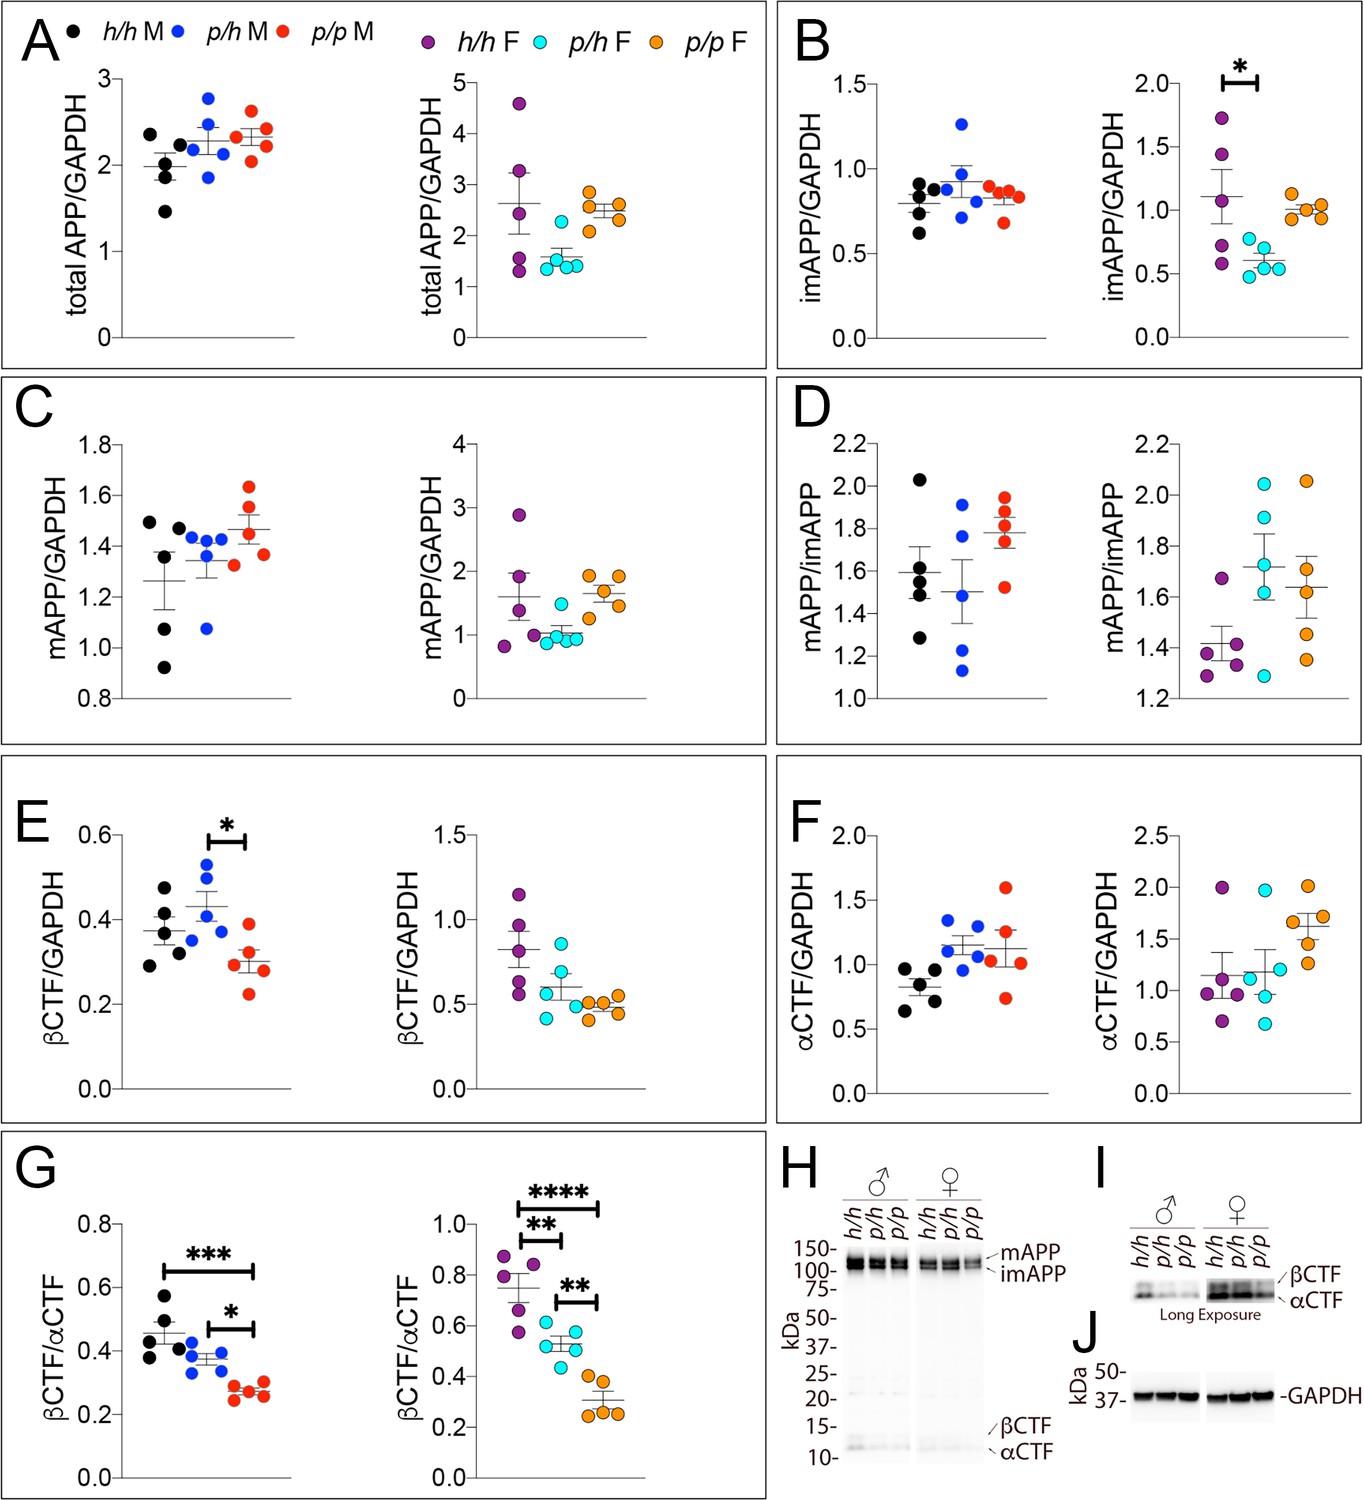
Western analysis of APP metabolites in Appp rats shows decreased APP processing by β-secretase.
Quantitation of WB analysis (A–G) with representative blots (H–J). (A) Normalized total APP levels in Apph/h, Appp/h and Appp/p male (left) and female (right) rats. (B) Normalized imAPP levels in Apph/h, Appp/h and Appp/p male (left) and female (right) rats. (C) Normalized mAPP levels in Apph/h, Appp/h and Appp/p male (left) and female (right) rats. (D) Ratio of mAPP:imAPP in Apph/h, Appp/h and Appp/p rats. (E) Normalized β-CTF levels in Apph/h, Appp/h and Appp/p male (left) and female (right) rats. (F) Normalized α-CTF levels in Apph/h, Appp/h and Appp/p male (left) and female (right) rats. (G) Ratio of β-CTF: α-CTF. (H) Representative blot against C-terminus of APP (I) Longer exposure of α-APP-C-terminus blot to detect α-CTF and β-CTFs. (J) Anti-GAPDH loading control. Data are represented as mean ± SEM. Data were analyzed by Ordinary one-way ANOVA followed by post-hoc Tukey's multiple comparisons test when ANOVA showed statistically significant differences (*p<0.05; **p<0.01; ***p<0.001; ****p<0.0001). Animals were analyzed at p28. We used 5 male and 5 female rats for each genotype.
-
Figure 4—source data 1
Related to Figure 4A,B,C,D,E,F,G.
- https://cdn.elifesciences.org/articles/52612/elife-52612-fig4-data1-v2.xlsx
Figure 4—figure supplement 1
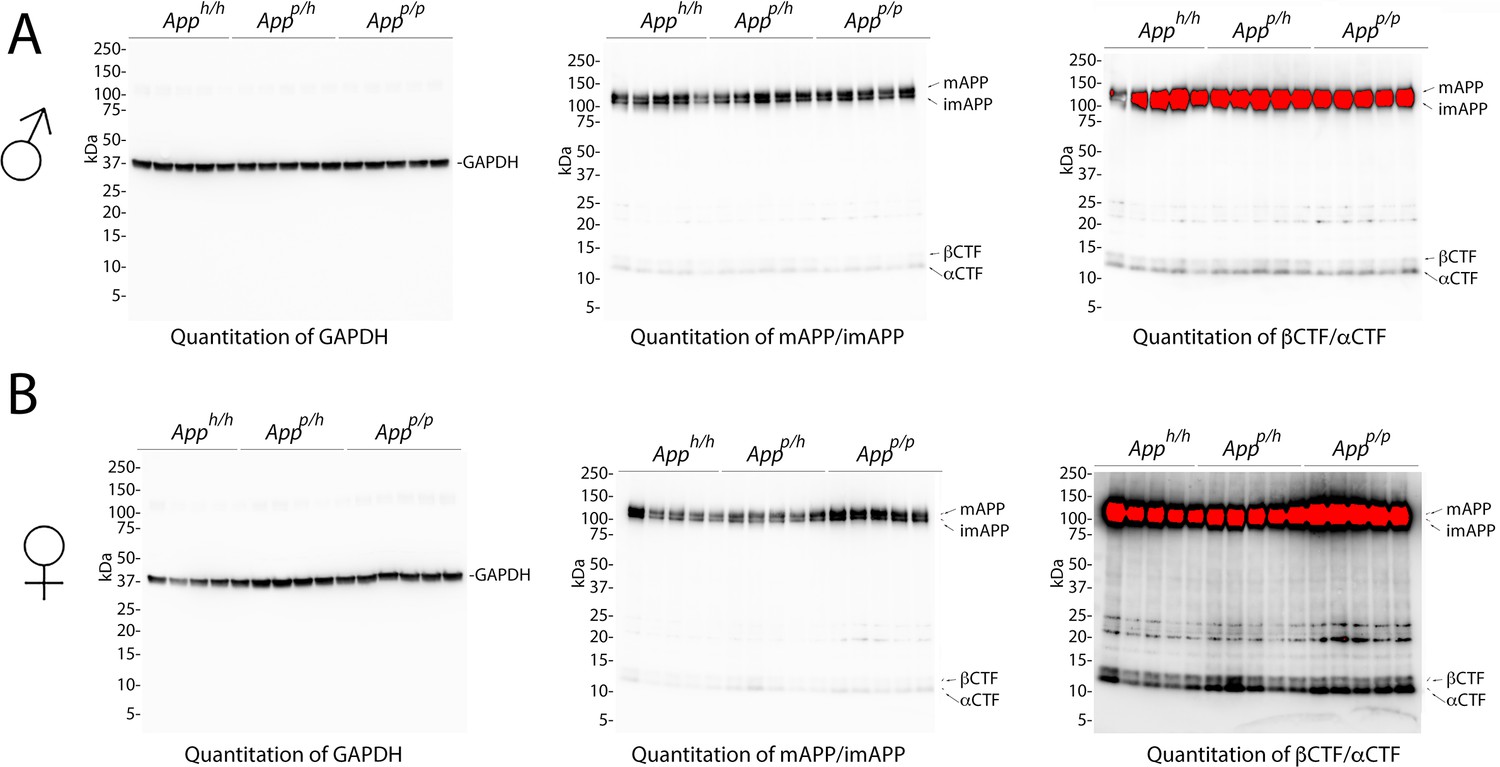
Western blots images used for quantitation shown in Figure 4.
(A) Blots used to quantify GAPDH (left), mAPP and imAPP (center), αCTF and βCTF (right) in males. (B) Blots used to quantify GAPDH (left), mAPP and imAPP (center), αCTF and βCTF (right) in females.
Figure 5
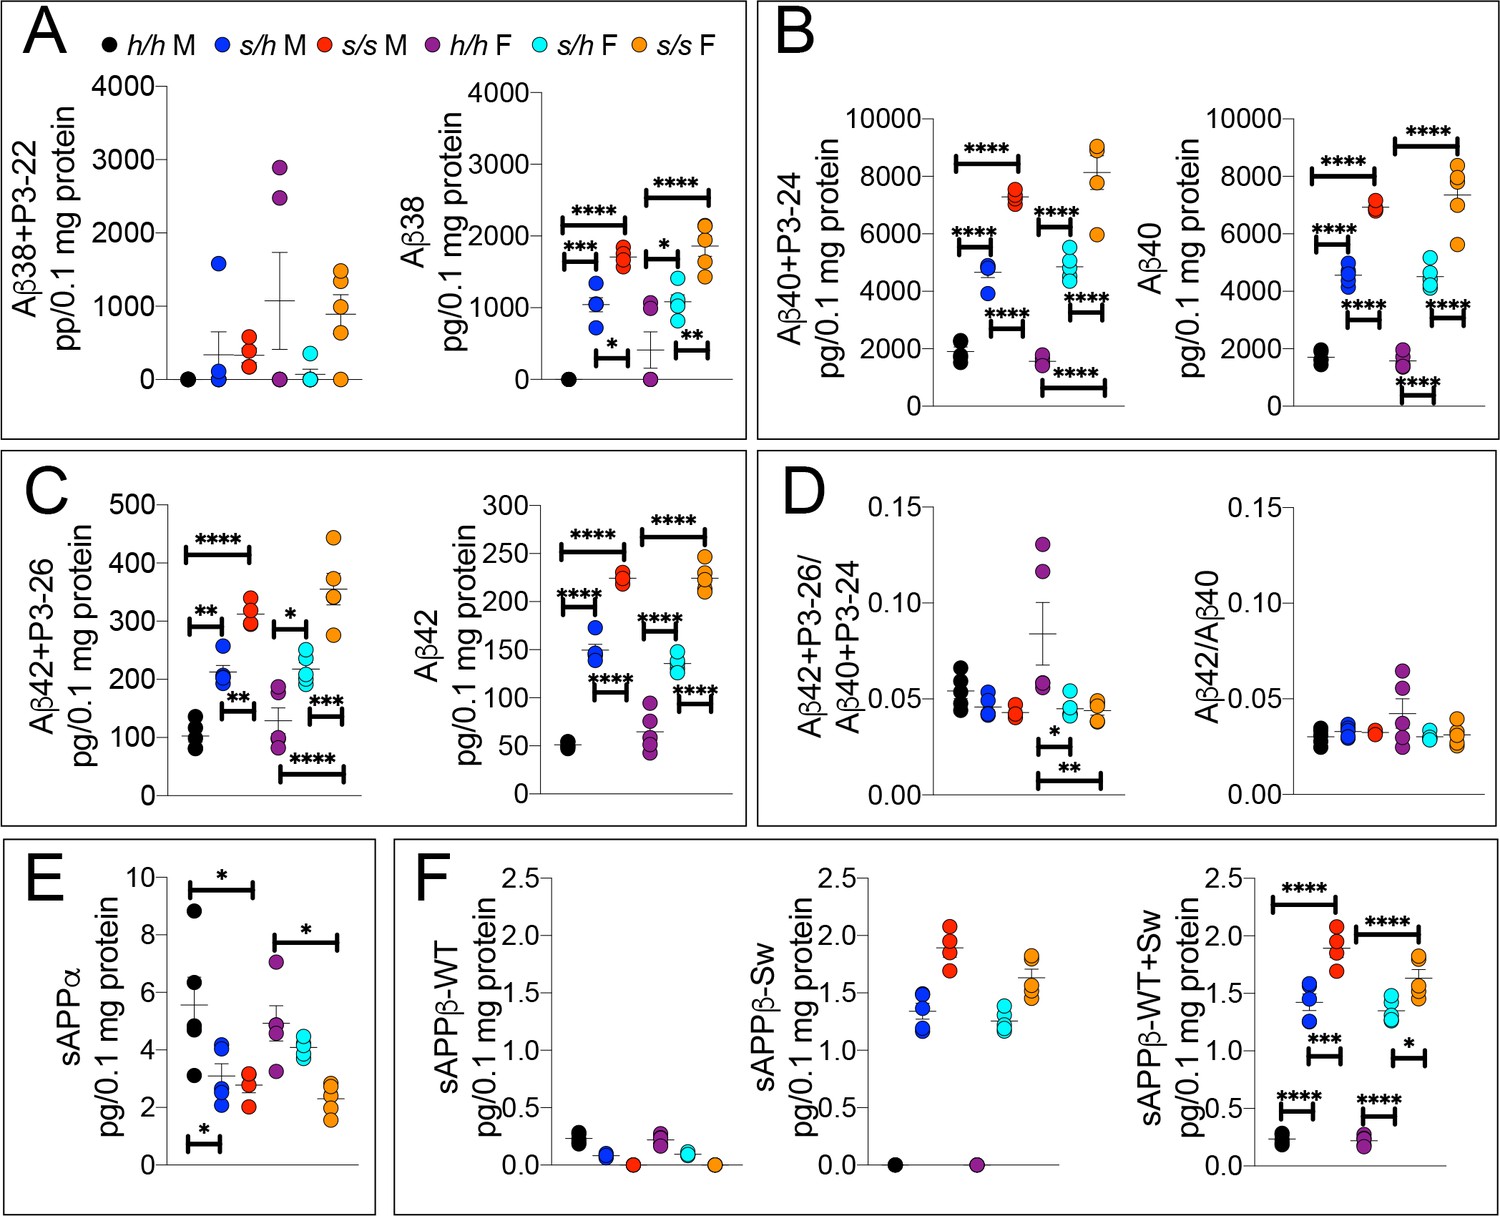
ELISA of APP metabolites in Apps rats shows increased APP processing by β-secretase and decreased processing by α-secretase.
To confirm the Swedish mutation results in the expected changes in APP metabolism, we extracted brain tissue from a larger cohort that can identify sex-dependent changes in Apph/h, Apps/h, and Apps/s 28 day old rats. (A) ELISA of brain lysates for Aβ38 and P3-22 (left) showed that no significant differences between in Apph/h, Apps/h, and Apps/s when P3-22 is considered, however Aβ38 (right) showed a gene-dose dependent and sex independent increase as follows: Apph/h < Appss/h < Appss/s. (B) ELISA of brain lysates for Aβ40 and P3-24 (left) and Aβ40 (right) showed a gene-dose dependent and sex independent decrease as follows: Apph/h < Appss/h < Appss/s. (C) ELISA of brain lysates for Aβ42 and P3-26 (left) and Aβ42 (right) showed a gene-dose-dependent and sex-independent decrease as follows: Apph/h < Appss/h < Appss/s. (D) Aβ42+P3-26/Aβ40+P3-24 ratio and Aβ42/Aβ40 ratio. (E) ELISA of sAPPα (F) ELISA of sAPPβ-WT (left) sAPPβ-Sw (middle) and the calculated sum of both sAPPβ species (right). Data are represented as mean ± SEM. Data were analyzed by Ordinary one-way ANOVA followed by post-hoc Tukey's multiple comparisons test when ANOVA showed statistically significant differences. Animals were analyzed at p28. We used 5 male and 5 female rats for each genotype, except for male Apps/s (n = 4). To reduce complexity of the panels, in the graphs with both sexes only intra-sex differences are shown (*p<0.05; **p<0.01; ***p<0.001; ****p<0.0001).
-
Figure 5—source data 1
Related to Figure 5A,B,C,D,E,F.
- https://cdn.elifesciences.org/articles/52612/elife-52612-fig5-data1-v2.xlsx
Figure 6 with 1 supplement
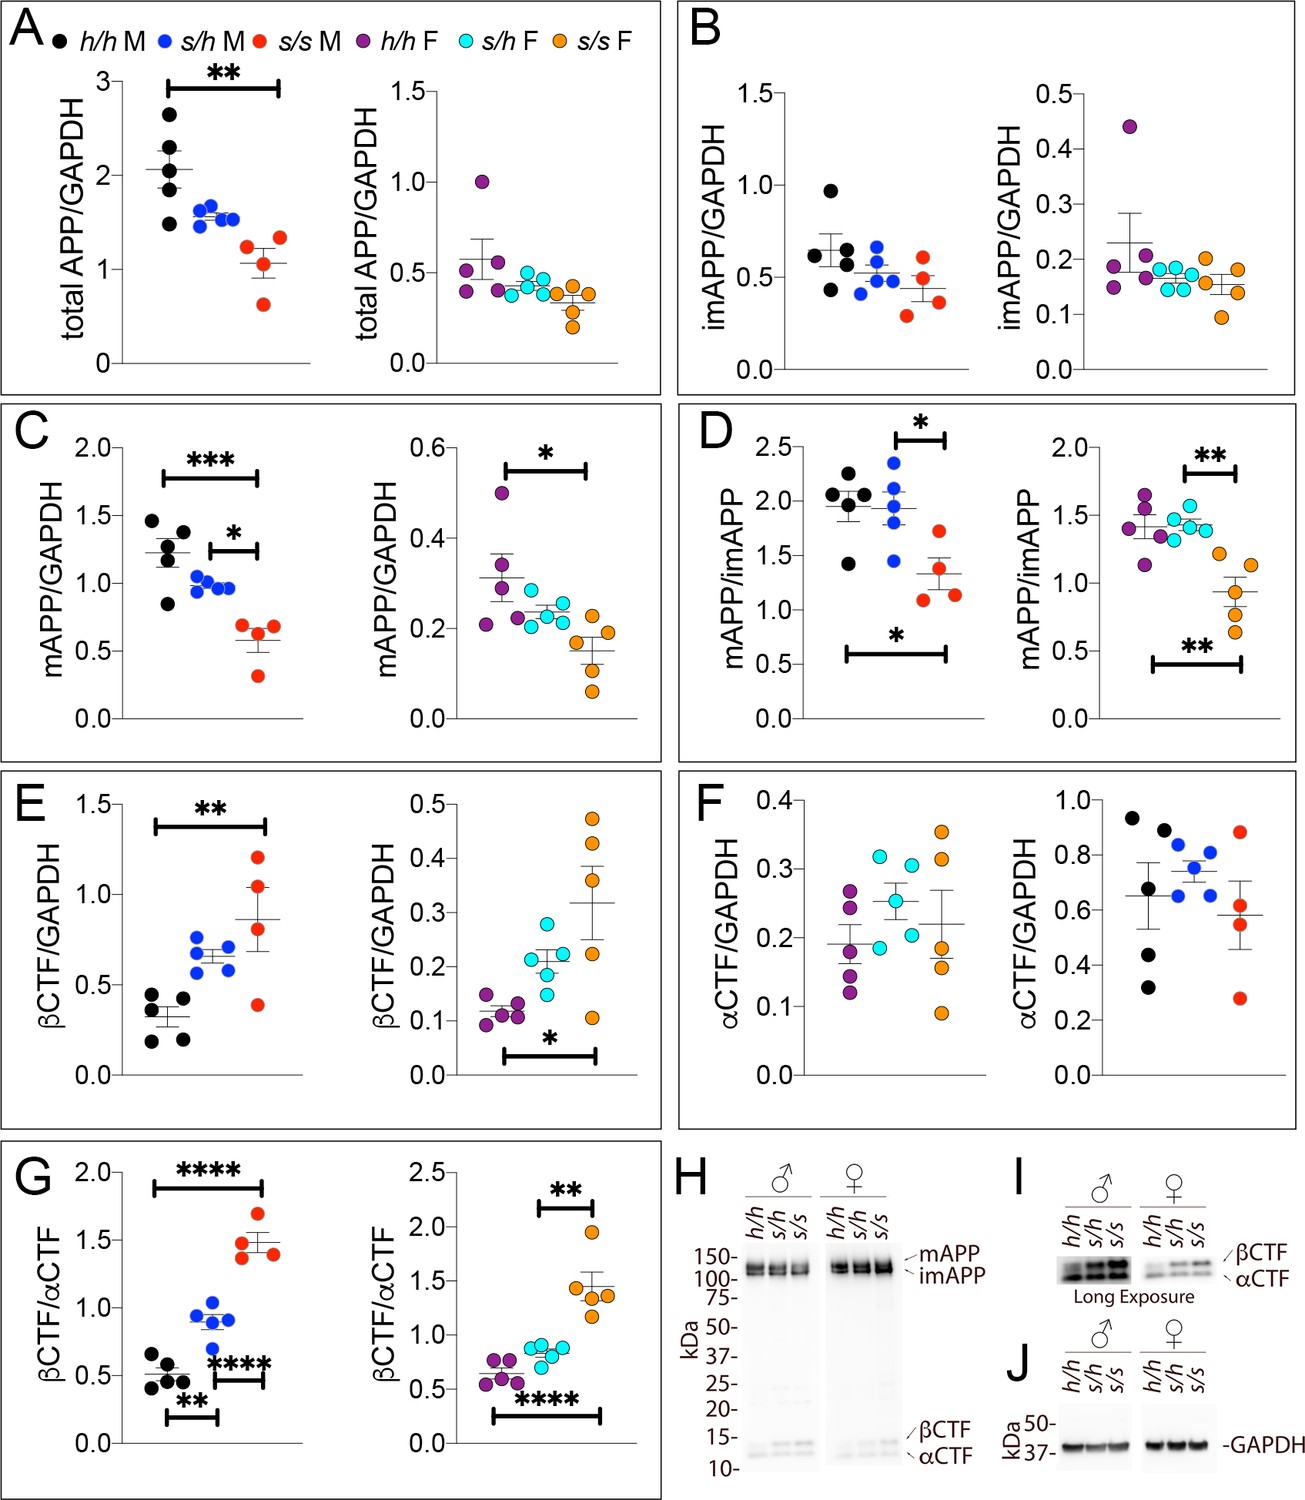
Western analysis of APP metabolites in Apps rats shows increased APP processing by β-secretase and decreased levels of mature APP.
Quantitation of WB analysis (A–G) with representative blots (H–J). (A) Normalized total APP levels in Apph/h, Apps/h, and Apps/s male (left) and female (right) rats, show a gene-dose dependent decrease in Apps rats. (B) Normalized imAPP levels in Apph/h, Apps/h, and Apps/s male (left) and female (right) rats. (C) Normalized mAPP levels in Apph/h, Apps/h, and Apps/s male (left) and female (right) rats show a gene-dose dependent decrease in Apps rats. (D) Ratio of mAPP:imAPP in Apph/h, Apps/h, and Apps/s rats. (E) Normalized βCTF levels in Apph/h, Apps/h, and Apps/s male (left) and female (right) rats. (F) Normalized αCTF levels in Apph/h, Apps/h, and Apps/s male (left) and female (right) rats. (G) Ratio of βCTF: αCTF. (H) Representative blot against C-terminus of APP (I) Longer exposure of α-APP-C-terminus blot to detect αCTF and βCTFs. (J) Anti-GAPDH loading control. Data are represented as mean ± SEM. Data were analyzed by Ordinary one-way ANOVA followed by post-hoc Tukey's multiple comparisons test when ANOVA showed statistically significant differences (*p<0.05; **p<0.01; ***p<0.001; ****p<0.0001.. Animals were analyzed at p28. We used 5 male and 5 female rats for each genotype, except for male Apps/s (n = 4).
-
Figure 6—source data 1
Related to Figure 6A,B,C,D,E,F,G.
- https://cdn.elifesciences.org/articles/52612/elife-52612-fig6-data1-v2.xlsx
Figure 6—figure supplement 1
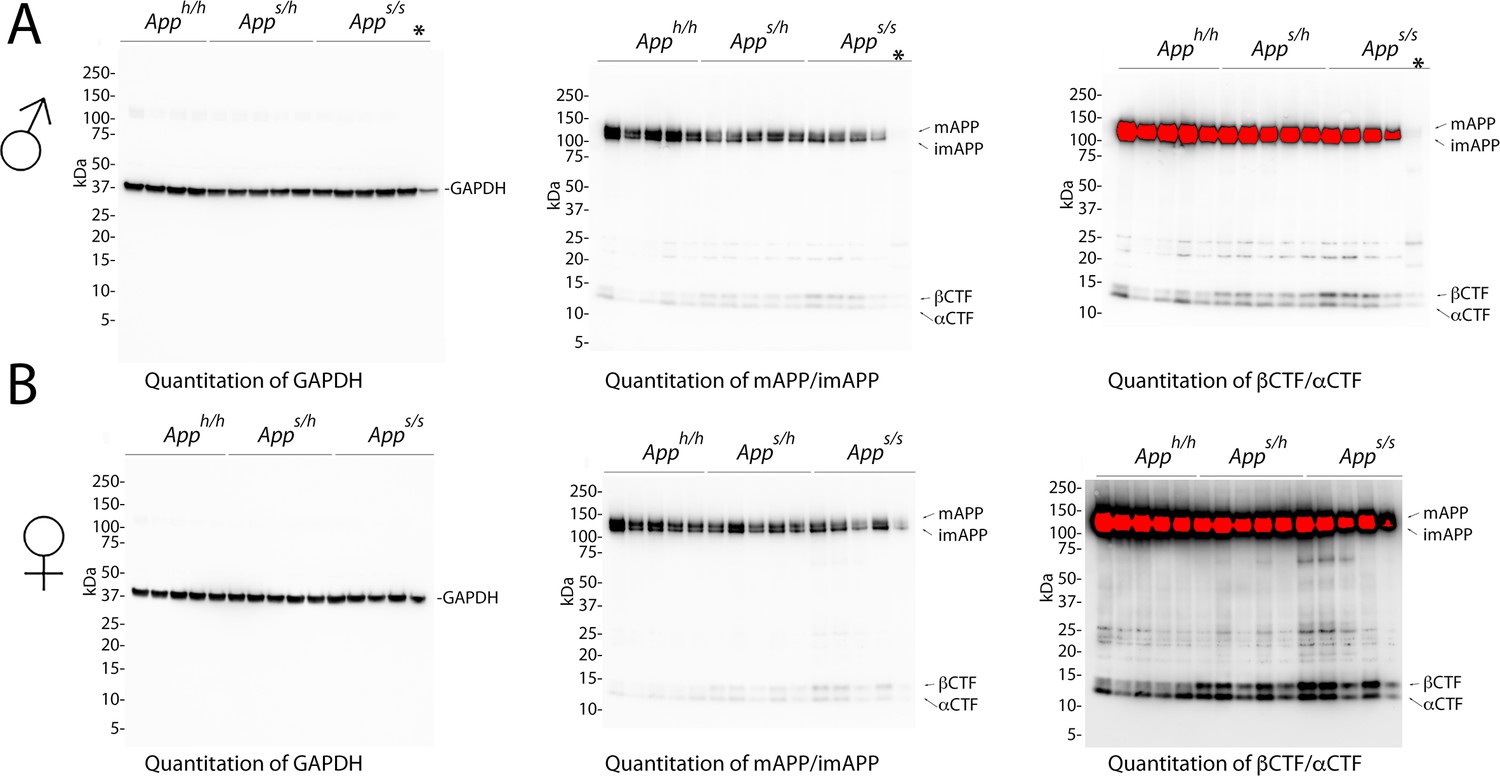
Western blots images used for quantitation shown in Figure 6.
(A) Blots used to quantify GAPDH (left), mAPP and imAPP (center), αCTF and βCTF (right) in males. As it is evident from the blots, one Apps/s sample was degraded (indicated with *) and therefore that animal was excluded from any analysis. (B) Blots used to quantify GAPDH (left), mAPP and imAPP (center), αCTF and βCTF (right) in females.
Figure 7 with 1 supplement
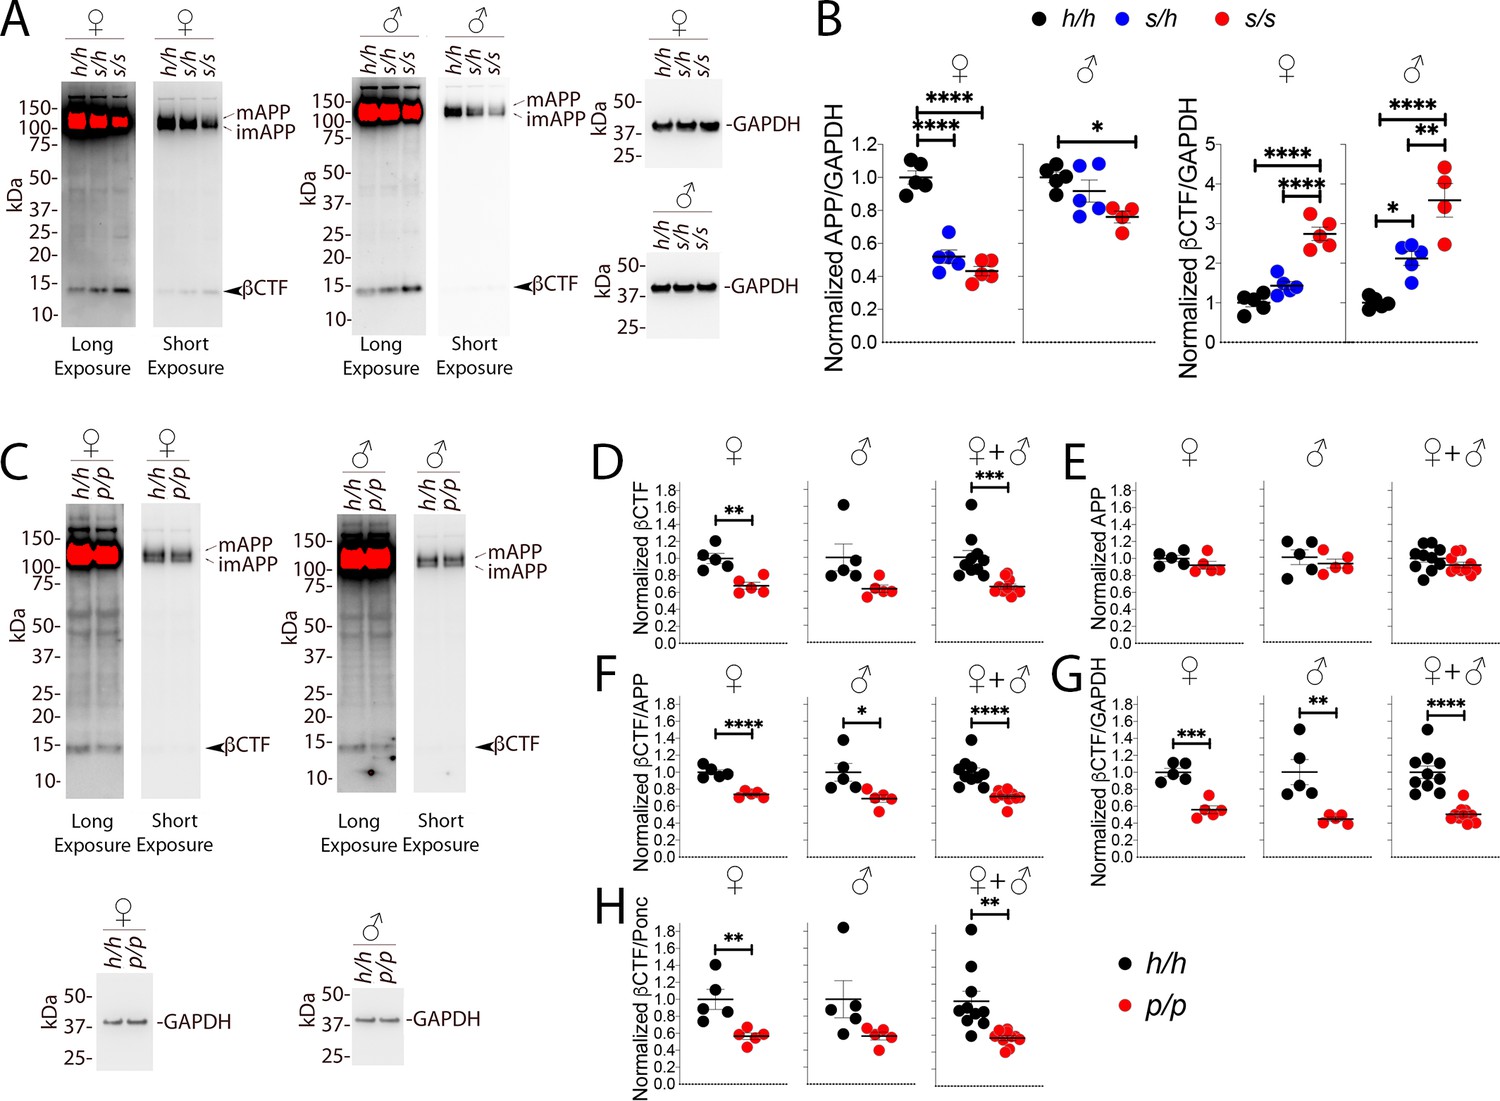
Western analysis of βCTF shows increased levels of βCTF in Apps animals and decreased levels in Appp rats.
(A) Representative blot with 6E10 (Long exposure was used to quantify βCTF, Short exposure was used to quantify APP) and anti-GAPDH on Apph/h, Apps/h, and Apps/s female and male brain lysates. The blots used for quantitation are shown in Figure 7—figure supplement 1A and B. (B) Total APP, βCTF and GAPDH were normalized against the average signal of the control Apph/h samples and shown as ratio of the normalized APP/GAPDH and βCTF/GAPDH ratios. APP and βCTF are decrease and increased in Apps rats, respectively, in a gene-dose-dependent manner. Data are represented as mean ± SEM. Data were analyzed by ordinary one-way ANOVA followed by post-hoc Tukey's multiple comparisons test when ANOVA showed statistically significant differences. Animals were analyzed at p28. We used 5 male and 5 female rats for each genotype, except for male Apps/s (n = 4). (C) Representative blot with 6E10 (Long exposure was used to quantify βCTF, Short exposure was used to quantify APP) and anti-GAPDH on Apph/h and Appp/p female and male brain lysates. The blots used for quantitation are shown in Figure 7—figure supplement 1C and D. Total APP, βCTF and GAPDH were normalized against the average signal of the control Apph/h samples. Normalized βCTF (D) and APP (E) values for female, male and female + male samples. (F) Normalized βCTF/APP ratios for female, male and female + male samples. (G) Normalized βCTF/GAPDH ratios for female, male and female + male samples. (H) Normalized βCTF/Ponc (Ponceau stain) ratios for female, male and female + male samples. Overall the data indicate a reduction in βCTF in Appp/p rats. Data are represented as mean ± SEM. Statistical analyses are by unpaired student’s t-test (*p<0.05; **p<0.01; ***p<0.001; ****p<0.0001). Animals were analyzed at p28. We used 5 male and 5 female rats for each genotype.
-
Figure 7—source data 1
Related to Figure 7B,C,D,E,F,G,H.
- https://cdn.elifesciences.org/articles/52612/elife-52612-fig7-data1-v2.xlsx
Figure 7—figure supplement 1
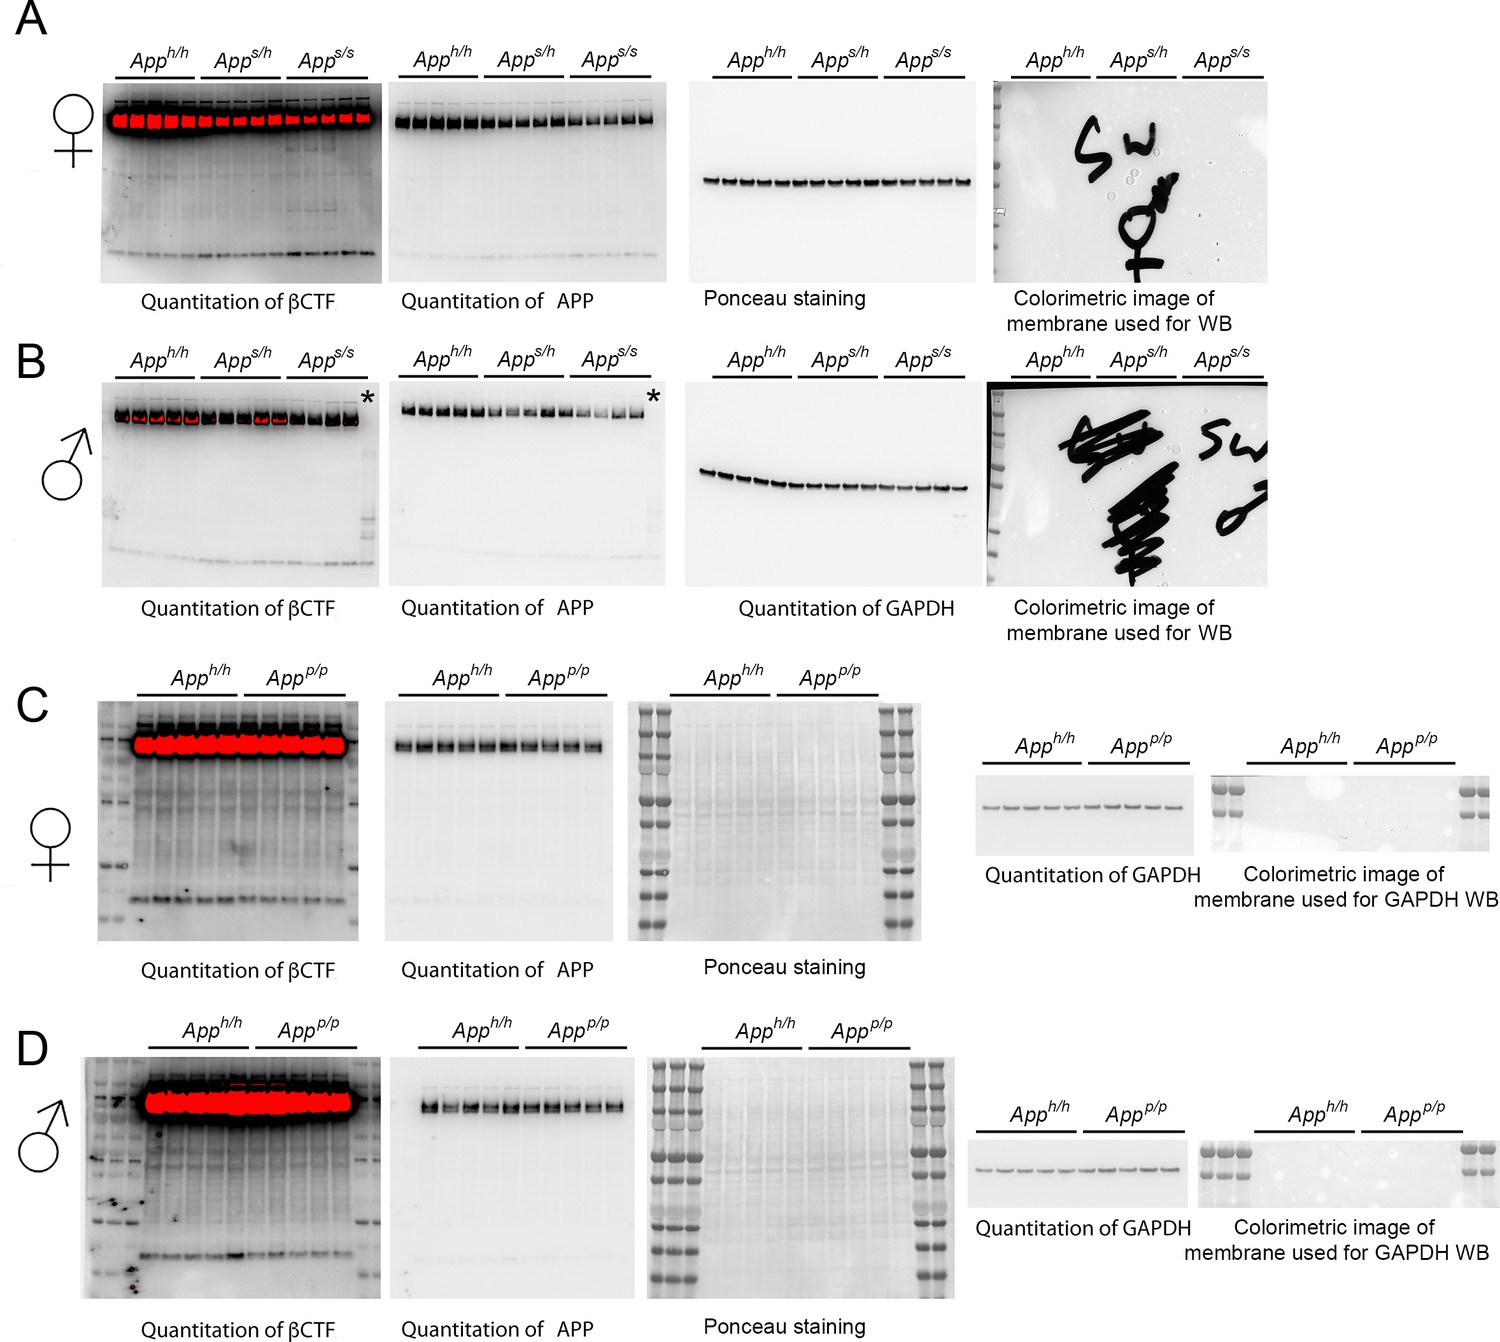
Western blots, ponceau stain and colorimetric images used for quantitation shown in Figure 7 for: (A) βCTF, APP and GAPDH in Apph/h, Apps/h and Apps/s females; (B) βCTF, APP and GAPDH in Apph/h, Apps/h and Apps/s males (as it is evident from the blots, one Apps/s sample was degraded and indicated with * and therefore that animal was excluded from any analysis); (C) βCTF, APP and GAPDH in Apph/h and Appp/p females; (B) βCTF, APP and GAPDH in Apph/h and Appp/p males.
Figure 8
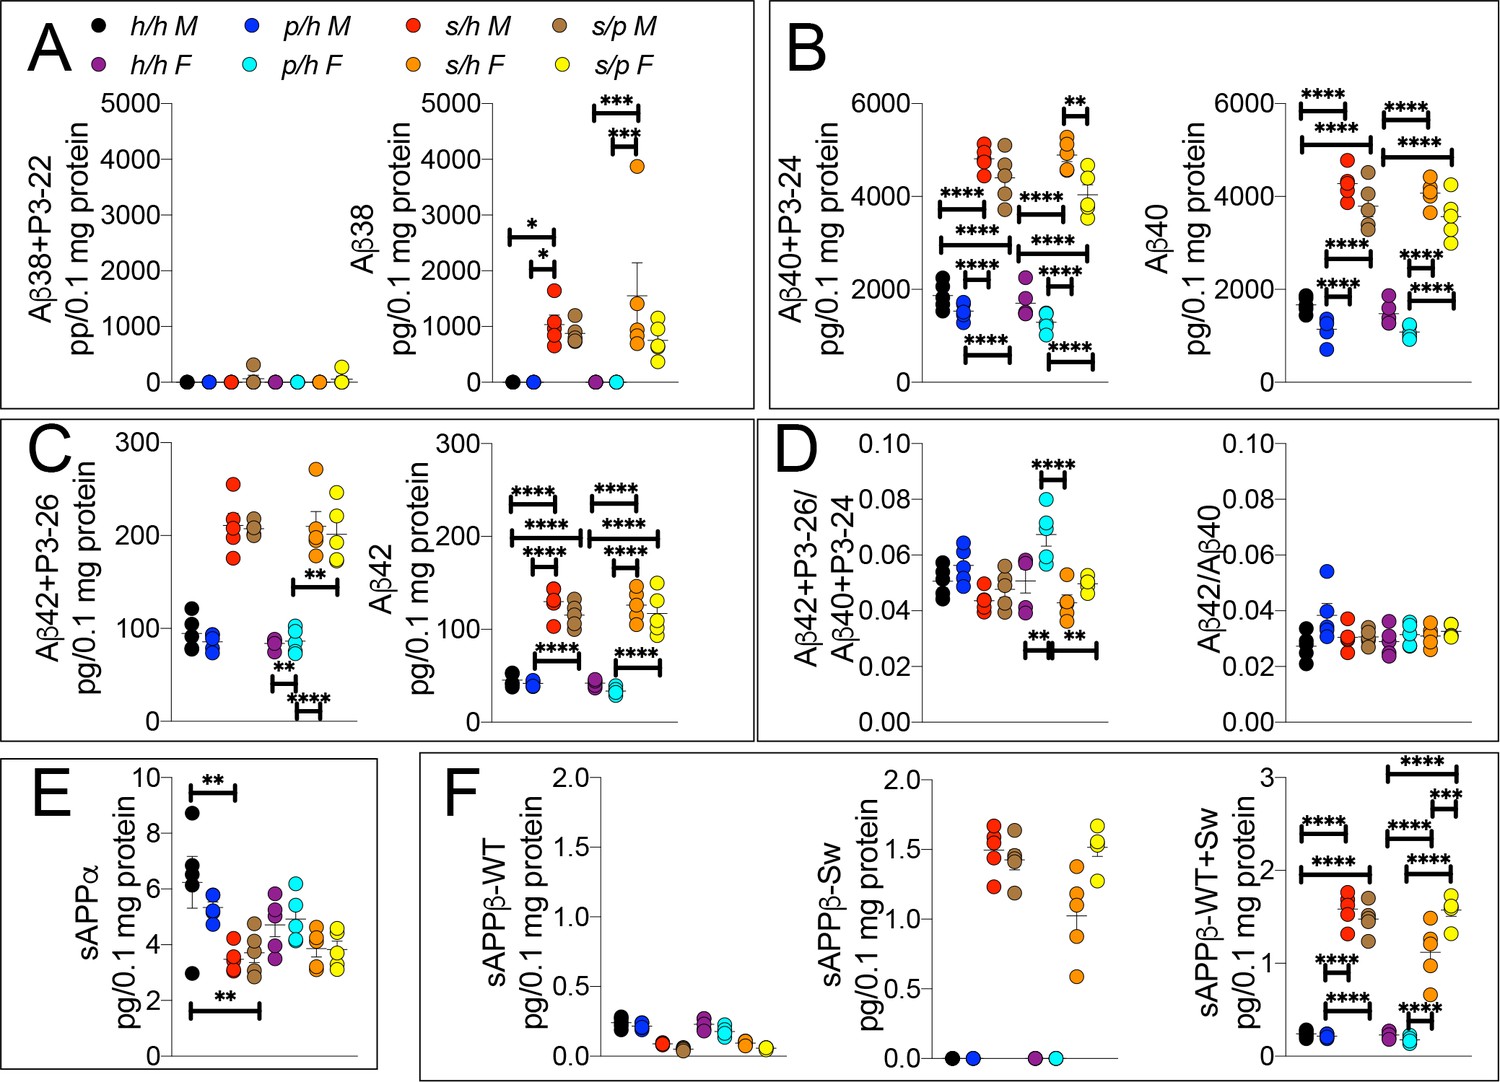
ELISA of APP metabolites in Apph/h, Apps/h, Appp/h, and Apps/p rats.
(A) ELISA of brain lysates for Aβ38 and P3-22 (left) and Aβ38 (right). (B) ELISA of brain lysates for Aβ40 and P3-24 (left) and Aβ40 (right). (C) ELISA of brain lysates for Aβ42 and P3-26 (left) and Aβ42 (right). (D) Aβ42+P3-26/Aβ40+P3-24 ratio and Aβ42/Aβ40 ratio. (E) ELISA of sAPPα (F) ELISA of sAPPβ-WT (left) sAPPβ-Sw (middle) and the calculated sum of both sAPPβ species (right). Data are represented as mean ± SEM. Data were analyzed by Ordinary one-way ANOVA followed by post-hoc Tukey's multiple comparisons test when ANOVA showed statistically significant differences. Animals were analyzed at p28. We used 5 male and 5 female rats for each genotype. To reduce complexity of the panels, in the graphs with both sexes only intra-sex differences are shown (*p<0.05; **p<0.01; ***p<0.001; ****p<0.0001).
-
Figure 8—source data 1
Related to Figure 8A,B,C,D,E,F.
- https://cdn.elifesciences.org/articles/52612/elife-52612-fig8-data1-v2.xlsx
Figure 9
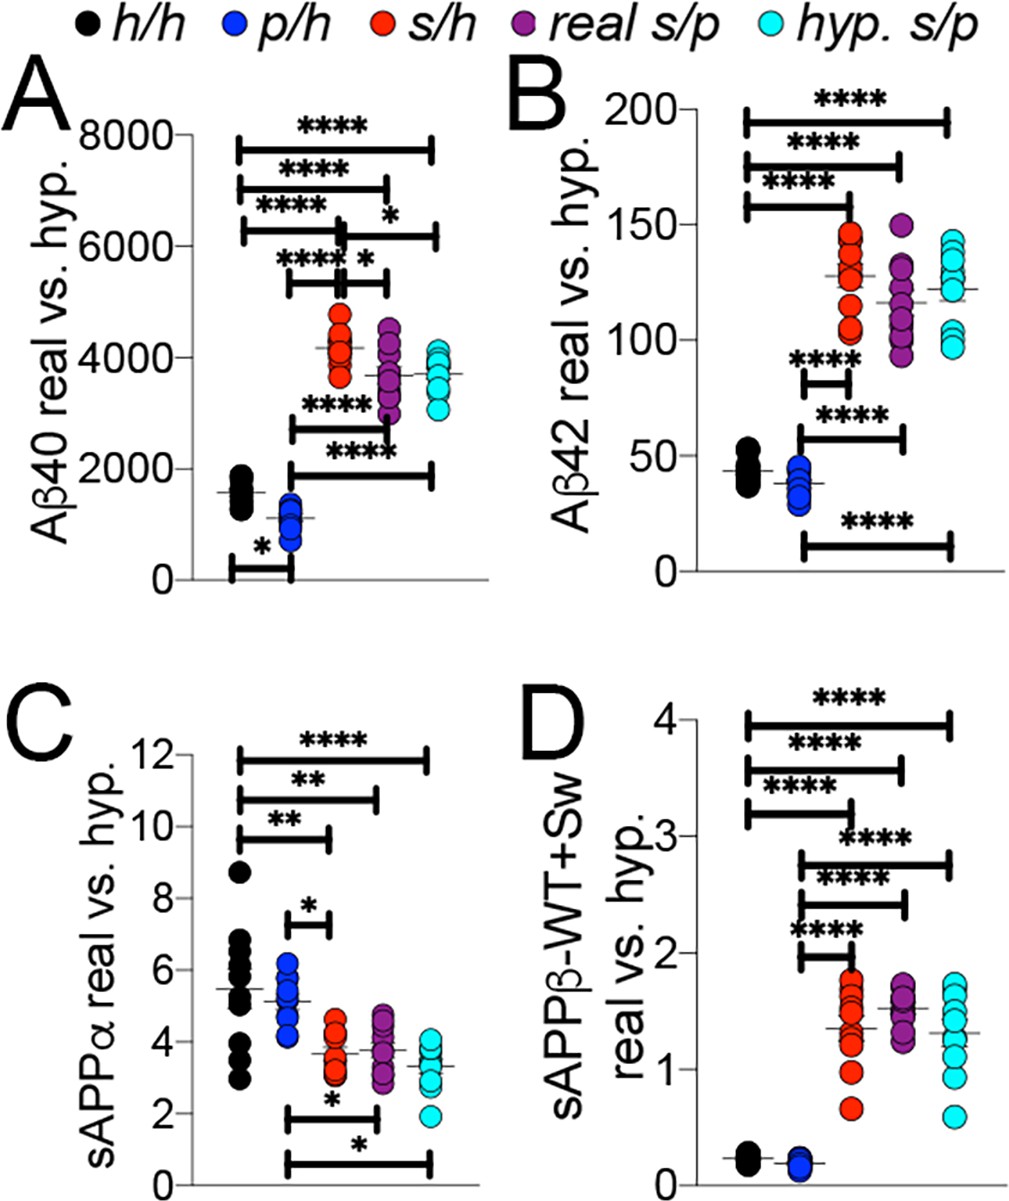
Comparison of empirical levels of APP metabolites in Apph/h, Apps/h, Appp/h, and Apps/p rats to calculated Apps/p levels.
ELISA values from Apph/h, Apps/h, and Appp/h rats in Figure 7 were used to generate a hypothetical value for Apps/p rats. One h allele value was calculated as half the value of Apph/h. This h allele value was subtracted from Apps/h and Appp/h values to generate the s and p allele values, respectively, which were then added together to represent a ‘hypothetical’ Apps/p rat. (A) Real and calculated ELISA Aβ40 levels. (B) Real and calculated ELISA Aβ42 levels. (C) Real and calculated ELISA sAPPα levels. (D) Real and calculated ELISA total sAPPβ levels. Data are represented as mean ± SEM. Data were analyzed by Ordinary one-way ANOVA followed by post-hoc Tukey's multiple comparisons test when ANOVA showed statistically significant differences (*p<0.05; **p<0.01; ***p<0.001; ****p<0.0001). Animals were analyzed at p28. We used 5 male and 5 female rats for each genotype.
-
Figure 9—source data 1
Related to Figure 9A,B,C,D.
- https://cdn.elifesciences.org/articles/52612/elife-52612-fig9-data1-v2.xlsx
Figure 10 with 1 supplement
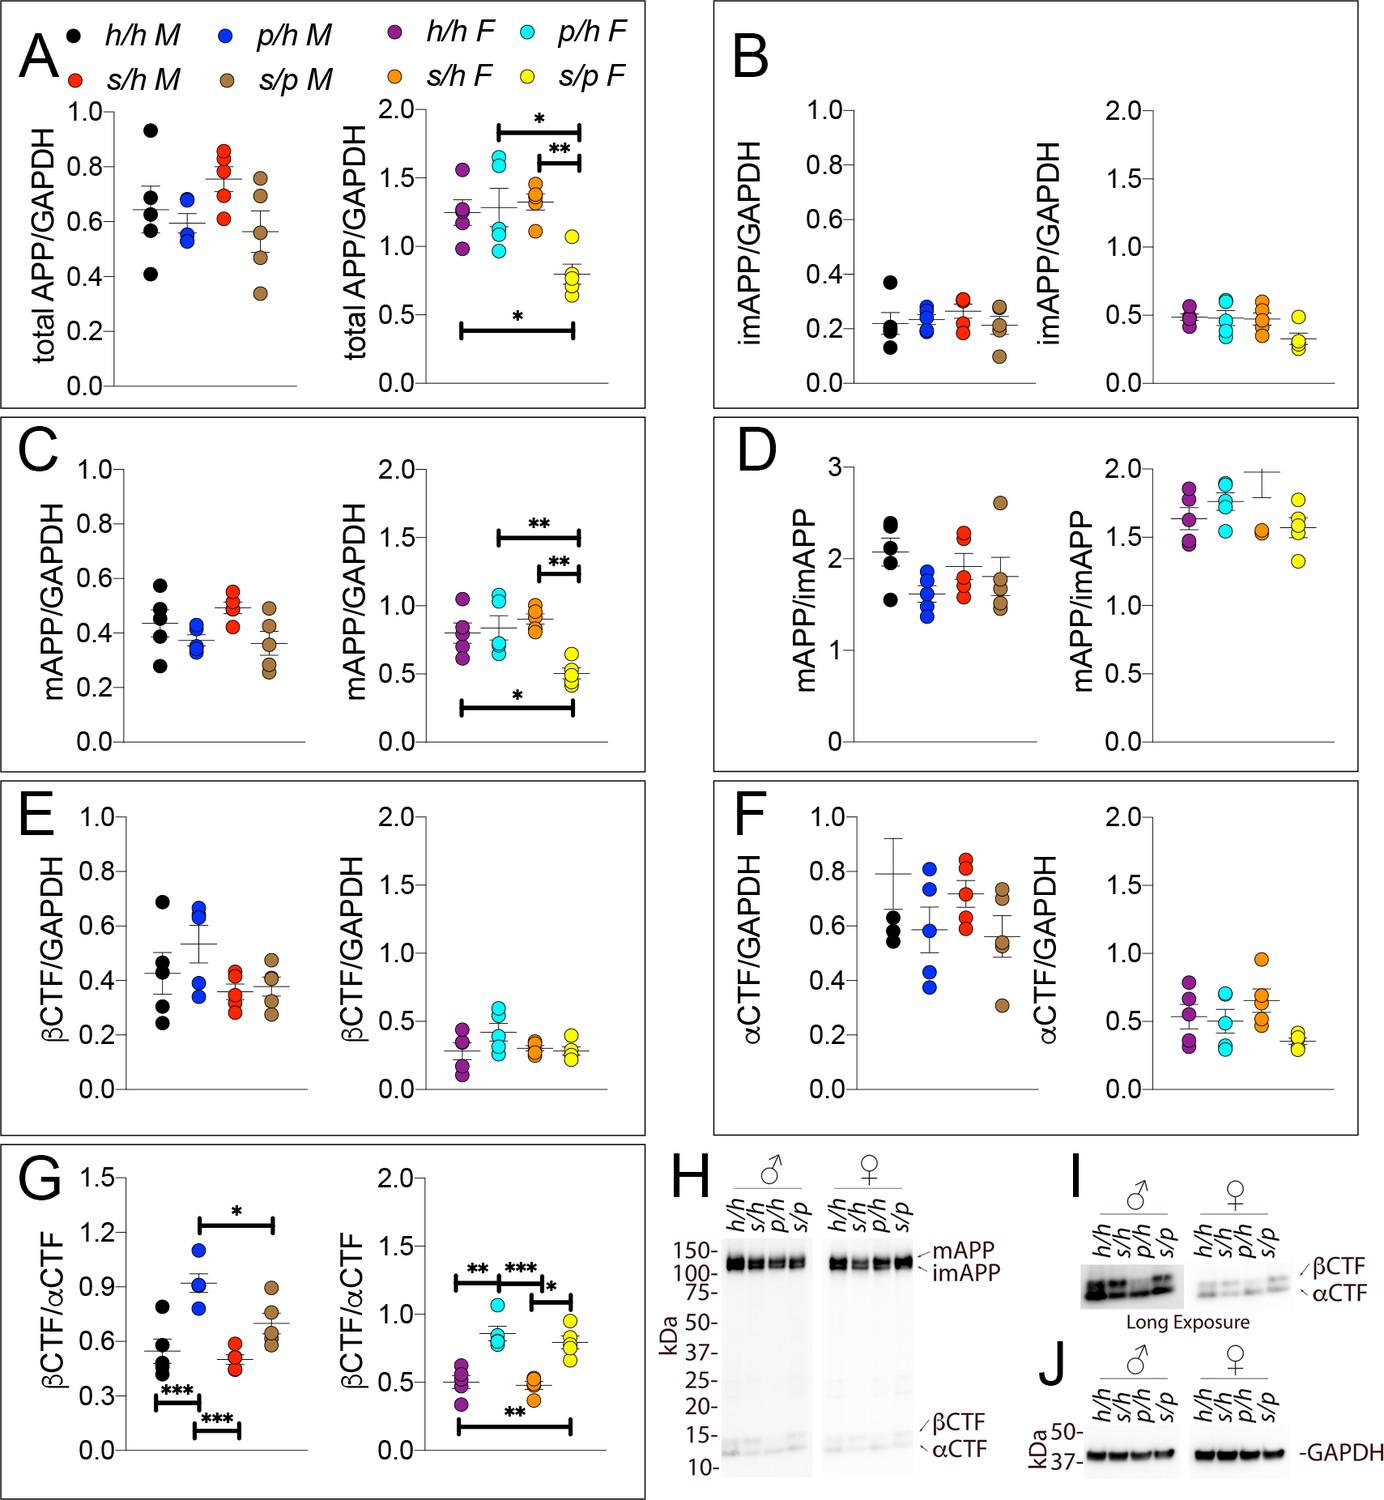
Western analysis of APP metabolites in Apph/h, Apps/h, Appp/h, and Apps/p rats.
Quantitation of WB analysis (A–G) with representative blots (H–J). (A) Normalized total APP levels in Apph/h, Apps/h, Appp/h, and Apps/p male (left) and female (right) rats. (B) Normalized imAPP levels in Apph/h, Apps/h, Appp/h, and Apps/p male (left) and female (right) rats. (C) Normalized mAPP levels Apph/h, Apps/h, Appp/h, and Apps/p male (left) and female (right) rats. (D) Ratio of mAPP:imAPP in Apph/h, Apps/h, Appp/h, and Apps/p rats. (E) Normalized βCTF levels in Apph/h, Apps/h, Appp/h, and Apps/p male (left) and female (right) rats. (F) Normalized αCTF levels in Apph/h, Apps/h, Appp/h, and Apps/p male (left) and female (right) rats. (G) Ratio of βCTF: αCTF. (H) Representative blot against C-terminus of APP (I) Longer exposure of α-APP-C-terminus blot to detect αCTF and βCTFs. (J) Anti-GAPDH loading control. Data are represented as mean ± SEM. Data were analyzed by Ordinary one-way ANOVA followed by post-hoc Tukey's multiple comparisons test when ANOVA showed statistically significant differences (*p<0.05; **p<0.01; ***p<0.001). Animals were analyzed at p28. We used 5 male and 5 female rats for each genotype.
-
Figure 10—source data 1
Related to Figure 10A,B,C,D,E,F,G.
- https://cdn.elifesciences.org/articles/52612/elife-52612-fig10-data1-v2.xlsx
Figure 10—figure supplement 1
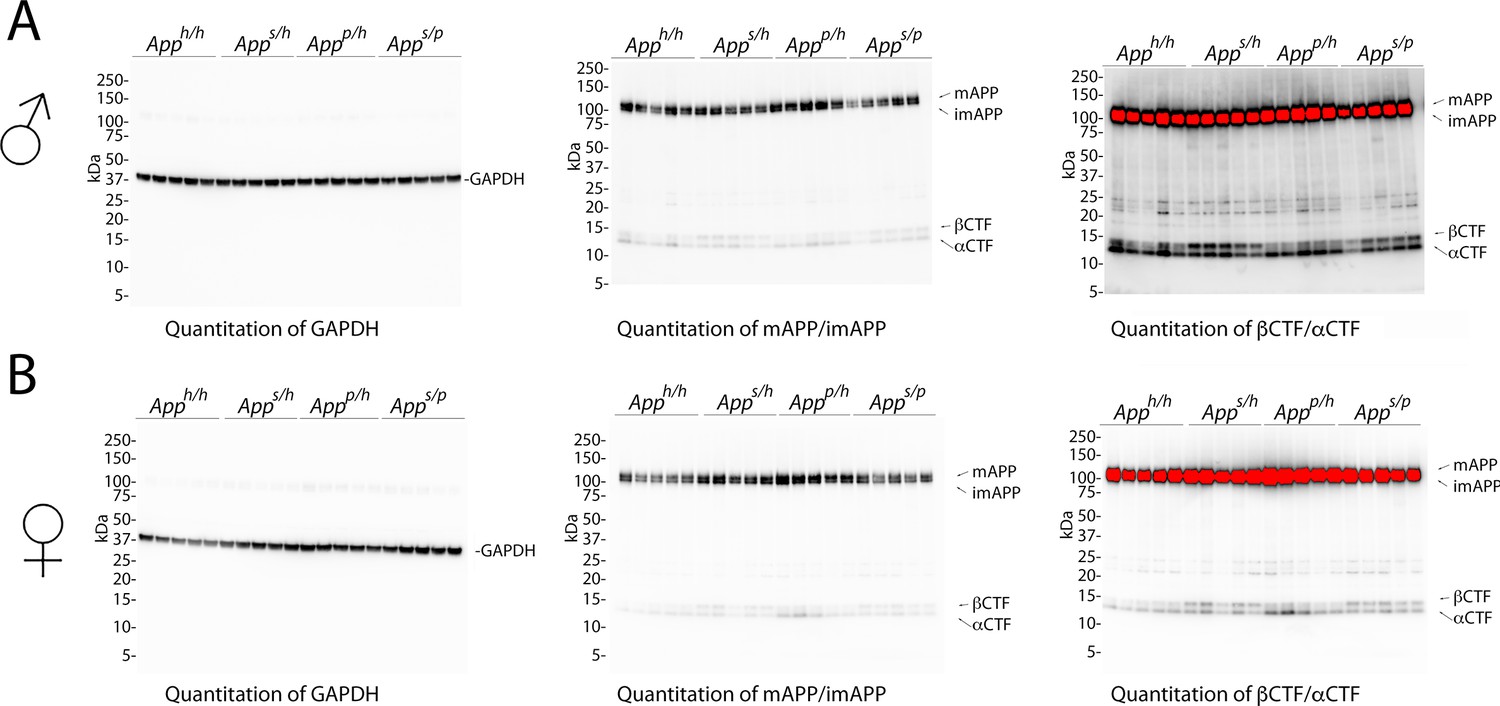
Western blots images used for quantitation shown in Figure 10.
(A) Blots used to quantify GAPDH (left), mAPP and imAPP (center), αCTF and βCTF (right) in males. (B) Blots used to quantify GAPDH (left), mAPP and imAPP (center), αCTF and βCTF (right) in females.
Tables
Key resources table
| Reagent type (species) or resource | Designation | Source or reference | Identifiers | Additional information |
|---|---|---|---|---|
| Gene App (Rattus norvegicus) | App, Amyloid beta (A4) precursor protein | http://mar2016.archive.ensembl.org/Rattus_norvegicus/Gene/Summary?g=ENSRNOG00000006997;r=11:24425005-24641858 | Location: Chromosome 11: 24,425,005–24,641,858 | Mutations were inserted into Exon 16 |
| Genetic reagent (Rattus norvegicus) | Apph | (Tambini et al., 2019) | Rat App allele with humanize Aβ region | |
| Genetic reagent (Rattus norvegicus) | Apps | (Tambini et al., 2019) | Rat App allele with humanize Aβ region and pathogenic Swedish mutations | |
| Genetic reagent (Rattus norvegicus) | Appp | This paper | Rat App allele with humanize Aβ region and protective Icelandic mutation | |
| Recombinant DNA reagent | gRNA1 targeting vector | This paper: http://www.vectorbuilder.com/design/report/733e7a50-b705-45cf-8f8c-8b8206e6f174 | Vector expressing gRNA1 | |
| Recombinant DNA reagent | gRNA2 targeting vector | This paper http://www.vectorbuilder.com/design/report/2a73df2c-1d5c-4e69-b43a-ee6cfaea80c6 | Vector expressing gRNA1 | |
| Antibody | Y188 anti APP-C terminus (Rabbit polyclonal) | Abcam Cat# ab32136 | RRID:AB_2289606 | WB (1:1000) |
| Antibody | 6E10 anti human APP-Aβ1-16, (Mouse monoclonal) | BioLegend Cat# 803001 | RRID:AB_2564653 | WB (1:1000) |
| Antibody | M3.2 anti rodent APP-Aβ1-16, (Mouse monoclonal) | Biolegend Cat#: 805701 | RRID:AB_2564982 | WB (1:1000) |
| Antibody | Anti-sAPPα C-terminus, (Mouse monoclonal) | IBL Cat# 2B3 | WB (1:1000) | |
| Antibody | Anti-human sAPPβ WT C-terminus (Rabbit polyclonal) | Covance Cat# SIG-39138 | RRID:AB_662870 | WB (1:1000) |
| Antibody | Anti-human sAPPβ Sw C-terminus (Mouse monoclonal) | IBL Cat#: 6A1 | WB (1:1000) | |
| Antibody | Anti-GAPDH (Rabbit polyclonal) | Abcam Cat# ab32136 | RRID:AB_2289606 | WB (1:1000) |
| Antibody | HRP-Anti-mouse antibodies | Southern Biotech Cat#: 1031–05 | RRID:AB_2794307 | WB (1:1000) |
| Antibody | HRP-Anti-rabbit antibodies | Southern Biotech Cat# 4050–05 | RRID:AB_2795955 | WB (1:1000) |
| Antibody | HRP-Anti-rabbit antibodies | Cell Signaling Cat# 7074 | RRID:AB_2099233 | WB (1:1000) |
| Commercial assay or kit | West Dura ECL | Thermo | Cat# PI34076 | |
| Commercial assay or kit | Human β Amyloid (1-42) ELISA Kit – High Sensitive | Wako | ||
| Commercial assay or kit | Human β Amyloid (1-40) ELISA Kit II | Wako | ||
| Commercial assay or kit | V-PLEX Plus Aβ Peptide Panel 1 | Meso Scale Discovery | Cat# K15200G | |
| Commercial assay or kit | V-PLEX Plus Aβ Peptide Panel 1 4G8 | Meso Scale Discovery | Cat# K15199G | |
| Commercial assay or kit | sAPPβ-Sw Elisa), | Meso Scale Discovery | Cat# K151BUE | |
| Commercial assay or kit | WT sAPPα/sAPPβ | Meso Scale Discovery | Cat# K15120E | |
| Other | ChemiDoc MP Imaging System | Biorad | ||
| Instrument/software, algorithm | MESO QuickPlex SQ 120 | Meso Scale Discovery | ||
| Other | xMark Spectrophotometer | Biorad | ||
| Instrument/software, algorithm | Image Lab software | Biorad | RRID:SCR_014210 | |
| Instrument/software, algorithm | GraphPad Prism | RRID:SCR_002798 |
Additional files
-
Supplementary file 1
Generation of App KI rats.
- https://cdn.elifesciences.org/articles/52612/elife-52612-supp1-v2.docx
-
Transparent reporting form
- https://cdn.elifesciences.org/articles/52612/elife-52612-transrepform-v2.docx
Download links
A two-part list of links to download the article, or parts of the article, in various formats.
Downloads (link to download the article as PDF)
Open citations (links to open the citations from this article in various online reference manager services)
Cite this article (links to download the citations from this article in formats compatible with various reference manager tools)
Opposite changes in APP processing and human Aβ levels in rats carrying either a protective or a pathogenic APP mutation
eLife 9:e52612.
https://doi.org/10.7554/eLife.52612


