Cell-type diversity and regionalized gene expression in the planarian intestine
- Genes and Human Disease Research Program, Oklahoma Medical Research Foundation, United States
- Howard Hughes Medical Institute, Department of Cell and Developmental Biology, University of Illinois at Urbana-Champaign, United States
Figures
Figure 1 with 2 supplements
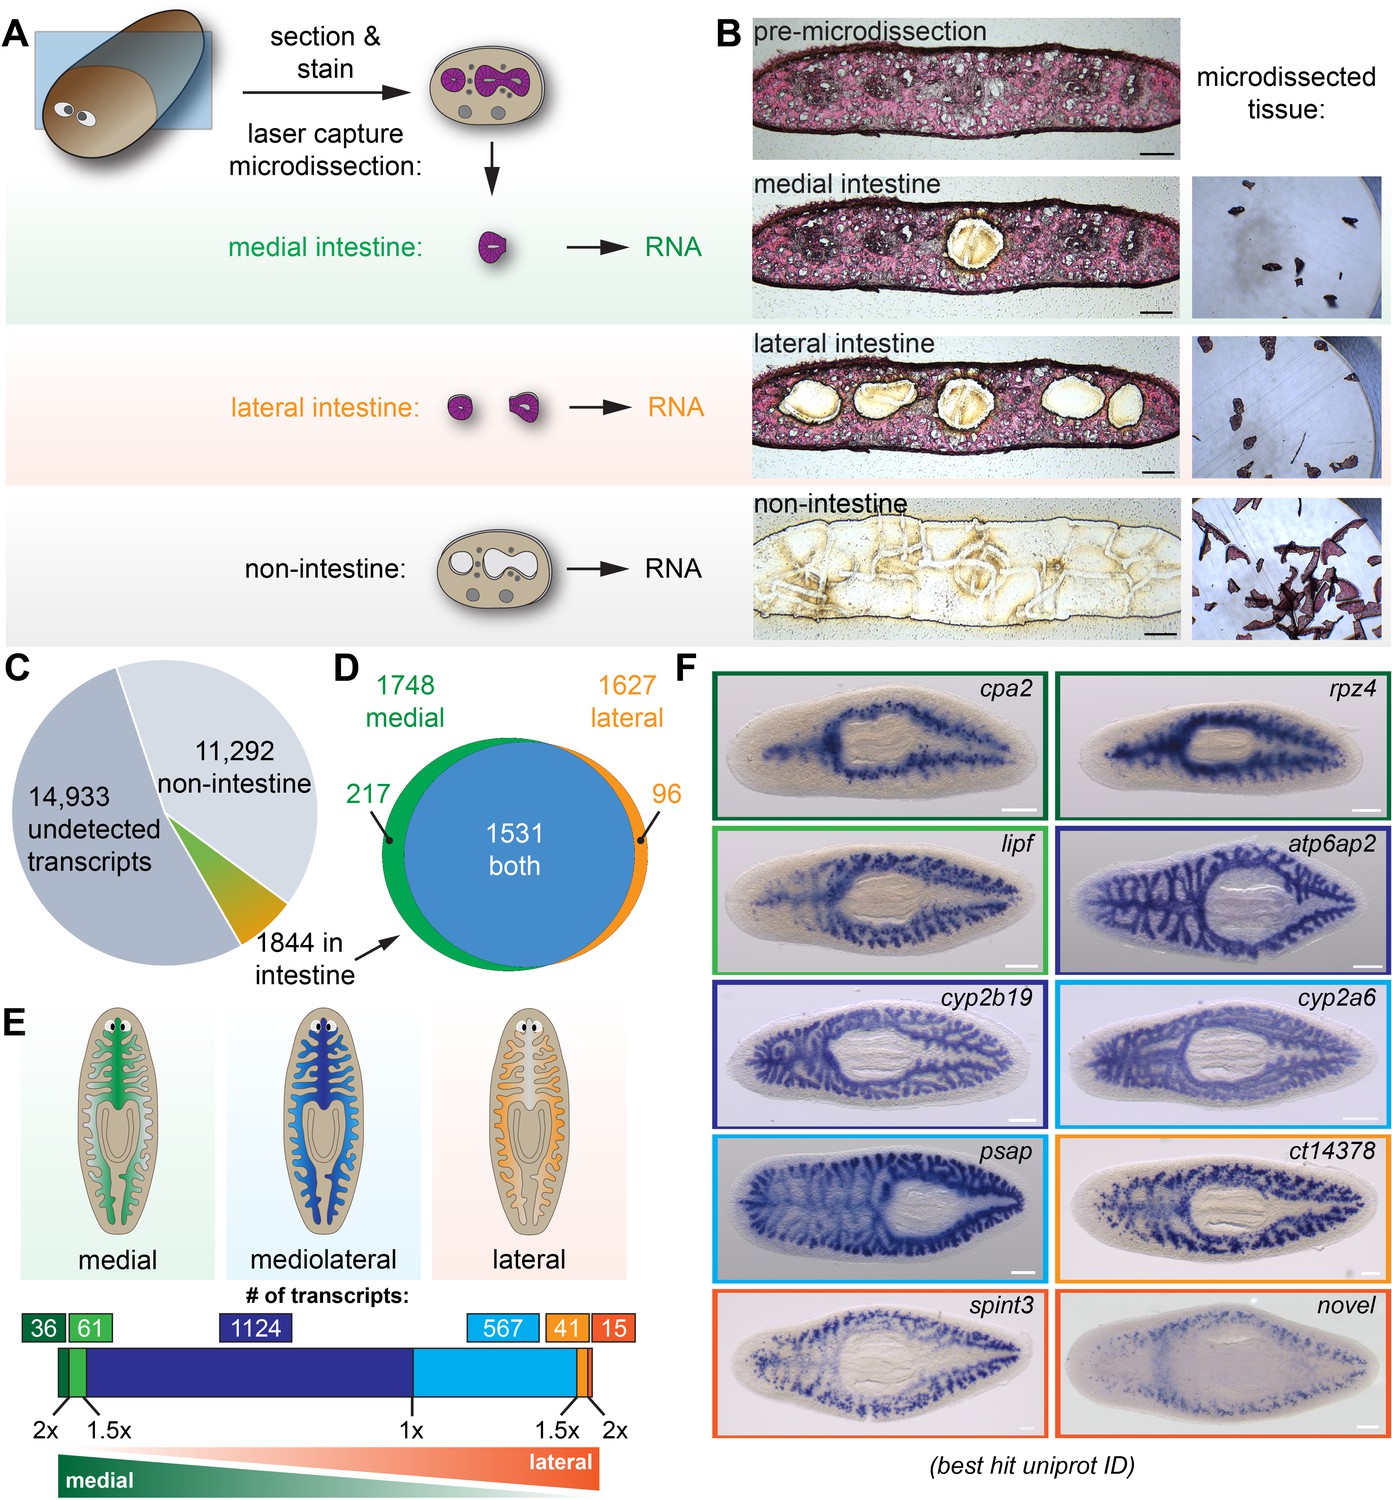
Laser-capture microdissection coupled with RNA-Seq identifies 1844 intestine-enriched transcripts.
(A) Schematic of microdissection workflow. Planarians were fixed and cryosectioned, then sections were stained with Eosin Y. Medial intestine, lateral intestine, and non-intestine tissue were then laser captured, followed by RNA extraction and RNA-Seq. (B) Images of an eosin-stained section as tissue is progressively removed (left) and captured (right), yielding three samples with medial intestine, lateral intestine, and non-intestinal tissue. (C) Pie chart of RNA-Seq results: of 28,069 total transcripts, 13,136 were detected. Of these, 1844 were upregulated significantly in either medial or lateral intestine. (D) Venn diagram showing overlap of medially and laterally enriched intestinal transcripts. (E) Schematic of the number of transcripts with enrichment in medial or lateral intestine, expressed as a ratio of Fold Changes (FC) in each region. Dark green, FC-medial/FC-lateral > 2 x. Green, FC-medial/FC-lateral = 1.5x-2x. Dark blue, FC-medial/FC-lateral = 1x-1.5x. Blue, FC-lateral/FC-medial = 1x-1.5x. Orange, FC-lateral/FC-medial = 1.5x-2x. Dark orange, FC-lateral/FC-medial > 2 x. (F) Examples of transcripts expressed in the intestine (WISH) in medial (top), mediolateral (middle), and lateral (bottom) regions. Color outlines correspond to the color bar in panel F. Detailed numerical data and gene ID information are available in Supplementary file 1 and in Results. Scale bars, 100 μm (B), 200 μm (F).
Figure 1—figure supplement 1
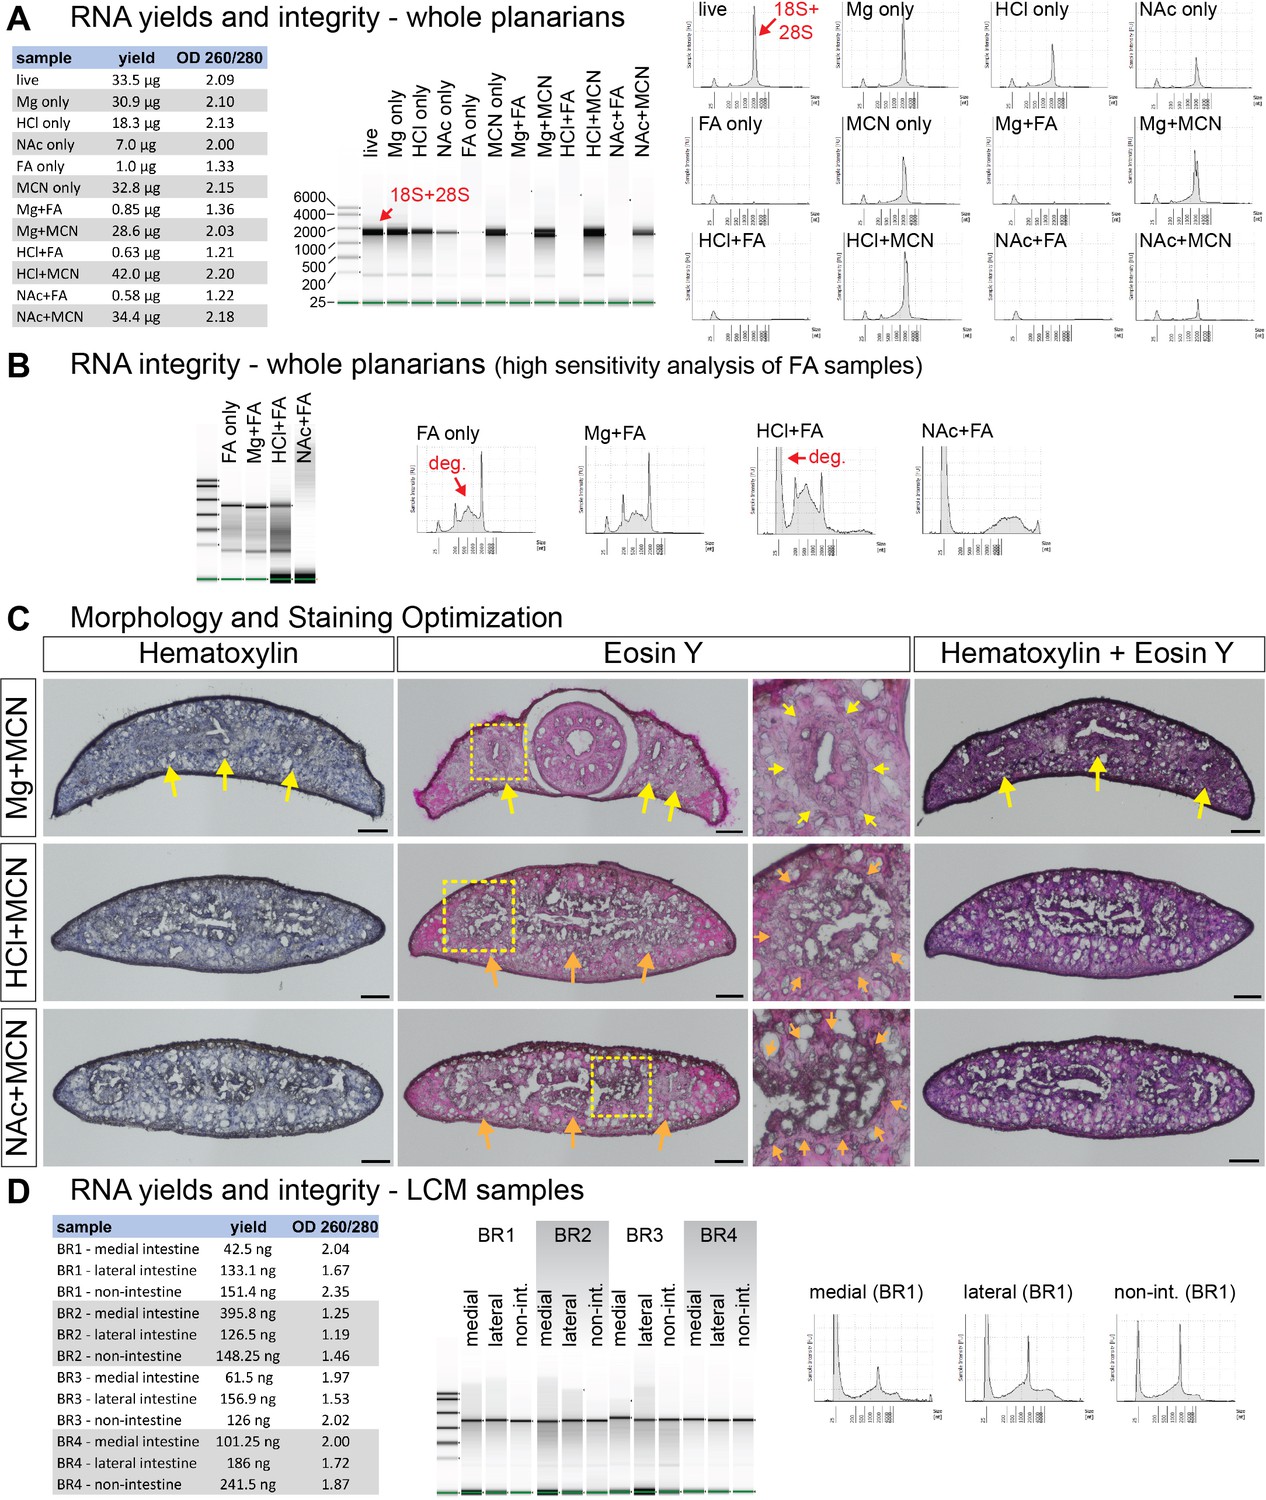
Optimization of fixation and histological staining for laser microdissection.
(A) RNA yields (left table) and Bioanalyzer/TapeStation analysis of RNA integrity (right panels) from whole planarian samples (15 planarians,~20–25 mg total tissue) treated as shown. As in some other invertebrates (Ishikawa, 1977; Matz, 2002; Winnebeck et al., 2010; Asai et al., 2015), heat denaturation prior to analysis causes 28S rRNA to co-migrate as two bands with 18S rRNA (indicated with red arrows). Samples are representative of at least three independent replicates. RNA from FA-fixed samples had low yields and low 260/280 ratios. (B) Analysis of degraded RNA from FA-fixed samples using high-sensitivity (HS) TapeStation kit (for low concentration samples). Degradation of rRNA is indicated with red arrows. (C) Hematoxylin and Eosin Y labeling of transverse (cross) cryosections from methacarn-fixed planarians. Yellow arrows indicate intestine labeling in magnesium-treated samples. Orange arrows indicate compromised intestinal morphology in HCl- and NAc-treated samples. Boxed regions for Eosin Y-labeled sections are magnified to the right. (D) RNA yields (left table) and HS TapeStation analysis of RNA integrity (right panels) for all LCM samples used in this study (BR, biological replicates, 16–20 tissue sections per replicate). TapeStation lanes (middle panel) were assembled from multiple runs. Intensity plots (right panel) for BR1 are representative of other replicates. Mg, MgCl2 treatment. HCl, 2% HCl treatment. NAc, 7.5% N-Acetyl-L-Cysteine treatment. FA, 4% formaldehyde fixation. MCN, methacarn fixation. Scale bars: 100 μm (C).
Figure 1—figure supplement 2
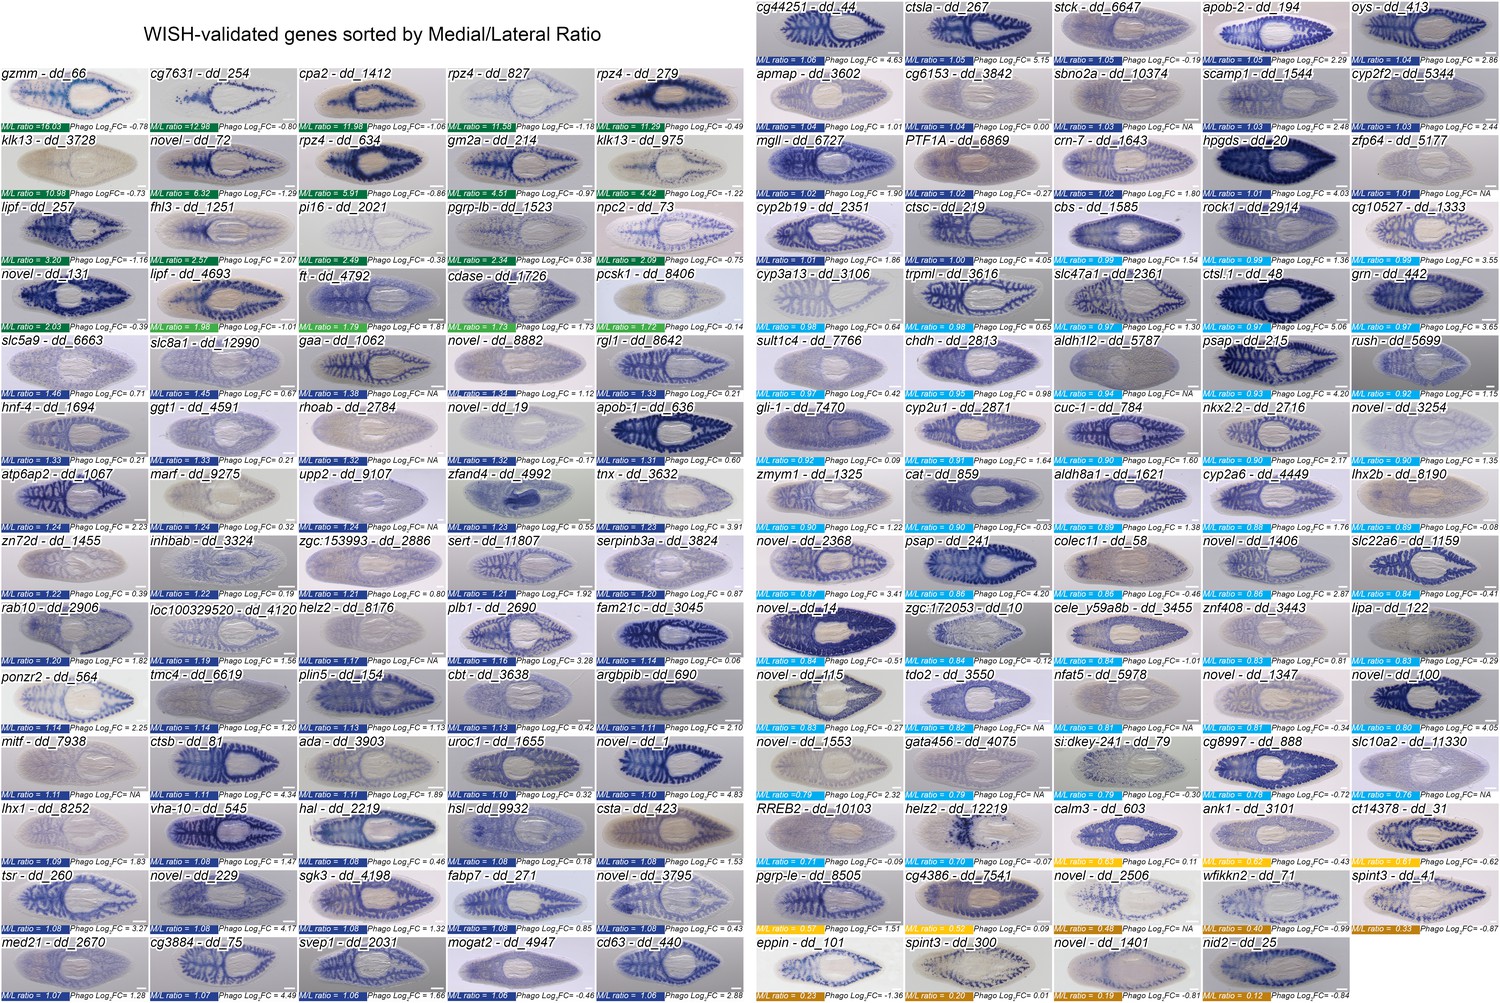
Expression of transcripts enriched in laser-captured intestinal tissue.
Whole-mount in situ hybridizations performed during this study, organized by mediolateral ratio. 144/162 total in situs conducted are shown (18 omissions were due to very low or no detectable expression; helz2/dd_12219 was detected only in peripharyngeal cells). Each image also shows the phagocyte enrichment value (Log2FC), as well as the Uniprot best hit ID and the Dresden v6 Transcriptome GeneID (dd_Smed_v6). Several transcripts are named to be consistent with previous publications (hnf-4/dd_1694, PTF1A/dd_6869, gli-1/dd_7470, slc22a6/dd_1159), with human Uniprot IDs used in our comparison to the Human Protein Atlas (sult1c4/dd_7766, tdo2/dd_3550), or to distinguish paralogs (apob-1/dd_636, apob-2/dd_194). Detailed gene ID information is available in Supplementary file 1. Scale bars, 200 μm.
Figure 2 with 1 supplement
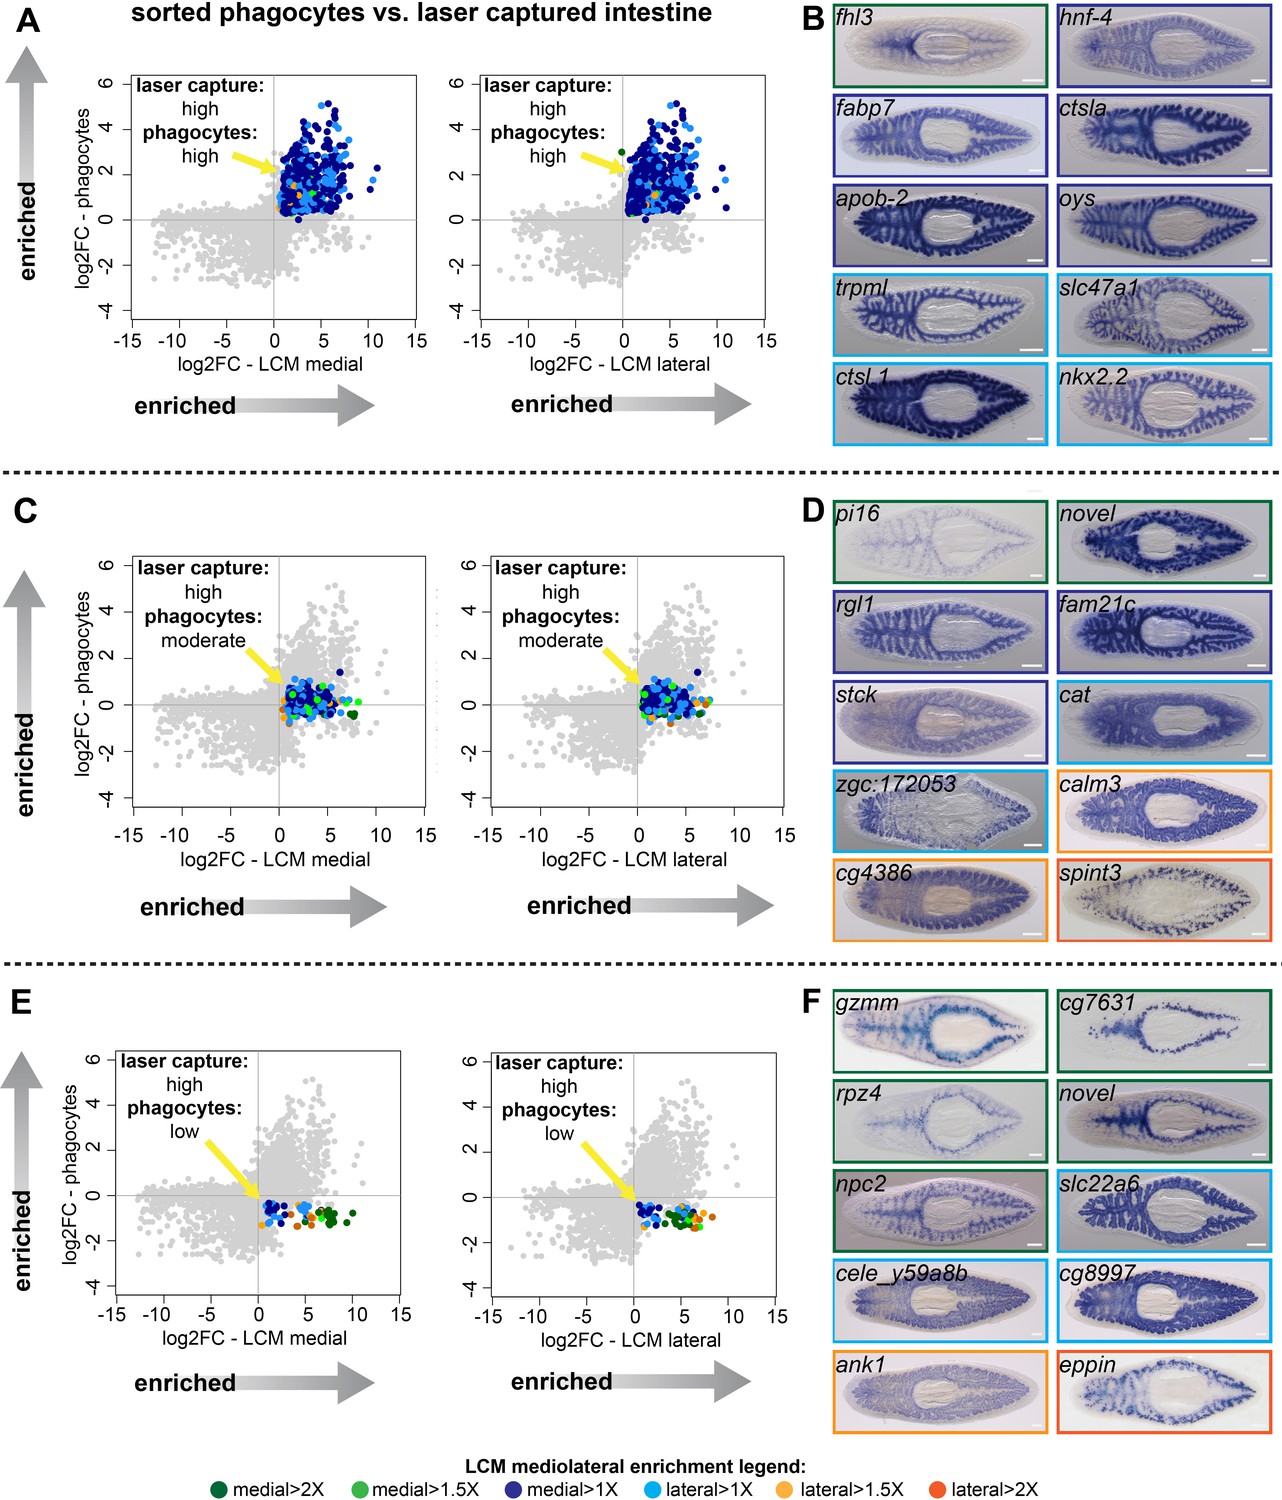
Identification of transcripts enriched in specific intestine cell types and regions.
(A) Log2 fold-changes for laser-microdissected medial (left) and lateral (right) intestinal tissue (relative to non-intestinal tissue) are plotted on the x-axis, while log2 fold-changes for sorted/purified intestinal phagocytes (compared to all other cell types) are plotted on the y-axis. Transcripts in the upper right quadrant (colorized according to the legend in Figure 1 and at the bottom of this figure) are expressed preferentially in laser-captured intestine (fold-change >2, FDR-adjusted p value<0.01) and preferentially in sorted phagocytes (fold-change >2, FDR-adjusted p value<0.05) (phagocytes: ‘high’). Most of these transcripts are not medially or laterally enriched in LCM transcriptomes. (B) Whole-mount in situ hybridizations on uninjured planarians showing examples of expression patterns for transcripts in (A). Borders are colorized according to the mediolateral legend in Figure 1 and at the bottom of the figure. Expression patterns are mostly uniform and ubiquitous in the intestine, consistent with phagocyte-specific expression, with the exception of fhl3 (top left), which is medially enriched. (C) Plots as in (A), but with colorized transcripts expressed preferentially in laser-captured intestine, but not significantly up- or down-regulated in sorted phagocytes (FDR-adjusted p value>0.05) (phagocytes: ‘moderate’). Some of these transcripts are medially or laterally enriched in LCM transcriptomes. (D) Examples of gene expression for transcripts in (C). A variety of intestine expression patterns is observed. (E) Plots as in (A), with transcripts in the lower right quadrant enriched in laser-microdissected intestine, but significantly downregulated (fold-change <2, FDR-adjusted p value<0.05) in sorted phagocytes relative to non-phagocytes (phagocytes: ‘low’). Many of these transcripts are enriched in medial or lateral LCM transcriptomes. (F) Examples of gene expression patterns for transcripts in (E). A majority of these transcripts are enriched in goblet or basal cells, sometimes in medial or lateral subpopulations. Detailed gene ID information and numerical data are available in Supplementary file 1, Figure 2—source data 1, and in Results. Scale bars, 200 μm.
-
Figure 2—source data 1
Comparison of transcripts enriched in laser-captured intestine and sorted intestinal phagocytes.
(F2SD1-A) RNA-Seq data (LCM) vs. phagocyte expression (sorted phagocytes) for 1317 intestine-enriched transcripts (LCM) represented in phagocyte expression profile. (F2SD1-B) RNA-Seq data (LCM) vs. phagocyte expression (sorted phagocytes) for 900 transcripts with high phagocyte expression. (F2SD1-C) RNA-Seq data (LCM) vs. phagocyte expression (sorted phagocytes) for 358 transcripts with moderate phagocyte expression. (F2SD1-D) RNA-Seq data (LCM) vs. phagocyte expression (sorted phagocytes) for 59 transcripts with low phagocyte expression. (F2SD1-E) Mapping of dd_Smed_v6 transcripts to Contig/EST sequences from Zayas et al. (2005).
- https://cdn.elifesciences.org/articles/52613/elife-52613-fig2-data1-v1.xlsx
Figure 2—figure supplement 1
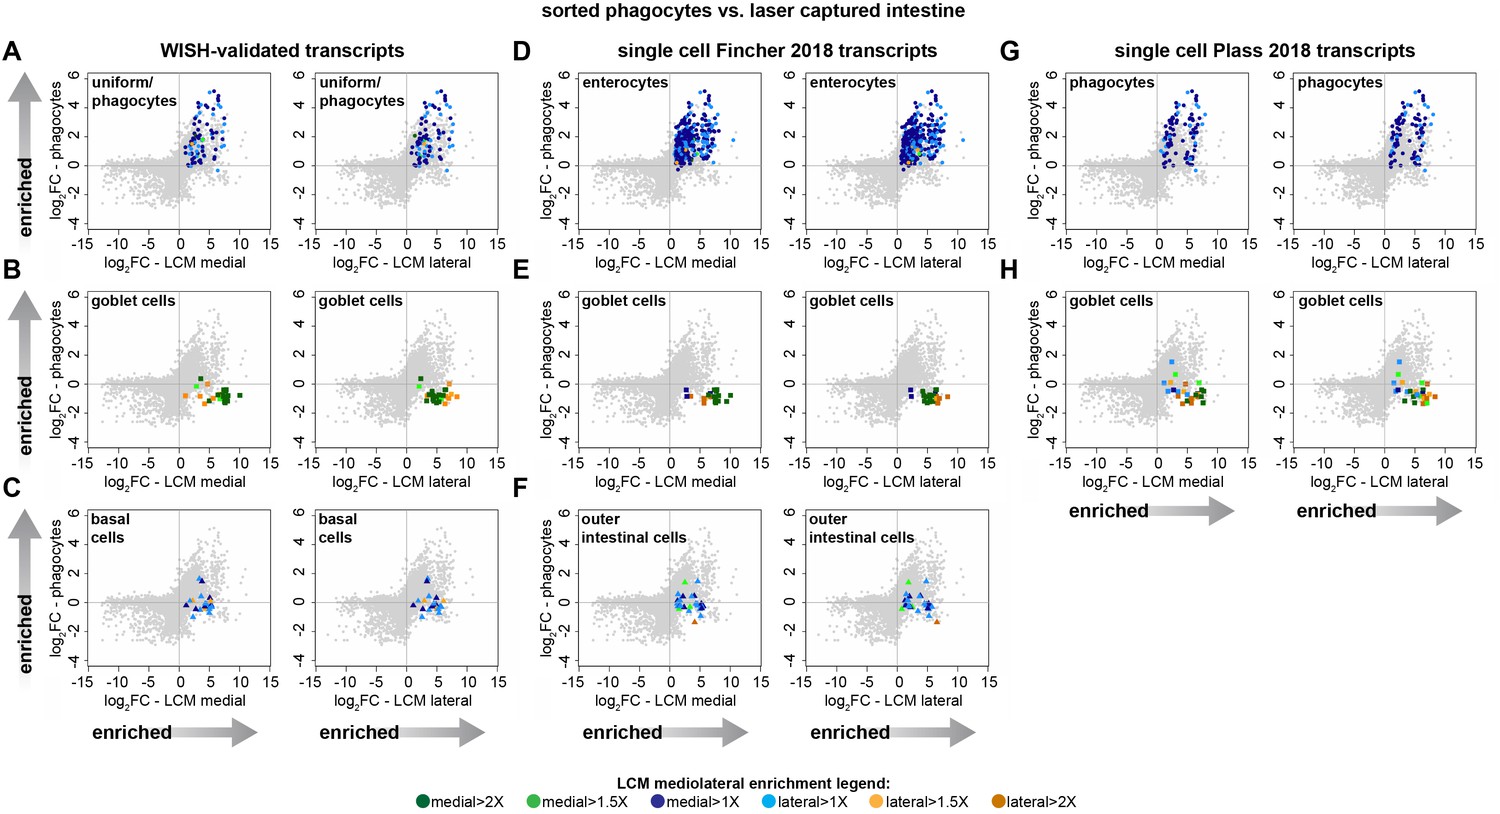
Validation of cell-type specific mRNA expression by WISH and correlation with single-cell analysis.
(A–C) Transcripts with WISH patterns indicating enrichment in phagocytes (A), goblet-like cells (B), or basal cells (C), mapped onto plots of phagocyte (y-axis) vs. LCM medial/lateral (x-axis) fold-change expression (log2FC). (D–F) Transcripts found to be highly enriched in phagocytes (‘enterocytes’) (D), goblet cells (E), or basal cells (‘outer intestinal cells’) in Fincher et al. (2018), mapped onto phagocyte vs. LCM intestine expression plots. (G–H) Transcripts found to be highly enriched in phagocytes (G) or goblet cells (H) in Plass et al. (2018), mapped onto phagocyte vs. LCM intestine expression plots (basal cells were not described). Detailed numerical data are available in Supplementary file 1 and Figure 2—source data 1.
Figure 3 with 1 supplement
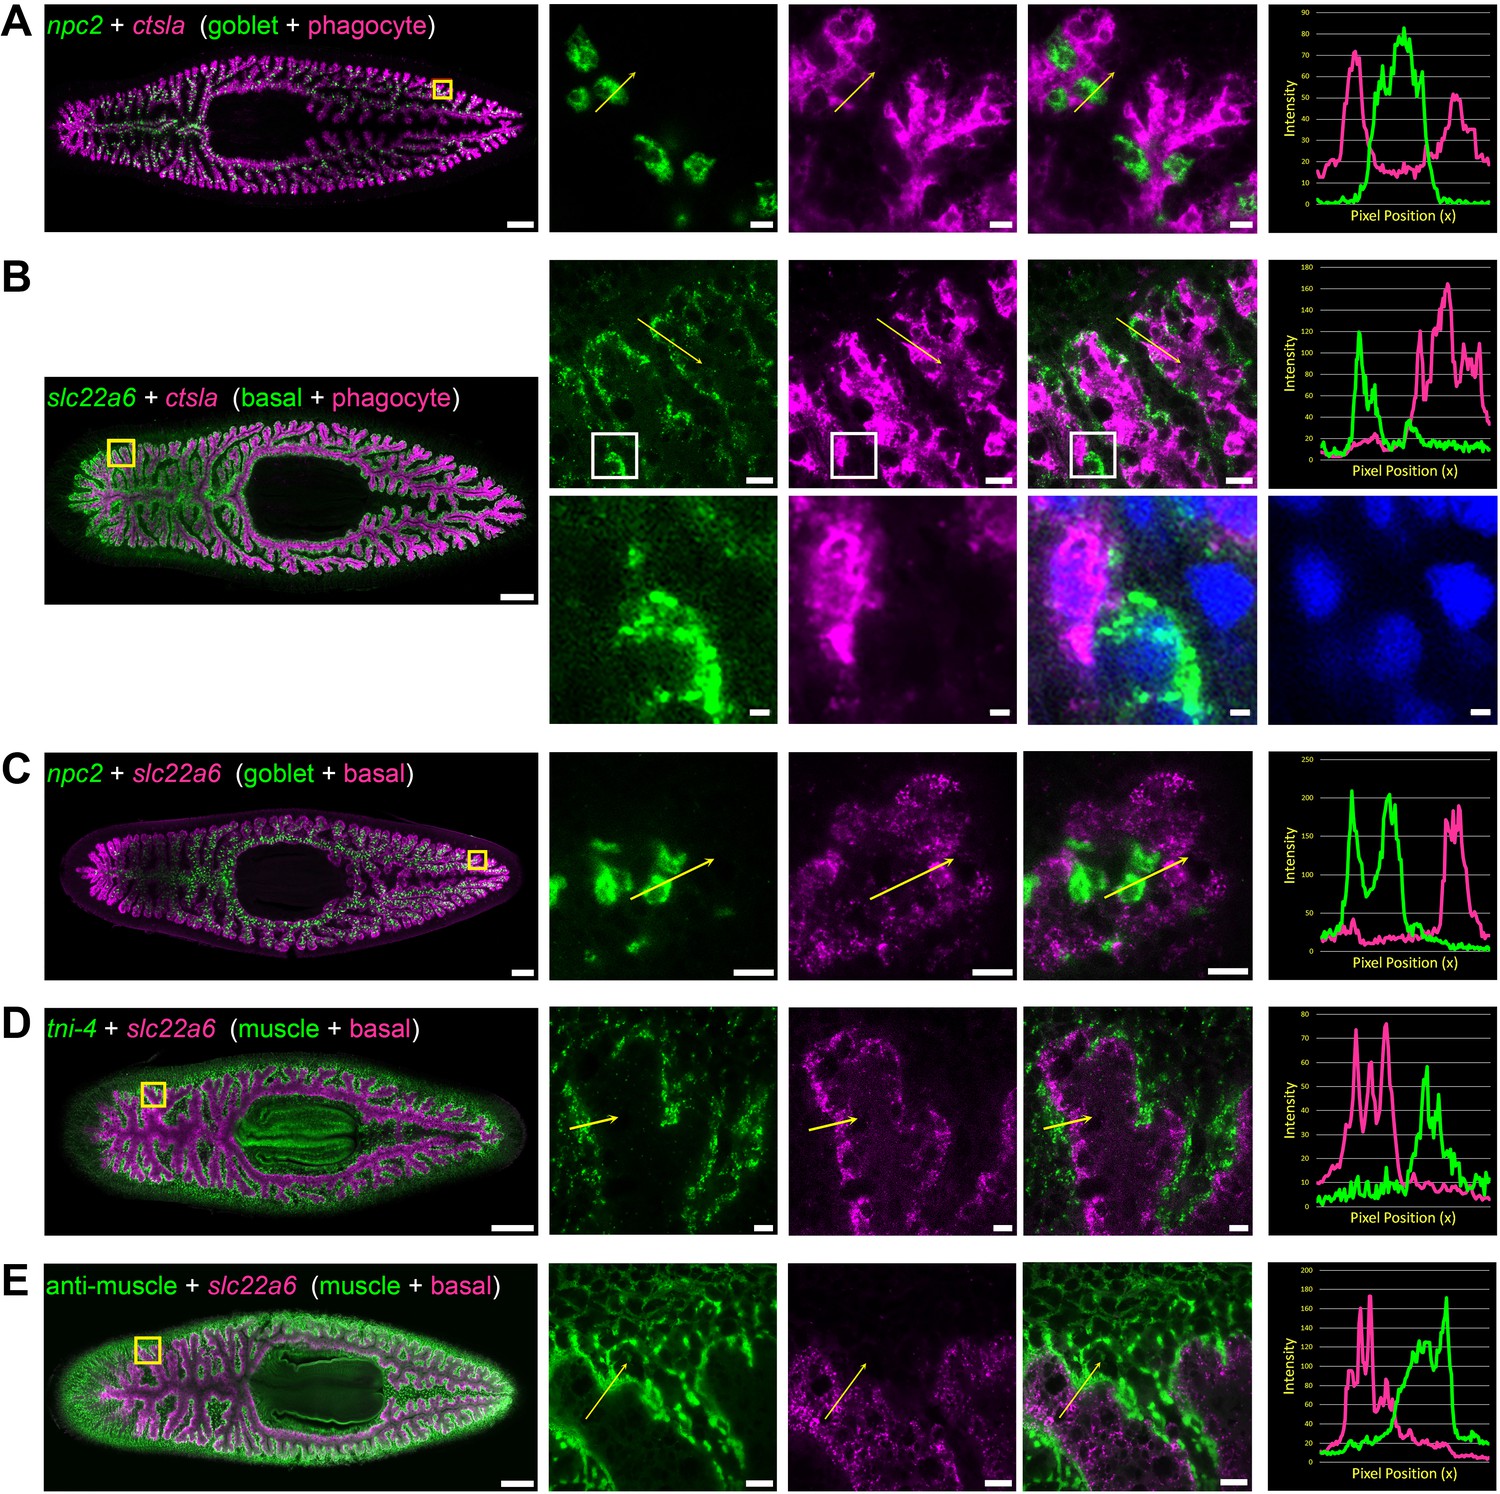
Double fluorescence in situ hybridization reveals three major cell types in the planarian intestine.
(A) Confocal images of npc2 (green) and ctsla (magenta) in situ hybridization. Left to right, whole animal (yellow box indicates magnified region in right panels), zoomed area in green, magenta, and merge (yellow arrow indicates profile line in right-most panel), and a graph showing pixel intensity in each color from tail to head of the yellow profile arrow. ctsla is the top phagocyte-specific gene in the phagocyte microarray dataset, while npc2 is enriched in goblet cells. (B) slc22a6 (green) and ctsla (magenta). slc22a6 mRNA is restricted to the basal region of the intestine, and shows minimal overlap with the phagocyte marker ctsla. The white box represents the cropped region shown below with DAPI labeling nuclei, indicating that these riboprobes label distinct cells. (C) npc2 (green) and slc22a6 (magenta). npc2 is enriched in goblet cells while slc22a6 is enriched in basal cells, with minimal overlapping signal. (D) troponin I 4 (tni-4, green) (Witchley et al., 2013) and slc22a6 (magenta). tni-4 is expressed by visceral muscles, while slc22a6 is found in basal cells. (E) Anti-muscle antibody (6G10, green) and slc22a6 (magenta). Detailed gene ID information is available in Supplementary file 1 and in Results. Scale bars, whole animals 200 μm; magnified images, 10 µm, magnified crop of basal cell (B), 2 µm.
Figure 3—figure supplement 1
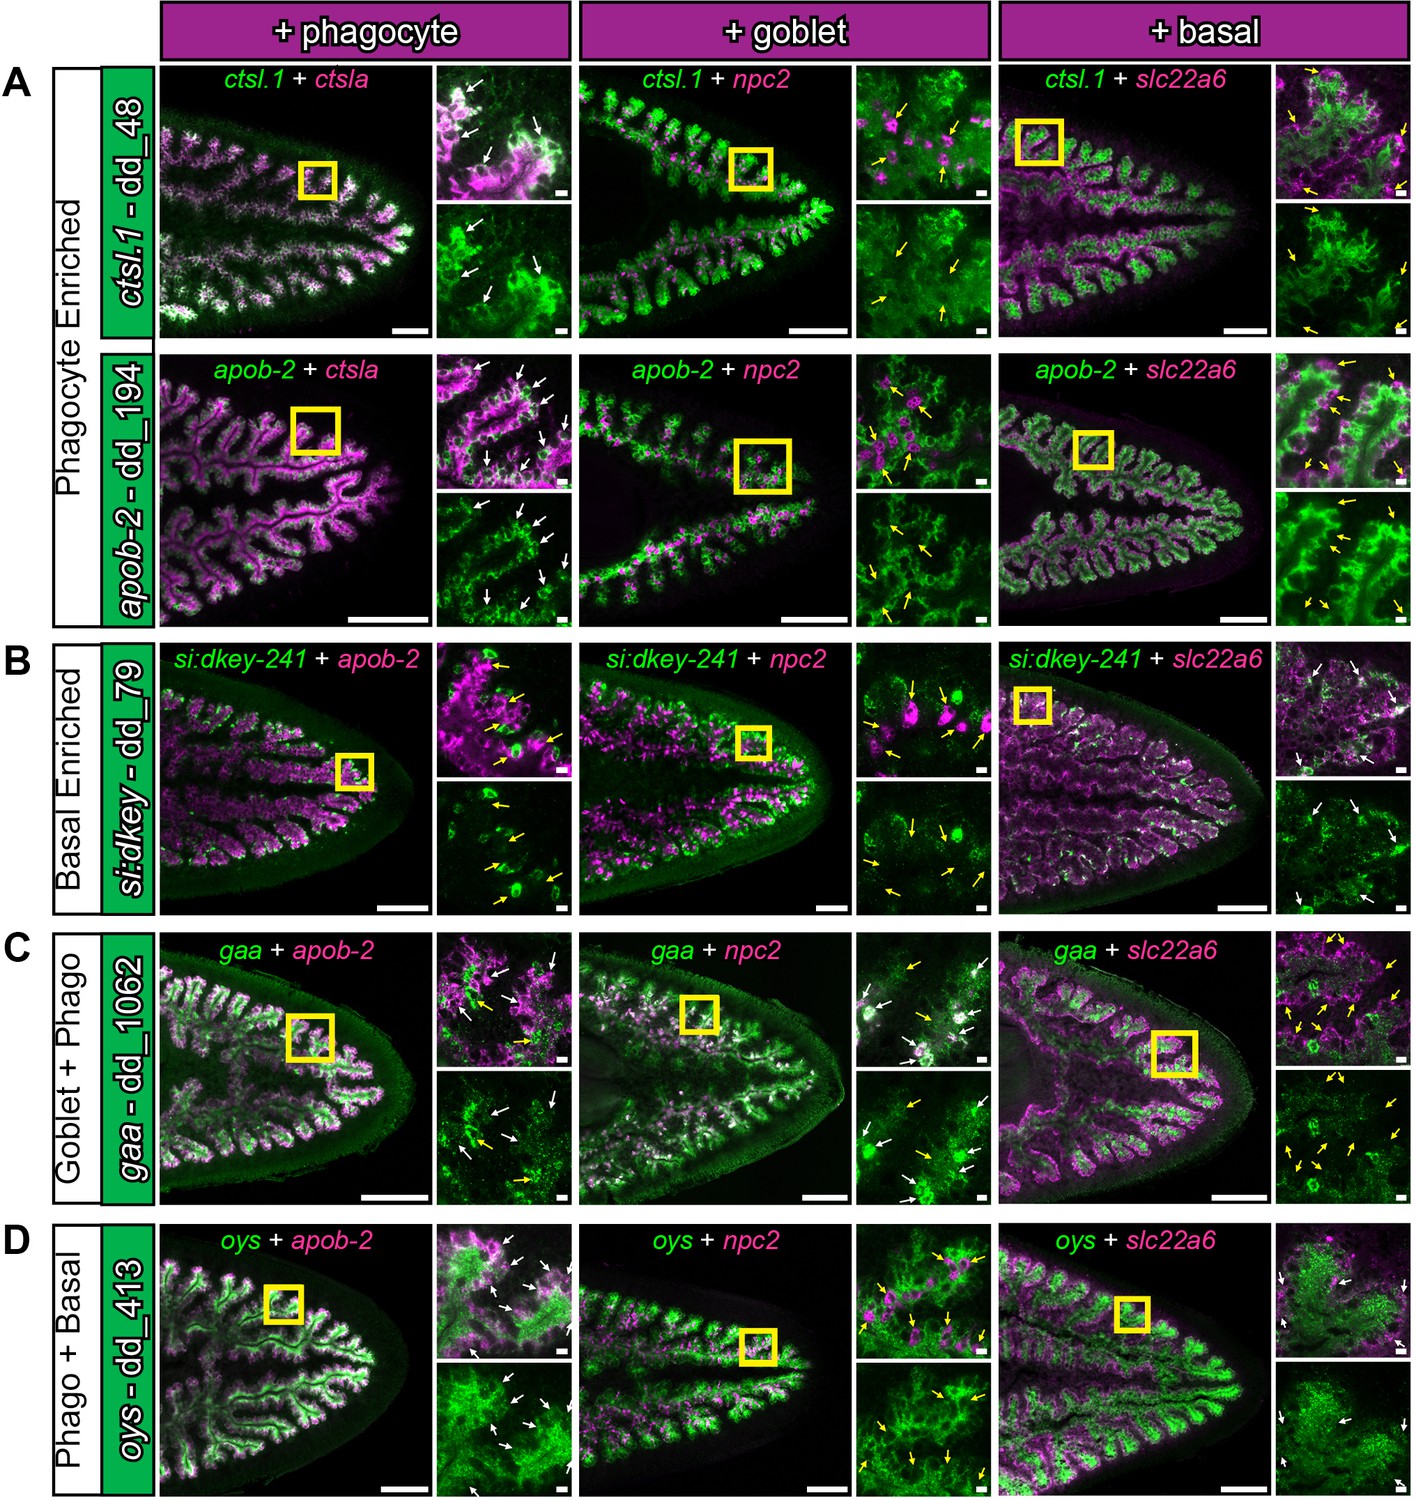
Additional cell-type specific transcripts revealed by double fluorescent in situ hybridization.
(A) Phagocyte-enriched genes ctsl.1 and apob-2 (green), in combination with a phagocyte, goblet, or basal marker shown in Figure 5 (magenta). Yellow box indicates magnified region. White arrows indicate regions of considerable overlapping expression, while yellow arrows indicate regions of minimal overlap. (B) si:dkey-241 (green) is enriched in a subset of slc22a6-positive basal cells. (C) gaa (green) is expressed in both goblet cells (high) and phagocytes (moderate), but is largely absent in basal cells. (D) oys is expressed in both phagocytes and basal cells. Detailed gene ID information is available in Supplementary file 1. Scale bars, whole animals 200 μm; magnified images, 10 µm.
Figure 4
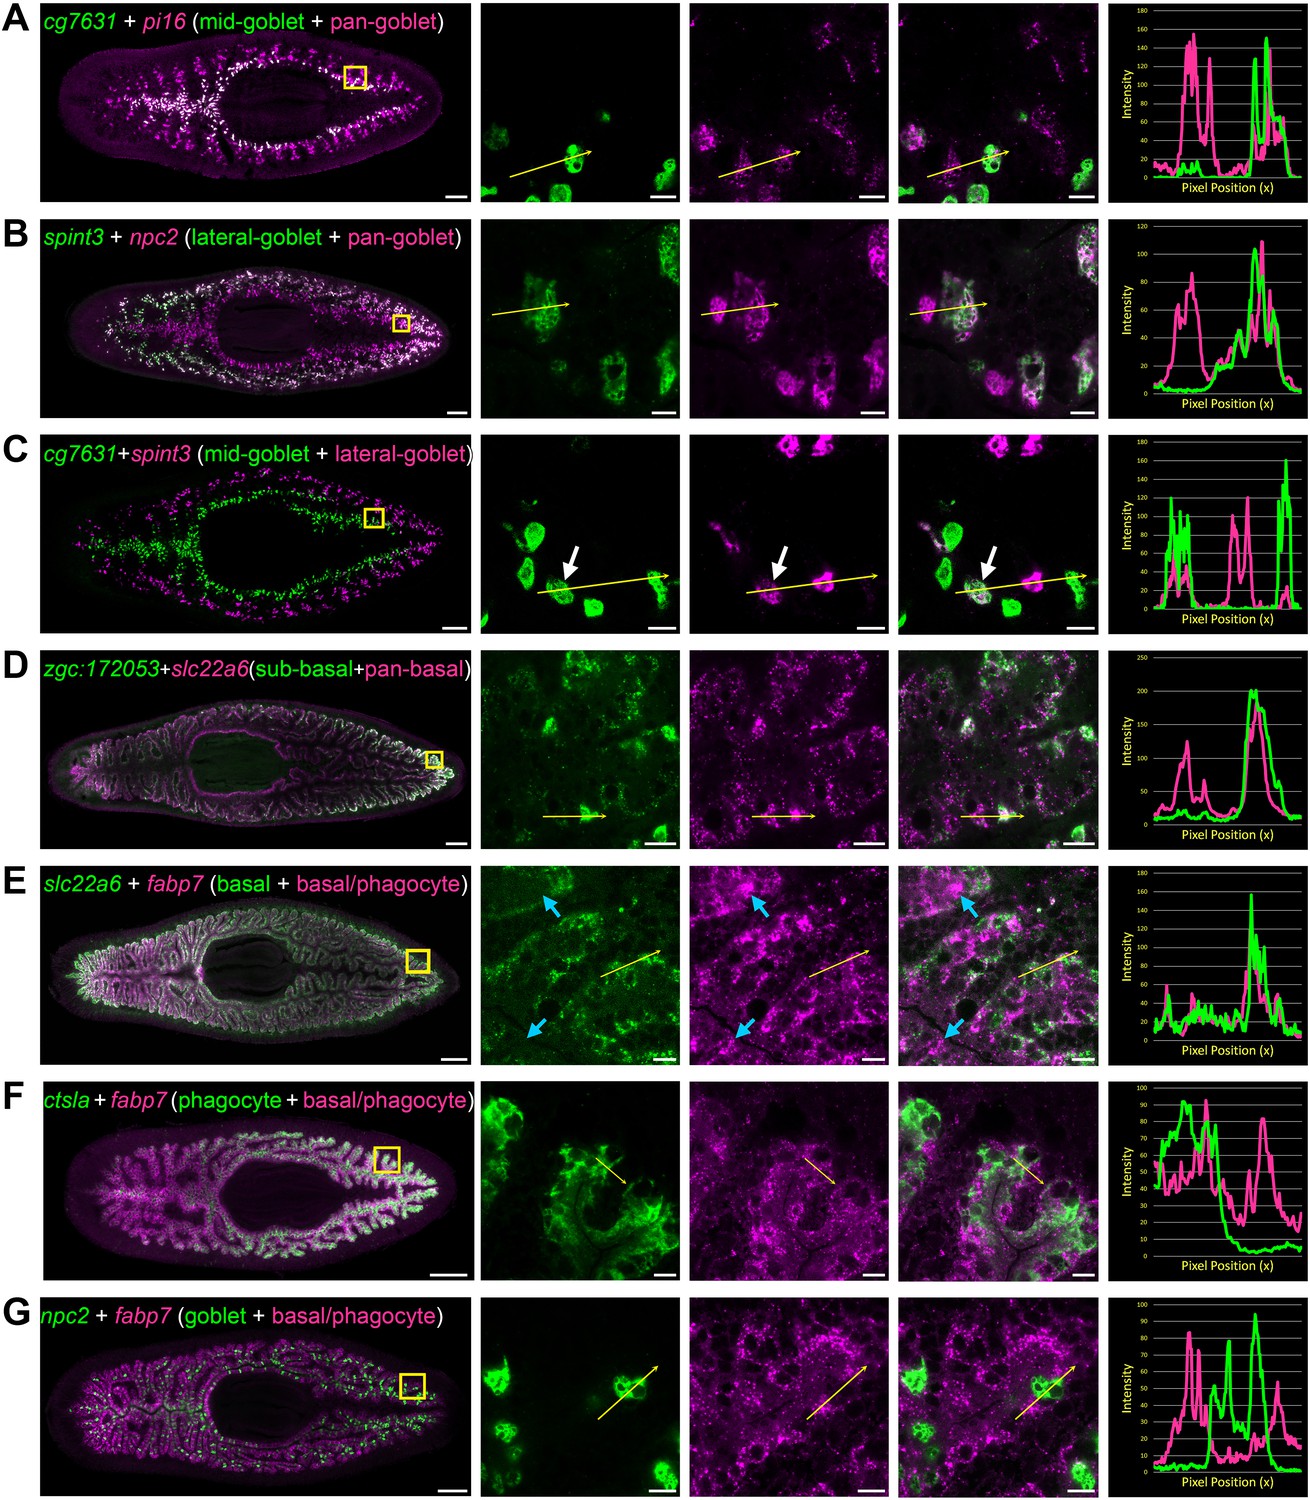
Transcripts expressed by intestinal subpopulations and multiple cell types.
(A) Confocal images of cg7631 (green) and pi16 (magenta) in situ hybridization. Left to right, whole animal (yellow box indicates magnified region in right panels), zoomed area in green, magenta, and merge (yellow arrow indicates profile line in right-most panel), and a graph showing pixel intensity in each color from tail to head of the yellow profile arrow. cg7631 is enriched in medial goblet cells, while pi16 is found in all goblet cells. (B) spint3 (green) and npc2 (magenta). spint3 is enriched in the lateral goblet cell population, while npc2 is expressed by all goblet cells. (C) cg7631 (green) and spint3 (magenta). cg7631 is enriched in medial goblet cells; spint3 is enriched in lateral goblet cells. Only rarely do these two markers label the same cell, indicated with a white arrow. (D) zgc:172053 (green) and slc22a6 (magenta). zgc:172053 is enriched in a subset of basal cells, while slc22a6 is more ubiquitously enriched in most basal cells. (E) slc22a6 (green) and fabp7 (magenta). slc22a6 is a basally enriched gene, while fabp7 is expressed by both basal cells and more apical cells (phagocytes). Blue arrows indicate apical gene expression where slc22a6 is absent. (F) ctsla (green) and fabp7 (magenta). ctsla expression is enriched in phagocytes, while fabp7 is found in both phagocytes and basal cells. (G) npc2 (green) and fabp7 (magenta). npc2 is enriched in goblet cells, and overlaps minimally with fabp7 in phagocytes and basal cells. Detailed gene ID information is available in Supplementary file 1 and in Results. Scale bars, whole animals 200 μm; magnified images, 10 µm.
Figure 5

LCM-RNA-Seq identifies additional intestine-enriched transcripts.
(A) Venn diagrams compare intestine-enriched transcripts identified in three scRNA-Seq studies (Fincher et al., 2018; Plass et al., 2018; Swapna et al., 2018) and this study, grouped by assignment to cell type (scRNA-Seq studies), or by uniform/phagocyte-like, goblet cell, and basal cell WISH expression patterns (this study). (B) Comparison of transcripts enriched in sorted phagocytes (Forsthoefel et al., 2012) with orthologs in the dd_Smed_v6 transcriptome, and laser-captured intestine. (C) Overlap between all intestine-enriched transcripts (based on RNA-Seq data) in three recent single-cell studies and our LCM data. Overlaps of two or fewer genes are not displayed. (D) Examples of intestine-enriched transcripts with a uniform/phagocyte-like expression pattern (WISH) identified by LCM-RNA-Seq, but not in other studies. (E) Examples of intestine-enriched transcripts with expression in goblet cells (WISH) identified by LCM-RNA-Seq, but not in other studies. (F) Example of intestine-enriched transcript expressed in basal cells (WISH) identified by LCM-RNA-Seq, but not in other studies. (G) Intestine-enriched transcript with low expression identified in this study. (H) Examples of transcripts enriched in LCM-RNA-Seq data for which expression was undetectable by WISH (e.g. did not validate). Detailed numerical data are in Supplementary file 1 and Figure 2—source data 1. Scale bars, 200 μm.
Figure 6 with 3 supplements
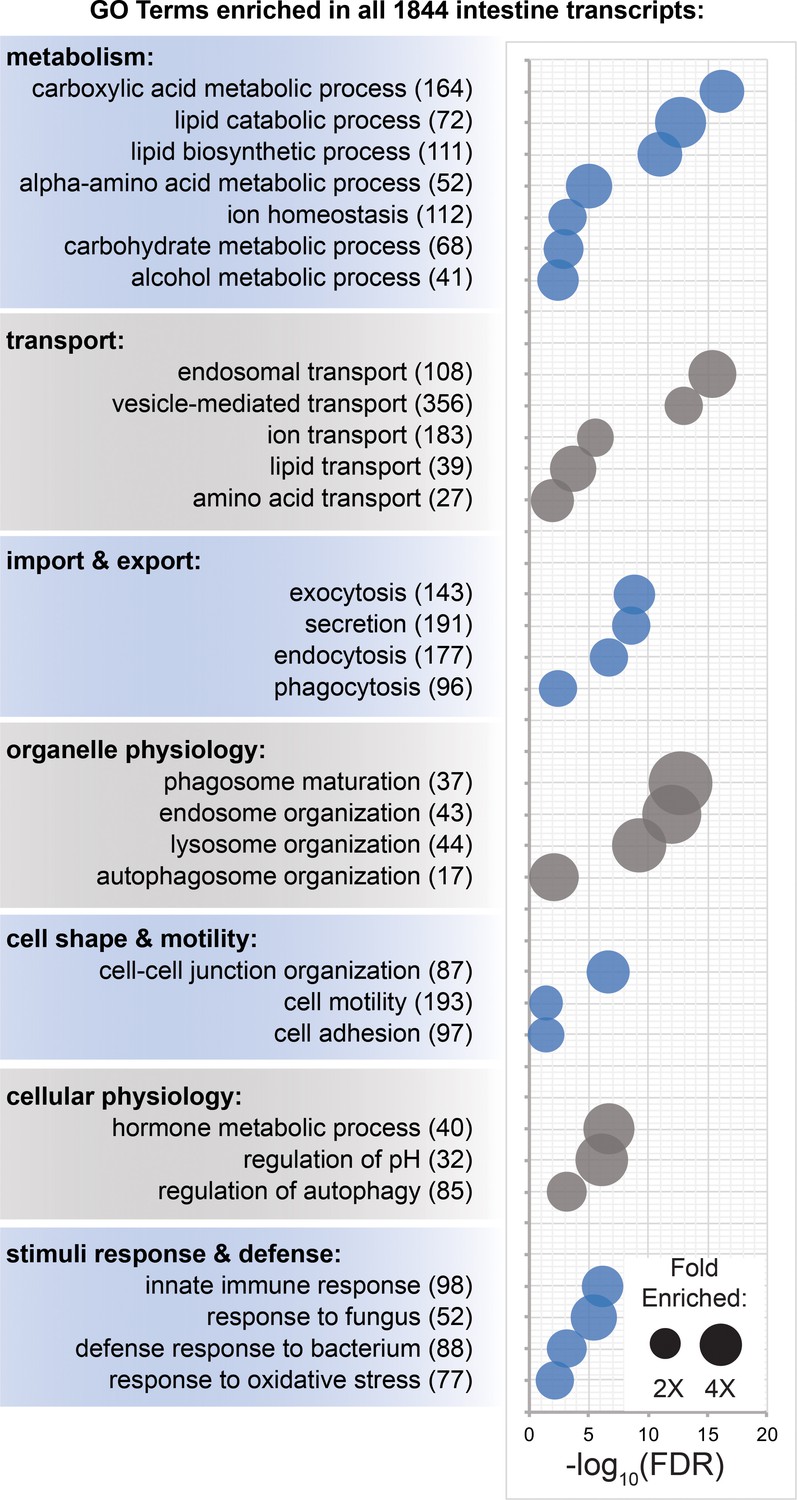
Transcripts involved in metabolism, transport, organelle physiology, and stimuli responses are enriched in the intestine.
(A) Biological process Gene Ontology terms significantly over-represented in intestine-enriched transcripts. Bubble size indicates fold enrichment relative to all transcripts detected in laser-captured tissue, while position on the x-axis indicates FDR-adjusted significance. Numbers in parentheses indicate the number of intestine-enriched transcripts annotated with each term. Detailed numerical data are in Figure 6—source data 1.
-
Figure 6—source data 1
Gene Ontology biological process term enrichment for intestine-enriched transcripts.
(F6SD1-A) Biological Process term enrichment for all 1844 intestine-enriched transcripts. (F6SD1-B) Term enrichment for 814 phagocyte-enriched transcripts (Fincher et al., 2018). (F6SD1-C) Term enrichment for 290 basal/outer cell-enriched transcripts (Fincher et al., 2018). (F6SD1-D) Term enrichment for 39 goblet cell-enriched transcripts (Fincher et al., 2018). (F6SD1-E) Term enrichment for 1221 medial intestine-enriched transcripts (FC-medial >FC lateral). (F6SD1-F) Term enrichment for 623 lateral intestine-enriched transcripts (FC-lateral >FC medial). (F6SD1-G) 415 Biological Process terms enriched ONLY in medially enriched intestine transcripts. (F6SD1-H) 34 Biological Process terms enriched ONLY in laterally enriched intestine transcripts. (F6SD1-I) Term enrichment for the 97 most medially enriched transcripts. (F6SD1-J) Term enrichment for the 56 most laterally enriched transcripts.
- https://cdn.elifesciences.org/articles/52613/elife-52613-fig6-data1-v1.xlsx
-
Figure 6—source data 2
LCM intestine-enriched transcripts in innate immunity studies.
(F6SD2-A) 62 intestine-enriched transcripts (LCM) that were upregulated or downregulated in response to shift to static culture in Arnold et al. (2016). (F6SD2-B) 99 intestine-enriched transcripts (LCM) that were upregulated in response to pathogenic bacteria ingestion in Abnave et al. (2014).
- https://cdn.elifesciences.org/articles/52613/elife-52613-fig6-data2-v1.xlsx
Figure 6—figure supplement 1

Innate immunity-related transcripts enriched in the intestine.
(A) Intestine-enriched transcripts detected by LCM (pink) compared to S. mediterranea transcripts that were up- or downregulated upon transfer of planarians from continuous flow to static culture in Arnold et al. (2016) (blue). (B) S. mediterranea intestine-enriched transcripts detected by LCM (pink) compared to D. japonica homologous transcripts that were upregulated in response to L. pneumophila or S. aureus infections in Abnave et al. (2014) (blue). Detailed numerical data are available in Figure 6—source data 2.
Figure 6—figure supplement 2
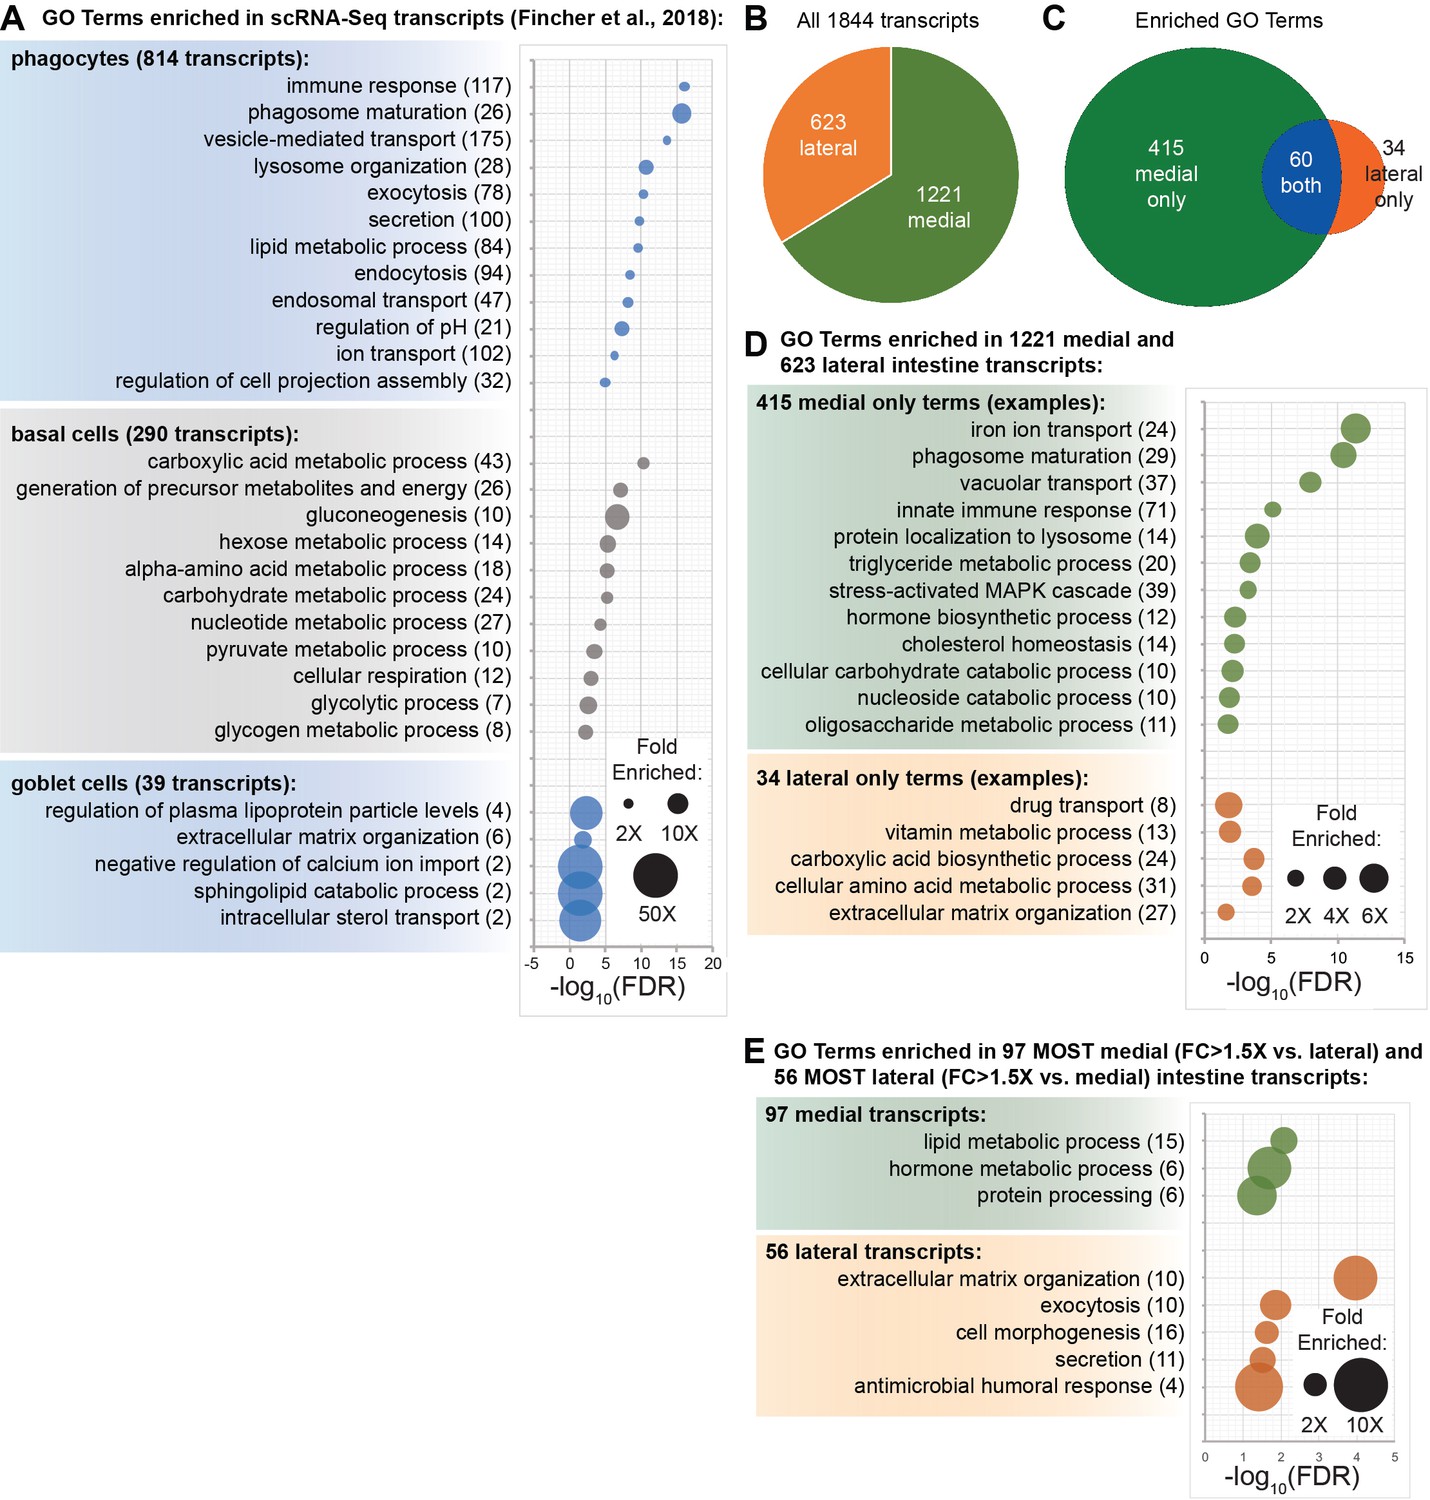
Enriched biological process GO terms for transcripts enriched in intestinal cell types and regions.
(A) GO term enrichment for phagocyte-, goblet-, and basal-cell-enriched transcripts identified in Fincher et al. (2018). (B) Pie chart showing the ratio of transcripts with higher fold changes in laser-captured medial and lateral intestinal tissue. (C) Venn diagram showing the number of Biological Process GO terms enriched for medial, lateral, or both groups of transcripts. (D) Examples of GO terms over-represented only in medial and lateral transcripts. (E) Examples of GO term enrichment for only the most medially and laterally enriched transcripts. Detailed numerical data are available in Figure 6—source data 1.
Figure 6—figure supplement 3
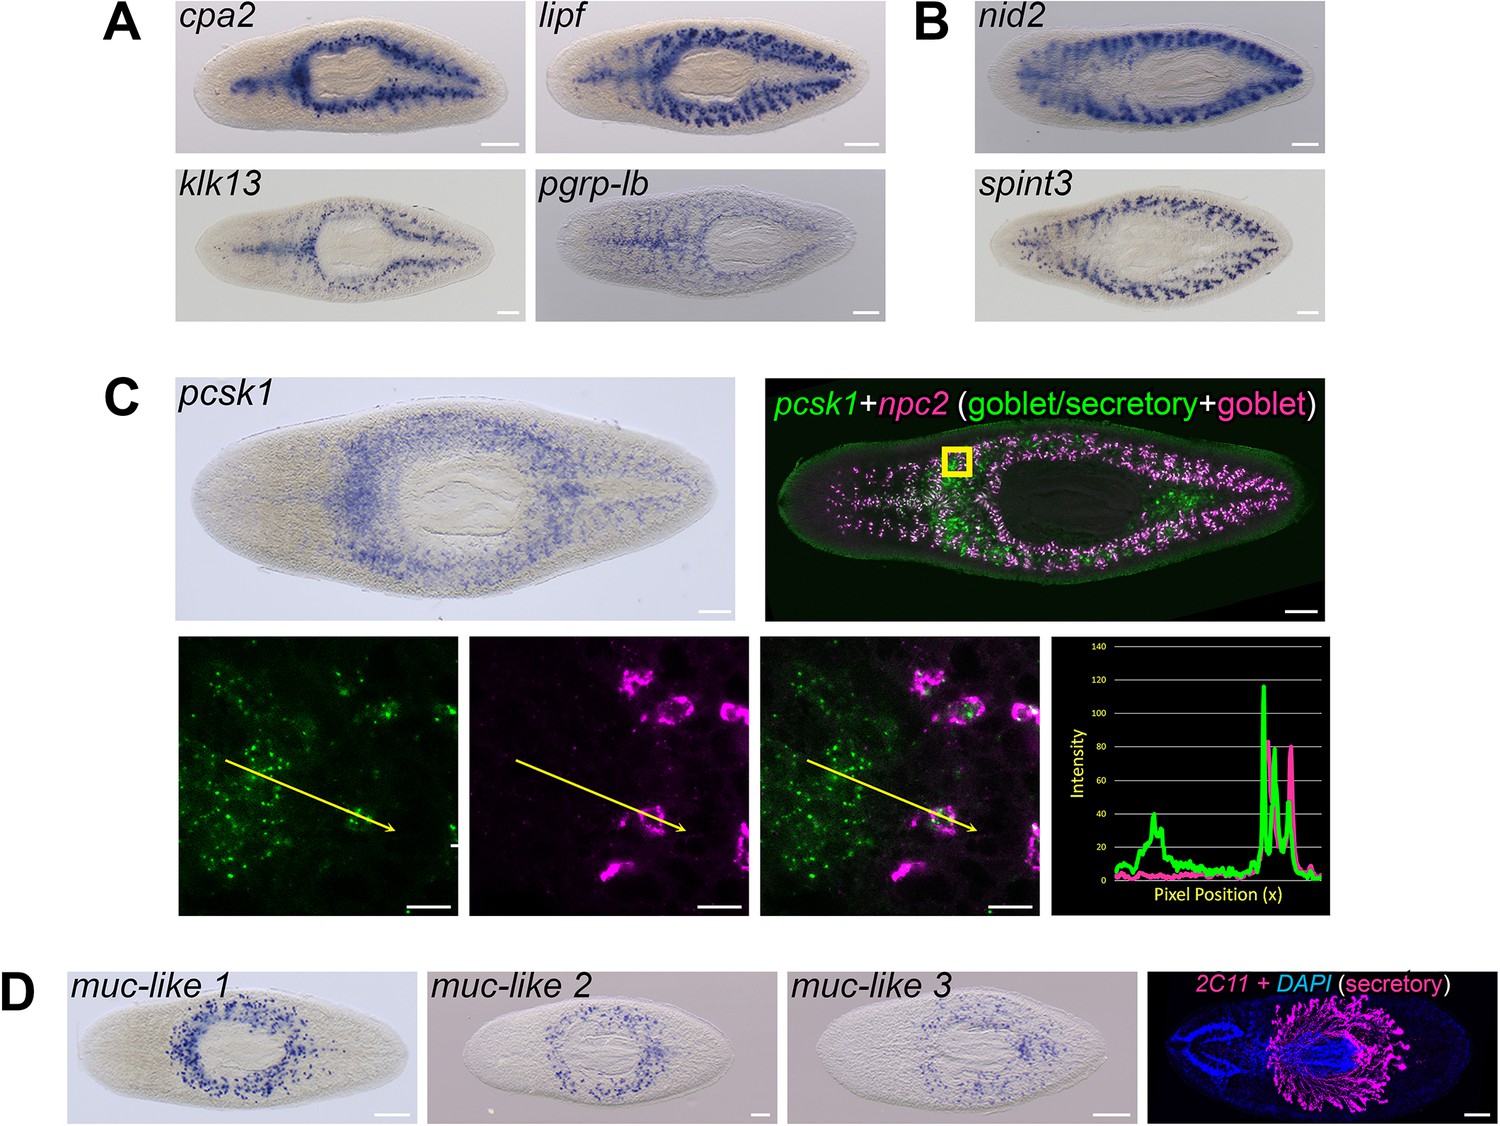
Gene expression by goblet cells suggests multiple physiological roles.
(A) Whole-mount in situ hybridizations for medially enriched transcripts carboxypeptidase A2 (cpa2), gastric triacylglycerol lipase (lipf), kallikrein-13 (klk13), and peptidoglycan recognition protein LB (pgrp-lb). (B) Expression patterns for laterally enriched transcripts nidogen-2 (nid2), a predicted regulator of extracellular matrix organization, and Kunitz-type protease inhibitor 3 (spint3), a predicted secreted serine protease inhibitor. (C) Neuroendocrine convertase 1 (pcsk1) mRNA expression. WISH, top left. dFISH, top right and magnified views (yellow box). pcsk1 (green) co-expression with the pan-goblet marker npc2 (magenta) demonstrates pcsk1 is expressed in goblet cells as well as peripharyngeal secretory cells. (D) Expression of three mucin-like genes in secretory cells surrounding the pharynx (muc-like-1/dd_Smed_v6_17988_0_1, muc-like-2/dd_18786_0_1, and muc-like-3/dd_21309_0_1), and mAb 2C11 labeling peripharyngeal secretory cells and their projections into the pharynx (magenta) (bottom row). Detailed gene ID information is available in Supplementary file 1 and Supplementary file 3. Scale bars: whole animals 200 μm; magnified images (B), 10 µm.
Figure 7
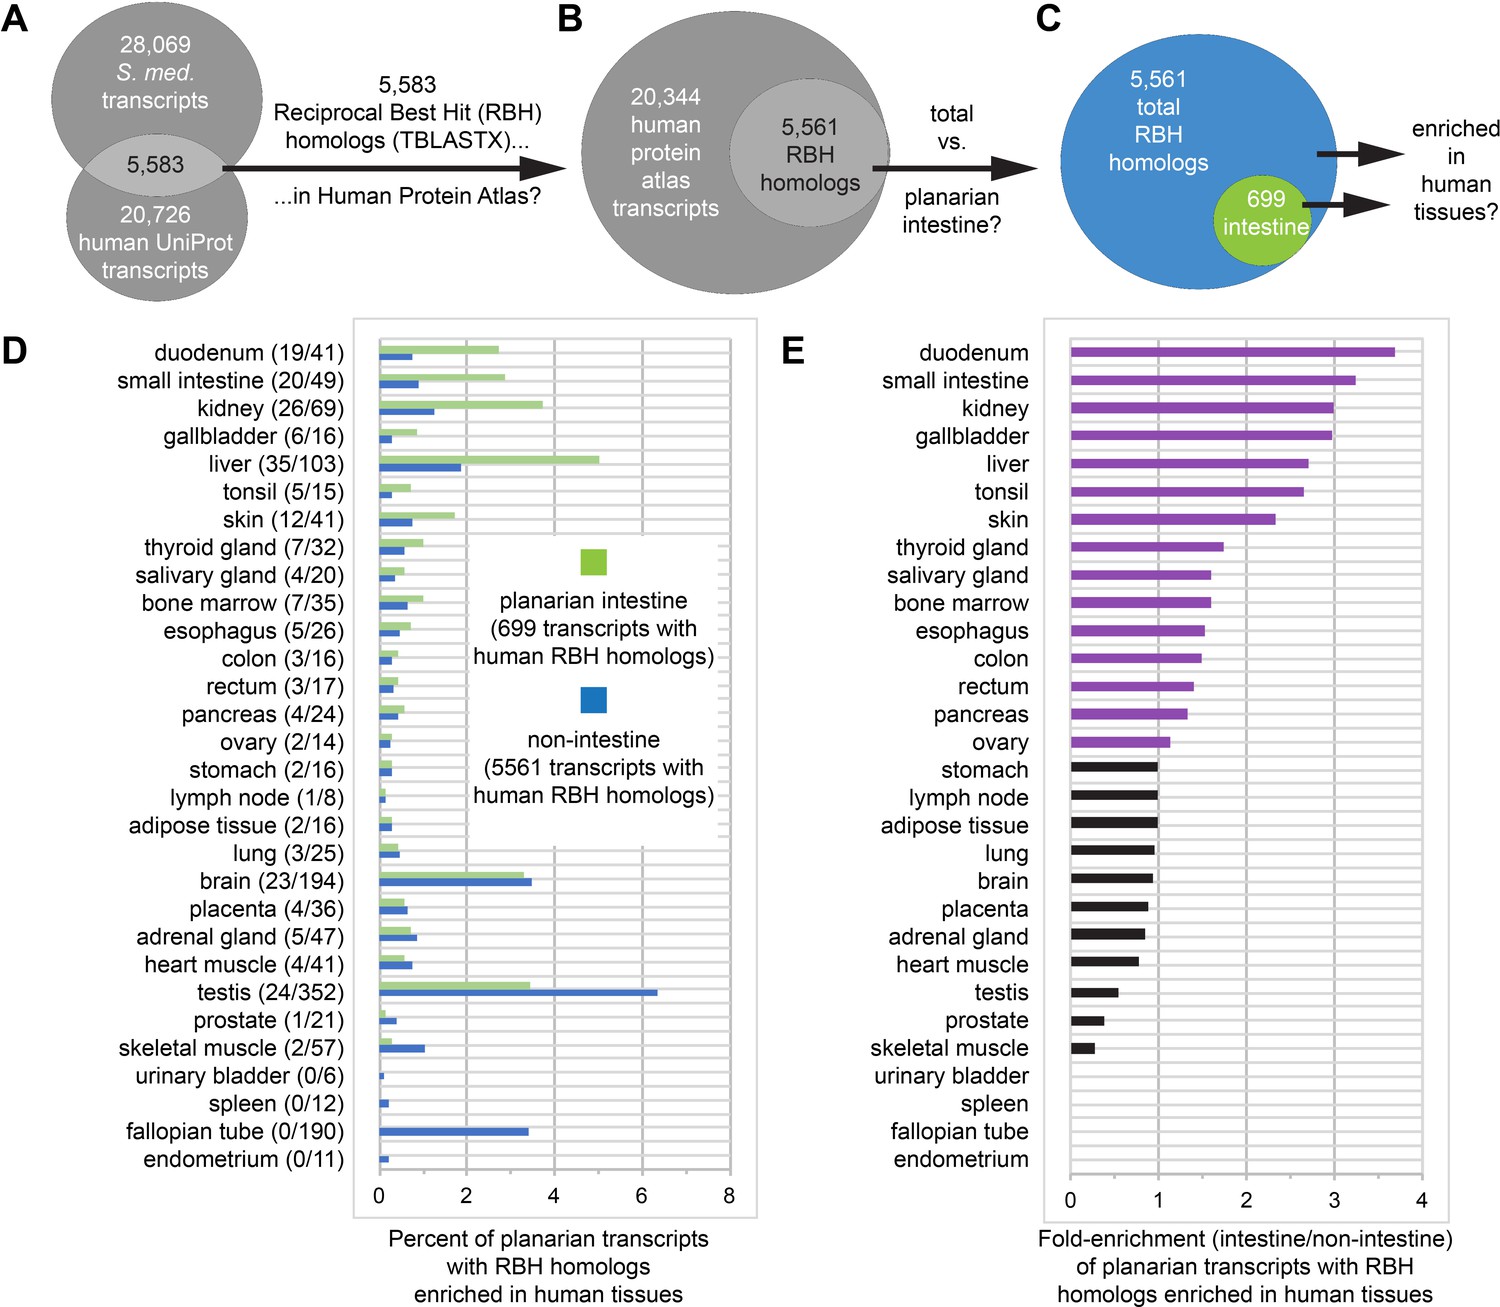
Homologs of planarian intestinal transcripts are enriched in human digestive tissues.
(A) 5583 S. mediterranea and Homo sapiens UniProt transcripts hit each other in reciprocal TBLASTX queries. (B) 5561/5583 human UniProt RBH homologs of planarian transcripts were present in the Human Protein Atlas. (C) 699/5561 RBH homologs were enriched in the planarian intestine. (D) Enrichment of RBH homologs in human tissues. The first number in parentheses is the number of planarian intestine-enriched RBH homologs (of 699) and the second number in parentheses is the number of all RBH homologs (of 5561) for each human tissue. Histogram bars represent percentage of planarian transcripts with RBH homologs enriched in human tissues. For example, 19/699 (2.72%) UniProt RBH homologs of planarian intestine-enriched transcripts were tissue-enriched, tissue-enhanced, or group-enriched in the duodenum, while only 41/5561 (0.74%) of all UniProt RBH homologs of planarian transcripts were similarly enriched. (E) Fold enrichment (planarian intestine/non-intestine) of RBH homologs for each human tissue. Histogram bars were calculated as a ratio of percentages in panel D. For example, 2.72% of 699 planarian intestinal RBH homologs and 0.74% of all 5561 planarian RBH homologs were enriched in the duodenum, yielding fold enrichment of 2.72/0.74 = 3.68X. Detailed numerical data are available in Figure 7—source data 1.
-
Figure 7—source data 1
Planarian transcripts with reciprocal best hit (RBH) homologs enriched in human tissues.
(F7SD1-A) Human tissue enrichment for 699 human RBH homologs of planarian transcripts enriched in the planarian intestine. Data from Uhlén et al. (2015) reprinted with permission from AAAS. (F7SD1-B) Human tissue enrichment for all 5561 human RBH homologs of planarian transcripts. Data from Uhlén et al. (2015) reprinted with permission from AAAS. (F7SD1-C) Summary of tissue-specific enrichment for human RBH homologs of planarian transcripts. (F7SD1-D) Global summary of group enriched, tissue enriched, and tissue enhanced transcripts for human RBH homologs of planarian transcripts. (F7SD1-E) Best TBLASTX hits for planarian vs. human transcripts. (F7SD1-F) Best TBLASTX hits for human vs. planarian transcripts (reciprocal BLAST). (F7SD1-G) 5583 planarian transcripts with human RBH homologs. (F7SD1-H) 700 intestine-enriched planarian transcripts with human RBH homologs.
- https://cdn.elifesciences.org/articles/52613/elife-52613-fig7-data1-v1.xlsx
Figure 8 with 6 supplements
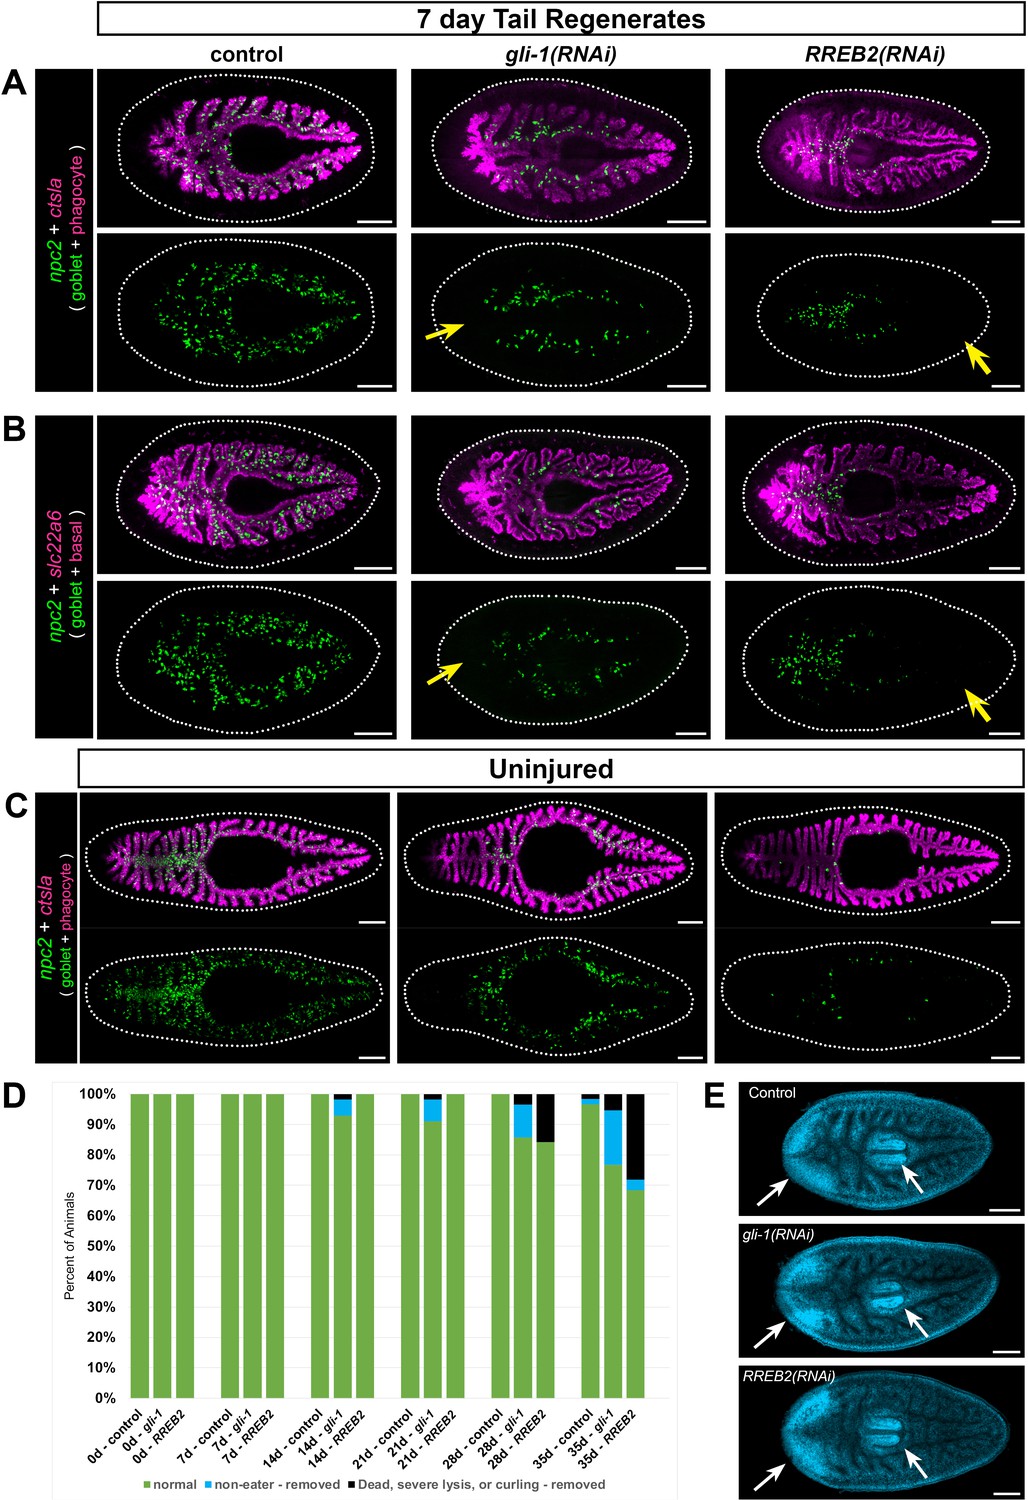
gli-1 and RREB2 regulate goblet cell abundance.
(A) In 7 day tail regenerates, gli-1 knockdown dramatically reduces goblet cells (npc2+) at the midline in regenerating intestine (yellow arrow), while RREB2 knockdown reduces goblet cells in old tissue (yellow arrow). Phagocytes (ctsla+) appear normal in all conditions. Both gli-1(RNAi) and RREB2(RNAi) also reduce goblet cells in lateral branches. (B) Basal cells (slc22a+) are unaffected in gli-1(RNAi) and RREB2(RNAi) regenerates, while goblet cells are reduced similar to A. (C) In uninjured animals, gli-1 RNAi causes moderate goblet cell loss, while RREB2 RNAi results in severe goblet cell loss. (D) Phenotypes in gli-1(RNAi) and RREB2(RNAi) planarians during six dsRNA feedings (once per week). Animals refuse food and undergo lysis and death with increasing frequency over the RNAi time course. Total sample size was n ≥ 55 for each condition; data were pooled from three independent biological replicates of n ≥ 18 each. (E) DAPI labeling of tail regenerates shown in B. White arrows indicate normal regeneration of new brain and pharynx. Animals in A, B, and E were fed dsRNA eight times (twice per week), starved 7 days, amputated, then fixed 7 days later. Animals in C and D were fed dsRNA six times (once per week), starved 7 days, then fixed for FISH. Detailed gene ID and RNAi phenotype information is available in Supplementary file 1, Supplementary file 5, and Figure 8—source data 1A. Scale bars, 200 μm.
-
Figure 8—source data 1
(F8SD1-A) Detailed feeding and viability numerical data for three biological replicates conducted for control, gli-1, and RREB2 RNAi phenotypes; (F8SD-2) individual measurements for area and length of control, gli-1, and RREB2 knockdowns before any treatment and after five dsRNA feedings; (F8SD-3) statistics tables for length and area measurements.
- https://cdn.elifesciences.org/articles/52613/elife-52613-fig8-data1-v1.xlsx
Figure 8—figure supplement 1
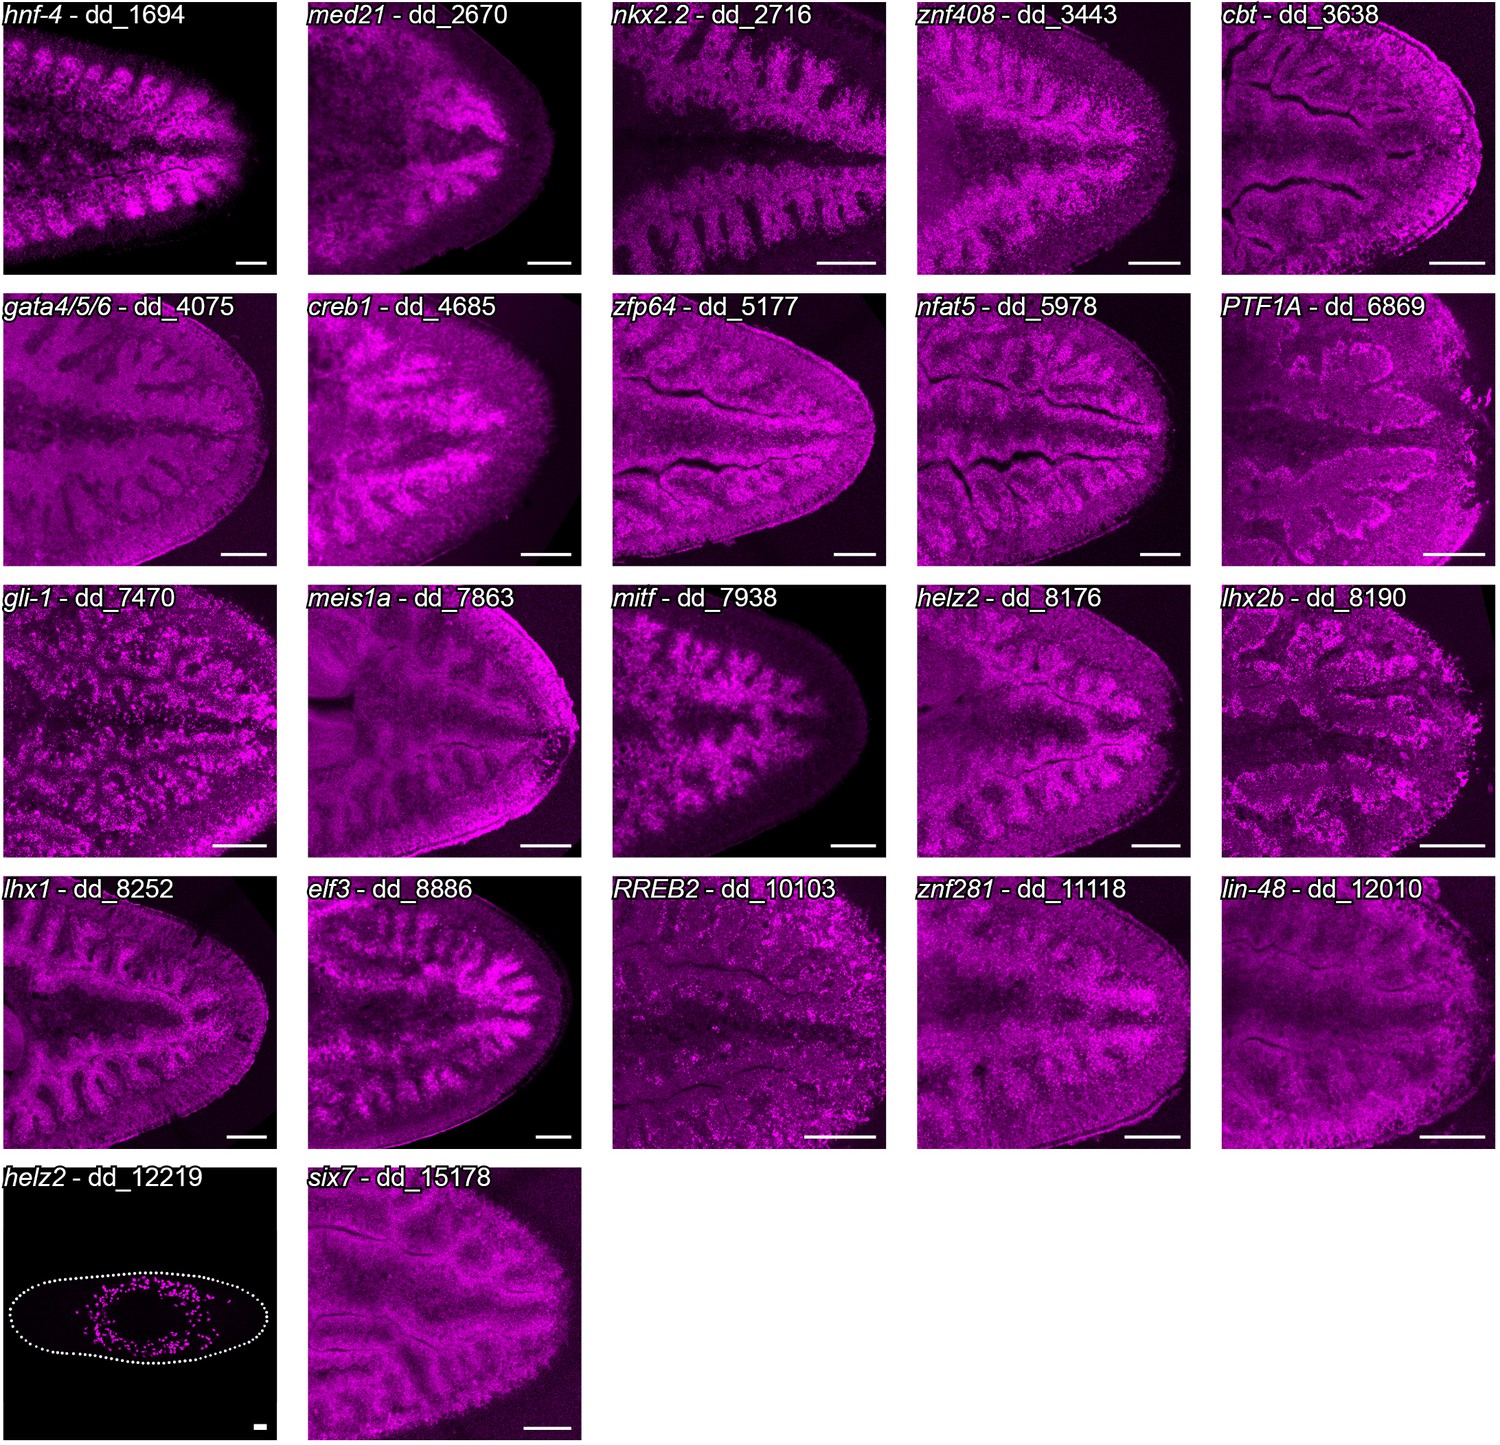
Expression of intestine-enriched transcription factors.
Fluorescent in situ hybridization expression patterns of 22 intestine-enriched transcription factors identified in the laser capture dataset. Organized by dd_Smed_v6 ID in ascending order. Detailed gene ID information is available in Supplementary file 1 and Supplementary file 5. Scale bars, 100 μm.
Figure 8—figure supplement 2
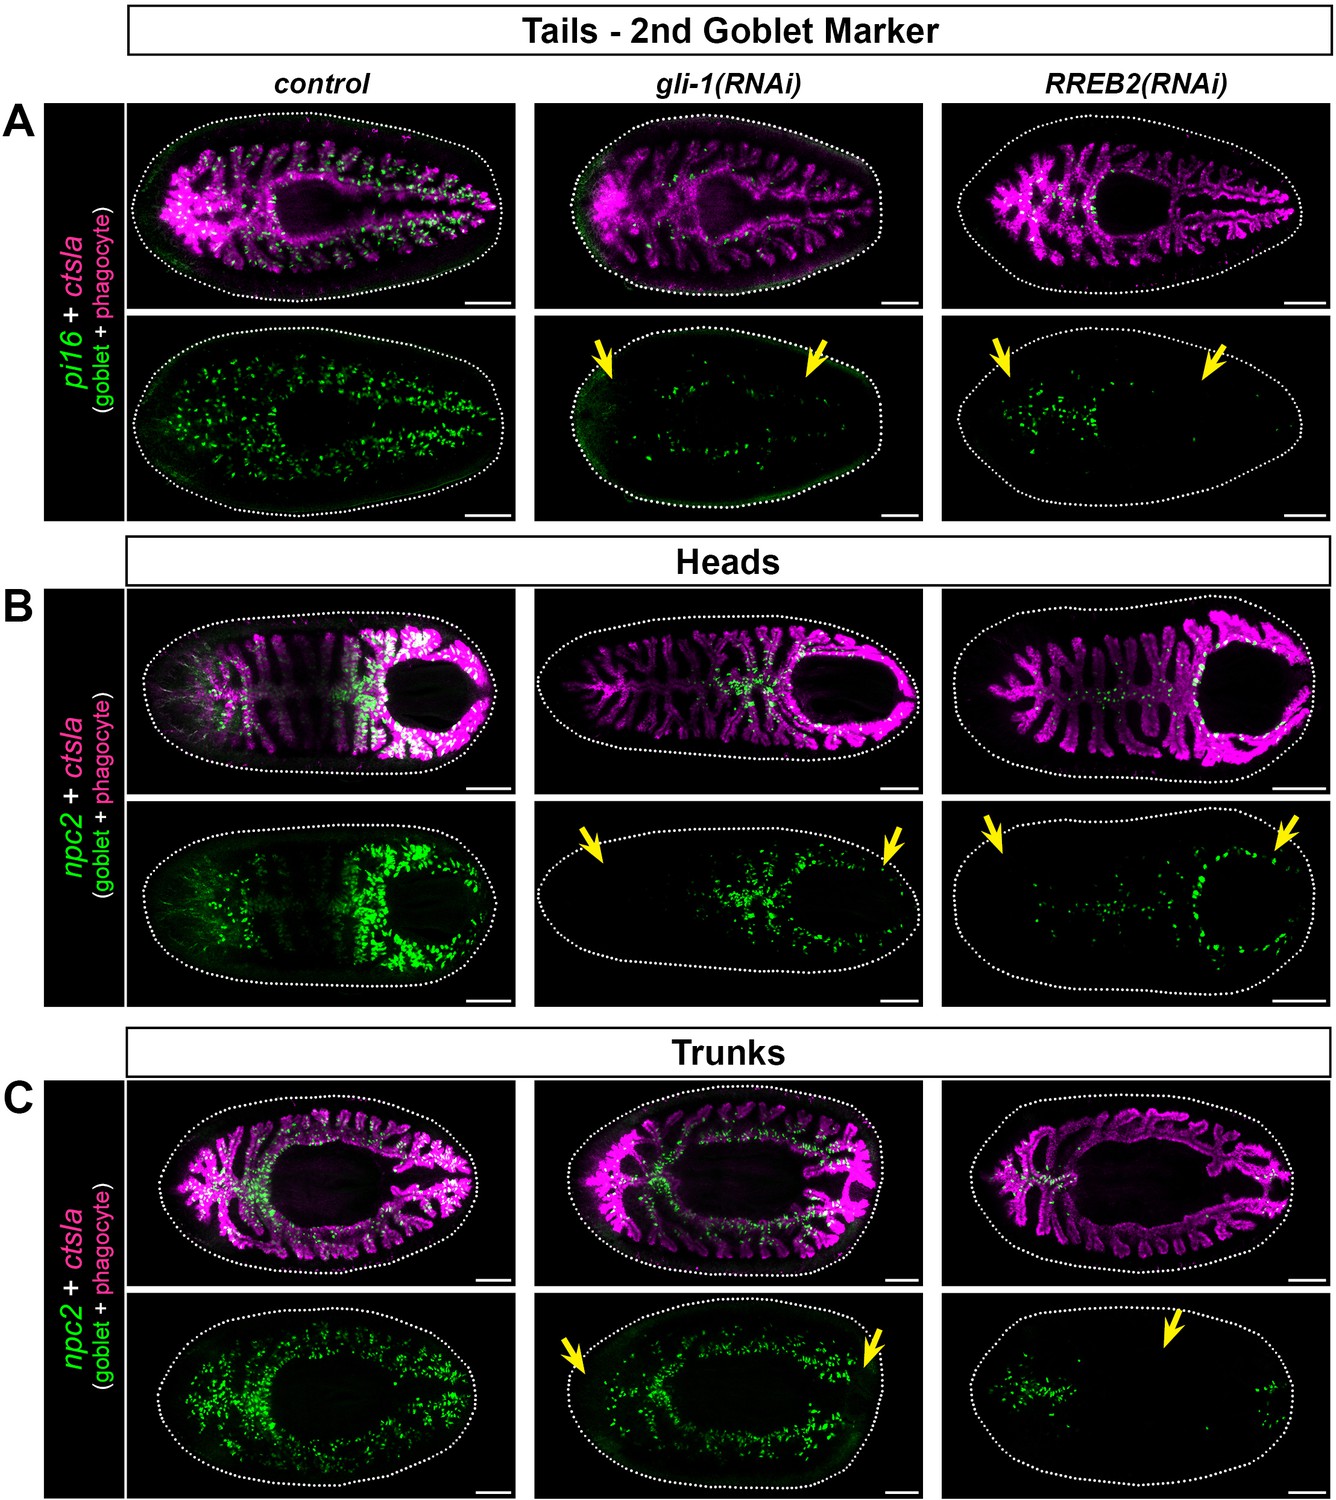
Goblet cells are reduced in gli-1 and RREB2 7 day regenerates.
Yellow arrows indicate regions of reduced or missing goblet cells. (A) Expression of a second, additional pan-goblet cell marker, pi16, in 7 day tail regenerates, showing dramatic reduction in goblet cell numbers (arrows). (B) npc2 expression in 7 day regenerate heads, indicating severe reduction of goblet cells in gli-1 and RREB2 knockdowns (arrows). (C) Trunk fragments also show goblet cell loss. gli-1 RNAi causes missing or reduced npc2 expression in blastema regions, while RREB2 reduces npc2 labeling in pre-existing intestine (arrows). Detailed gene ID information is available in Supplementary file 1. Scale bars, 200 μm.
Figure 8—figure supplement 3
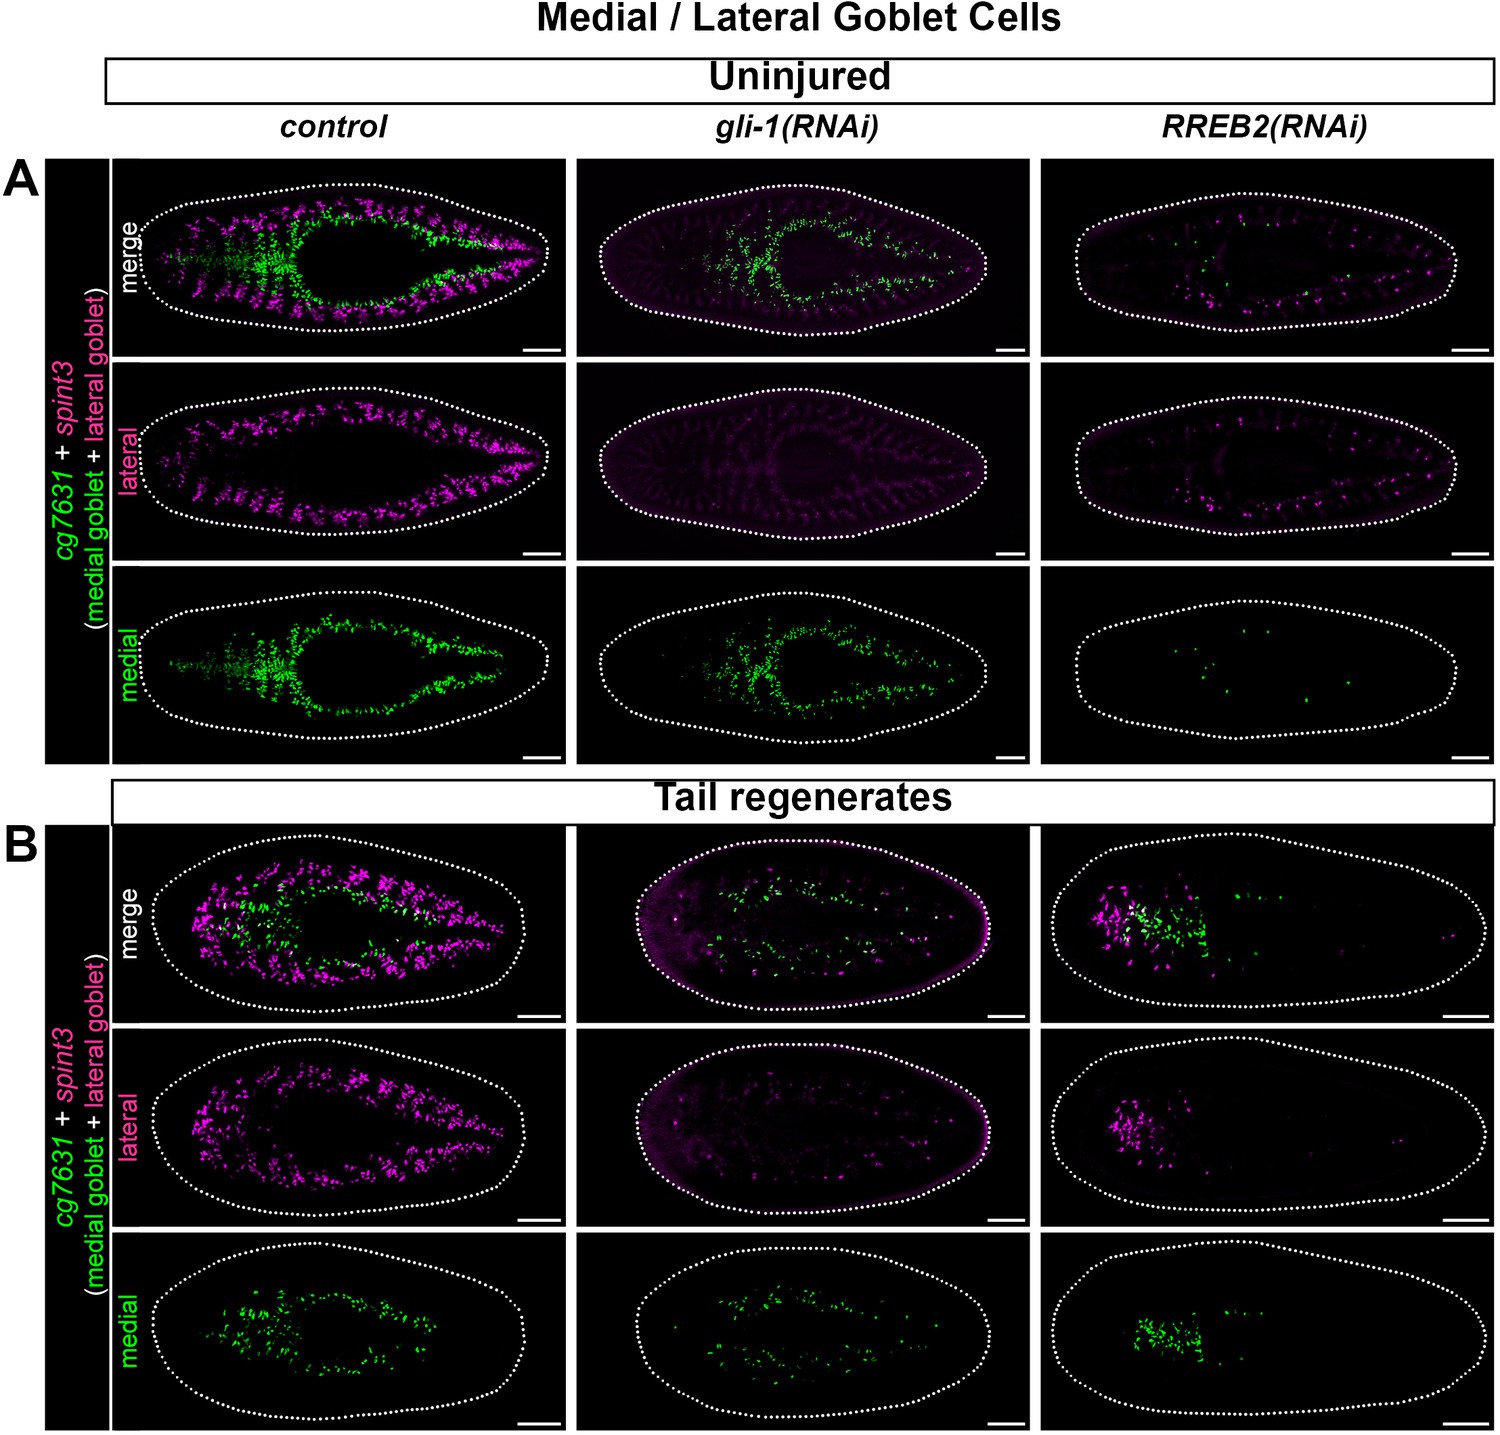
Effects of gli-1 and RREB2 knockdown on medial and lateral goblet cell subpopulations.
(A) Uninjured animals showing the expression of cg7631 (medial goblet) and spint3 (lateral goblet) in control, gli-1, or RREB2 knockdown animals. gli-1(RNAi) animals preferentially lose lateral goblet cells. RREB2(RNAi) animals lose both goblet cell subtypes, although more lateral cells remain compared to gli-1 knockdown. (B) 7 day tail regenerates with medial and lateral goblet cells labeled in control, gli-1, or RREB2 knockdowns. gli-1 RNAi again reduces lateral goblet cells throughout the fragment, as well as medial populations in the anterior regenerating intestine, while RREB2(RNAi) regenerates lack all goblet cells in pre-injury intestine (e.g. posterior in tail fragments). Detailed gene ID information is available in Supplementary file 1. Scale bars, 200 μm.
Figure 8—figure supplement 4
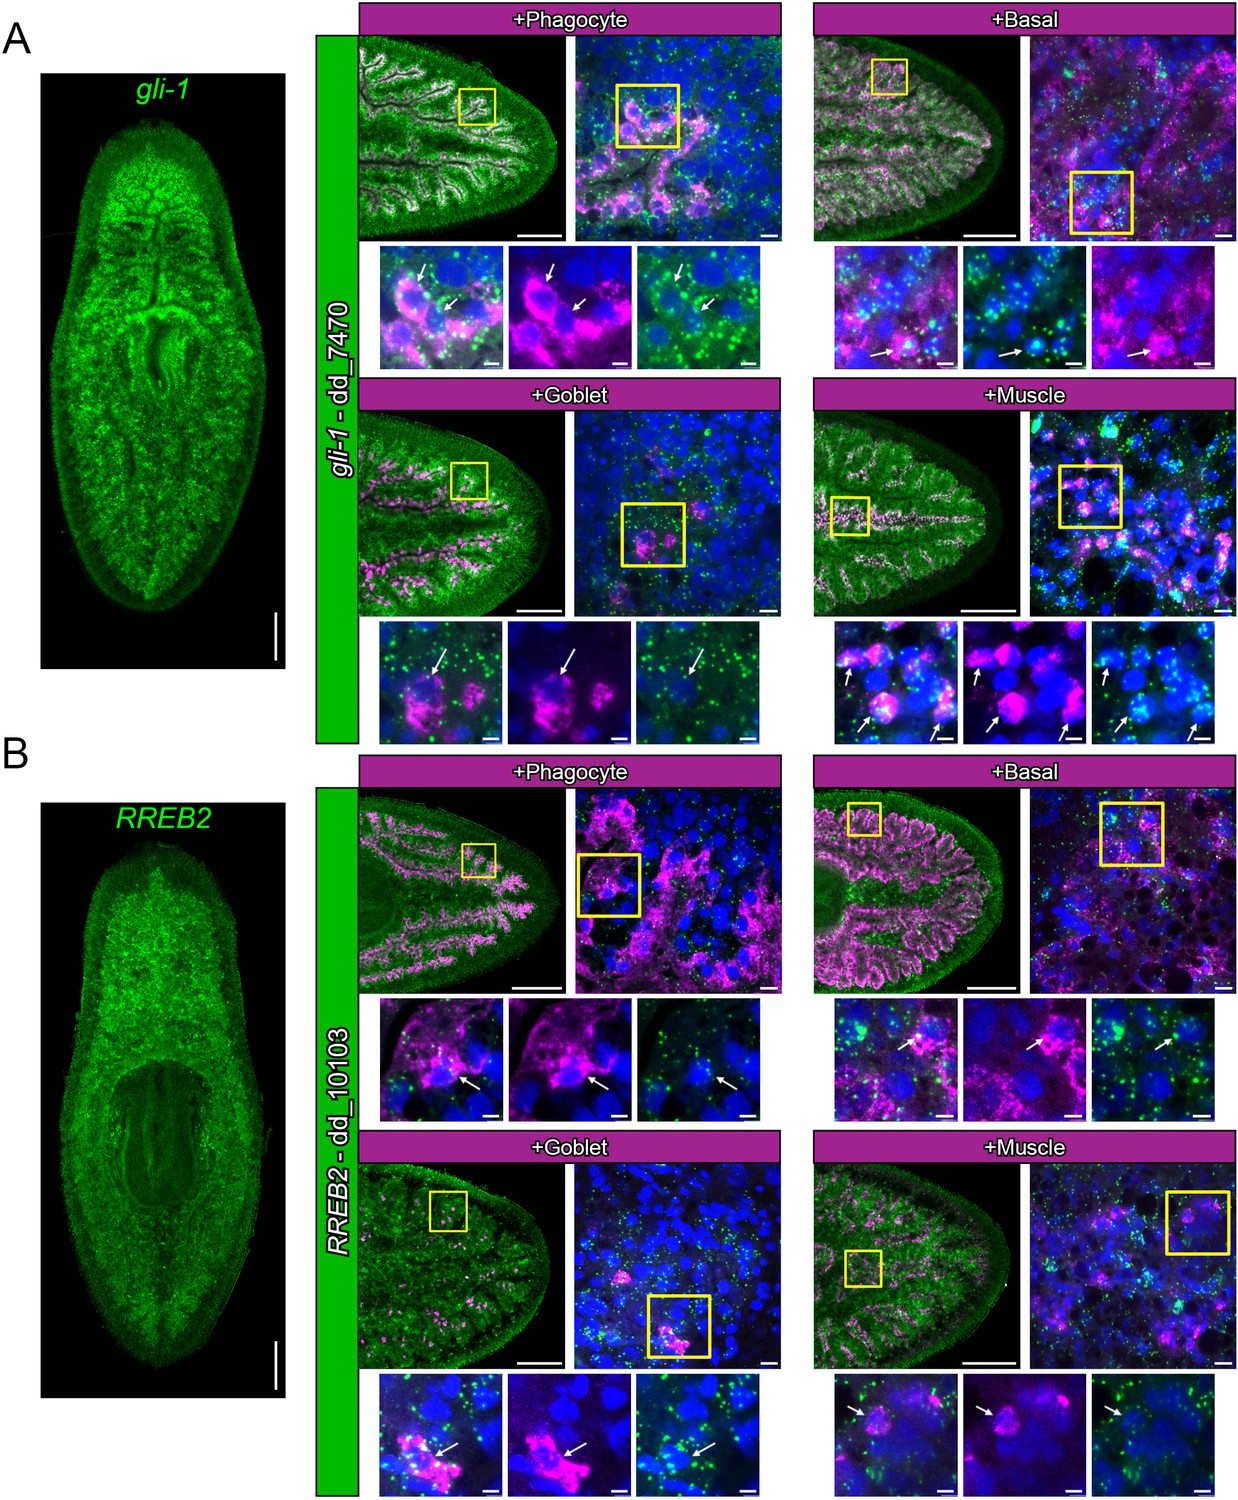
Expression patterns of gli-1 and RREB2.
(A) Global expression of gli-1 in uninjured animals, along with images of mRNA expression in phagocytes (ctsla), basal cells (slc22a6), goblet cells (npc2), and muscle cells (tni-4). (B) Expression of RREB2 in uninjured animals, along with mRNA co-localization with the same phagocyte, basal, goblet, and muscle cell markers as in A. Detailed gene ID information is available in Supplementary file 1. Scale bars, whole animals and tails 200 µm magnified images, 10 µm; digital zooms, 5 µm.
Figure 8—figure supplement 5
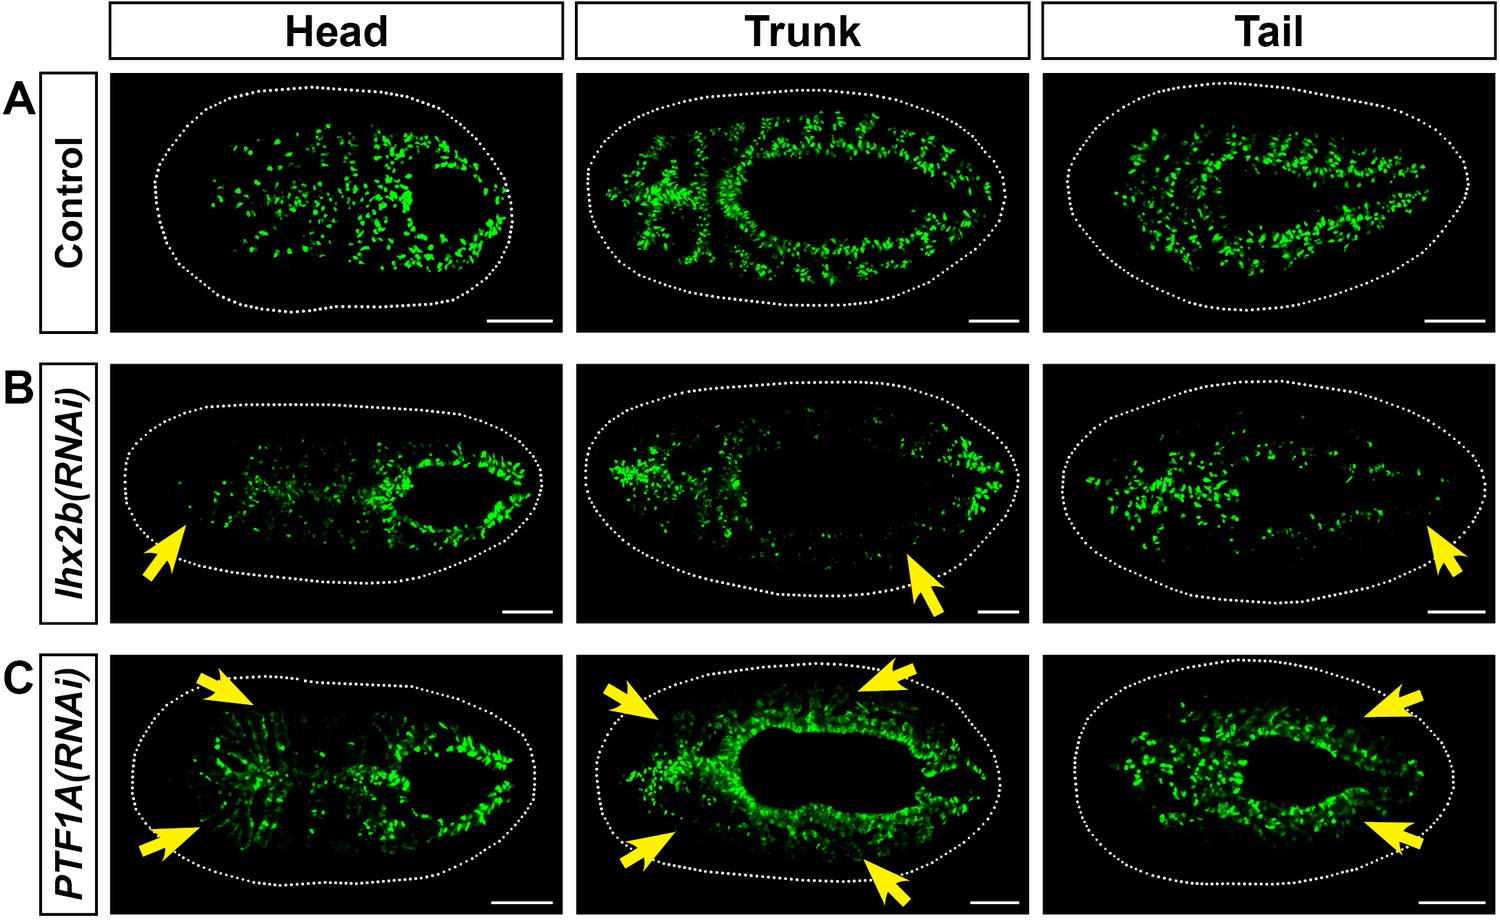
Additional genes whose knockdown affects goblet cell numbers in 7 day regenerates.
(A) Control RNAi regenerates with normal numbers of goblet cells. (B) Lhx2b RNAi reduces numbers of goblet cells in pre-existing tissue, but not in the blastema. (C) PTF1A RNAi mildly reduces levels of lateral goblet cells. All in situ hybridizations to detect npc2-positive goblet cells (green). Detailed gene ID information is available in Supplementary file 1 and Supplementary file 5. Scale bars, 200 μm.
Figure 8—figure supplement 6
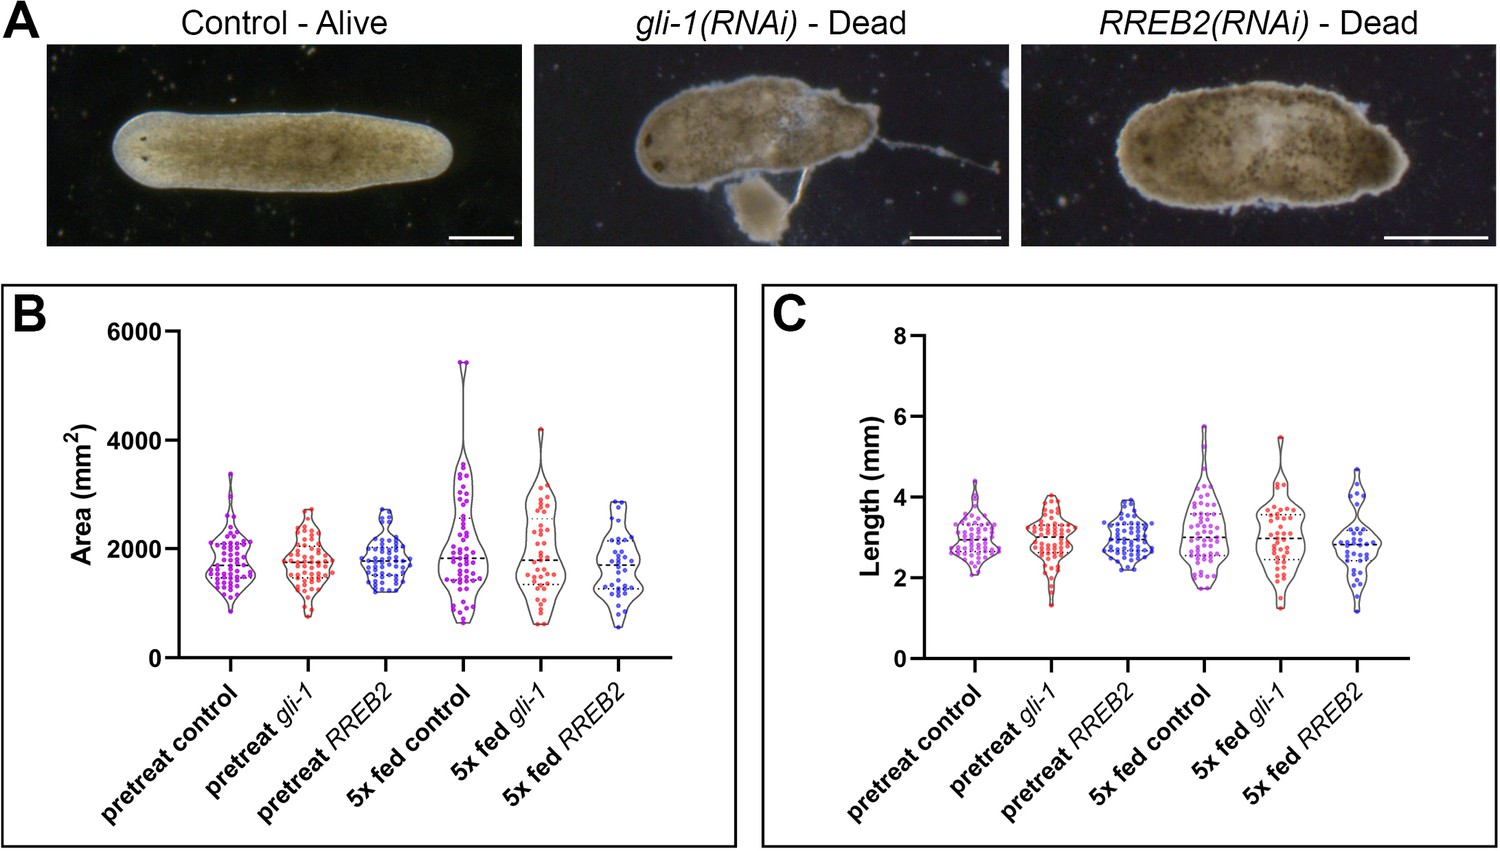
Phenotypes, area, and length of gli-1 and RREB2 knockdowns.
(A) Example images of viability phenotypes observed during dsRNA feeding. Scale bars, 500 µm. (B) Area measurements immediately before the first dsRNA feeding and seven days after the fifth dsRNA feedings (one feeding per week). No significant differences were observed between pre-treatment area sizes (n = 20 individuals at the beginning of N = 3 independent experiments for a total of n = 60 each). Modest, but insignificant differences were observed between 5x fed control (n = 57) and 5x fed gli-1 (n = 41, adj. p=0.8825), and between 5x fed control and 5x fed RREB2 (n = 36, adj. p=0.0986) (one-way ANOVA with Dunnett's T3 multiple comparisons test). Non-eating animals and dead animals were not included in final size analysis. (C) Length measurements from the same animals in (B) before and after dsRNA feeding. No significant differences were observed between the pretreat control, gli-1, and RREB2 animals, or between the 5x fed control and experiments (5x fed control vs 5x fed gli-1, adj. p=0.9364; 5x fed control vs. 5x fed RREB2, adj. p=0.2710) (one-way ANOVA with Dunnett's T3 multiple comparisons test). Thick dashed line indicates the median, the thin dashed lines indicate the upper and lower quartiles. Detailed numerical data are available in Figure 8—source data 1B.
Figure 9
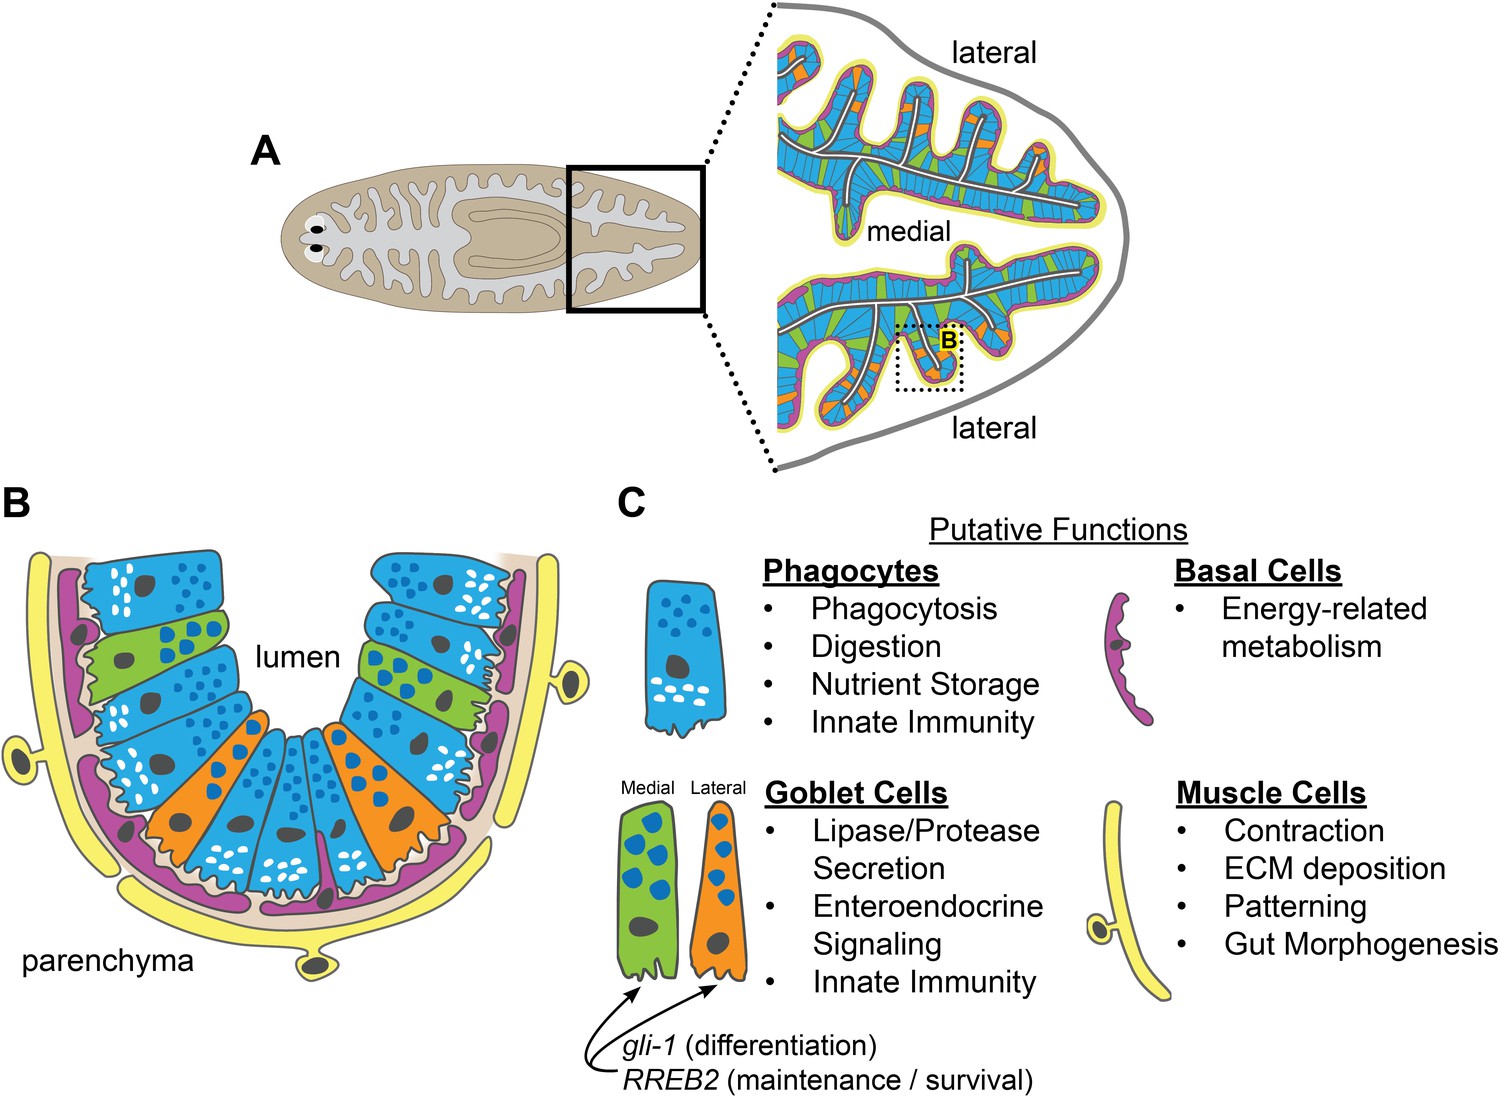
Schematic of intestinal cell types and putative functions.
(A) Illustration of cell types and locations in intestinal branches in the planarian tail. Phagocytes (blue); medial goblet cells (green); lateral goblet cells (orange); basal cells (magenta); visceral muscle (yellow). (B) Magnified view/horizontal section of the boxed area in (A), showing cell types and locations in one intestinal branch. Cell type colors as in (A). Basement membrane (light brown). (C) Putative cell type functions inferred from Gene Ontology, cell-type specific transcript expression, and published studies. Intestinal muscle functions inferred from Scimone et al. (2018).
Tables
Key resources table
| Reagent type (species) or resource | Designation | Source or reference | Identifiers | Additional information |
|---|---|---|---|---|
| Strain, strain background (Schmidtea mediterranea) | Asexual clonal line CIW4 of Schmidtea mediterranea | PMID:12421706 | RRID:NCBITaxon:79327 | All animals used in this study |
| Recombinant DNA reagent | pBluescript II SK(+) (plasmid) | Agilent Technologies | Cat:212205 | For cloning from ESTs |
| Recombinant DNA reagent | pJC53.2 (plasmid) | PMID:20967238 | RRID:Addgene_26536 | For cloning |
| Antibody | (mouse, monoclonal) Muscle antibody 6G10 | doi:10.1186/s12861-014-0050-9 | Used at 1:2000 | |
| Chemical compound, drug | Formaldehyde | EMD Millipore | Cat:FX0410-5 | Used at 4% in 1xPBS |
| Chemical compound, drug | Platinium Taq | Invitrogen | Cat:10966026 | For PCR |
| Chemical compound, drug | Trizol | Invitrogen | Cat:15596026 | Used for RNA extraction |
| Chemical compound, drug | RNAseZAP | Invitrogen | Cat:AM9780 | For LCM |
| Chemical compound, drug | Mayer’s Hematoxylin | Sigma Aldrich | Cat:MHS16-500ML | For LCM |
| Chemical compound, drug | Alcoholic Eosin Y | Sigma Aldrich | Cat:HT110116-500ML | For LCM |
| Commercial assay or kit | RNA Screen Tape | Agilent | Cat:5067–5576 | Used to verify RNA quality |
| Commercial assay or kit | PicoPure RNA Isolation Kit | Arcturus | Cat:12204–1 | For LCM |
| Commercial assay or kit | Quantseq 3’ mRNA Library Prep Kit FWD | Lexogen | Cat:K01596 | For RNA-seq |
| Commercial assay or kit | iScript Kit | Bio-Rad | Cat:1708891 | For cDNA synth |
| other | PEN membrane slides | Leica | Cat:11505158 | For LCM |
| Software, algorithm | Bestus Bioinformaticus Duk | DOE Joint Genome Institute | RRID:SCR_016969 | RNAseq read trimming |
| Software, algorithm | FastQC | Babraham Institute | RRID:SCR_014583 | RNAseq quality check |
| Software, algorithm | Bowtie2 | DOI:10.1038/nmeth.1923 | RNAseq transcript mapping | |
| Software, algorithm | Samtools v1.3 | PMID:19505943 | RRID:SCR_002105 | RNAseq processing |
| Software, algorithm | edgeR v3.8.6 | PMID:19910308 | RRID:SCR_012802 | RNAseq differential expression |
| Software, algorithm | TBLASTX | U.S. National Library of Medicine | RRID:SCR_011823 | For Human gene comparison |
| Software, algorithm | BLASTX | U.S. National Library of Medicine | RRID:SCR_001653 | Homology searches |
| Software, algorithm | BiNGO | PMID:15972284 | RRID:SCR_005736 | Gene Ontology |
| Software, algorithm | NCBI ORFinder | U.S. National Library of Medicine | RRID:SCR_016643 | For ORF identification |
| Software, algorithm | NCBI CD-Search | U.S. National Library of Medicine | For mucin domain search | |
| Software, algorithm | Pfam 31.0 | DOI:10.1093/nar/gkv1344 | RRID:SCR_004726 | For mucin domain search |
| Software, algorithm | SMART | DOI: 10.1093/nar/gkx922 | RRID:SCR_005026 | For mucin domain search |
| Software, algorithm | Zen (version 11.0.3.190 2012-SP2) | Zeiss | RRID:SCR_013672 | For microscope images |
| Software, algorithm | ImageJ (1.51 k) | DOI:10.1038/nmeth.2089 | RRID:SCR_002285 | For area and length analysis |
| Software, algorithm | R Studio (1.2.1335) | RStudio, Inc | RRID:SCR_000432 | For bioinformatics |
| Software, algorithm | Prism (v8.3.0) | GraphPad | RRID:SCR_002798 | Graphing |
Additional files
-
Supplementary file 1
RNA-Seq and other data for 1,844 intestine-enriched transcripts.
(S1A) Summary of RNA-Seq data and whole-animal in situ expression patterns for 1844 transcripts enriched in laser-captured planarian intestine, together with phagocyte expression, single-cell RNA-Seq data, best BLAST hits for human/mouse/zebrafish/fly/C. elegans, cloning primers, and transcript sequences. Single-cell data from Plass et al. (2018) reprinted with permission from AAAS. (S1B) Figure locations for transcript expression patterns shown in the manuscript.
- https://cdn.elifesciences.org/articles/52613/elife-52613-supp1-v1.xlsx
-
Supplementary file 2
RNA-Seq and other data for all 13,136 transcripts detected in laser-captured tissue.
Summary of RNA-Seq data, together with phagocyte expression, single-cell RNA-Seq data, best BLAST hits for human/mouse/zebrafish/fly/C. elegans, and transcript sequences. Single-cell data from Plass et al. (2018) reprinted with permission from AAAS.
- https://cdn.elifesciences.org/articles/52613/elife-52613-supp2-v1.xlsx
-
Supplementary file 3
Intestinal transcripts in Gene Ontology categories.
(S3A) Examples of intestine-enriched transcripts (LCM) annotated with digestive physiology-related GO Biological Process Terms. (S3B) Transcripts predicted to encode intestine-enriched solute carrier proteins (SLCs). (S3C) Transcripts predicted to encode intestine-enriched Rab GTPases. (S3D) Transcripts predicted to encode intestine-enriched tumor necrosis factor receptor associated factors (TRAFs). Single cell data from Plass et al. (2018) reprinted with permission from AAAS.
- https://cdn.elifesciences.org/articles/52613/elife-52613-supp3-v1.xlsx
-
Supplementary file 4
Intestinal transcripts with human homologs enriched in digestive tissues.
Examples of intestine-enriched transcripts (LCM) with human RBH homologs enriched in human digestive tissues at the transcript level (Uhlén et al., 2015). Transcript entries include LCM RNA-Seq data, together with WISH patterns, phagocyte expression, and single-cell RNA-Seq data. Single-cell data from Plass et al. (2018) reprinted with permission from AAAS.
- https://cdn.elifesciences.org/articles/52613/elife-52613-supp4-v1.xlsx
-
Supplementary file 5
RNA interference results for intestine-enriched transcription factors and mediolaterally enriched transcripts.
(S5A) RNAi results for medially enriched transcripts. (S5B) RNAi results for laterally enriched transcripts. (S5C) RNAi results for transcription factors.
- https://cdn.elifesciences.org/articles/52613/elife-52613-supp5-v1.xlsx
-
Transparent reporting form
- https://cdn.elifesciences.org/articles/52613/elife-52613-transrepform-v1.docx
Download links
A two-part list of links to download the article, or parts of the article, in various formats.
Downloads (link to download the article as PDF)
Open citations (links to open the citations from this article in various online reference manager services)
Cite this article (links to download the citations from this article in formats compatible with various reference manager tools)
Cell-type diversity and regionalized gene expression in the planarian intestine
eLife 9:e52613.
https://doi.org/10.7554/eLife.52613


