Whole brain delivery of an instability-prone Mecp2 transgene improves behavioral and molecular pathological defects in mouse models of Rett syndrome
- Stem Cell and Neurogenesis Unit, Division of Neuroscience, San Raffaele Scientific Institute, Italy
- CNR Institute of Neuroscience, Italy
- San Raffaele Telethon Institute for Gene Therapy (SR-Tiget), San Raffaele Scientific Institute IRCCS, Via Olgettina, Italy
- National Institute of Molecular Genetics (INGM), Italy
- Stanley Center for Psychiatric Research at Broad Institute, United States
Figures
Figure 1
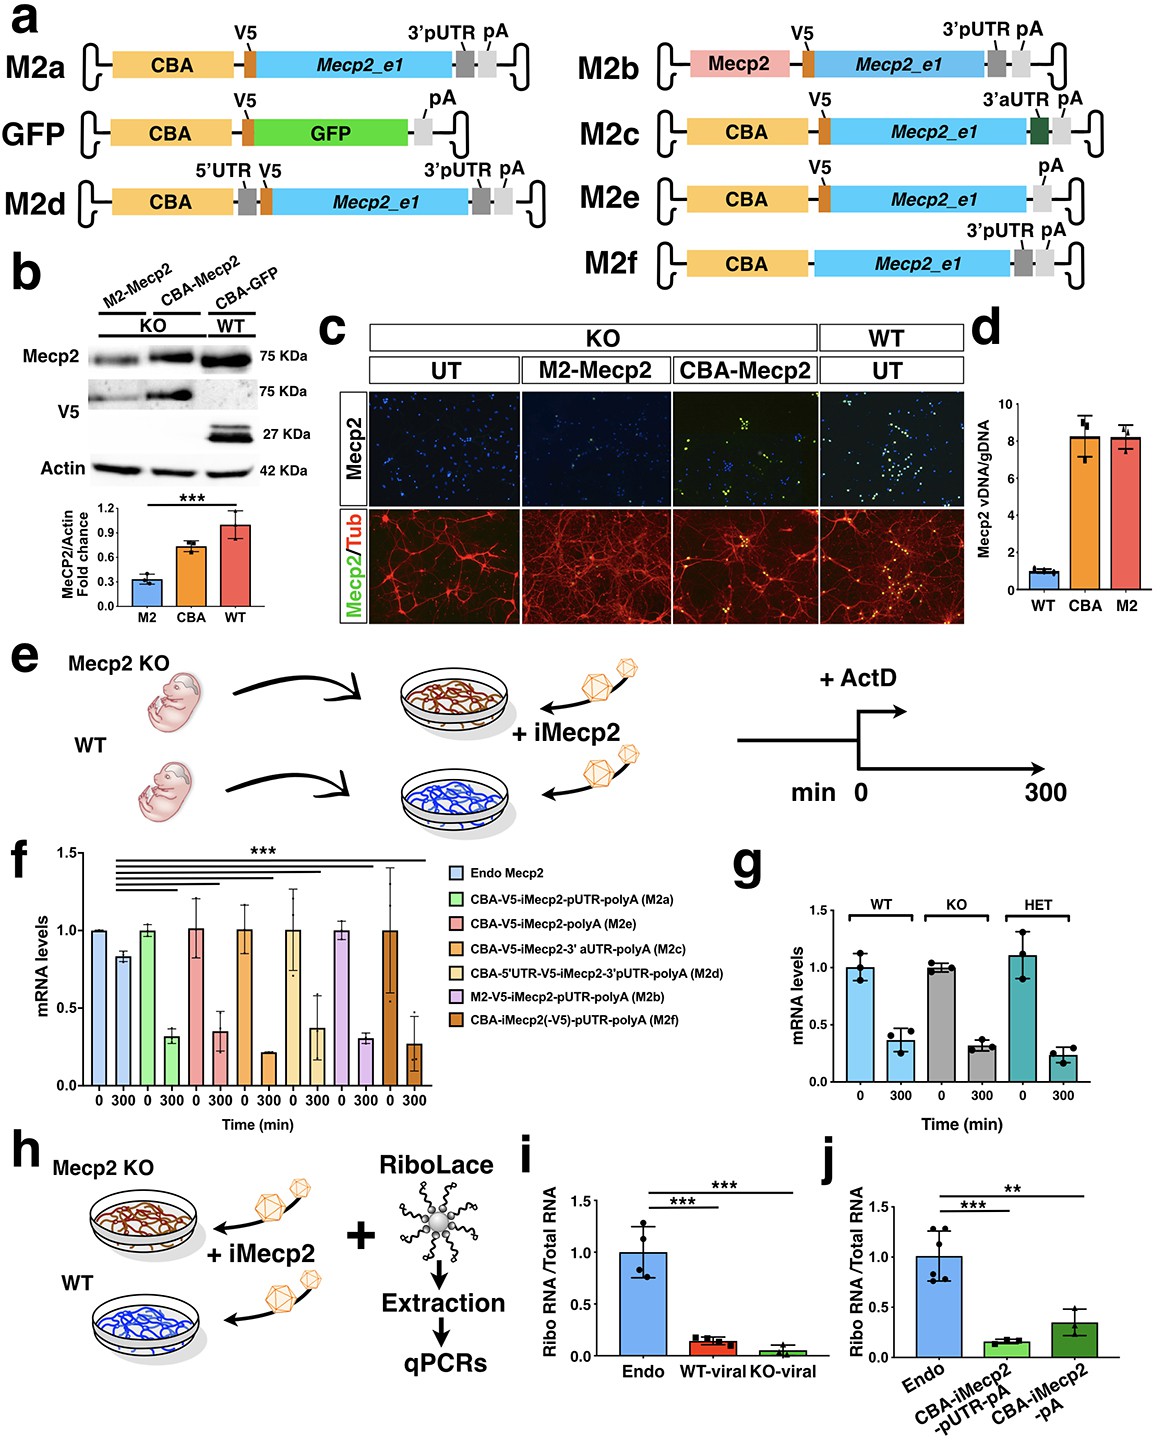
RNA stability and translational efficiency of the viral Mecp2 transgene.
(a) Illustration of the AAV vectors expressing V5-tagged Mecp2_e1 or GFP under the control of Chicken β-Actin (CBA) promoter or Mecp2 core promoter. Vectors included murine Mecp2 coding sequence with either its own proximal 3’UTR (3’pUTR, M2a), or a synthetic 3’UTR sequence (3’aUTR, M2c), or both 3’pUTR and 5’UTR (M2d), or no UTR (M2e), or without the V5 tag (M2f). (b) Western blot analysis for V5, Mecp2 and Actin protein levels in GFP infected (control, CBA-GFP) WT neurons and Mecp2-/y (KO) neurons infected with CBA-Mecp2 and M2-Mecp2. Quantification was performed using densitometric analysis of Mecp2 relative to Actin signal and expressed in arbitrary units (n = 3) (c) Immunostaining of KO (control untreated and infected with M2-Mecp2 or CBA-Mecp2) and wild-type neurons for Mecp2 and TUBB3 (Tub). (d) qRT-PCR quantification of viral Mecp2 DNA copies in Mecp2 KO neurons relative to genomic DNA (n = 3). (e) Illustration of the experimental work-flow to study the RNA stability in KO and WT neurons (f) RNA stability of endogenous (in WT neurons) and viral (from the 5 different vectors described above in KO neurons) Mecp2 transcript determined by qRT-PCRs (n = 3, t = 300 min were normalized over t = 0 values and compared among different treatments). (g) RNA stability of viral (CBA-iMecp2-pUTR-pA) Mecp2 transcript in neurons derived from different genotypes: WT, KO and Mecp2+/- (Het) determined by qRT-PCRs (n = 3, t = 300 min were normalized over t = 0 values and compared among different treatments) (h) Illustration of the experimental work-flow to study translational efficiency. (i) qRT-PCR of viral and endogenous Mecp2 RNA in the ribosomal fraction normalized on the total RNA in WT and KO neurons (n = 4 endogenous Mecp2, n = 4 exogenous Mecp2 in KO neurons, n = 3 exogenous Mecp2 in WT neurons). (j) qRT-PCR of viral and endogenous Mecp2 RNA in the ribosomal fraction normalized on the total RNA in WT (n = 6) and KO neurons infected with 2 different viral Mecp2 construct with (CBA-iMecp2-pUTR-pA, n = 3) and without (CBA-iMecp2-pA, n = 3) the 3’-pUTR. Error bars, Standard Deviation (SD). **p<0.01, ***p<0.001, compared groups are indicated by black lines. ANOVA-one way, (b, f, g, i, j) and Tukey’s post hoc test. Scale bar: 100 µm (c).
Figure 2
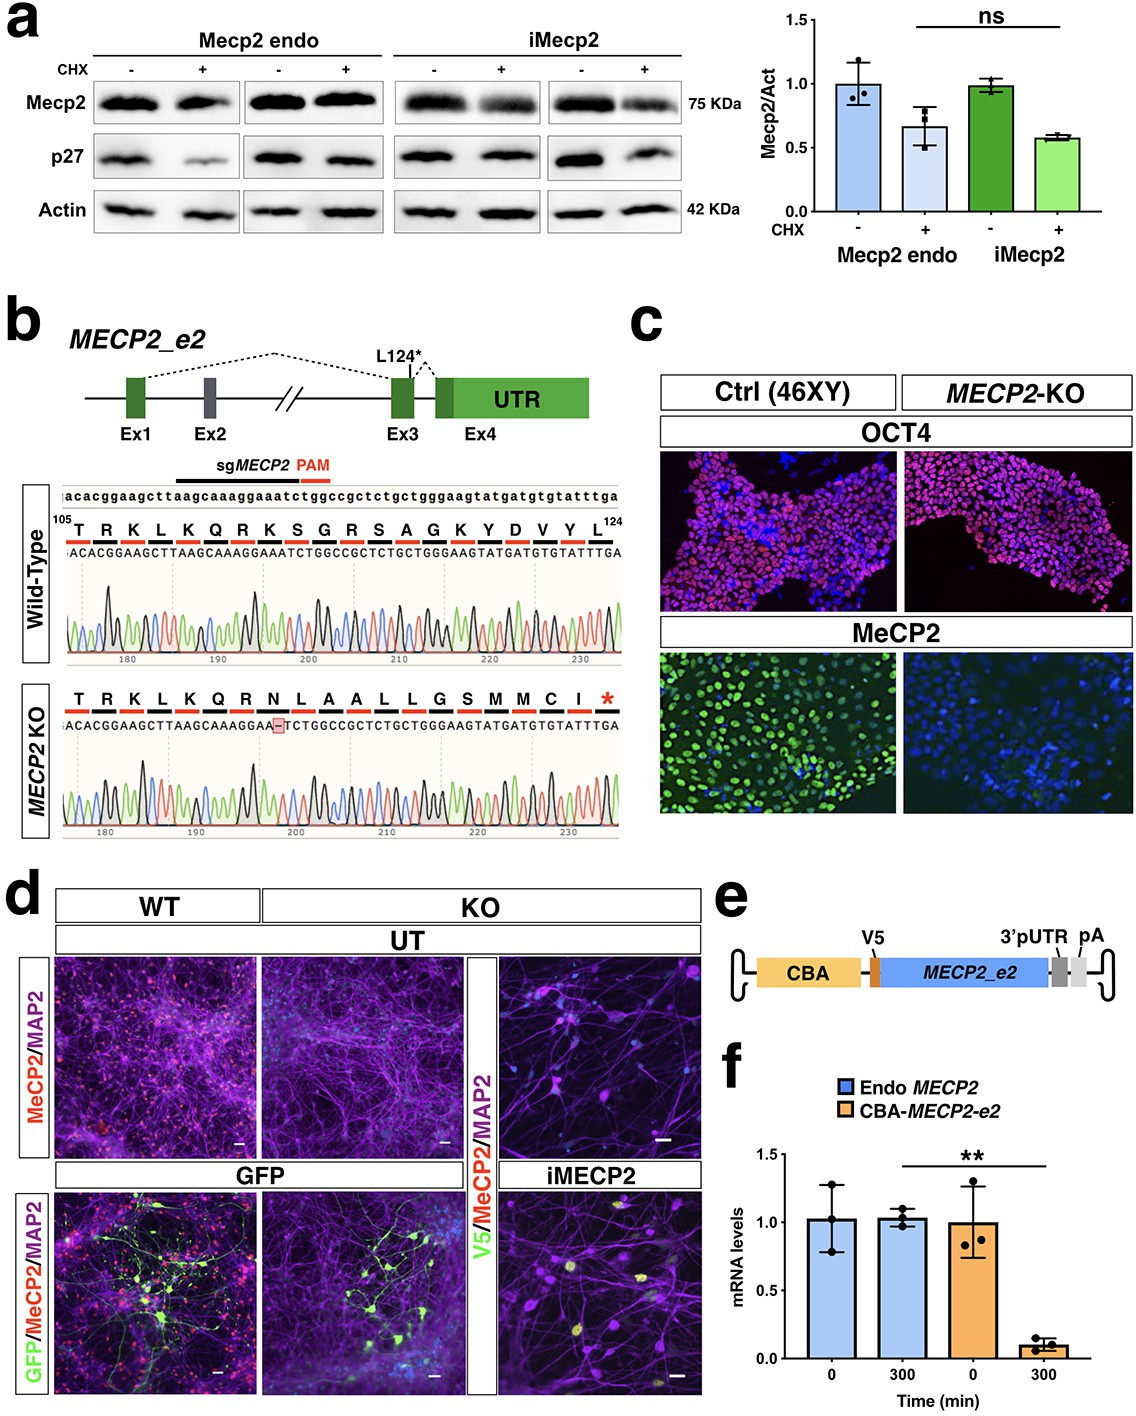
Mouse protein stability and stability of the viral human iMECP2 construct in iPSC-derived cortical neurons.
(a) Protein stability was assessed in murine neurons using western blot analysis to quantify Mecp2 and p27 protein reduction after Cycloheximide treatment (50 uM, CHX, 8 hr) over Actin protein and corresponding densitometric quantification expressed in arbitrary units (right panel) (n = 3). t = 8 hr were normalized over t = 0 values and compared among different treatments (ns = p > 0.05, ANOVA-one way, Tukey’s post hoc test). (b) Illustration of the CRISPR-Cas9 based strategy for genetic editing of male control human iPSCs to obtain MECP2 KO cells. The sgRNA selected for this approach annealed on exon 3 of the MECP2 gene and generated a single nucleotide deletion. That resulted in a frameshift of its coding sequence and a premature STOP codon 12 residues downstream. (c) Human iPSCs carrying this mutation (MECP2 KO) maintained their pluripotency marker Oct4 but did not presented detectable MeCP2 protein as tested by immunofluorescence when compared to control cells (Ctrl). (d) WT and MECP2-/y iPSCs were successfully differentiated into neurons (MAP2 staining) and transduced using PHP.eB vectors carrying either GFP or iMECP2. Immunofluorescence respectively for GFP and MeCP2 attested neuronal transduction. (e) Schematics of the AAV vector used for RNA stability experiment and expressing V5-tagged MECP2_e2 under the control of Chicken β-Actin (CBA) promoter. (f) MECP2 RNA stability was determined by qRT-PCRs in WT neurons, to test the endogenous transcript (blue bars, n = 3), and in KO neurons infected with the aforementioned vector, to test the viral transcript (yellow bars n = 3). t = 300 min were normalized over t = 0 values and compared among different treatments. UT: untreated.
Figure 3 with 4 supplements
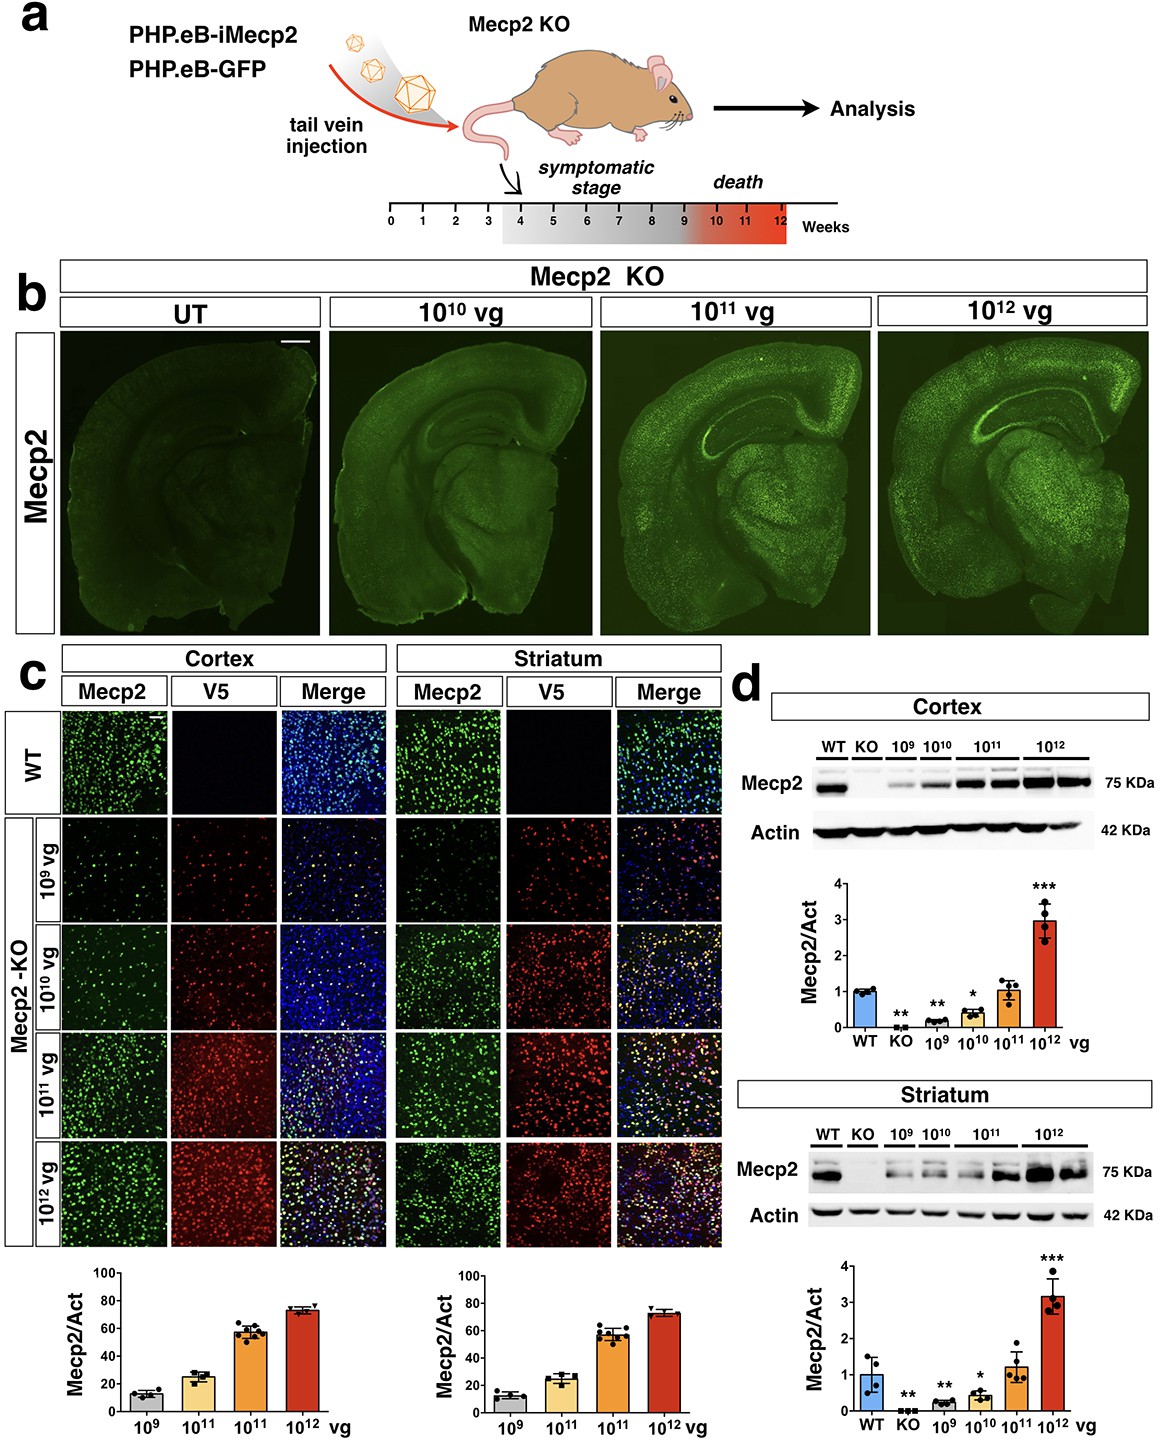
PHP.eB-mediated iMecp2 gene transfer in symptomatic Mecp2-/y mouse brains.
(a) Illustration of the experimental setting to restore the expression of Mecp2 in symptomatic mutant animals by AAV-PHP.eB systemic transduction. (b) Low magnification of Mecp2 immunostaining in brains of KO control untreated (UT) and treated animals (1×10¹⁰, 1×10¹¹, 1×10¹² vg/mouse). (c) High magnification immunostaining for Mecp2 and V5 in cortex and striatum derived from wild-type (WT) and Mecp2 treated KO (1×10⁹, 1×10¹⁰, 1×10¹¹, 1×10¹² vg/mouse) animals (Mecp2-KO). Nuclei were stained with DAPI (merge panels). Bottom panel: bar graphs showing the fraction of Mecp2 positive on the total DAPI positive (n = 4 for 1×10⁹–1×10¹⁰–1×10¹²; n = 8 1×10¹¹ vg/mouse). (d) Western blot analysis to quantify Mecp2 over Actin protein levels in cortex (upper panel) and striatum (lower panel) derived from WT, untreated KO and iMecp2 treated KO (1×10⁹, 1×10¹⁰, 1×10¹¹, 1×10¹² vg/mouse) animals and corresponding densitometric quantification expressed in arbitrary units (n = 4 for 1×10⁹–1×10¹⁰–1×10¹²; n = 5 1×10¹¹ vg/mouse). Error bars, SD. *p<0.05, **p<0.01 and ***p<0.001 as compared to WT mice (ANOVA-one way with Tukey’s post hoc test). Scale bars: 500 µm (b), 20 µm (c).
Figure 3—figure supplement 1
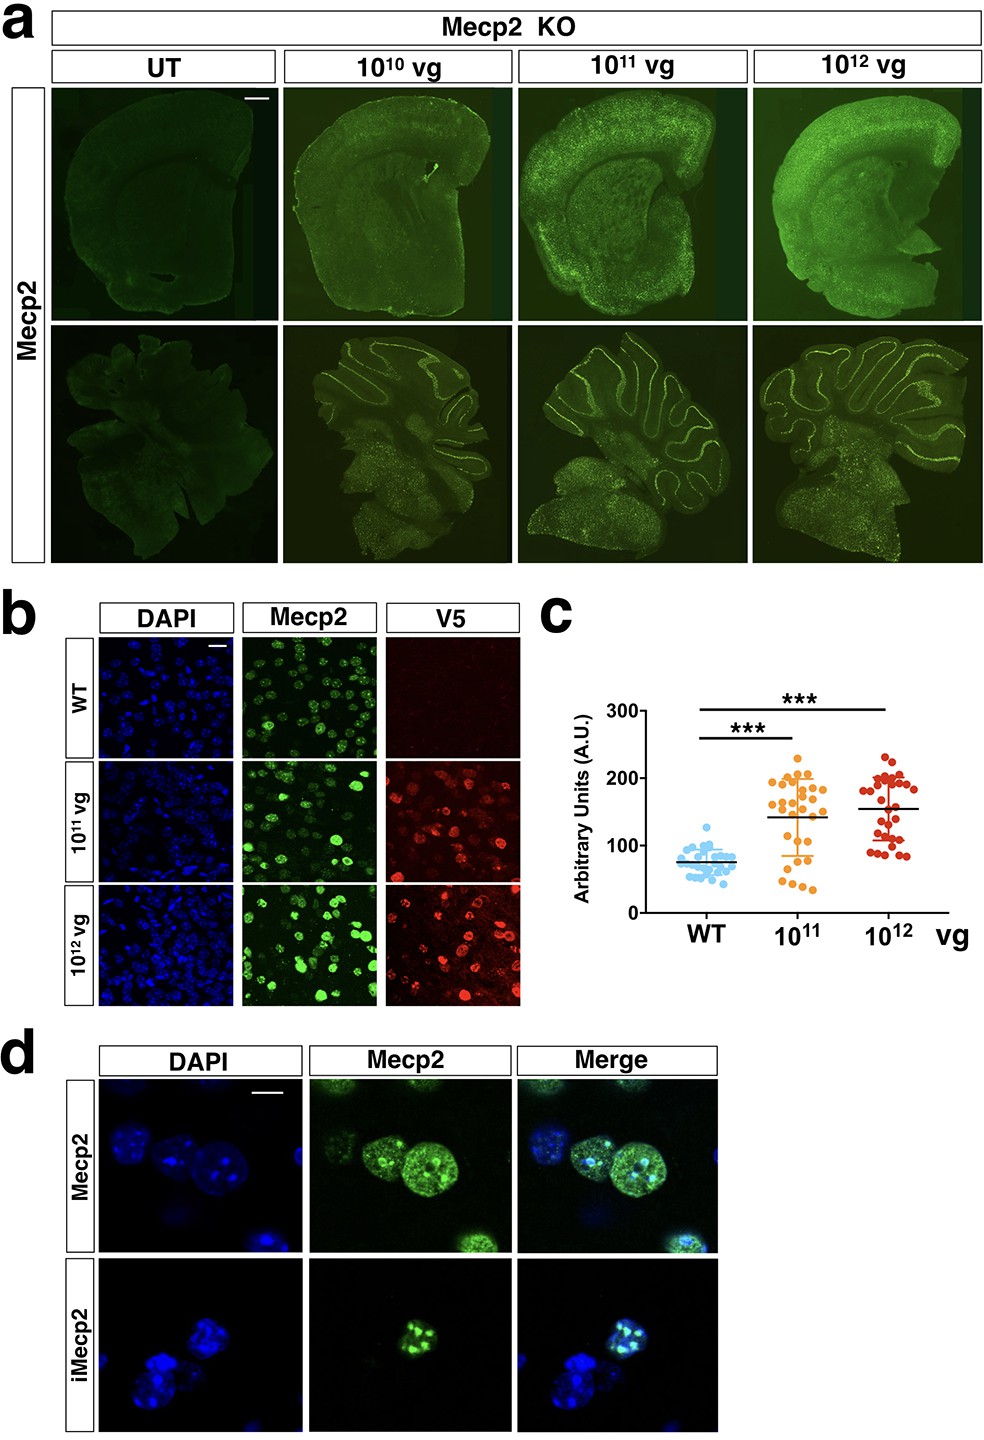
Distribution and quantification of iMecp2 gene transfer in Mecp2-/y brains.
(a) Low magnification of Mecp2 immunostaining of forebrain (upper panel) and cerebellum (lower panel) sections in KO control untreated (UT) and treated animals (1×10¹⁰, 1×10¹¹, 1×10¹² vg/mouse). (b) High magnification confocal images for Mecp2 and V5 in cortex derived from WT and iMecp2 treated KO (untreated [WT], 1×10¹¹ and 1×10¹² vg/mouse) animals. Nuclei were stained with DAPI. Scale bar: 10 μm. (c) graphs showing the quantification of cellular levels of total Mecp2 detected with anti-MeCP2 immunofluorescence in cells of the cortex and quantified in arbitrary units based on field pixel intensity (n = 30 nuclei for per condition, UN: untransduced). (d) High magnification confocal images of wild-type (WT, upper panel) and iMecp2 transduced nuclei (lower panel) stained with MeCP2 antibody both exhibit heterochromatin-enriched localization. Error bars, SD. ***p<0.001 as compared to untreated (WT) (ANOVA-one way, Tukey’s post hoc test). Scale bars: 500 µm (a), 10 µm (b), 5 µm (d).
Figure 3—figure supplement 2
Analysis of transduced neurons after iMecp2 gene transfer in Mecp2-/y brains.
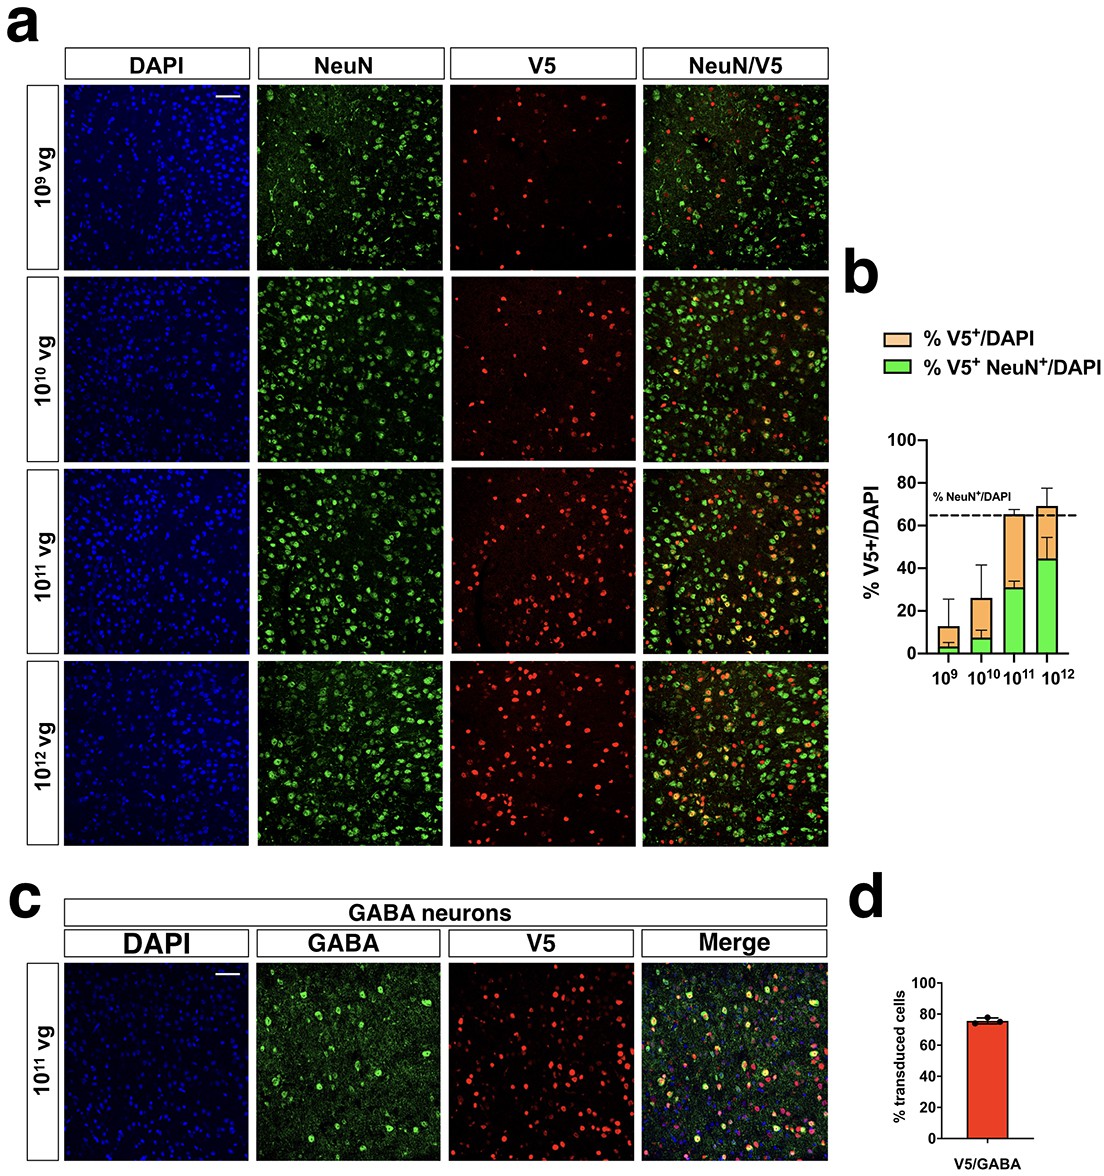
(a) Characterization of iMecp2-transduced cells in KO cortex (1×10⁹, 1×10¹⁰, 1×1011,1×1012 vg/mouse) using colocalization of V5+ cells with a neuronal marker (NeuN). (b) Quantification of V5+ cells on total DAPI+ cells (orange bar) and V5+/NeuN+ cells on total DAPI+ cells (green bar). Dashed line indicates the number of NeuN+ cells on total DAPI+ cells. (c–d) Colocalization and quantification of transduced (V5+) GABAerigic interneurons (marked with GABA, GABA+) in iMecp2-transduced KO cortexes of animals treated with a 1×10¹¹ vg/mouse dose. Nuclei were stained with DAPI. All images were captured using confocal microscope. Scale bar: 50 μm. n = 3 animals per group.
Figure 3—figure supplement 3
Analysis of transduced astrocytes after iMecp2 gene transfer in Mecp2-/y brains.
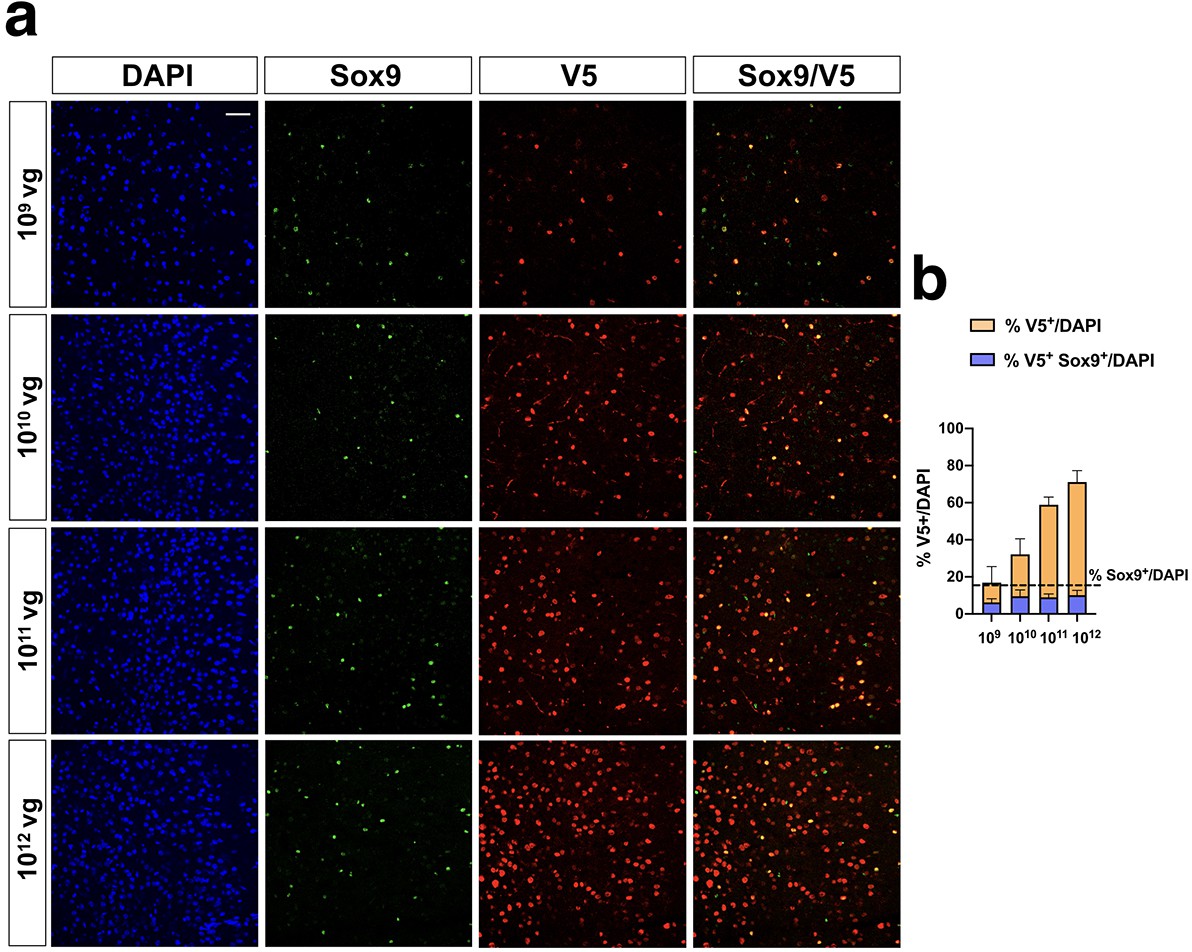
(a) Characterization of iMecp2-transduced cells in KO cortex (1×10⁹, 1×10¹⁰, 1×1011,1×1012 vg/mouse) using colocalization of V5+ cells with an astrocytic marker (Sox9). (b) Quantification of V5+ cells on total DAPI+ cells (orange bar) and V5+/Sox9+ cells on total DAPI+ cells (blue bar). Dashed line indicates the number of Sox9+ cells on total DAPI+ cells. Nuclei were stained with DAPI. All images were captured using confocal microscope. Scale bar: 50 μm. n = 3 animals per group.
Figure 3—figure supplement 4

Characterization of iMecp2 transgene expression in brain and liver of Mecp2-/y animals.
(a) Vector biodistribution (upper panel) and transgene expression (lower panel) in mice cortex and liver of KO mice untreated (KO, n = 3) and treated with 1×10¹¹ (n = 3) or 1×10¹² (n = 3) iMecp2. Data were normalized over Mecp2 gene levels and expression of wild-type mice (WT, light blue bar), respectively. (b) Western blot analysis to quantify Mecp2 over Actin protein levels in liver (left panel) from WT, untreated and iMecp2 treated (1×10¹⁰, 1×10¹¹, 1×10¹² vg/mouse) KO animals and corresponding densitometric quantification expressed in arbitrary units (n = 5 for 1×10¹⁰, n = 7 for 1×10¹¹; n = 5 for 1×10¹² vg/mouse). Error bars, SD. ***p<0.001 as compared wild-type (WT) (ANOVA-one way, Tukey’s post hoc test).
Figure 4 with 1 supplement
iMecp2 elicits a strong immune response in Mecp2-/y but not wild-type mice.
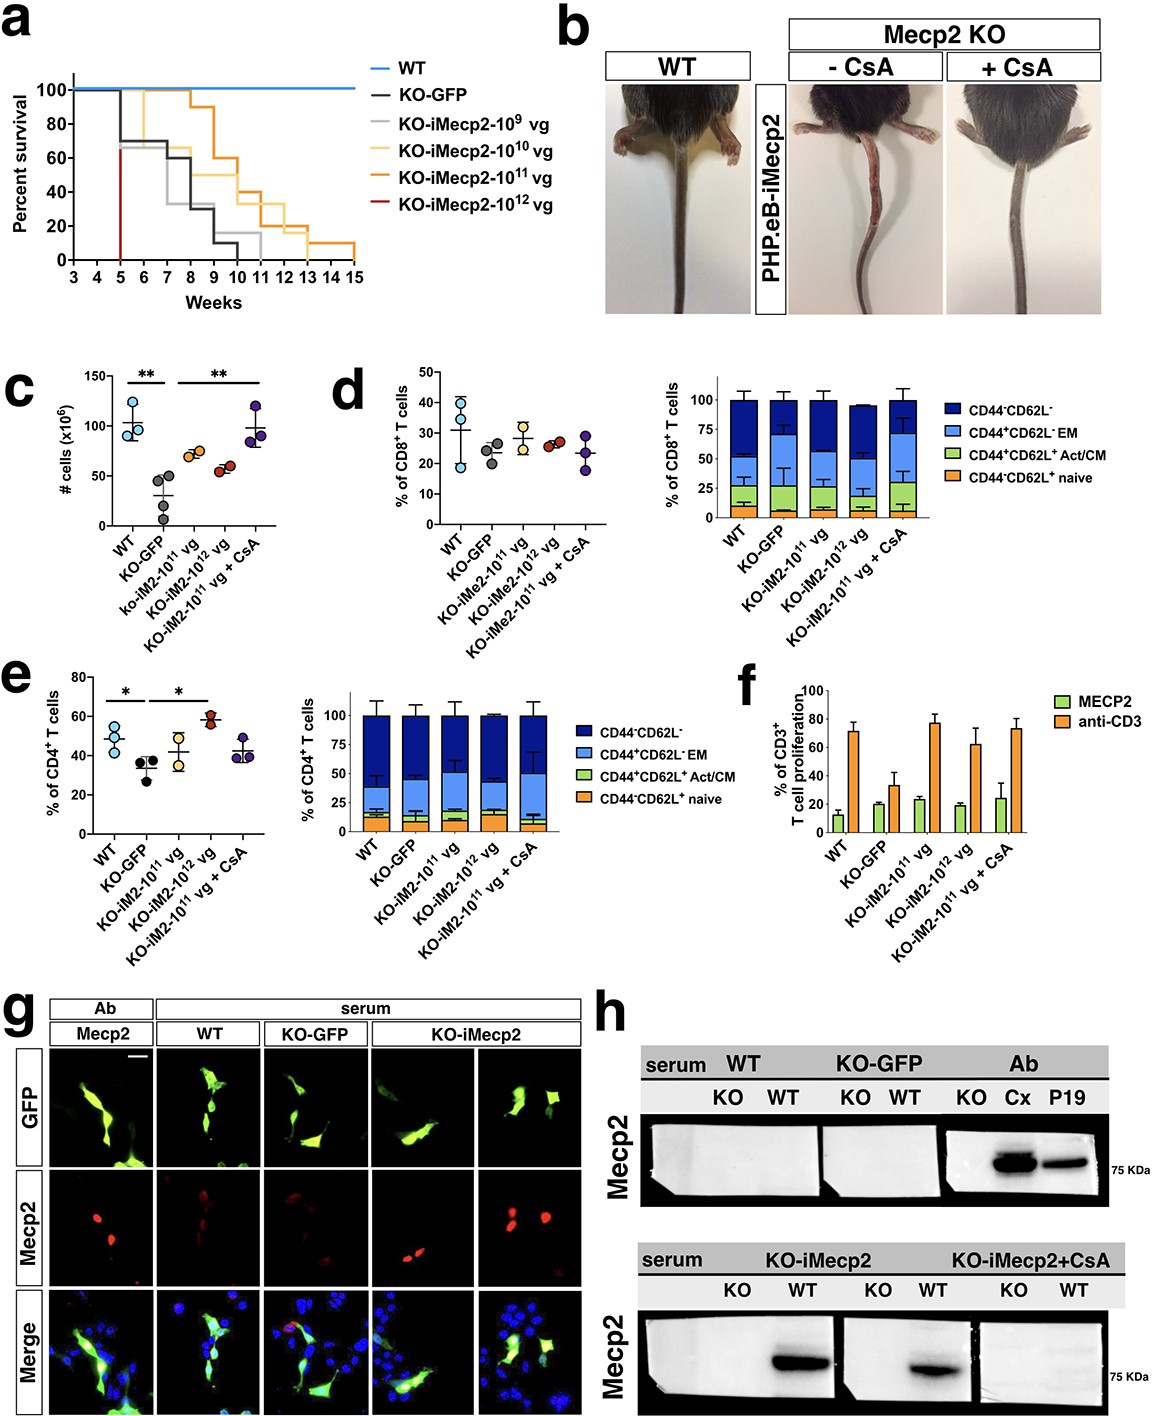
(a) Kaplan-Meier survival plot for KO mice injected with different doses (1×10⁹ [n = 6], 1×10¹⁰ [n = 6], 1×10¹¹ [n = 10], 1×10¹² [n = 6] vg/mouse) of PHP.eB-iMecp2 compared to KO treated with PHP.eB-GFP (KO-GFP, n = 10) and WT (n = 14) animals. Mice treated with 1×10¹¹ vg/mouse dosage had a median survival period significantly longer than that of vehicle-treated controls (p<0.01, Mantel-Cox test). (b) 9 out of 12 KO mice injected with a 1*1011 dose of PHP.eB-iMecp2 presented with exudative lesions after 2–3 weeks from viral injection (medial panel, representative picture), whereas 7 out of 10 KO mice injected with the same dosage and treated with cyclosporine (CsA) (10 mg/Kg) were robustly improved (right panel, representative picture). (c–e) Spleen cells from Mecp2-/y mice left untreated or injected with a 1×10¹¹ dose of PHP.eB-iMecp2 alone or in combination with CsA or with 1×10¹² dose of PHP.eB-iMecp2 were counted. Frequencies of CD4+ and CD8+ T cell compartments were quantified in the spleen of treated mice by FACS staining. (f) Total splenocytes were labeled with Cell Proliferation Dye eFluor 670 and stimulated with bone-marrow derived DC transduced with LV-Mecp2 or with anti-CD3 antibodies and proliferation was measured at day 4 by flow cytometry. Mean ± SEM of Mecp2-/y mice untreated (n = 3) or injected with a 1×10¹¹ dose of PHP.eB-iMecp2 alone (n = 3) or in combination with cyclosporine (n = 3) or with 1×10¹² dose of PHP.eB-iMecp2 (n = 2) are shown. (g) Detection of immune-specific antibody in sera of KOanimals mock-treated (KO-GFP) or iMecp2-treated (KO-iMecp2) as well as iMecp2-treated WT animals (WT) was revealed by immunofluorescence assay and compared with a commercial antibody as positive control (Ab). We choose as substrate P19 cells knock-out for the Mecp2 gene and co-transfected with GFP and Mecp2 expression constructs in order to track with GFP the Mecp2+ cells. (h) Similar sera were also tested in western blot analysis using protein extracts form WT and KO tissue respectively as positive and negative controls. WT P19 extract were also used as positive control. Each dot represents one mouse. Error bars, SEM Scale bar: 10 µm. Mann-Whitney U test (two-tailed), with unpaired t-test (c–f), *p<0.05, **p<0.01, compared groups are indicated by black lines.
Figure 4—figure supplement 1

Behavioral rescue of symptomatic Mecp2-/y animals after PHP.eB-iMecp2 treatment.
(a) General phenotypic assessment evaluated through the aggregate severity score (p<0.05 versus KO-GFP in 1×10¹⁰ [7th-10th wk] and in 1×10¹¹ [6th-10th wk]). (b) Mouse body weight was monitored every two weeks and represented as mean of each group (p<0.05 versus KO-GFP in 1×10¹⁰ [5th-10th week, wk] and in 1×10¹¹ [7th-9th wk]). (c) Spontaneous locomotor activity was tested in a spontaneous field arena and shown as representative traces and quantification of total distance. (**p<0.01 and ***p<0.001 as compared to WT mice). (d) Representative pictures of animals WT, KO and KO treated with most efficacious dose (1×10¹¹) indicate the absence of hindlimb clasping in KO treated animals up to 14 weeks of age. (e,f) All groups of animals were tested for motor coordination using beam balance test and quantified as crossing time (e), p<0.05 versus KO-GFP in 1×10¹⁰ [7th-10th wk] and in 1×10¹¹ [7th-9th wk]) and number of errors (f) p<0.05 versus KO-GFP in 1×10¹⁰ [8th-10th wk] and in 1×10¹¹ [7th-10th wk]). Error bars, SD. ANOVA-two way (b, e, f, g) or ANOVA-one way (c) with Tukey’s post hoc test.
Figure 5
Behavioral rescue of symptomatic Mecp2-/y animals after PHP.eB-iMecp2 treatment in combination with cyclosporine.
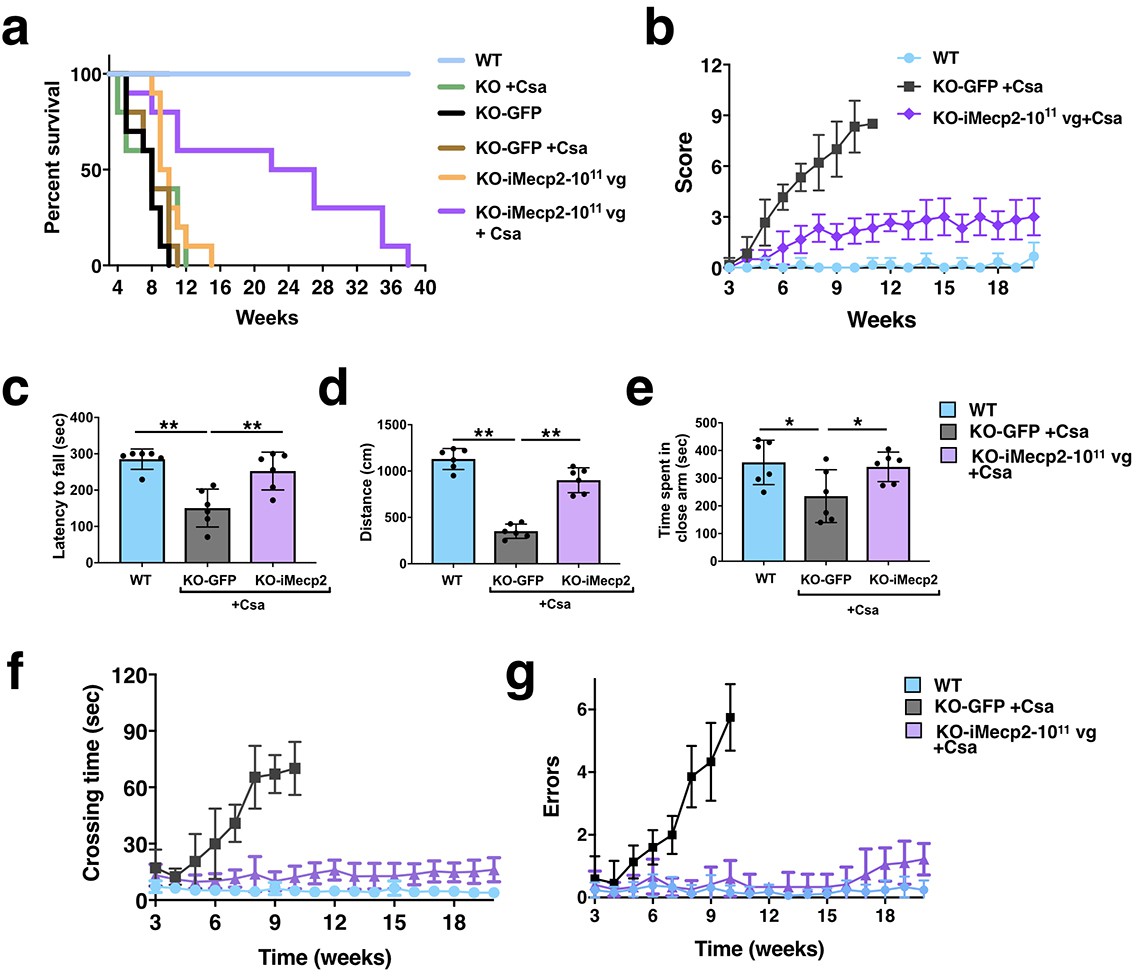
(a) Survival curve of KO mice Cyclosporine (CsA) treated (n = 5, green line) and GFP-treated alone (n = 10, black line) or in combination with cyclosporine (CsA) (n = 6, brown line) or injected with a 1×10¹¹ dose of PHP.eB-iMecp2 alone (n = 10, orange line) or in combination with cyclosporine (CsA) (n = 10, violet line). As control, WT littermates were used (n = 12, blue line). (b) General phenotypic assessment evaluated through the aggregate severity score (p<0.05 versus KO-GFP + Csa in 1×10¹¹ + Csa [5th-11th wk]). (c–e) Evaluation of the latency to fall from the Rotarod analysis (c), the distance of the spontaneous locomotor activity in a field arena (d) and the time spent in close arm in the elevated plus maze (e) 5 weeks after treatment and control mice (**p<0.01 and ***p<0.001 as compared to WT mice and KO-iMecp2 + Csa; n = 6 mice per groups). (f–g) Evaluation of motor coordination through beam balance test quantified as crossing time (f, p<0.05 versus KO-GFP + Csa in 1×10¹¹ + Csa [6th-10th wk]) and number of errors (g, p<0.05 versus KO-GFP + Csa in 1×10¹¹ + Csa [7th-10th wk]). Error bars, SD. ANOVA-two way (b, f, g) or ANOVA-one way (c, d, e) with Tukey’s post hoc test.
Figure 6

Global gene expression profile of Mecp2-/y cortices transduced with PHP.eB-iMecp2.
(a) Venn diagram showing the genes differentially expressed in the two comparisons, namely Mecp2 KO (supplied with a mock treatment with PHP.eB-GFP 1011 vg/mouse, n = 3) vs WT (n = 3), and Mecp2 KO-GT (after gene therapy treatment, PHP.eB-iMecp2 1011 vg/mouse, n = 3) vs WT. (b) MA plot showing gene expression fold changes as a function of the average gene expression in the Mecp2 KO-GT vs WT comparison. (c) Representative gene ontology categories highlighting the enrichment for immune response-related datasets being overrepresented in the Mecp2 KO-GT vs WT comparison. (d) MA plot showing gene expression fold changes as a function of the average gene expression in the Mecp2 KO vs WT comparison. (e) MA plot showing gene expression fold changes as a function of the average gene expression in the Mecp2 KO-GT vs KO comparison. (f) Representative gene ontology categories highlighting the enrichment for lipid metabolism-related datasets being overrepresented in the Mecp2 KO vs WT comparison, but not in the Mecp2 KO-GT vs KO comparison. Heatmap showing relative expression of genes belonging to the lipid metabolism-related pathways (g) or Potassium ion transmembrane transport group (h). (i) RT-qPCRs of selected transcript of interest such as Sqle, Nsdhl, Msmo1, Kcnj10, Kcnc3 and Angpl4 being downregulated in Mecp2 KO and rescued after gene therapy. Red dots in (b), (d), and (e) depict differentially expressed genes with FDR ≤ 0.1. (j) Representative western blot and quantitative analysis for the ribosomal protein S6, its phosphorylated form (pS6) and a normalizer calnexin (CNX) from cortical tissues of wild-mice and Mecp2 KO transduced with GFP or iMecp2 vector. Error bars, SD. *p<0.05, **p<0.01 as compared to WT mice (ANOVA-one way with Tukey’s post hoc test).
Figure 7 with 1 supplement
PHP.eB-iMecp2 gene transfer in Mecp2+/- females.
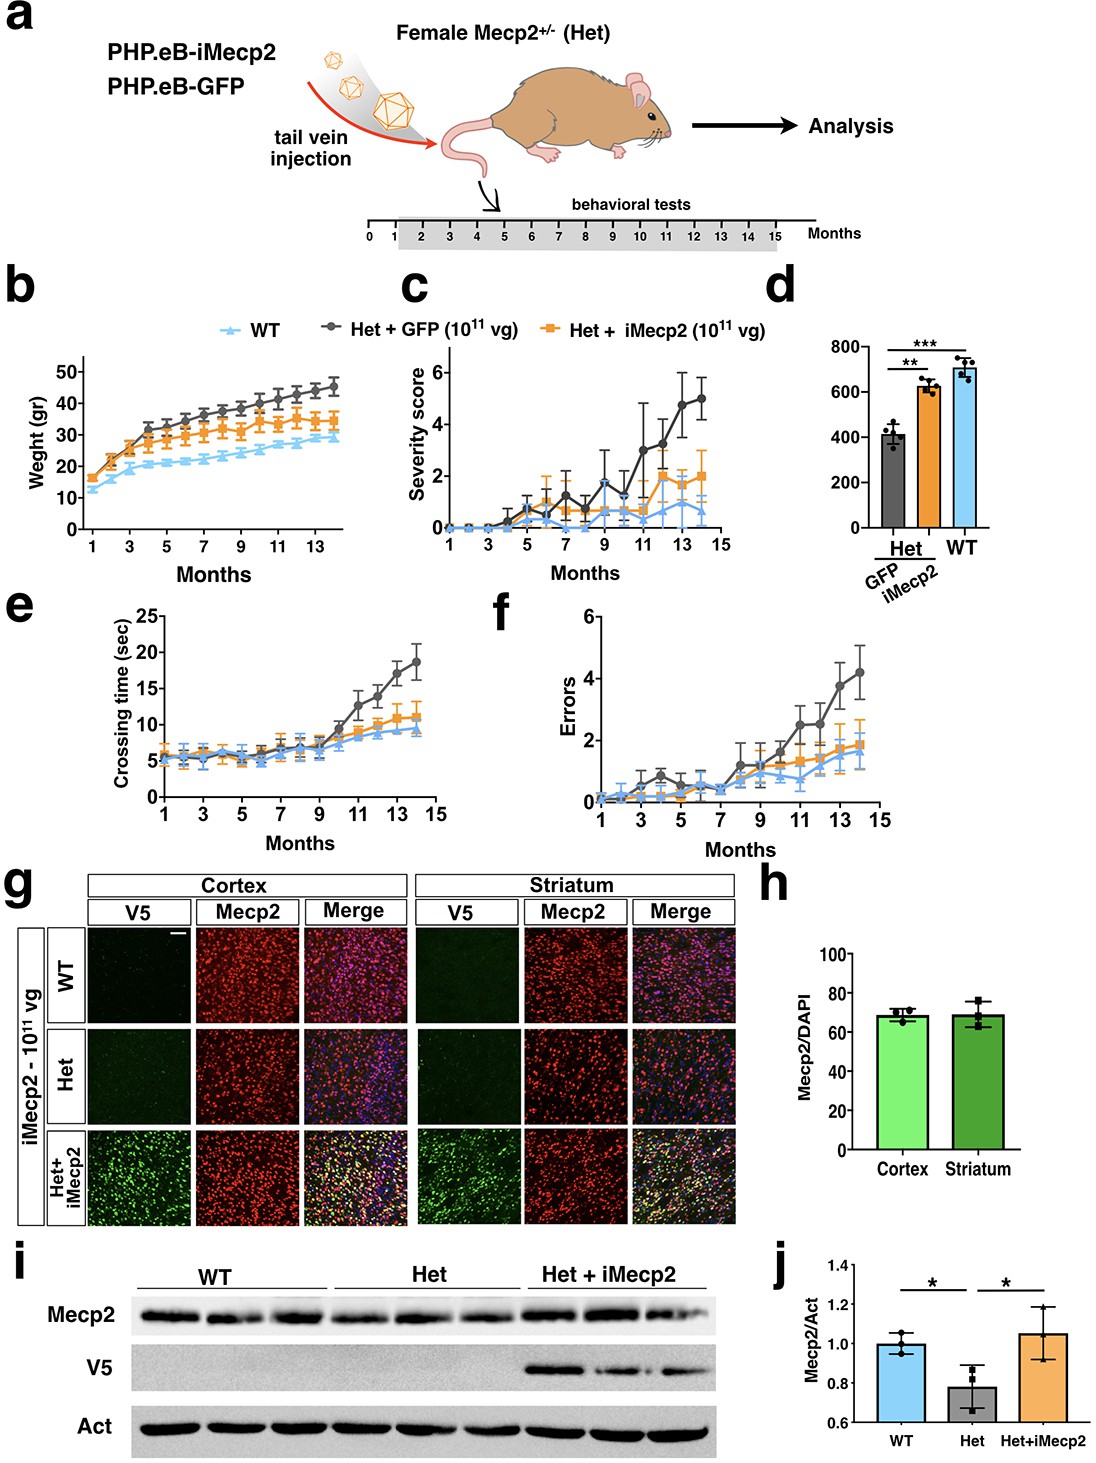
(a) Illustration of the experimental setting to restore the expression of Mecp2 in heterozygous (Het) animals by means of AAV-PHP.eB. (b) Mouse body weight was monitored every two weeks and represented as mean of each group. (c) General phenotypic assessment evaluated through aggregate severity score. (d) Spontaneous locomotor activity was tested in a spontaneous field arena and shown as quantification of travelled total distance. All groups of animals were tested for motor coordination using beam balance test and quantified as crossing time (e) and number of errors (f) (WT untreated [n = 8], Het treated with GFP 1×10¹¹ vg/mouse [n = 6], Het treated with iMecp2 virus 1×10¹¹ vg/mouse [n = 6]). (g) High magnification immunostaining for Mecp2 and V5 in cortex, striatum and cerebellum derived from WT, Mecp2+/- (Het) untreated and Het treated with PHP.eB-iMecp2 (1×10¹¹ vg/mouse) brains. Nuclei were stained with DAPI (merge panels). (h) Bar graphs showing the fraction of V5 positive on the total DAPI positive in cortex and striatum (n = 3). (i) Western-blot analysis to quantify Mecp2 over Actin protein levels in cortex derived from WT, Het untreated and treated with iMecp2 (1×10¹¹) animals and (j) corresponding densitometric quantification expressed in arbitrary units (right panel) (n = 3 for WT, n = 3 Het untreated; n = 3 Het treated with PHP.eB-iMecp2 1011 vg/mouse) *p<0.001 as compare to WT and Het treated with PHP.eB-iMecp2 (ANOVA-one way, Tukey’s post hoc test). Error bars, SD. **p<0.01. ANOVA-two way (b, c, e, f) or ANOVA-one way (d) with Tukey’s post hoc test.
Figure 7—figure supplement 1
Characterization of iMecp2 transgene expression in brain and liver of Mecp2+/- animals.
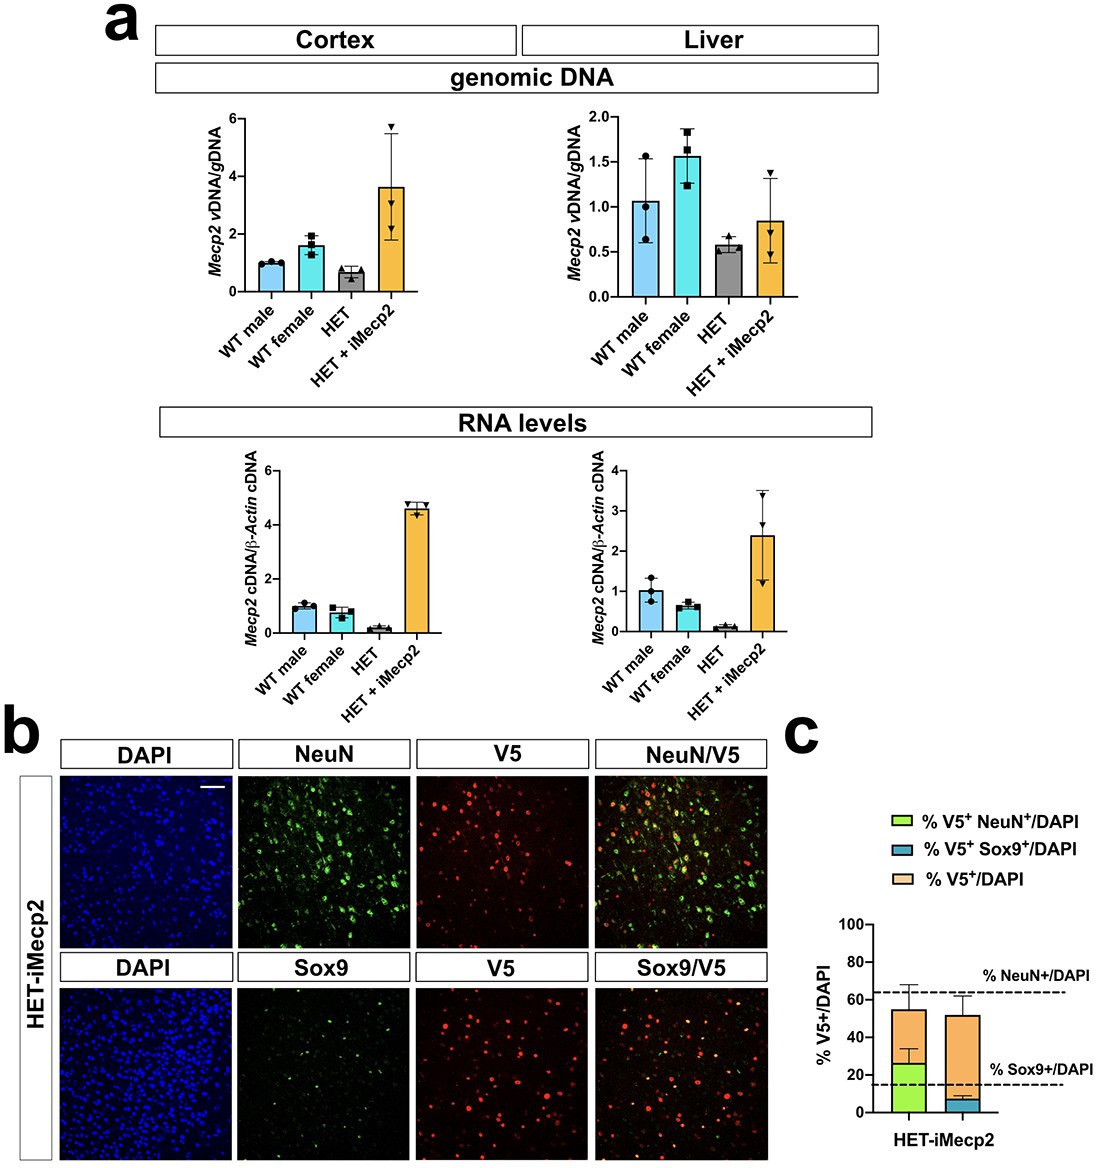
(a) Vector biodistribution (upper panel) and transgene expression (lower panel) in mice cortex and liver of wild-type female mice (WT female, n = 3), Het mice untreated (Het, n = 3) and treated with 1×10¹¹ (n = 3) of iMecp2. Data were normalized over Mecp2 gene levels and expression of wild-type mice (WT male, n = 3), respectively. (b) Characterization of iMecp2-transduced cells in Het cortex (1×10¹¹vg/mouse) using colocalization of V5+ cells with neurons (NeuN+) and astrocytes (Sox9). (c) Quantification of V5+ cells on total DAPI+ cells (orange bar), V5+ NeuN+ cells on total DAPI+ cells (green bar) and V5+ Sox9+ cells on total DAPI+ cells (blue bar). Dashed lines indicate the number of NeuN+ cells or Sox9+ cells on total DAPI + cells. Nuclei were stained with DAPI. All images were captured using confocal microscope. Scale bar: 50 μm. N = 3 animals per group.
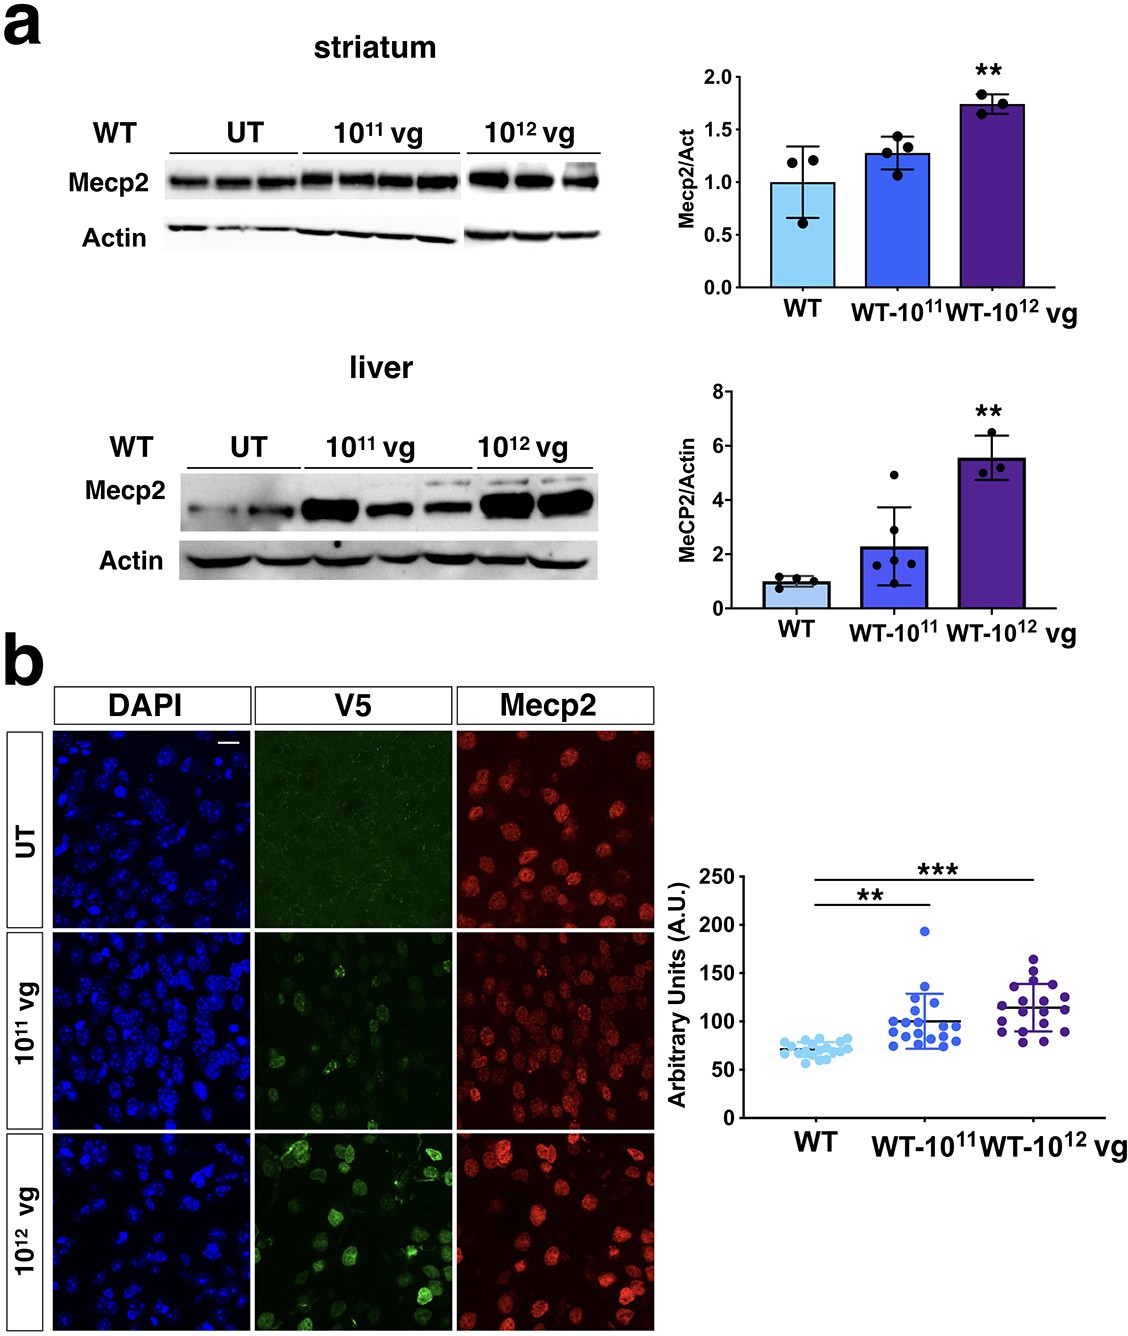
Figure 8 with 2 supplements
PHP.eB-mediated iMecp2 gene transfer in wild-type mice is unharmful.
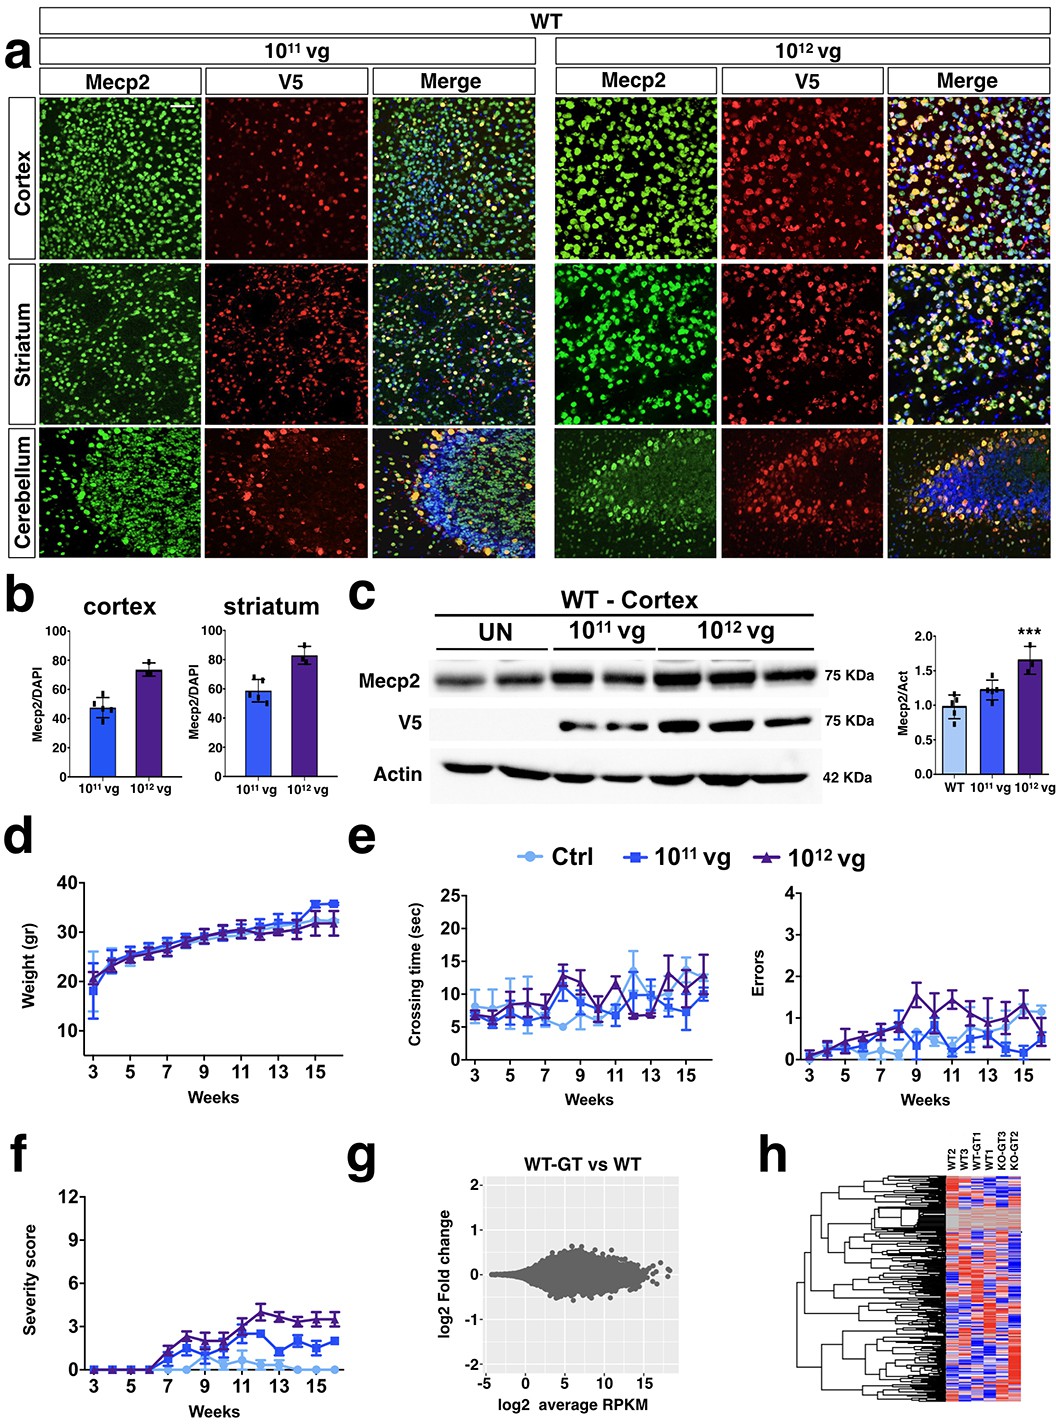
(a) High magnification immunostaining for Mecp2 and V5 in cortex, striatum and cerebellum derived from WT brains treated with PHP.eB-iMecp2 (1×10¹¹ and 1×10¹² vg/mouse). Nuclei were stained with DAPI (merge panels). (b) Bar graphs showing the fraction of V5 positive on the total DAPI positive in cortex and striatum (n = 6 for 1×10¹¹ and n = 3 for 1×10¹² vg/mouse). (c) Western blot analysis to quantify Mecp2 over Actin protein levels in cortex (left panel) and striatum (right panel) derived from WT, untreated and treated with iMecp2 (1×10¹¹ and 1×10¹² vg/mouse) animals and corresponding densitometric quantification expressed in arbitrary units (right panel) (n = 6 for WT, n = 6 for 1011 and n = 3 for 1012 vg/mouse) ***p<0.001 as compare to wild-type (WT) untransduced mice (ANOVA-one way, Tukey’s post hoc test). Twice a week, mice were tested for (d) body weight, (e) beam balance test and quantified as crossing time (left) and number of errors (right) and (f) general phenotypic assessment evaluated through aggregate severity score (WT untreated [n = 8] and treated with iMecp2 virus 1×10¹¹ [n = 6], 1×10¹² [n = 6], vg/mouse). (g) MA plot showing gene expression fold changes as a function of the average gene expression in the Mecp2 WT-GT (after gene therapy treatment, PHP.eB-iMecp2 1011 vg/mouse, n = 3) vs WT (n = 3) comparison (h) Red dots depict differentially expressed genes with FDR ≤ 0.1. Heatmap showing relative expression of 1000 random genes in WT and WT-GT, highlighting the lack of differentially expressed genes in the two groups. Error bars, SD. Scale bar: 50 µm.
Figure 8—figure supplement 1
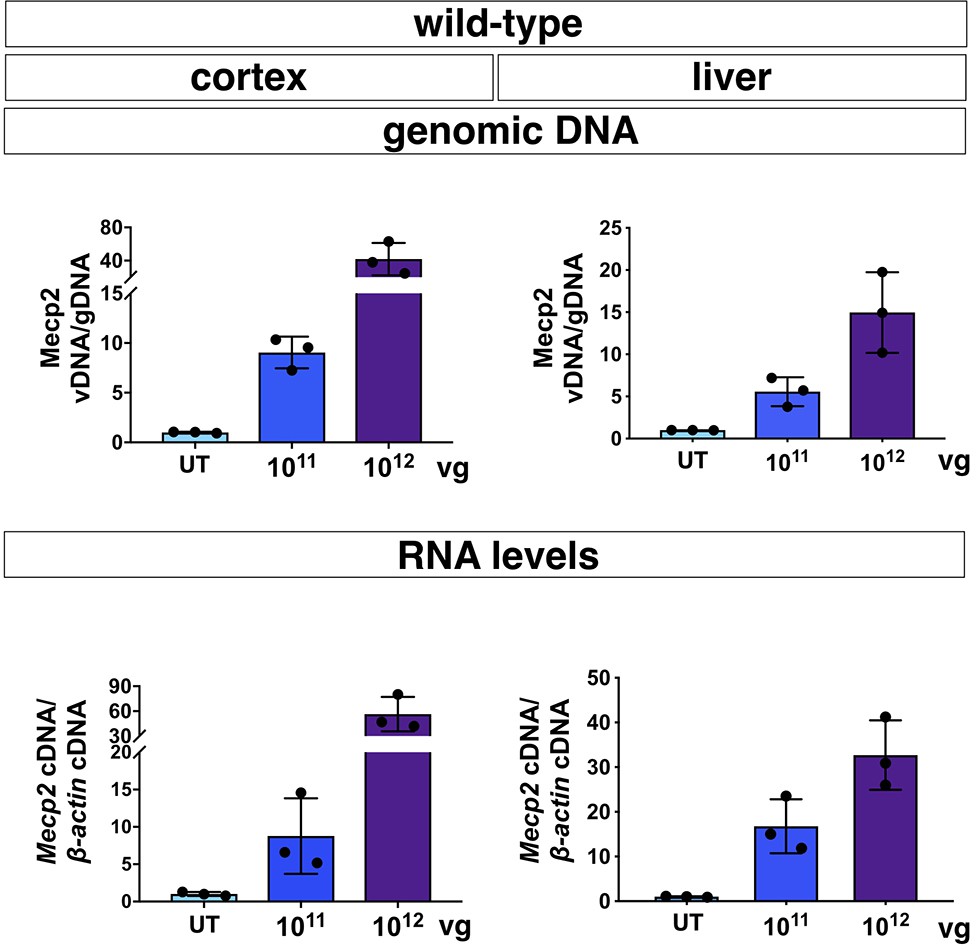
Characterization of iMecp2 transgene expression in brain and liver of wild-type animals.
Vector biodistribution (upper panel) and transgene expression (lower panel) in mice cortex and liver of WT mice untreated (UT, n = 3) and treated with 1×10¹¹ (n = 3) or 1×10¹² (n = 3) iMecp2. Data were normalized respectively over Mecp2 gene level and expression of WT mice (UT, light blue bar). Error bars, SD.
Figure 8—figure supplement 2
Protein levels in PHP.eB-iMecp2 transduced wild-type animals.
(a) Western blot analysis to quantify Mecp2 over Actin protein levels in striatum (upper panel) and liver (lower panel) derived from WT untreated (UT) and treated with iMecp2 (1×10¹¹ and 1×10¹² vg/mouse) mice. Corresponding densitometric quantification expressed in arbitrary units (n = 3 for UT, n = 3 for 1×10¹¹; n = 3 for 1×10¹² vg/mouse) are shown on the right. (b) High magnification confocal images for V5 and Mecp2 in cortex derived from wild-type untreated (WT) and treated with iMecp2 (1×10¹¹, 1×10¹² vg/mouse) animals. Nuclei were stained with DAPI. Scale bar: 10 μm (Right panel). Left panel: graphs showing the quantification of cellular levels of total Mecp2 detected by immunofluorescence in cells of the cortex and quantified in arbitrary units based on field pixel intensity (n = 30 nuclei for per condition, UT: untreated). Error bars, SD. **p<0.05 and ***p<0.001 compared to UT (ANOVA-one way, Tukey’s post hoc test). Scale bar: 10 µm.
Videos
Video 1
Activity of Mecp2−/y treated with GFP or 1×10¹¹ vg/mouse iMecp2 + cyclosporine.
Both KO mice were injected after 4 weeks from birth and were video-recorded after 3 weeks (GFP, 1×10¹¹ vg/mouse) or 4 months (iMecp2, 1×10¹¹ vg/mouse) from the treatment. The iMecp2-treated mouse walks, climbs, explores and interacts with the other mouse, while the mock GFP-treated KO mouse remains stationary at one corner of the cage. This video indicates an improved mobility and an increased sociability after gene therapy in KO mice.
Additional files
-
Supplementary file 1
Quantifiation of Mecp2 gene transfer in infected brain tissue.
Quantitative assessment of transduced (V5+) astrocytes (Sox9+) and neurons (NeuN+) in the cerebral cortical tissue at each different iMecp2 viral dose.
- https://cdn.elifesciences.org/articles/52629/elife-52629-supp1-v2.docx
-
Supplementary file 2
No evidence of liver toxicity in mice administered with high AAV dose.
Blood serum levels of liver enzyme and liver histochemical analysis (representative images) were used as indicators of liver health. # Reference values for C57BL/6J male mice were taken from the mouse phenome database https://phenome.jax.org/. Abbreviations, Treat: treatment, ALB: albumin, ALP: Alkaline phosphatase, ALT: Alanine aminotransferase, HE: hematoxylin/eosin staining. All values are indicated as mean ± SD, n = 3, SD. Scale bar: 200 µm.
- https://cdn.elifesciences.org/articles/52629/elife-52629-supp2-v2.docx
-
Supplementary file 3
Primers employed for qRT-PCRs.
- https://cdn.elifesciences.org/articles/52629/elife-52629-supp3-v2.docx
-
Supplementary file 4
List of antibodies for flow cytometry.
- https://cdn.elifesciences.org/articles/52629/elife-52629-supp4-v2.docx
-
Transparent reporting form
- https://cdn.elifesciences.org/articles/52629/elife-52629-transrepform-v2.pdf
Download links
A two-part list of links to download the article, or parts of the article, in various formats.
Downloads (link to download the article as PDF)
Open citations (links to open the citations from this article in various online reference manager services)
Cite this article (links to download the citations from this article in formats compatible with various reference manager tools)
Whole brain delivery of an instability-prone Mecp2 transgene improves behavioral and molecular pathological defects in mouse models of Rett syndrome
eLife 9:e52629.
https://doi.org/10.7554/eLife.52629


