HIV restriction factor APOBEC3G binds in multiple steps and conformations to search and deaminate single-stranded DNA
- Northeastern University, United States
- University of Saskatchewan, Canada
- Ohio State University, United States
Figures
Figure 1 with 1 supplement

Experimental procedure for measuring A3G binding to ssDNA.
(A) An 8.1 kbp dsDNA template is tethered between two beads, allowing an optical tweezers system to set the DNA’s extension and measure the resulting applied force (blue diamonds). The exonuclease activity of T7 DNA polymerase removes one of the strands at high force (red circles), leaving an ssDNA template (green triangles). The FEC of dsDNA and ssDNA can be described by the WLC (yellow line) and FJC (magenta line) polymer models, respectively. The ssDNA is held at a fixed force (cyan squares at 20 pN) and incubated with 50 nM A3G, resulting in a decrease in ssDNA extension. (B) Extension of ssDNA while held at constant force (shown at 20 pN) is plotted as a function of time during incubation with 50 nM A3G (WT in blue, FW mutant in red). After 100 s of incubation, the A3G is washed away with protein free buffer. WT A3G (blue line) does not dissociate over the 200 s observation time. When ssDNA is incubated instead with the oligomerization-deficient FW A3G mutant, dissociation is observed on a 100 s timescale and the final extended length approaches that of bare ssDNA. (C) FECs of ssDNA in 200 nM of A3G. The ssDNA template is first incubated and saturated with A3G at low force. The extension is rapidly increased (1 μm/s) until a force of 80 pN is achieved (blue solid circles). The ssDNA is allowed to re-equilibrate with the A3G at high force before the extension is rapidly decreased (red hollow circles). While the release can be well fit by the FJC model (dashed lines), the stretch curve cannot be fit by any set of parameters. Compared to the FEC of ssDNA only (green line), the stretch FEC shows greatly decreased ssDNA extension for all forces above ~5 pN while the release FEC shows minor extension reduction at high forces and a moderate extension increase at low force. (D) FEC curve of ssDNA stretched at a slow rate of 10 nm/s in 200 nM A3G. The ssDNA is initially held at above 80 pN force before the introduction of A3G, then its extension is slowly decreased to allow A3G to maintain an equilibrium binding state (blue diamonds). Multiple equilibrium FECs are obtained and averaged to find the average extension as a function of force (red line) for A3G-saturated ssDNA.
Figure 1—figure supplement 1
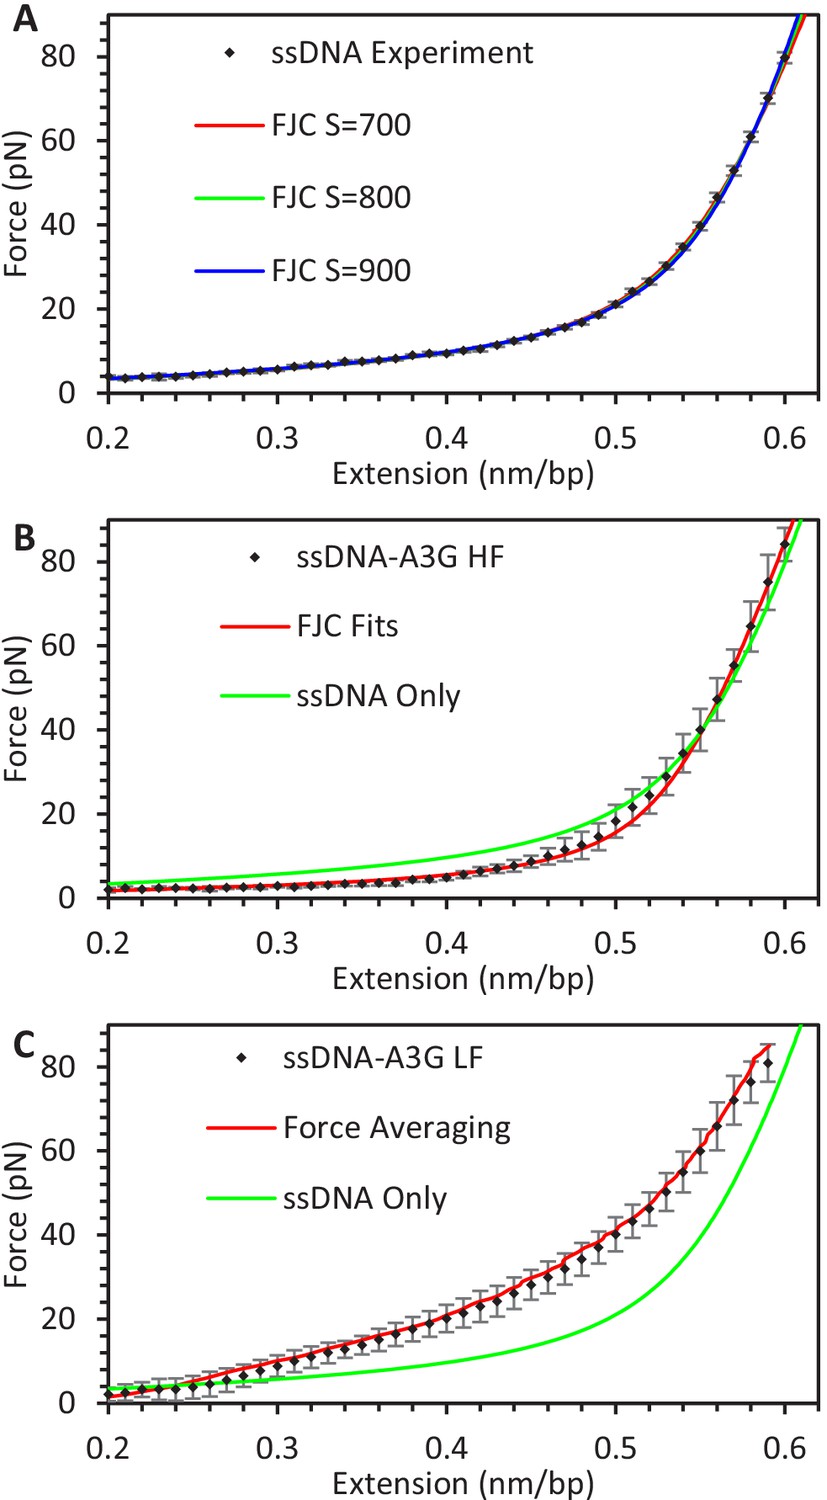
Averaging FECs.
(A) FECs of ssDNA. Force values from FECs of multiple ssDNA constructs (N = 12) are averaged by binning extension values (black diamonds). The resulting average FEC is fit by the FJC model using a range of elastic modulus values. (B) FECs of ssDNA-A3G equilibrated at high force and (C) low force. Force values from FECs of multiple ssDNA constructs saturated with A3G at high or low force (N = 6 each) are averaged by binning extension values (black diamonds). For the high force data, each individual FEC is fit with the FJC model and the average parameter set is plotted. For low force data, the average extension is calculated for each 1 pN force increment. The two methods of averaging return similar results. Results are compared to the FJC fit of protein-free ssDNA (green). Error bars are standard deviations of measured forces, with the ssDNA-A3G complex exhibiting much greater variability compared to the protein free ssDNA.
Figure 2 with 1 supplement

Force-dependent kinetics of A3G binding.
(A) ssDNA is held at a constant force ranging from 10 to 80 pN and incubated with WT A3G, resulting in a slight reduction in extended length. The initial extension is that of bare ssDNA, as predicted by the FJC model. (B) The same incubation curves are plotted as a net change in extension due to A3G binding, showing that both the rate of binding and equilibrium change in extension decrease as greater forces are applied. (C) Calculated concentration-independent binding rates as a function of force. The rates are fit to an exponential function (dotted line) in which A3G binding is inhibited by increasing force due to a characteristic contraction event dB upon initial binding. (D) A3G dissociates from ssDNA held at a constant force in the absence of free protein. WT A3G does not dissociate from ssDNA at low forces, but partially dissociates at high forces (F ≥ 50 pN, blue, red, and green lines). Oligomerization-deficient mutant A3G (FW) dissociates over all observed forces (yellow, cyan, and magenta lines). (E) The same incubation curves are plotted as a net change in extension due to A3G dissociation, showing the rate of dissociation is constant with respect to force. (F) Calculated dissociation rates of WT A3G (blue circles) and FW mutant A3G (red triangles), fit by a constant, force-independent value (dotted line. (G) Effective equilibrium dissociation constant as a function of force, calculated by dividing the constant koff value by a force dependent value for kon. Error bars are standard error based on multiple experimental replications (N ≥ 5 for kon and N ≥ 3 for koff) with different ssDNA molecules.
-
Figure 2—source data 1
Numerical values and experimental replicates for data plotted in Figure 2.
- https://cdn.elifesciences.org/articles/52649/elife-52649-fig2-data1-v2.pdf
Figure 2—figure supplement 1
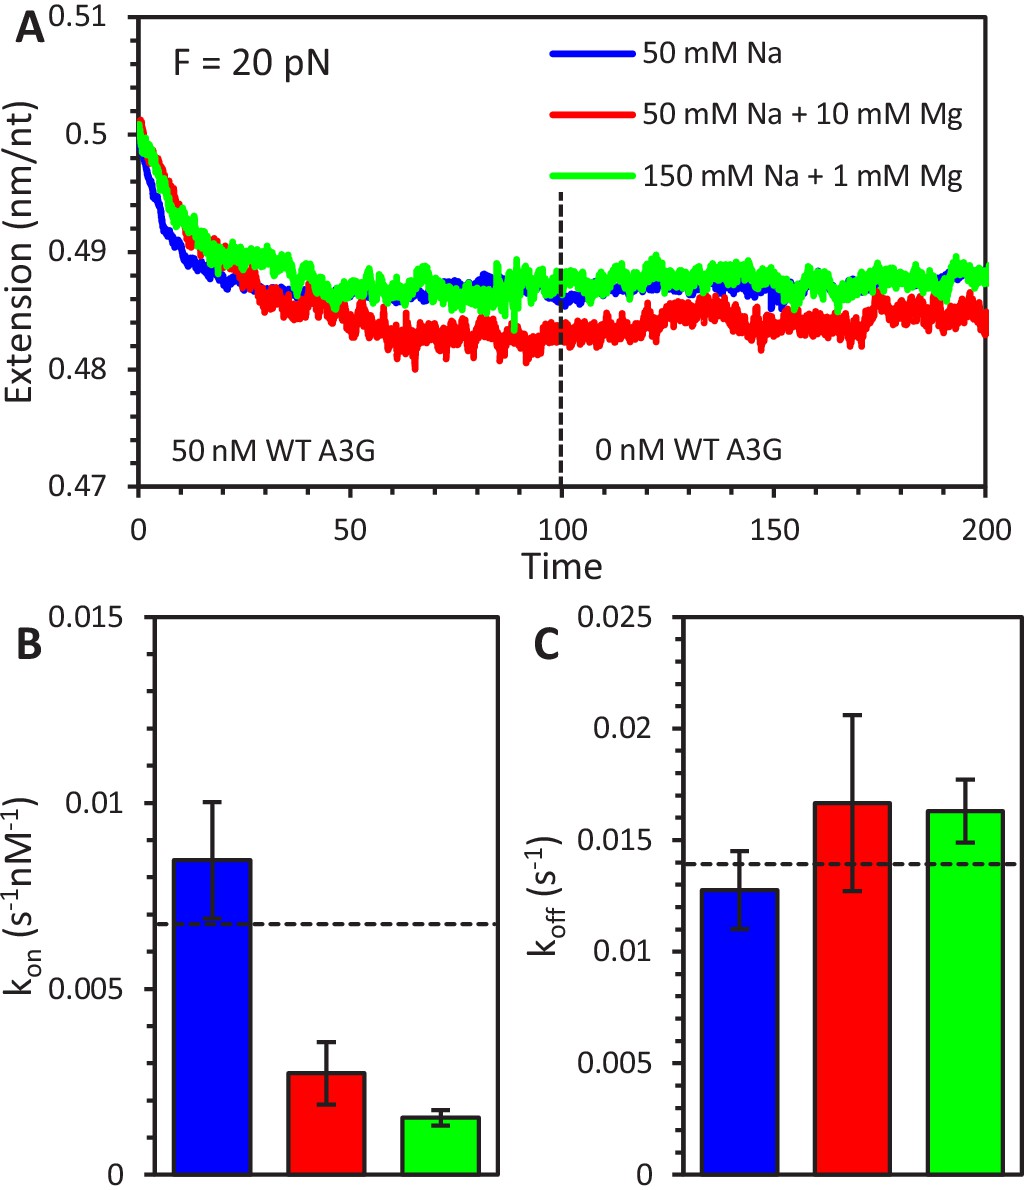
Effect of salt concentration on A3G binding and oligomerization.
(A) Three sample curves show the binding of 50 nM A3G to ssDNA held at 20 pN under three different buffer conditions. A3G was diluted in 50 mM Na binding buffer (blue), 50 mM Na and 10 mM Mg enzymatic buffer (red), or 150 mM Na and 1 mM Mg physiological buffer (green). After 100 s, the A3G is removed from the sample chamber and replaced with buffer only, however, the majority of bound A3G has already oligomerized and is unable to dissociate under all conditions. (B) The rate of A3G binding (shown at 20 pN applied force) is significantly reduced by the increase in buffer salt concentrations. (C) In contrast, the measured dissociation rate of FW mutant A3G (shown at 20 pN applied force) does not depend on salt concentration. Dotted lines are values of kon and koff at 20 pN from force dependent fits as plotted in Figure 2C and F. Error bars are standard error based on multiple experimental replications (N ≥ 5) with different ssDNA molecules.
-
Figure 2—figure supplement 1—source data 1
Numerical values and experimental replicates for data plotted in Figure 2—figure supplement 1.
- https://cdn.elifesciences.org/articles/52649/elife-52649-fig2-figsupp1-data1-v2.pdf
Figure 3 with 2 supplements
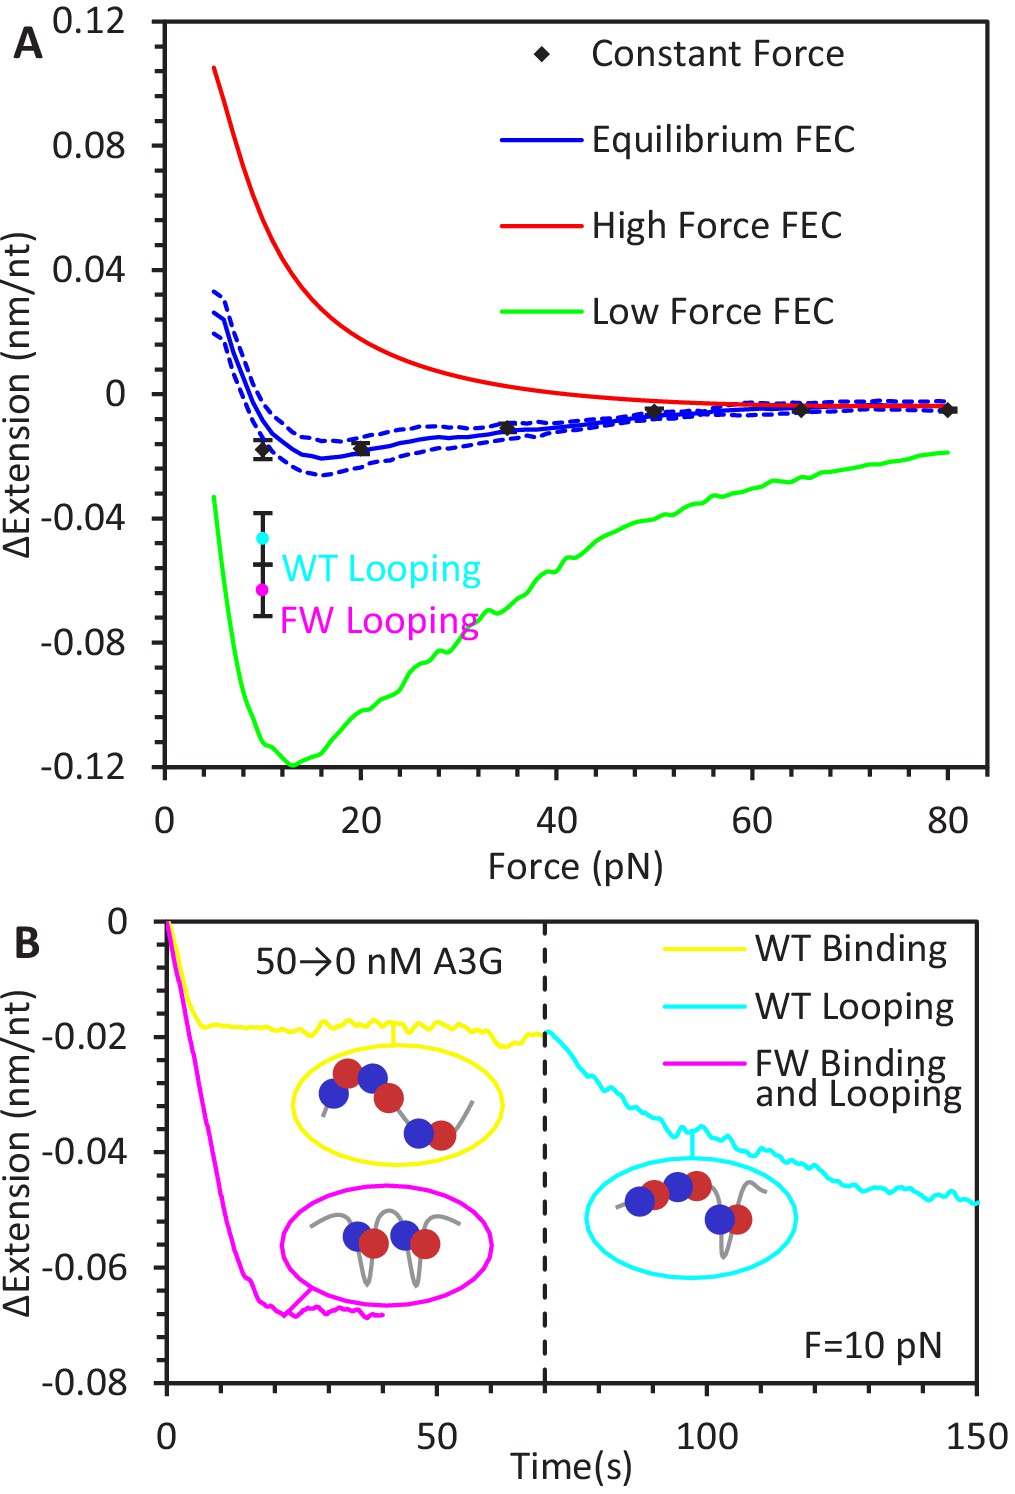
Force-dependent change in ssDNA extension due to A3G binding.
(A) Change in ssDNA extension due to A3G binding as a function of force. Average extension change measured during constant force measurements (black diamonds) increases as force decreases. These measurements agree within error with the force dependent change in extension measured by the averaging the equilibrium FECs (blue line, dotted lines indicate standard error at each force). The changes in extension as measured by the average FEC for A3G bound at high and low forces (red and green lines) are also plotted for comparison, showing the change in ssDNA extension due to saturated A3G binding depends strongly on the force at which the complex is initially equilibrated. (B) Additional ssDNA compaction at 10 pN. When A3G is removed from the sample after incubation, the ssDNA undergoes a secondary compaction (cyan line) beyond the initial compaction (yellow line) that occurs in the presence of free A3G. The secondary compaction has a greater amplitude and slower rate than the initial. In contrast, when ssDNA is incubated with FW mutant A3G (magenta line), the initial compaction exhibits a large extension change. The average final extension change due to looping for both WT A3G (cyan point) and FW A3G (magenta point) are plotted in panel A for reference. These results are consistent with A3G binding ssDNA in a compacting conformation, such as the NTD and CTD (blue and red circles) stabilizing variable size ssDNA loops. Error bars are standard error based on multiple experimental replications (N ≥ 5) with different ssDNA molecules.
-
Figure 3—source data 1
Numerical values and experimental replicates for data plotted in Figure 3.
- https://cdn.elifesciences.org/articles/52649/elife-52649-fig3-data1-v2.pdf
Figure 3—figure supplement 1
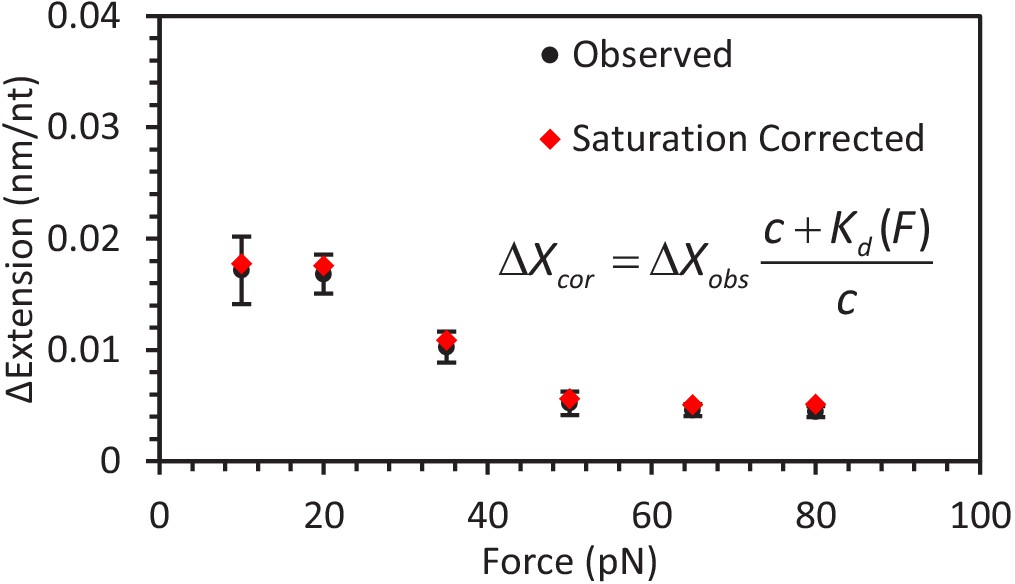
Correcting for A3G saturation.
Using the calculated dependent Kd (Equation 6), the calculated A3G saturation fraction for ssDNA is >85% for all experimental forces (Equation 7). The observed change in ssDNA extension (black circles) for each set of constant force measurements is corrected to account for the finite A3G concentration (c = 50 nM) to calculate the predicted change in extension (red diamonds) when the ssDNA is fully saturated (i.e. A3G concentration is infinite). The corrected values are within error of the observed values, indicating the force dependent change in extension is not an artifact of decreased binding affinity at high forces.
Figure 3—figure supplement 2
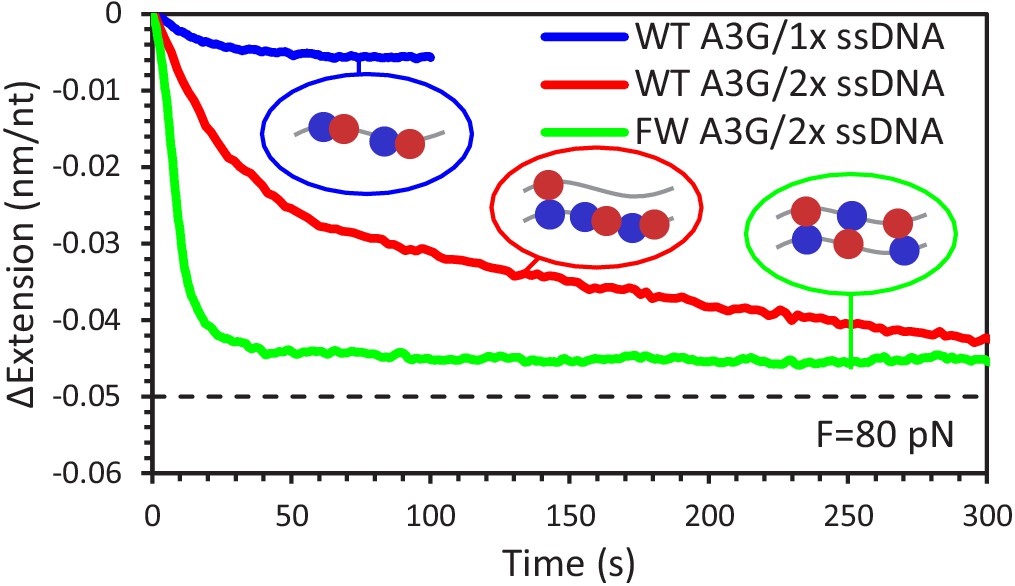
Change in extension for 1x vs 2x ssDNA constructs due to A3G binding at 80 pN.
The total extension change measured for A3G binding to a single ssDNA (blue line) is smaller in amplitude than previous measurements using overstretched dsDNA acting as a 2x ssDNA construct (red line). WT A3G binding to the 2x ssDNA exhibits two exponential rates, while FW A3G binding (green line) results in a single fast change in extension. The final change in extension for both A3G variants is comparable to the difference in extension between a single ssDNA or two ssDNA being held at 80 pN of total force (dashed line). Error bars are standard error based on multiple experimental replications (N ≥ 5) with different ssDNA molecules.
Figure 4 with 1 supplement
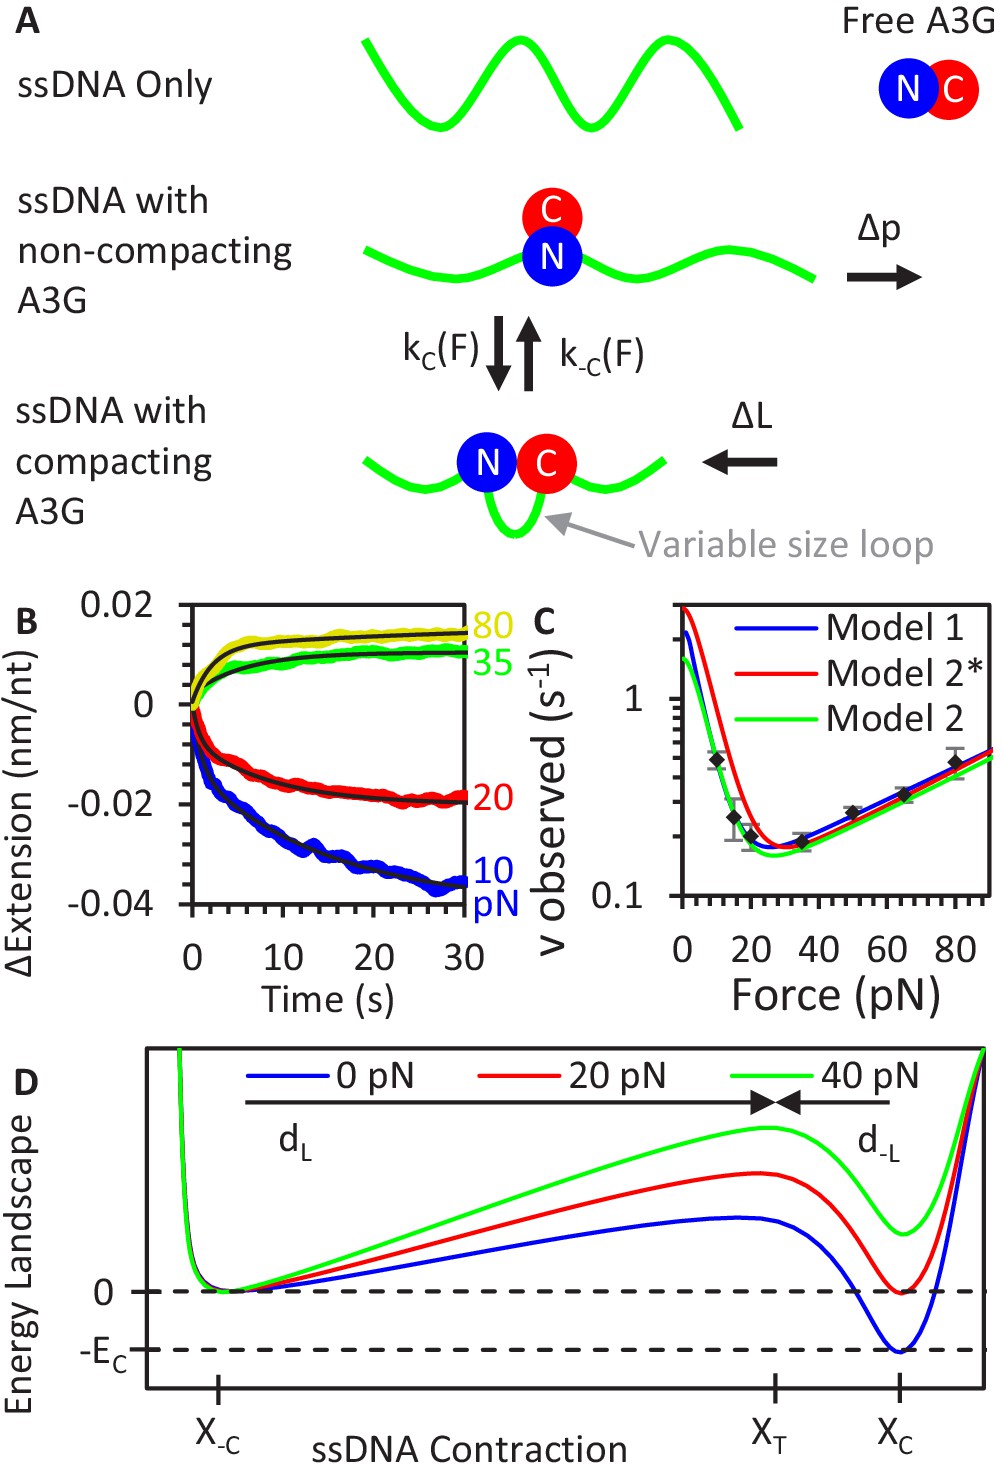
A3G binding conformations.
(A) Schematic of A3G binding conformations. In the absence of strong applied forces, the short persistence length of bare ssDNA results in an extended length much shorter than its contour length. Upon initial binding, A3G locally straightens the ssDNA, increasing its effective persistence length. The A3G can reduce the contour length of the ssDNA by forming a loop of variable size. The degree of looping is determined by the applied tension on the DNA as loops are formed and destabilized at force-dependent rates. (B) ssDNA-A3G re-equilibration after force jump. The extension of the ssDNA-A3G complex increases or decreases when the tension on the substrate is suddenly increased or decreased, respectively. The extension as a function of time after the force jump is fit to an exponential function (black lines). (C) Force dependence of A3G re-equilibration. The average re-equilibration rates, which is equal to the sum of the loop formation and deformation rates, are plotted as a function of force. All these rates are more than an order of magnitude faster than the measured rate of A3G dissociation (Figure 2F), such that this transition is fully attributed to changes in binding conformation of currently bound A3G proteins. (D) Energy landscape of A3G conformational change. A3G contracts ssDNA when forming loops, passing through an energy barrier associated with a transition state (XT). At zero force, a binding energy EC favors the compacting conformation, but increasing applied force increases the energetic cost of compaction. The model is fit to the observed transition rates (panel C, blue line). Using the same parameters as the Bell model fit in a model derived from integrating over deviations between the FECs of ssDNA with and without A3G compaction (panel C, red line) results in slight deviation from the measured rates, but slightly adjusting the parameters recovers the goodness of fit (panel C, green line). Error bars are standard error based on multiple experimental replications (N ≥ 6) with different ssDNA molecules. Exact parameter values for conformational change models are in Table 1.
-
Figure 4—source data 1
Numerical values and experimental replicates for data plotted in Figure 4.
- https://cdn.elifesciences.org/articles/52649/elife-52649-fig4-data1-v2.pdf
Figure 4—figure supplement 1
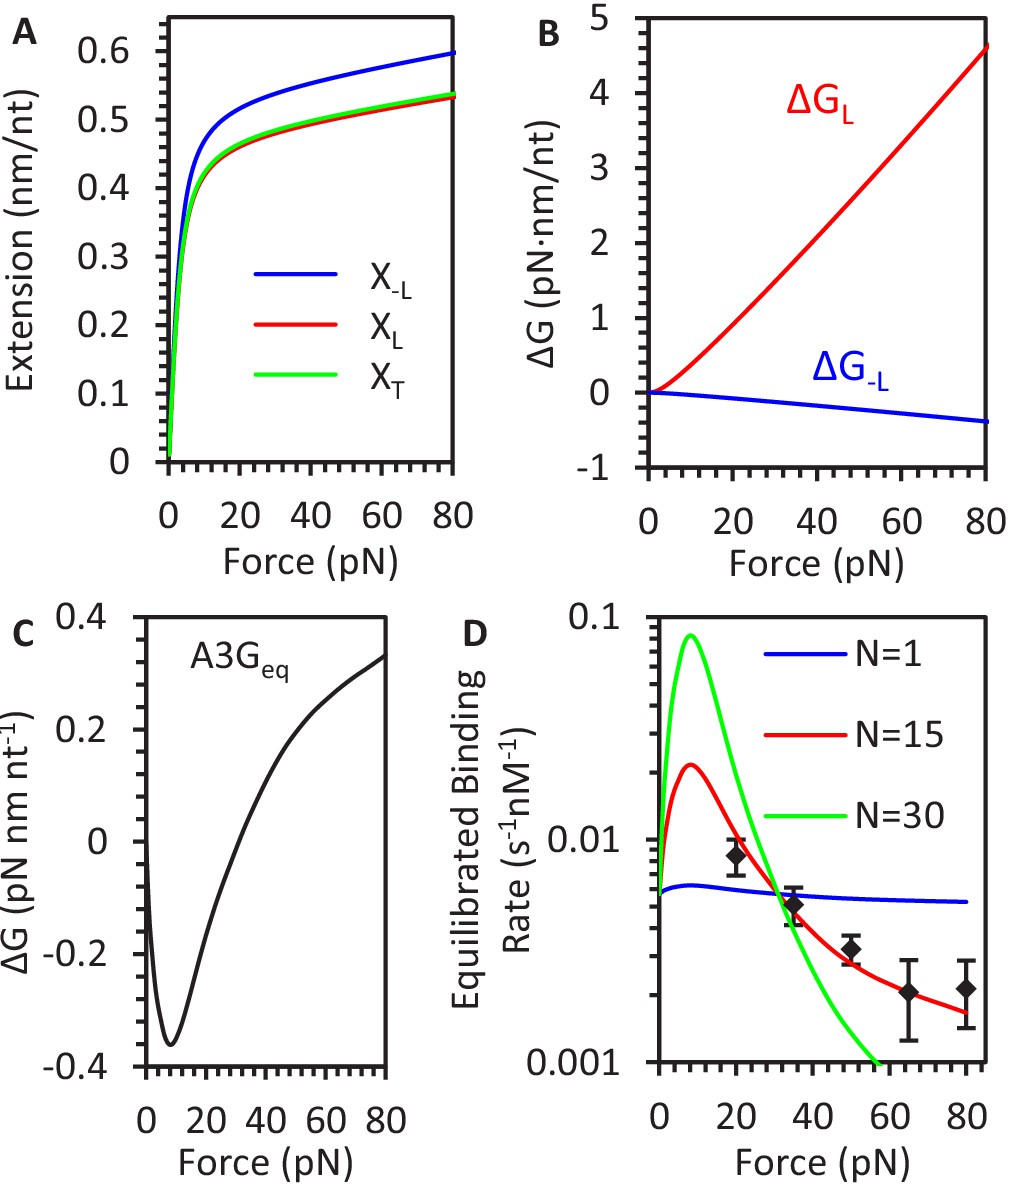
Change in ssDNA extension due to A3G compaction.
(A) FECs of ssDNA are plotted for A3G saturated but uncompacted ssDNA (blue line), compacted ssDNA (red line), and the transition state separating the conformations (green line). (B) Stretching energy difference between states. ΔG is calculated by integrating the difference in extension between states as a function of force. (C) Stretching energy associated with saturated, equilibrated A3G binding. ΔG is calculated by integrating over the difference between the FJC fit to bare ssDNA and average equilibrium A3G FEC. (D) Force dependence of equilibrated binding. After defining a set A3G binding site size, N, the predicted kinetics of A3G binding to ssDNA are fitted to the measured rates (black diamonds) obtained from constant force measurements. The force dependent kinetics are consistent with a binding site size on the order of 15 nt. Error bars are standard error based on multiple experimental replications (N ≥ 5) with different ssDNA molecules.
Figure 5 with 2 supplements
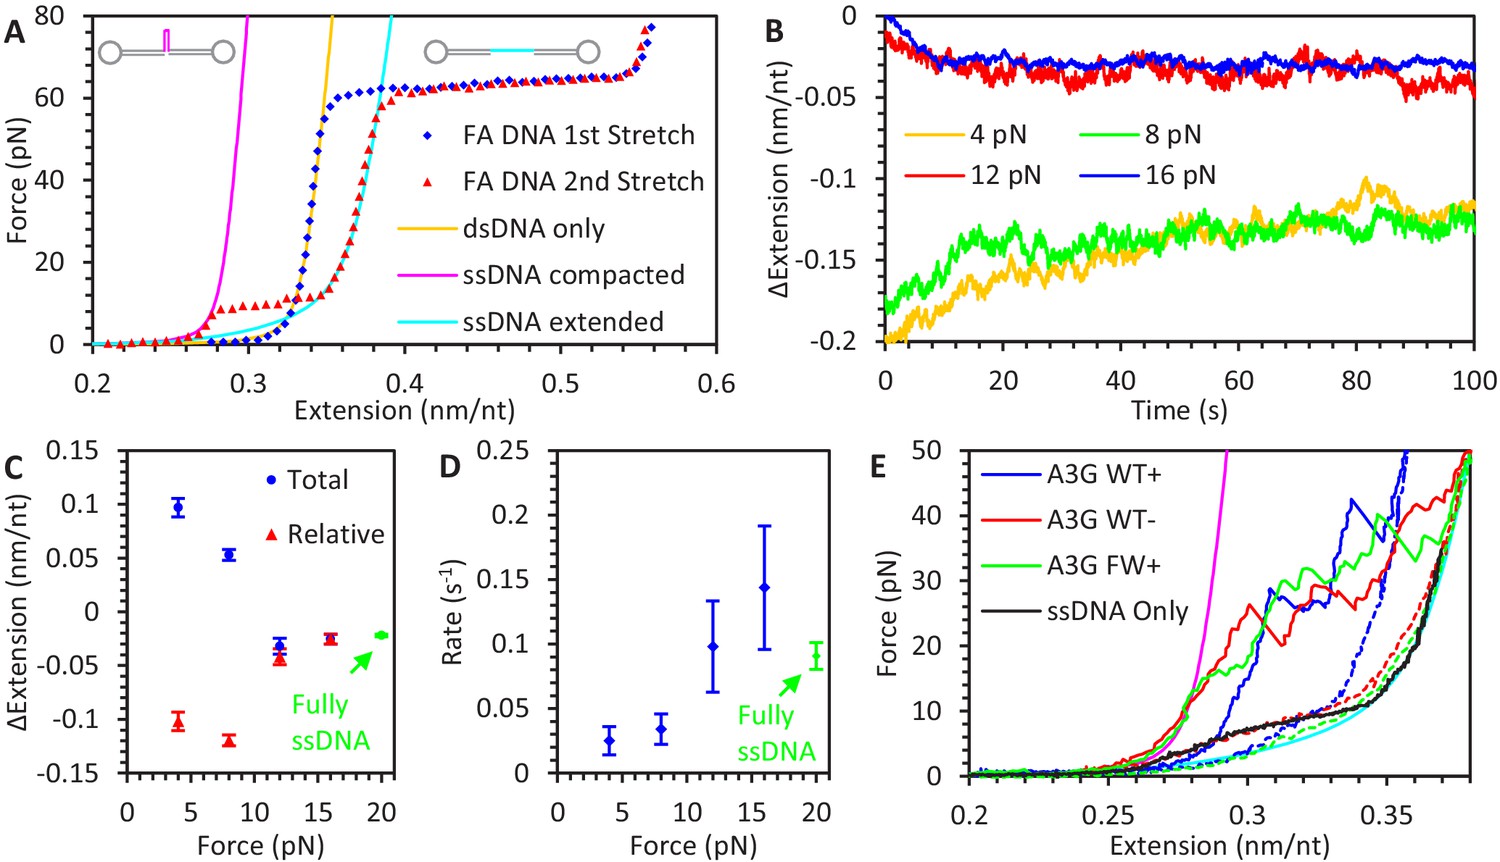
A3G binding to ssDNA/dsDNA hybrid construct.
(A) FECs of hybrid construct. A 6.5 kbp dsDNA construct is stretched using optical tweezers (blue diamonds). The first stretch follows the WLC model (yellow line), but a one knt section of ssDNA between two nicking sites dissociates during overstretching, altering the FEC of subsequent stretches (red triangles). At low forces, secondary structure compacts the ssDNA and the constructs total extension is consistent with the ssDNA section having zero net extension (magenta line). At higher forces, secondary structure is disrupted, and the ssDNA’s contribution to the construct’s total extension follows the FJC model (cyan line). (B) ssDNA extension change due to A3G binding at low force. The hybrid construct is held at a constant force and incubated with 50 nM A3G. At the lowest forces (4 pN in yellow and 8 pN in green), ssDNA is initially compacted due to secondary structure but increases it extension as A3G binds. (C) Average ssDNA extension changes. The average total extension changes (compared to initial extension, blue circles) and average relative extension changes (compared to FJC model, red triangles) are plotted as a function of force. Above ~10 pN, ssDNA extension is decreased similar to experiments using the fully ssDNA construct at 20 pN (green symbols). At lower forces ssDNA extension appears to increase, but when the initial decrease in extension due to ssDNA secondary structure prior to A3G incubation is taken into account, the final ssDNA-complex is still shorter than bare, linear ssDNA. (D) Average rate of extension change. While the timescale required for the ssDNA to reach an equilibrium length at forces above ~10 pN agrees with 20 pN data obtained using a fully ssDNA construct, this process is greatly slowed at low forces where significant ssDNA secondary structure is present. (E) Stabilization of ssDNA loops by A3G. After incubating the hybrid construct with A3G at near zero force so that the ssDNA region is completely unextended, the DNA is stretched at a rate of 100 nm/s. As compared to the compaction of ssDNA due to intrinsic secondary structure formation (panel B), much higher forces are required to extend the ssDNA once A3G is bound (blue line). This effect remains even after removing free A3G from solution (red line). Similar effects are seen when incubating with FW mutant A3G (green line), indicating this A3G looping does not require A3G oligomerization. Error bars are standard error based on multiple experimental replications (N ≥ 5) with different ssDNA molecules.
-
Figure 5—source data 1
Numerical values and experimental replicates for data plotted in Figure 5.
- https://cdn.elifesciences.org/articles/52649/elife-52649-fig5-data1-v2.pdf
Figure 5—figure supplement 1
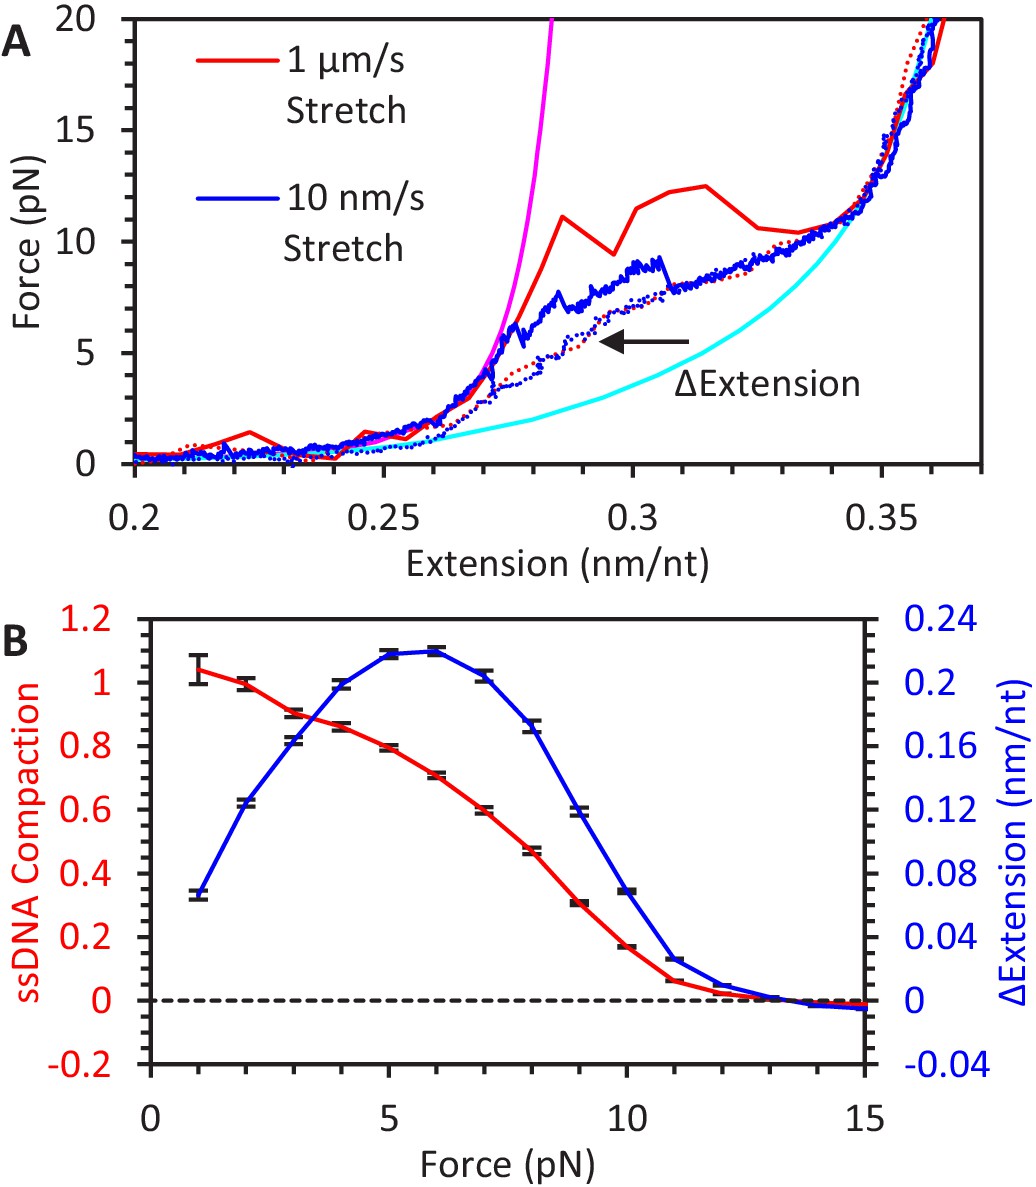
Kinetics and equilibrium of ssDNA secondary structure formation.
(A) When ssDNA extension is increased at a fast (red line) or slow (blue line) rate, the tension on the ssDNA increases and secondary structure is disrupted, resulting in a sudden increase in extension. Rapid increases in force result in the extension occurring at high forces. Conversely, on the return curves (dotted lines), secondary structure resulting in ssDNA compaction occurs in a rate-independent manner, and the ssDNA exhibits a consistent change in extension relative to its fully extended state. (B) Average ssDNA compaction as a function of force. Using return curves from different DNA constructs (N = 6), the average reduction in ssDNA extension due to secondary structure is calculated as a function of force (blue line). The fractional compaction (red line) is calculated by interpolating the ssDNA’s measured extension between the extension of the fully extended and compacted states.
Figure 5—figure supplement 2

A3G binding to dsDNA.
FECs of dsDNA in protein free buffer (black line) or in the presence of A3G (blue and red lines) overlap below the melting transition, indicating that A3G binding does not alter dsDNA polymer properties. The force required to overstretch dsDNA increases and binding to exposed ssDNA prevents reannealing of bases when the force is lowered (dashed lines).
Figure 6
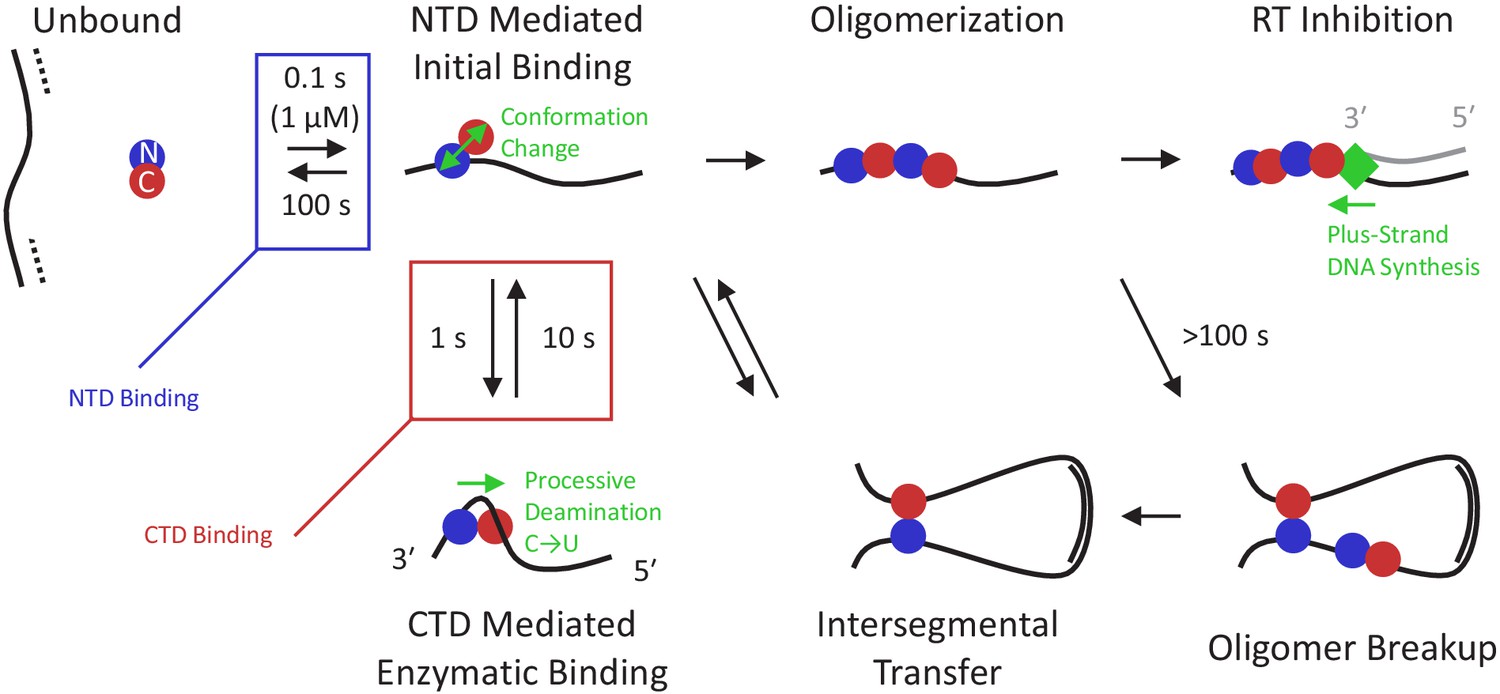
Multi-state model of A3G enzymatic activity.
Once the viral RNA template has been degraded (dashed line), the minus-strand ssDNA (solid line) is available for A3G binding. Due to the high effective concentration of the few A3G molecules packaged in the small volume of the virion and the strong electrostatic interaction between the NTD and negatively charged ssDNA, free A3G (predominately in a globular conformation) quickly binds available ssDNA and remains bound on the timescale of 100 s. While bound, A3G monomers can spontaneously switch into a dumbbell conformation with the two domains partially decoupled, enabling transitions along three paths. First, the CTD can locally bind the ssDNA in an enzymatically active state, enabling recognition of target CCC motifs and subsequent deamination activity. This binding conformation stabilizes A3G’s dumbbell form and tightly contracts the ssDNA substrate. Quick sampling of the ssDNA by the CTD, along with the ability of the NTD to slide along the ssDNA under physiological salt conditions, allows fast and processive deamination of neighboring target sites before full A3G dissociation. A3G deamination activity displays a strong directional bias, inhibited from accessing sites within ~30 nt of the 3′ end due to the presence of the NTD, and deaminating processively in the 5′ direction. Second, the CTD can bind non-locally to another region of the viral genome due to the high flexibility of ssDNA segments. Due to the stronger ssDNA binding affinity of the NTD versus the CTD, the protein usually remains at the NTD side of the loop, but sometimes relocates when the CTD remains bound longer. This allows for moderately processive deamination even in the presence of barriers such as regions of dsDNA and RNA/DNA hybrid. Third, if an A3G monomer collides with other bound protein(s), an oligomer will form. This path becomes favored at higher A3G concentrations and over longer timescales. Oligomerization reduces deaminase activity due to decreased protein mobility and/or occlusion of the CTD’s active site by other bound A3G subunits. Oligomers can be broken up, however, over long timescales, allowing for additional enzymatic activity at a reduced rate. Alternatively, oligomers that remain bound to the minus-strand ssDNA template block processive polymerization of the complementary plus strand ssDNA (gray line) by RT (green diamond). Slowing RT also extends the window of ssDNA vulnerability, allowing other A3G monomers to fully deaminate the viral genome.
Tables
Table 1
Summary of key results and fitting parameters.
For FJC fitting parameters, stated plus/minus values are standard error of the mean based on fits to multiple FECs. For A3G conformation kinetics, stated plus/minus are error estimates for fitting parameters based on chi-squared minimization.
| FJC fits | Contour length (nm/nt) | Persistence length (nm) | Elastic modulus (pN) |
|---|---|---|---|
| ssDNA only | 0.565 ± 0.003 | 0.717 ± 0.024 | 804 ± 36 |
| A3G-ssDNA (HF) | 0.535 ± 0.006 | 1.40 ± 0.11 | 628 ± 70 |
| A3G Conformation Kinetics | Parameter | Model 1 | Model 2 |
| Compaction Rate | kC(F = 0) (s−1) | 2.8 ± 1.5 | 1.5 ± 0.8 |
| Compaction Distance | dC (nm) | 0.82 ± 0.21 | 0.88 ± 0.22 |
| Decompaction Rate | k-C(F = 0) (s−1) | 0.099 ± 0.017 | 0.099 ± 0.017 |
| Decompaction Distance | d-C (nm) | 0.077 ± 0.012 | 0.082 ± 0.013 |
Additional files
-
Source code 1
UTC – Universal Tweezer Controls: LabWindows/CVI program used to control and collect data from optical tweezers system.
- https://cdn.elifesciences.org/articles/52649/elife-52649-code1-v2.zip
-
Source code 2
Fexta – Force Extension Analysis: Matlab program used to analyze force and extension data collected by optical tweezers system.
- https://cdn.elifesciences.org/articles/52649/elife-52649-code2-v2.zip
-
Source code 3
imFexta – Image Analysis: Matlab program to analyze bright field images of trapped beads to correct for long term thermal drift in optical tweezers system.
- https://cdn.elifesciences.org/articles/52649/elife-52649-code3-v2.zip
-
Transparent reporting form
- https://cdn.elifesciences.org/articles/52649/elife-52649-transrepform-v2.pdf
Download links
A two-part list of links to download the article, or parts of the article, in various formats.
Downloads (link to download the article as PDF)
Open citations (links to open the citations from this article in various online reference manager services)
Cite this article (links to download the citations from this article in formats compatible with various reference manager tools)
HIV restriction factor APOBEC3G binds in multiple steps and conformations to search and deaminate single-stranded DNA
eLife 8:e52649.
https://doi.org/10.7554/eLife.52649


