Stretching the skin immediately enhances perceived stiffness and gradually enhances the predictive control of grip force
- Department of Biomedical Engineering, Ben-Gurion University of the Negev, Israel
- Zlotowski Center for Neuroscience, Ben-Gurion University of the Negev, Israel
- Shirley Ryan AbilityLab, United States
- Department of Biomedical Engineering, Northwestern University, United States
Figures
Figure 1
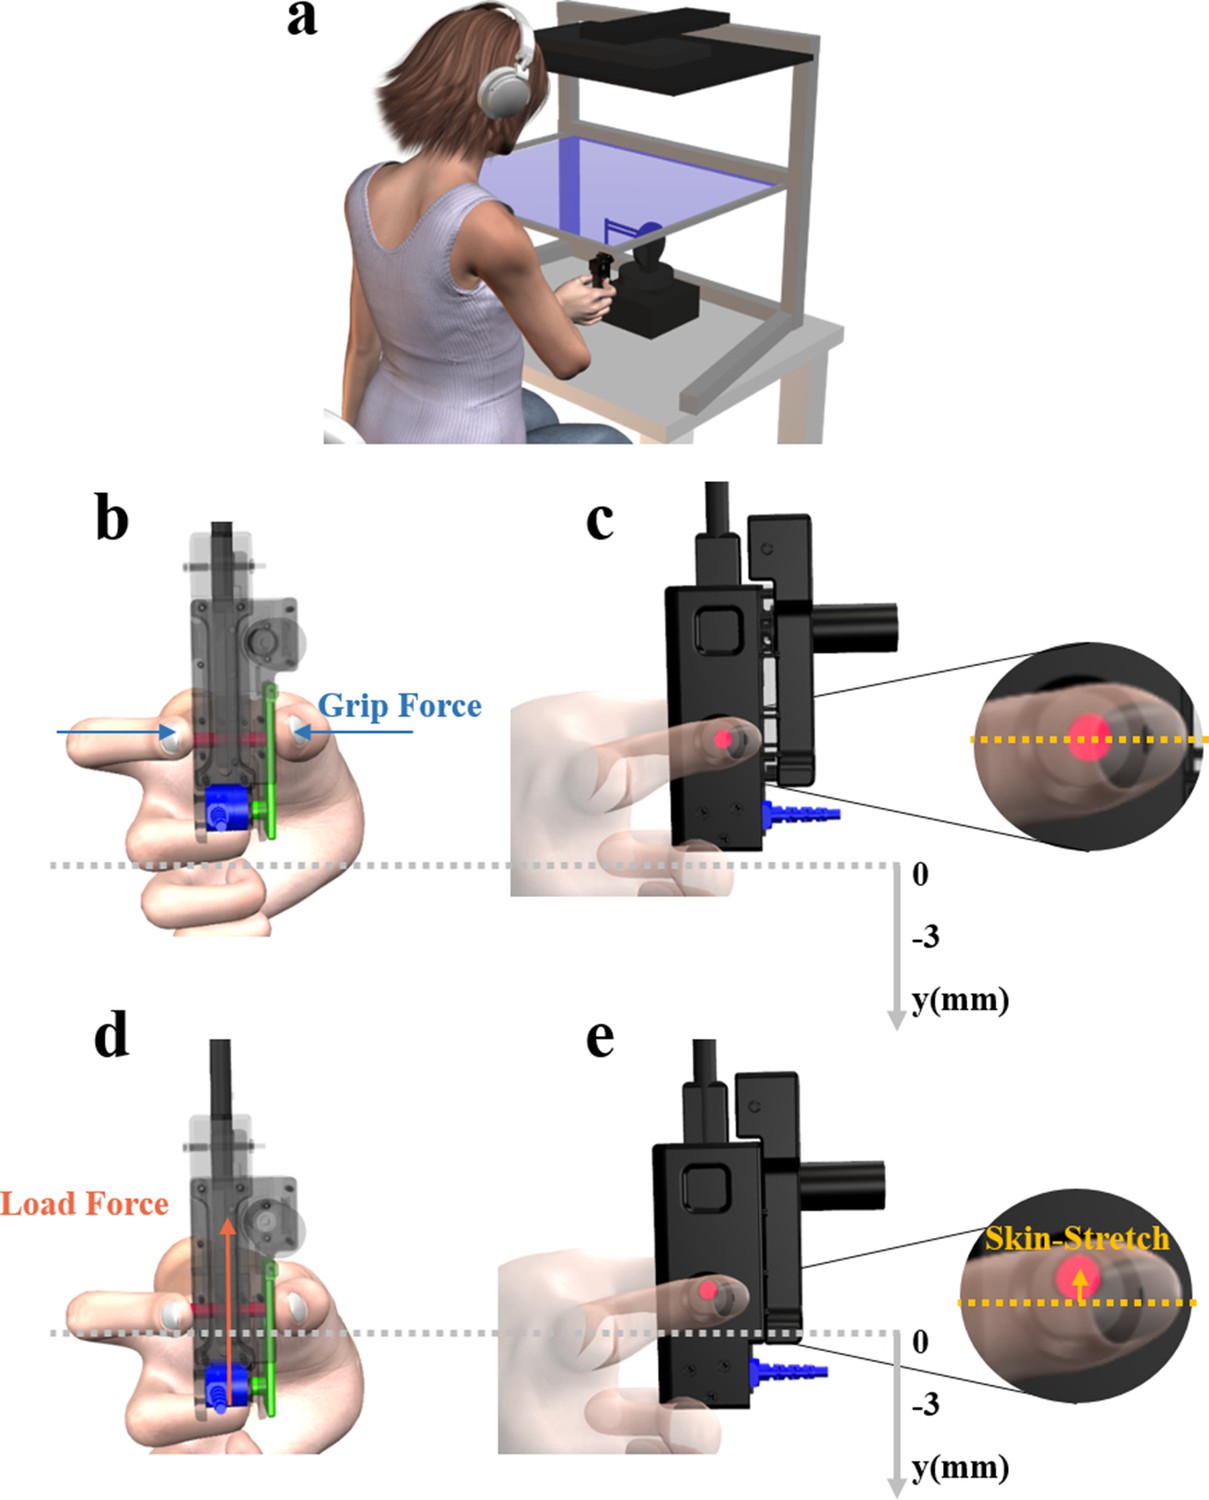
Experimental system.
(a) The participants sat in front of a virtual reality rig, and held the skin-stretch device, which was mounted on the end of a haptic device. (b) Back and (c) Side views of the skin-stretch device in the case of no interaction with the force field, and therefore the load force and the skin-stretch were zero. Zoomed in view of (c) illustrates that in this case the tactor (red rod) was in its zero state. (d) Back and (e) Side views of the skin-stretch device during interaction with the force field. Both the load force and the skin-stretch increased with the penetration into the force field. Zoomed in view of (d) shows the upward movement of the tactor in this case. A force sensor (blue) was embedded in the device to measure the grip force that the participants applied, via the lever (green) which transmitted the grip force from the contact point to the sensor.
Figure 2

Examples of load force (black dotted line), grip force (red solid line), and tactor displacement (different shades of blue) trajectories of a typical participant.
The gray shaded regions highlight stretch-catch probes, in which we maintained the load force but surprisingly omitted the skin-stretch. (a) Tactor displacement gain of 0 mm/m. (b) Tactor displacement gain of 33 mm/m. (c) Tactor displacement gain of 66 mm/m. (d) Tactor displacement gain of 100 mm/m.
Figure 3
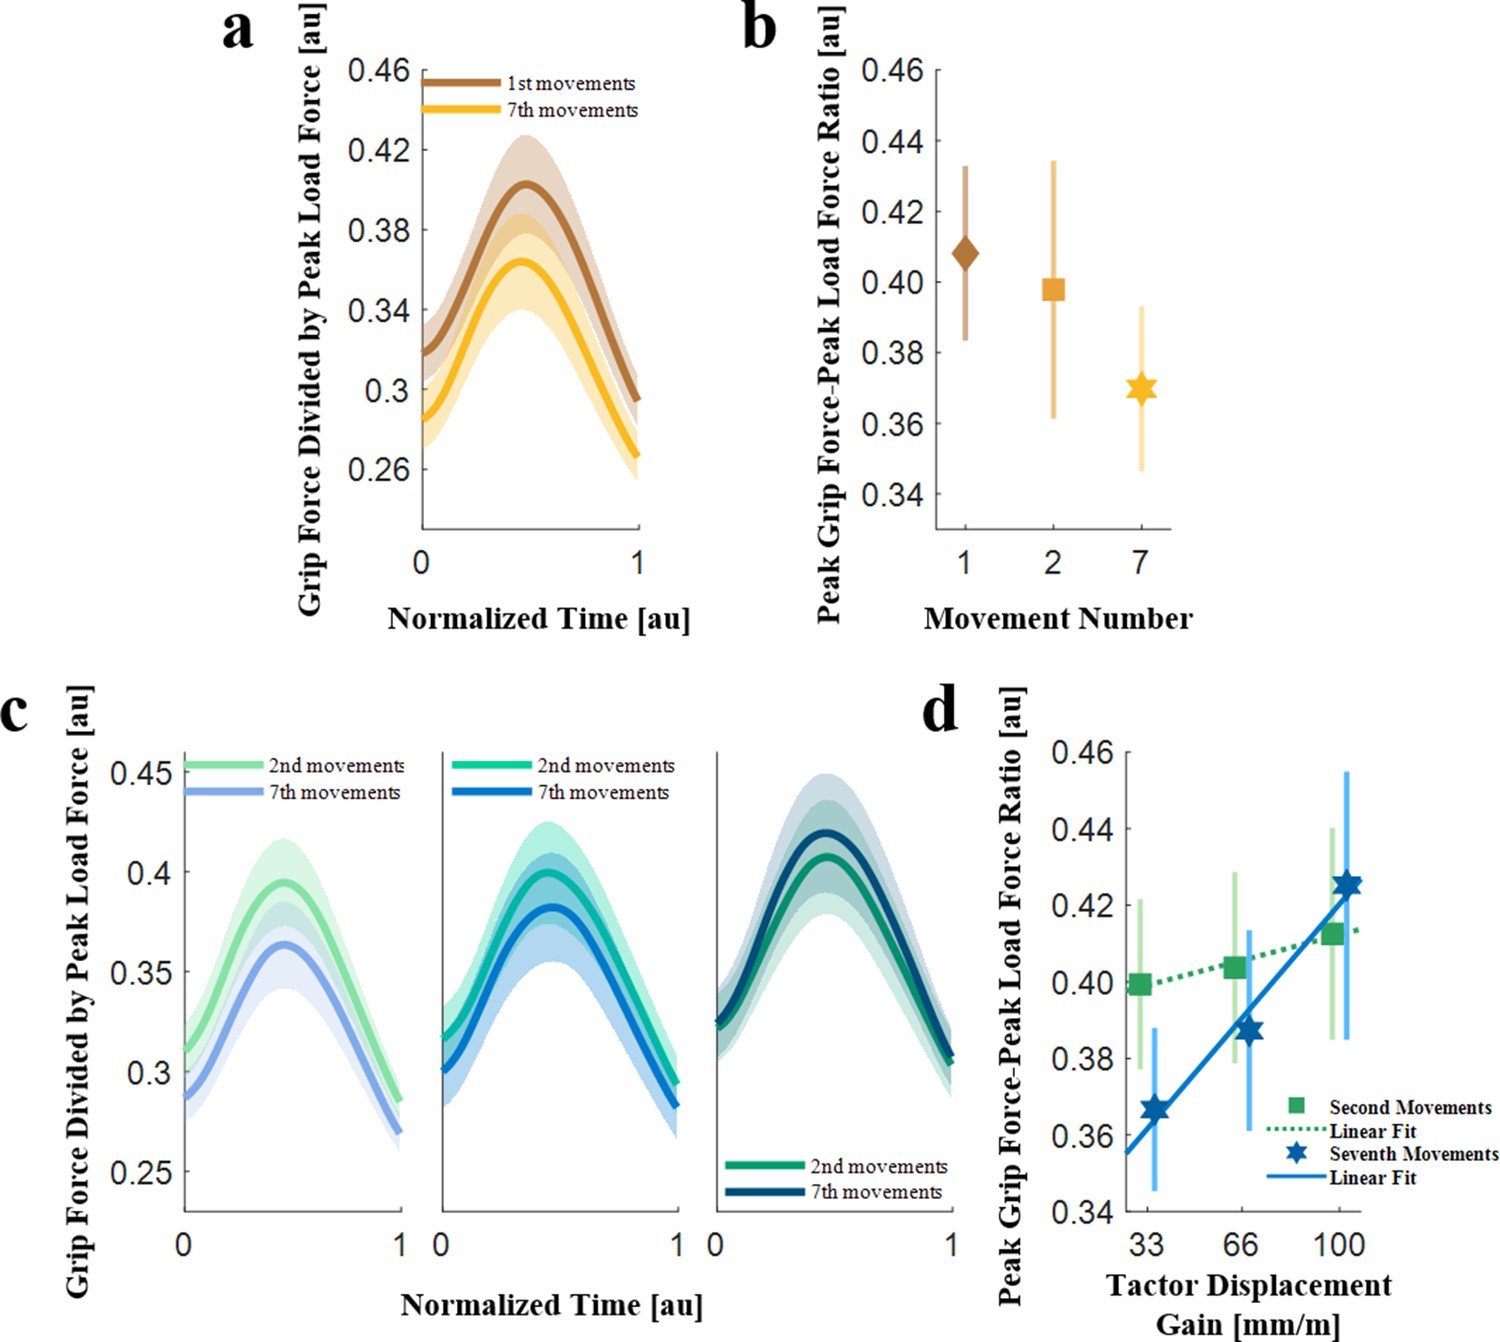
Grip force-load force ratios (N = 10).
(a) The grip force trajectories divided by the peak load force averaged across all the participants, for the first (brown) and seventh (orange) probing movements in the trials with no skin-stretch. The trajectories were time-normalized and aligned such that 0 was the onset of the contact with the force field, and one was the end of the interaction. The shading represents the standard errors. (b) The peak grip force-peak load force ratio in the first, second, and seventh probing movements. The markers and the vertical lines represent the peak grip force-peak load force ratios averaged across all the participants, and their standard errors, respectively. (c) The grip force trajectories divided by the peak load force averaged across all the participants, for the second (green) and seventh (blue) probing movements in trials with skin-stretch. (left: tactor displacement gain of 33 mm/m, middle: 66 mm/m, and right: 100 mm/m). The trajectories were time-normalized and aligned such that 0 was the onset of the contact with the force field, and one was the end of the interaction. The shading represents the standard errors. (d) The peak grip force-peak load force ratio in the second (green) and seventh (blue) probing movements in the trials with skin-stretch, as a function of the tactor displacement gain. The markers and the vertical lines represent the peak grip force-peak load force ratios averaged across all the participants, and their standard errors, respectively. The dotted green and solid blue lines represent the average fitted regression lines.
Figure 4
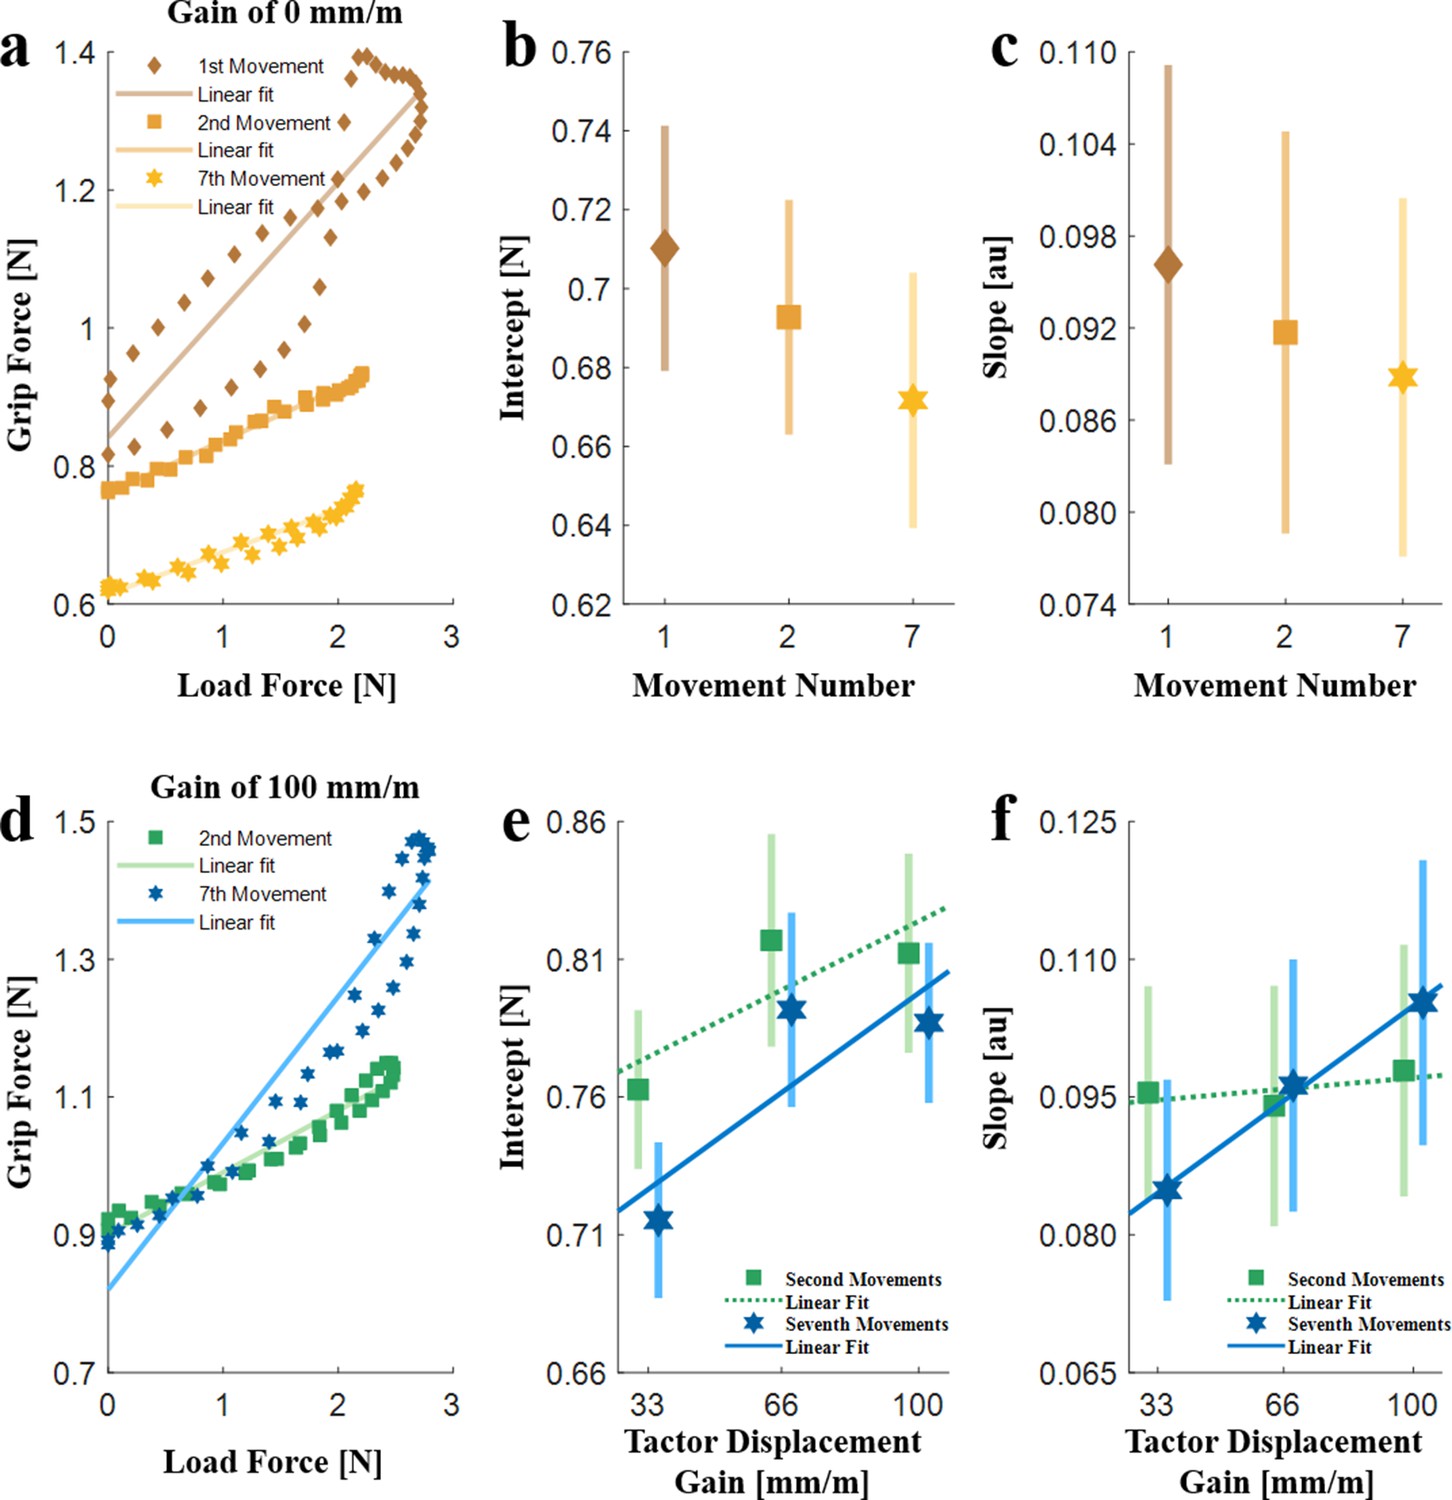
The linear regression analysis (N = 10).
(a) An example of grip force-load force regression of the first, second and seventh probing movements in a trial with a gain of 0 mm/m. (b) Intercept and (c) Slope of the regression for the 0 mm/m gain trials averaged across all the participants in the first, second, and seventh probing movements. (d) An example of grip force-load force regression of the second and seventh probing movements in a trial with a gain of 100 mm/m. (e) Intercept and (f) Slope, for the different levels of the tactor displacement gain. The dotted green and solid blue lines represent the average fitted regression lines. The markers and the vertical lines represent the values averaged across all the participants, and their standard errors, respectively.
Figure 5
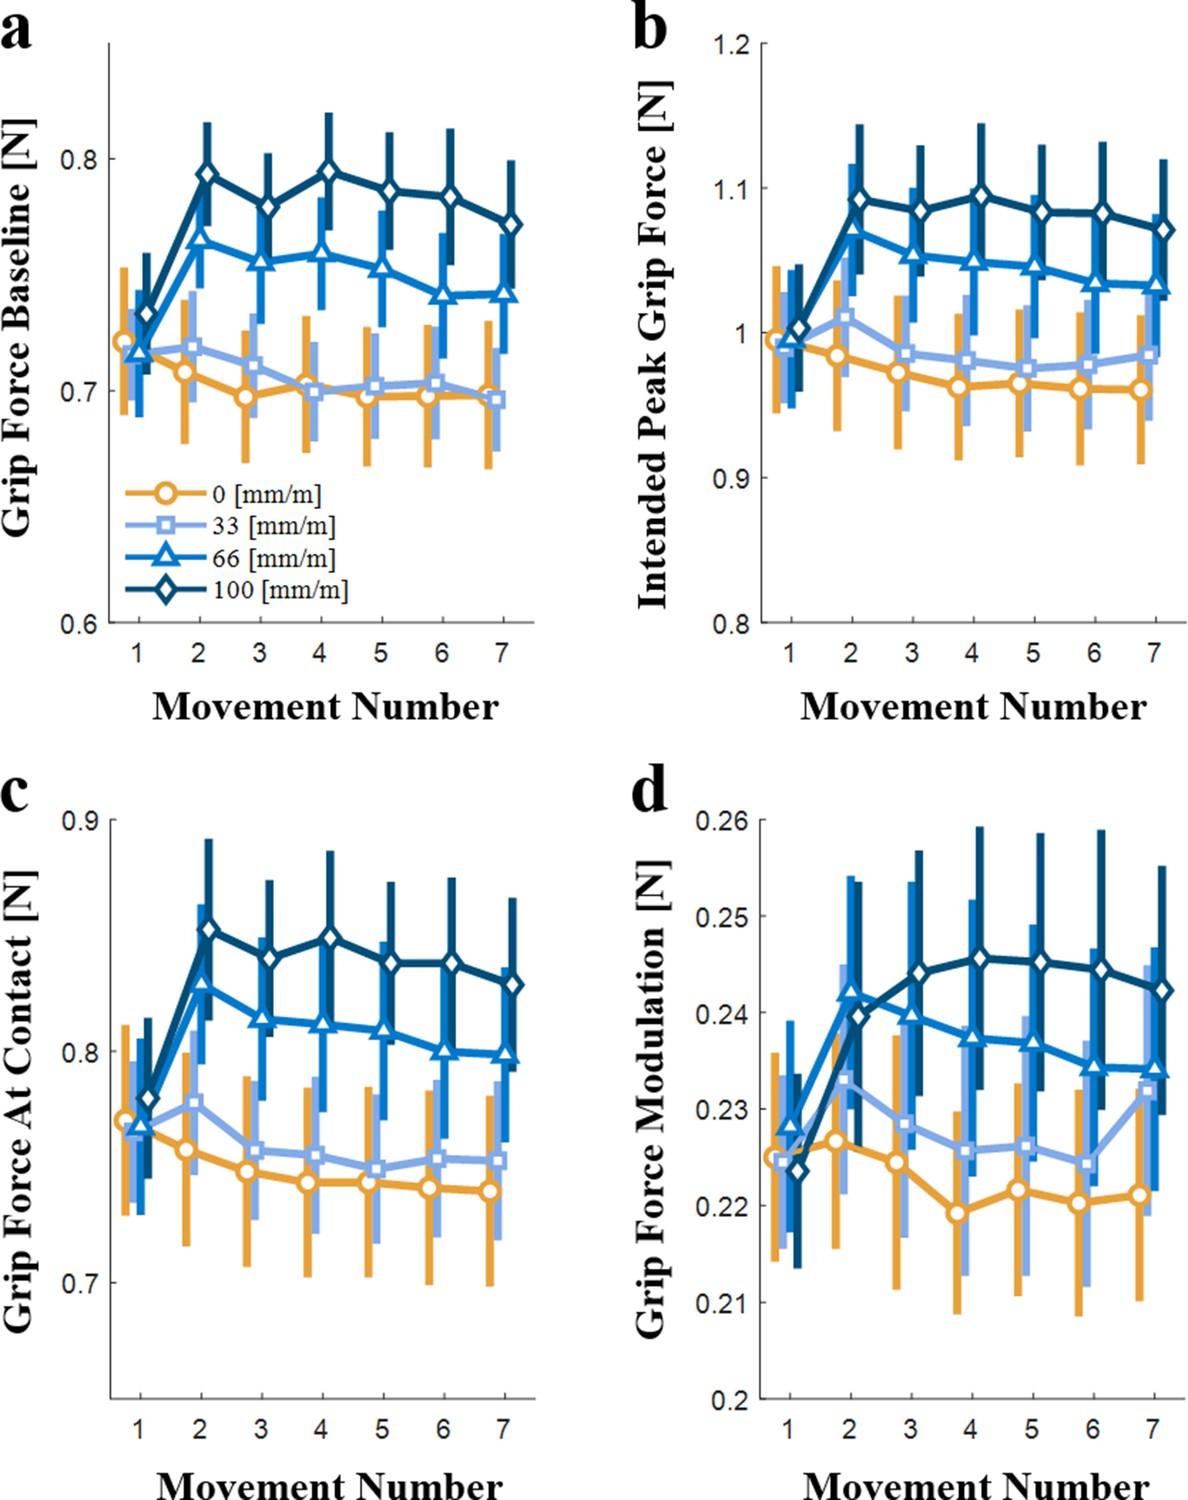
Evolution of the predictive control of grip force with repeated interaction (N=10).
(a) The grip force baseline, (b) the intended peak grip force, (c) the grip force at contact, and (d) the grip force modulation during the interaction with the elastic force field, all as a function of the movement number. The yellow lines and symbols represent trials with tactor displacement gain of 0 mm/m, and the different shades of blue represent positive tactor displacement gains (33, 66, and 100 mm/m). Each symbol is the average value for all the participants, and the vertical lines represent the standard errors.
Figure 6
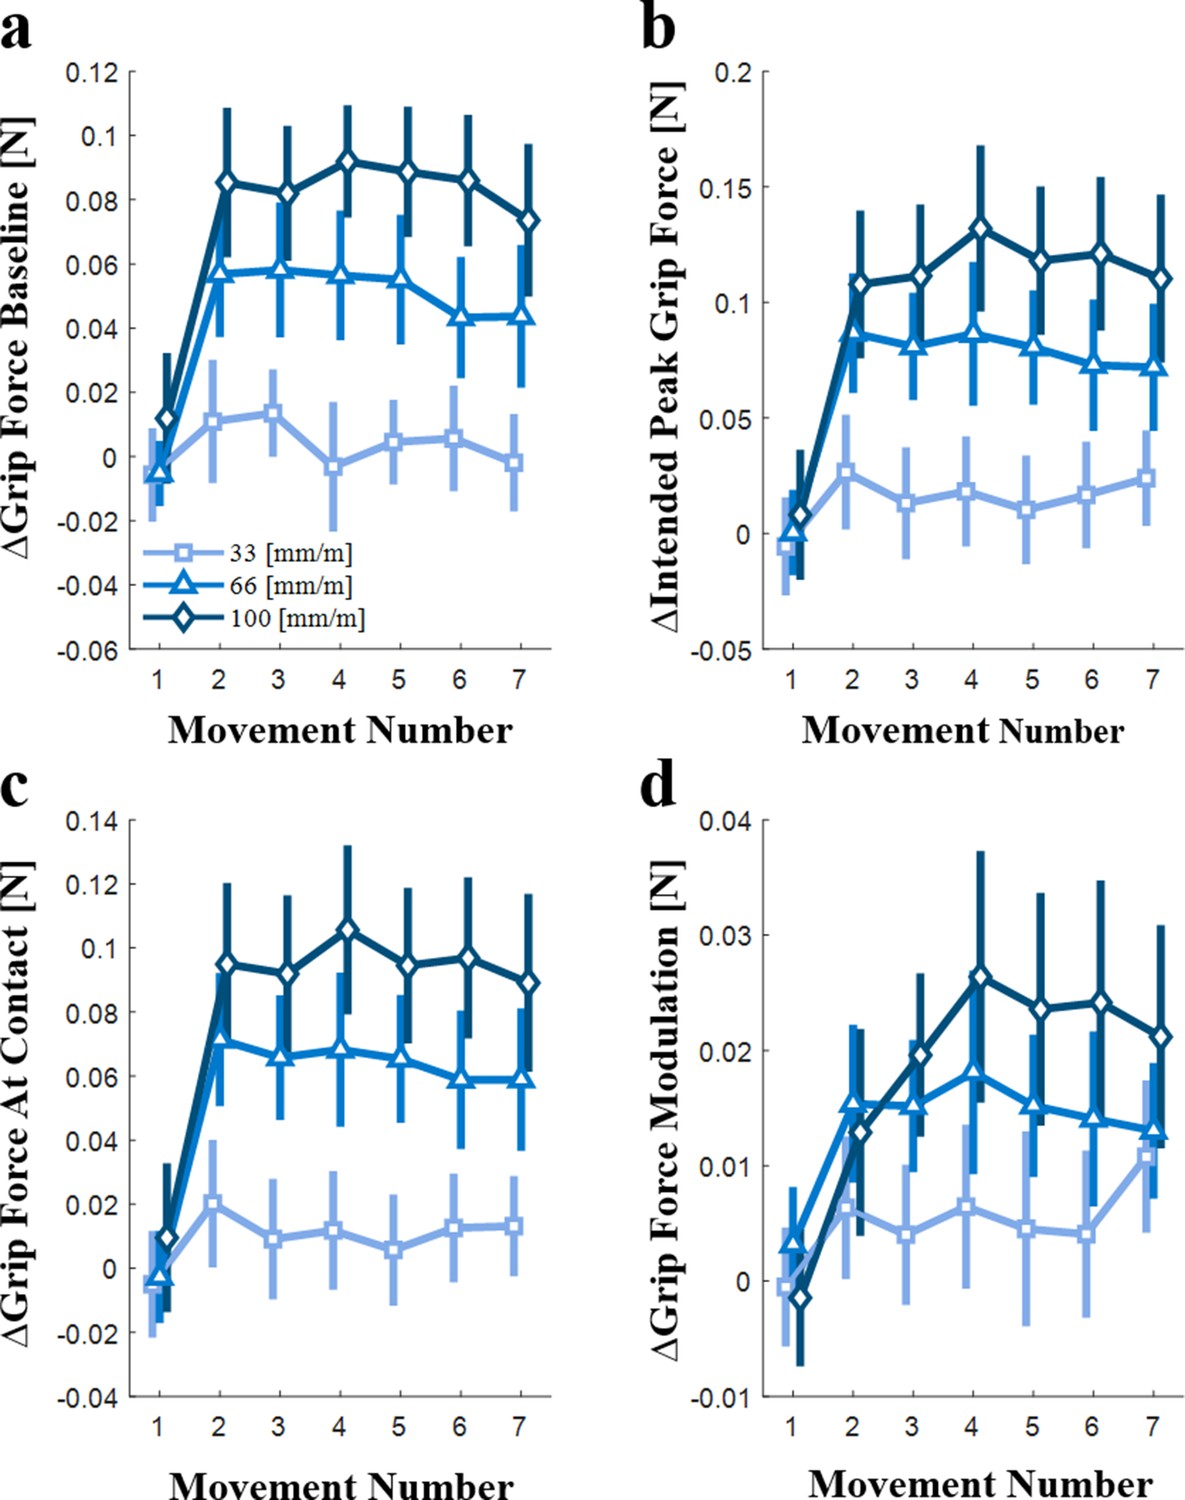
The effect of artificial stretch stimulation on the evolution of the predictive control of grip force with repeated interaction (N=10).
The difference between the effect of positive tactor displacements gains (33, 66, and 100 mm/m) and the 0 mm/m tactor displacement gain on (a) the grip force baseline, (b) the intended peak grip force, (c) the grip force at contact, and (d) the grip force modulation during interaction with the elastic force field, all as a function of the movement number. The different shades of blue represent the different positive tactor displacement gains (33, 66, and 100 mm/m). Each symbol is the average value for all the participants (N = 10), and the vertical lines represent the standard error.
Figure 7
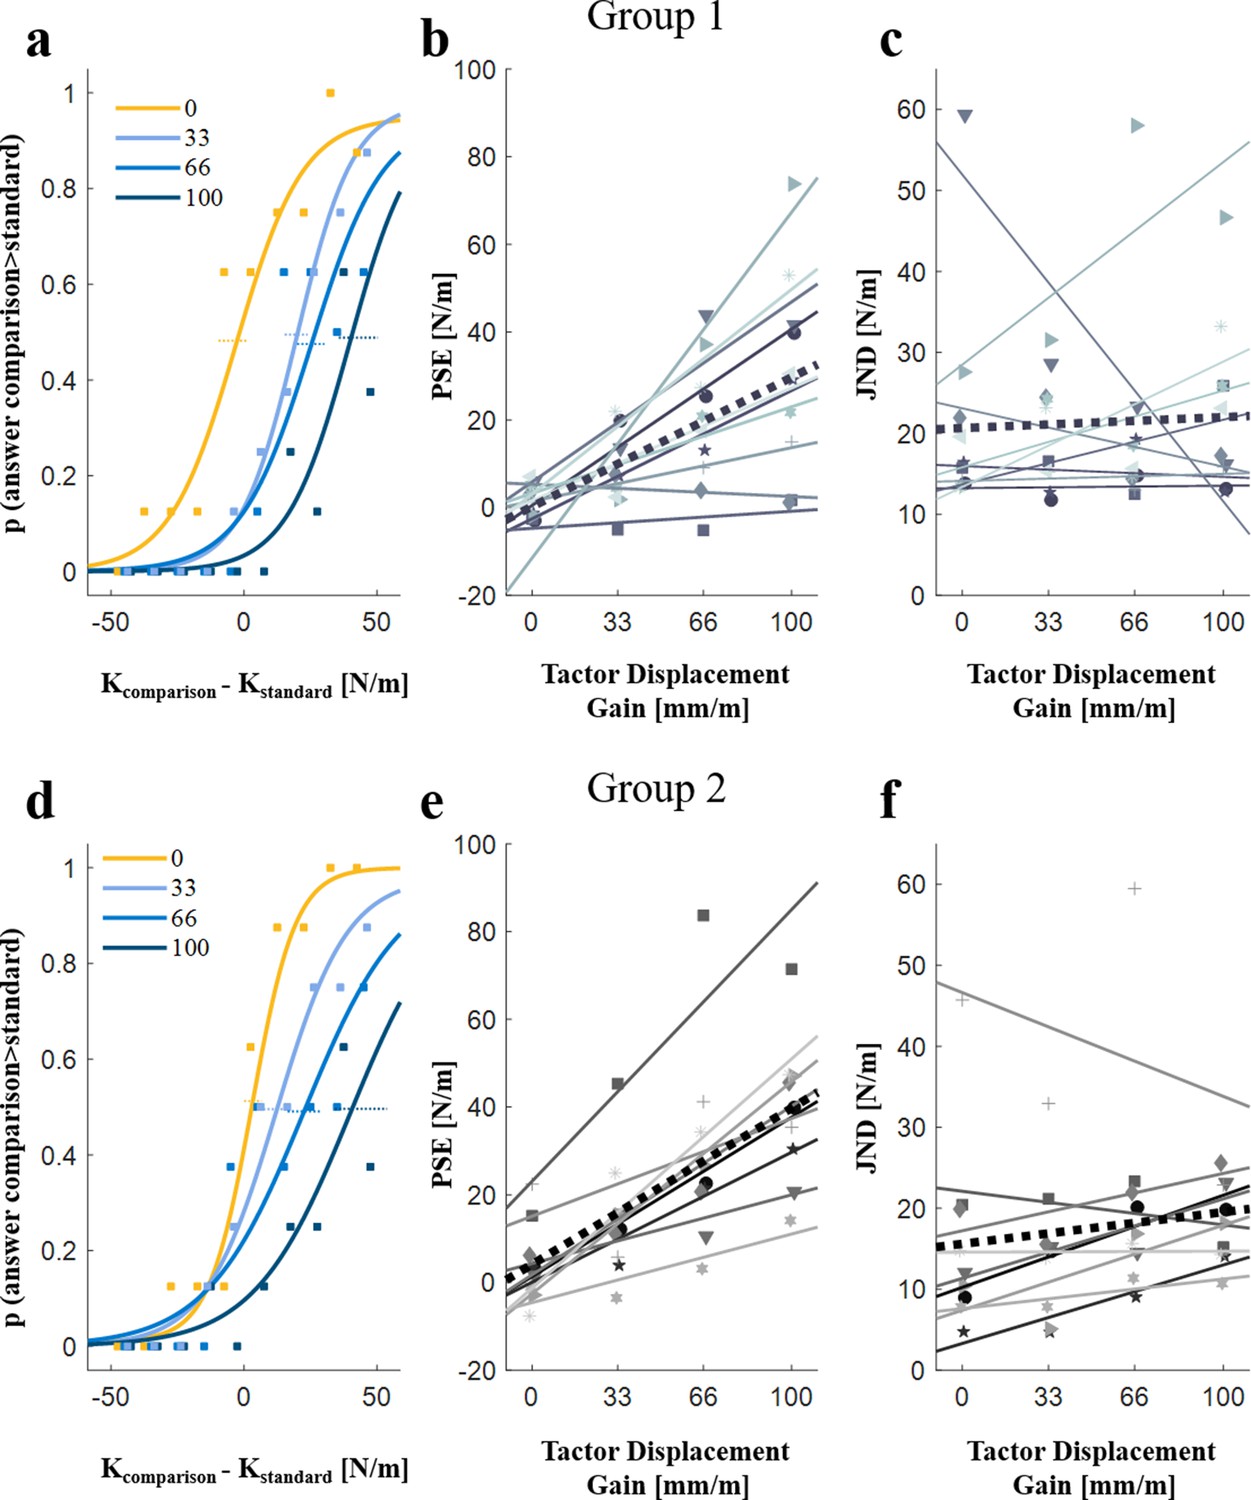
The effect of artificial skin-stretch on perception.
Example of psychometric curves of typical participants for different levels of tactor displacement gain from (a) Groups 1 and (d) Group 2. The abscissa is the difference between the stiffness levels of the comparison and the standard force fields. The ordinate is the probability of responding that the comparison force field had higher level of stiffness. The four different curves represent the participant’s responses for the four different values of the tactor displacement gain (0, 33, 66, and 100 mm/m). The horizontal dotted lines represent the standard errors for the PSE (Point of Subjective Equality).The PSE values as a function of the tactor displacement gain for (b) Group 1 (N = 10) and (e) Group 2 (N = 9).The JND (Just Noticeable Difference) values as a function of the tactor displacement gain for (c) Group 1 (N = 10) and (f) Group 2 (N = 9), respectively. The markers represent the PSE and JND values of each participant. The solid lines show the linear regression of the PSE (b) and (e) or JND (c) and (f) values as a function of the tactor displacement gain for each of the participants, and the black dotted line is the average regression line across all participants.
Figure 8
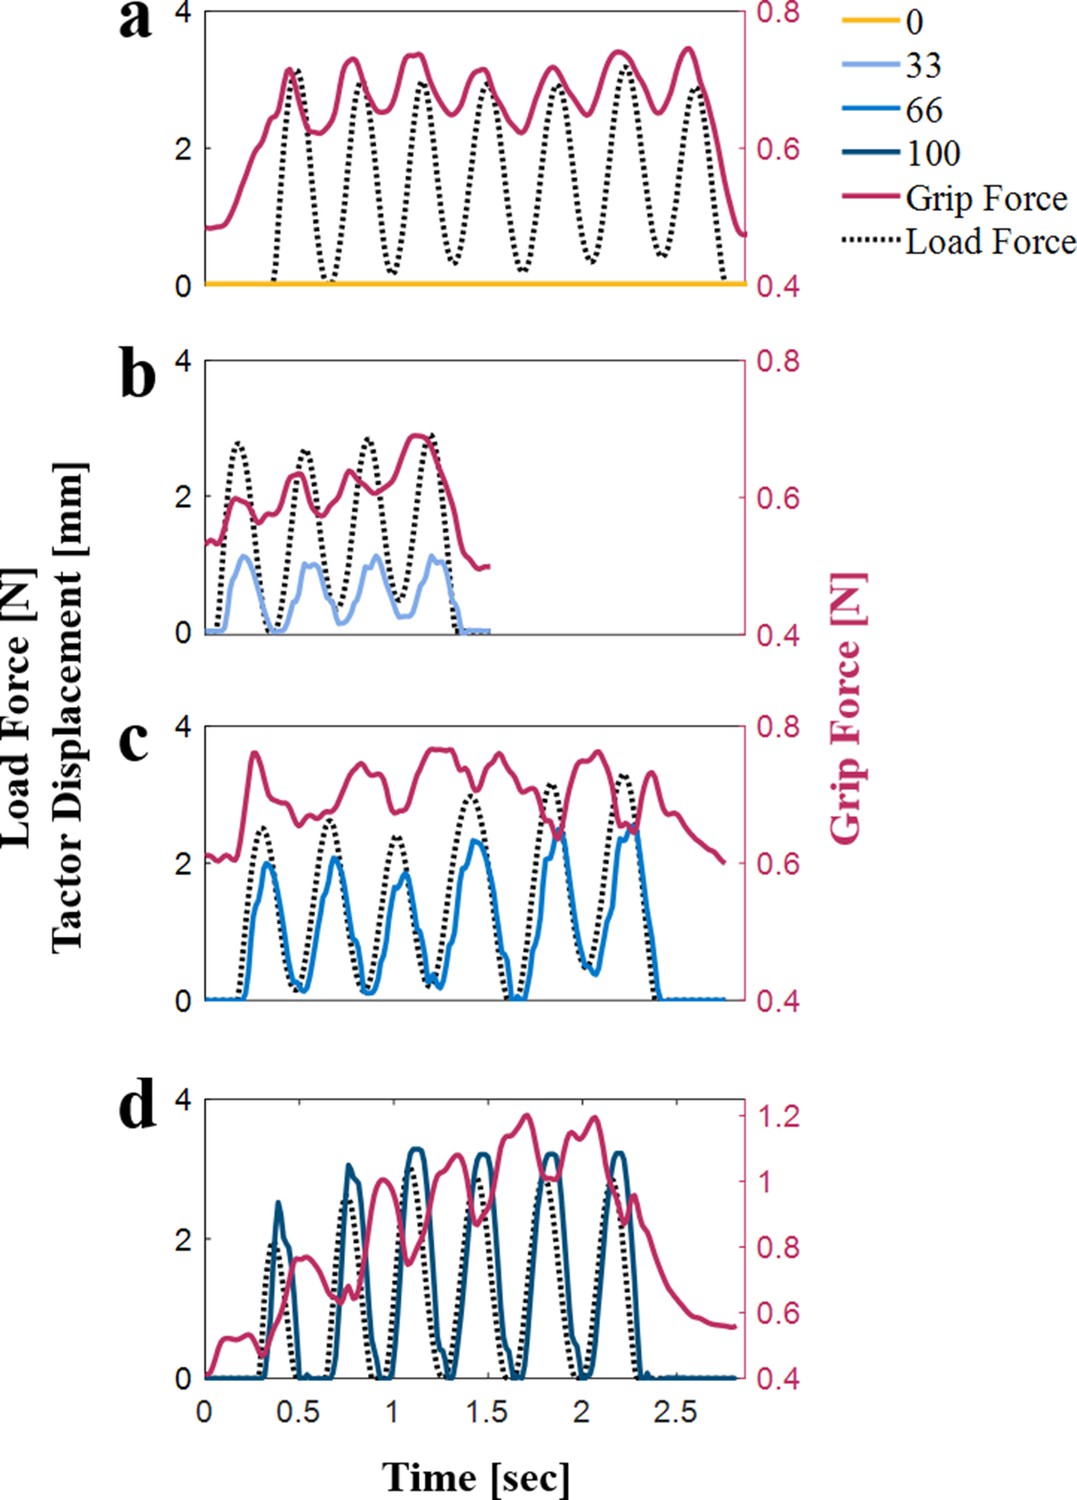
Examples of load force (black dotted line), grip force (red solid line), and tactor displacement (different shades of blue) trajectories of a typical participant from the free exploration group (Group 2).
(a) Tactor displacement gain of 0 mm/m. (b) Tactor displacement gain of 33 mm/m. (c) Tactor displacement gain of 66 mm/m. (d) Tactor displacement gain of 100 mm/m. The scale of the lower panel is different from the scale of the other panels because we wanted to emphasize the irregular peak pattern that we observed for high levels of tactor displacement gain.
Figure 9

Analysis of peak grip force-peak load force ratio from the free exploration group (Group 2).
The average ratios in the first (green) and last (blue) probing movements. The markers and vertical lines represent the peak grip force-peak load force ratios averaged across all the participants (N = 9) and their standard errors, respectively. The dotted green and solid blue lines represent the average fitted regression lines.
Appendix 1—figure 1

Reactive Experiment 1 (active experiment).
The reactive grip force response for different levels of tactor displacement gain from the second (a) and seventh (b) probing movements. The lines represent the mean trajectories across all the participants (N = 10), the shaded regions represent the standard errors, and the black vertical dashed lines represent the time of the interaction with the elastic force field.
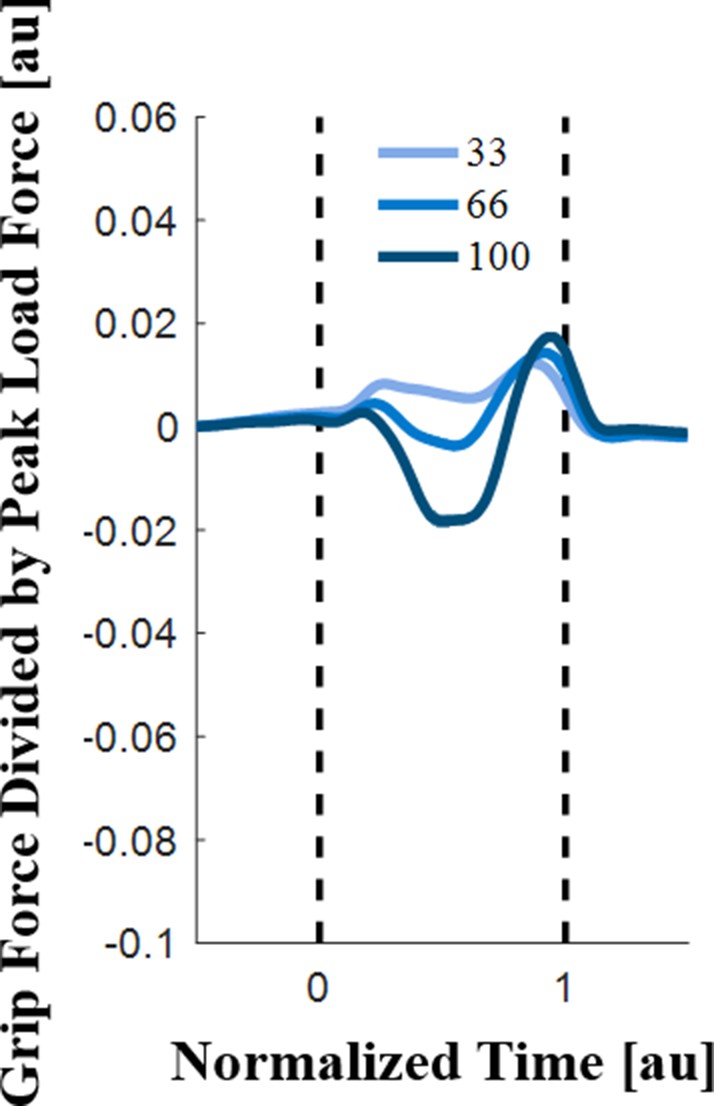
Appendix 1—figure 2
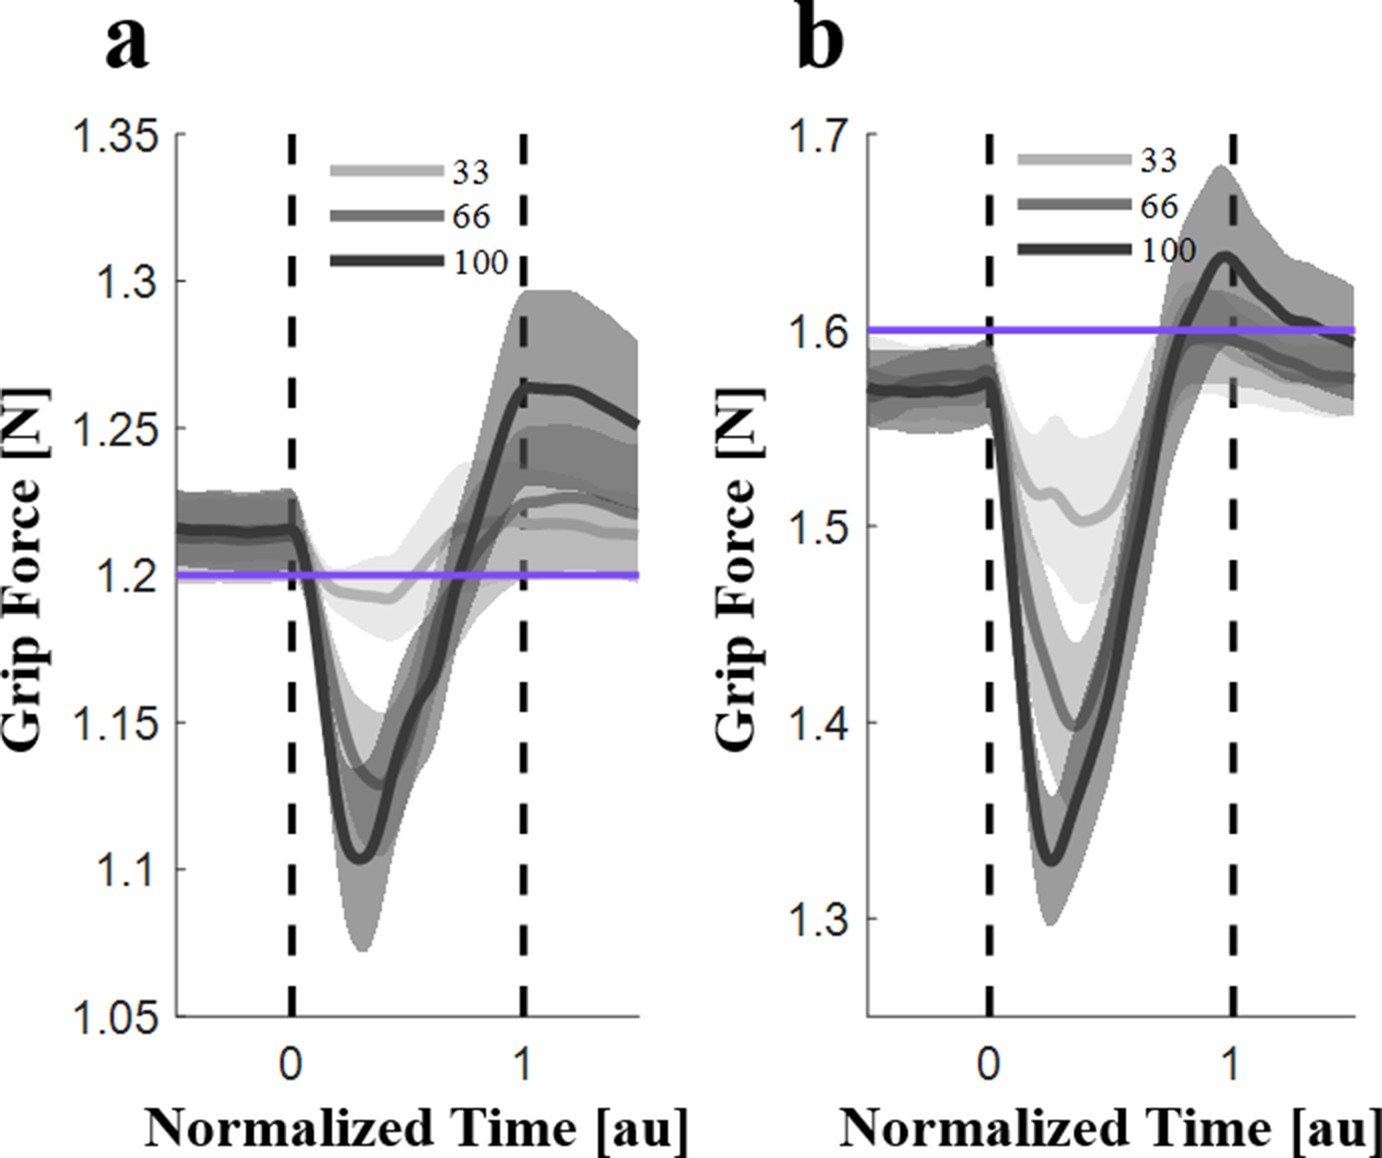
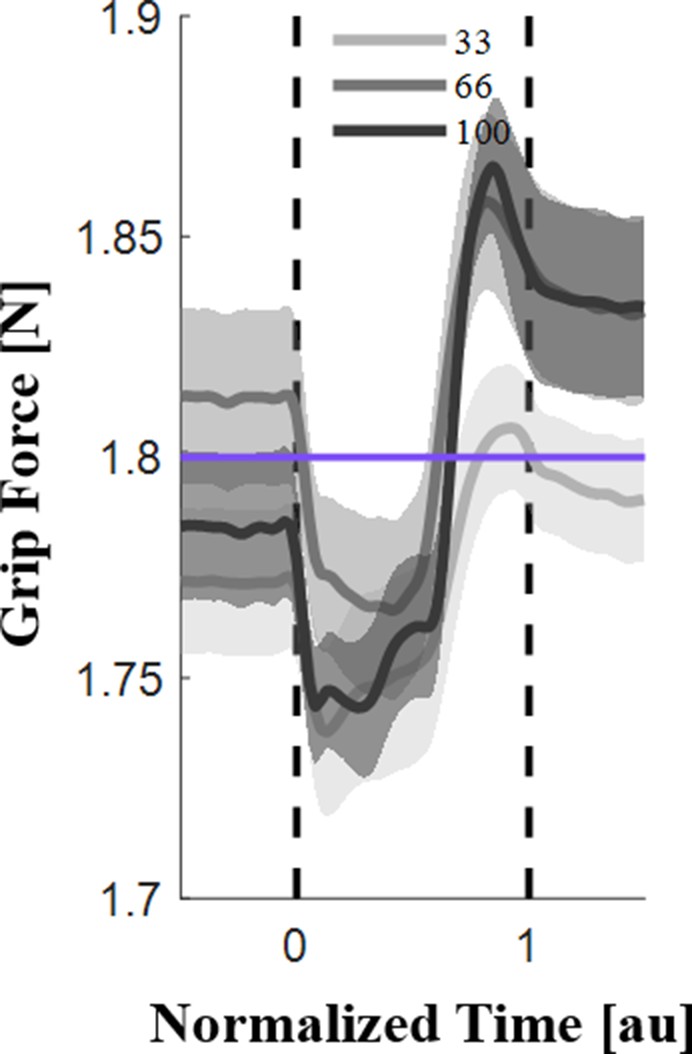
Reactive Experiment 2 (passive experiment).
Averaged grip force trajectories across all the participants (N = 6) for different levels of tactor displacement gain. Shading represents the standard errors, and the black vertical dashed lines represent the time of the interaction with the stretch. The purple horizontal lines represent the target grip force. (a) Target grip force of 1.2N. (b) Target grip force of 1.6N.
Appendix 1—figure 3
Control Experiment 1 (active experiment).
Average grip force artifact trajectories divided by the peak load force. Shading represents the standard errors, and the black vertical dashed lines represent the time of the interaction with the elastic force field.
Appendix 1—figure 4
Control experiment 2 (passive experiment).
Average grip force artifact trajectories for the different levels of tactor displacement gain. Shading represents the standard errors, and the black vertical dashed lines represent the time of the interaction with the stretch. The purple line represents the grip force level required for the initiation of the stretch.
Appendix 2—figure 1
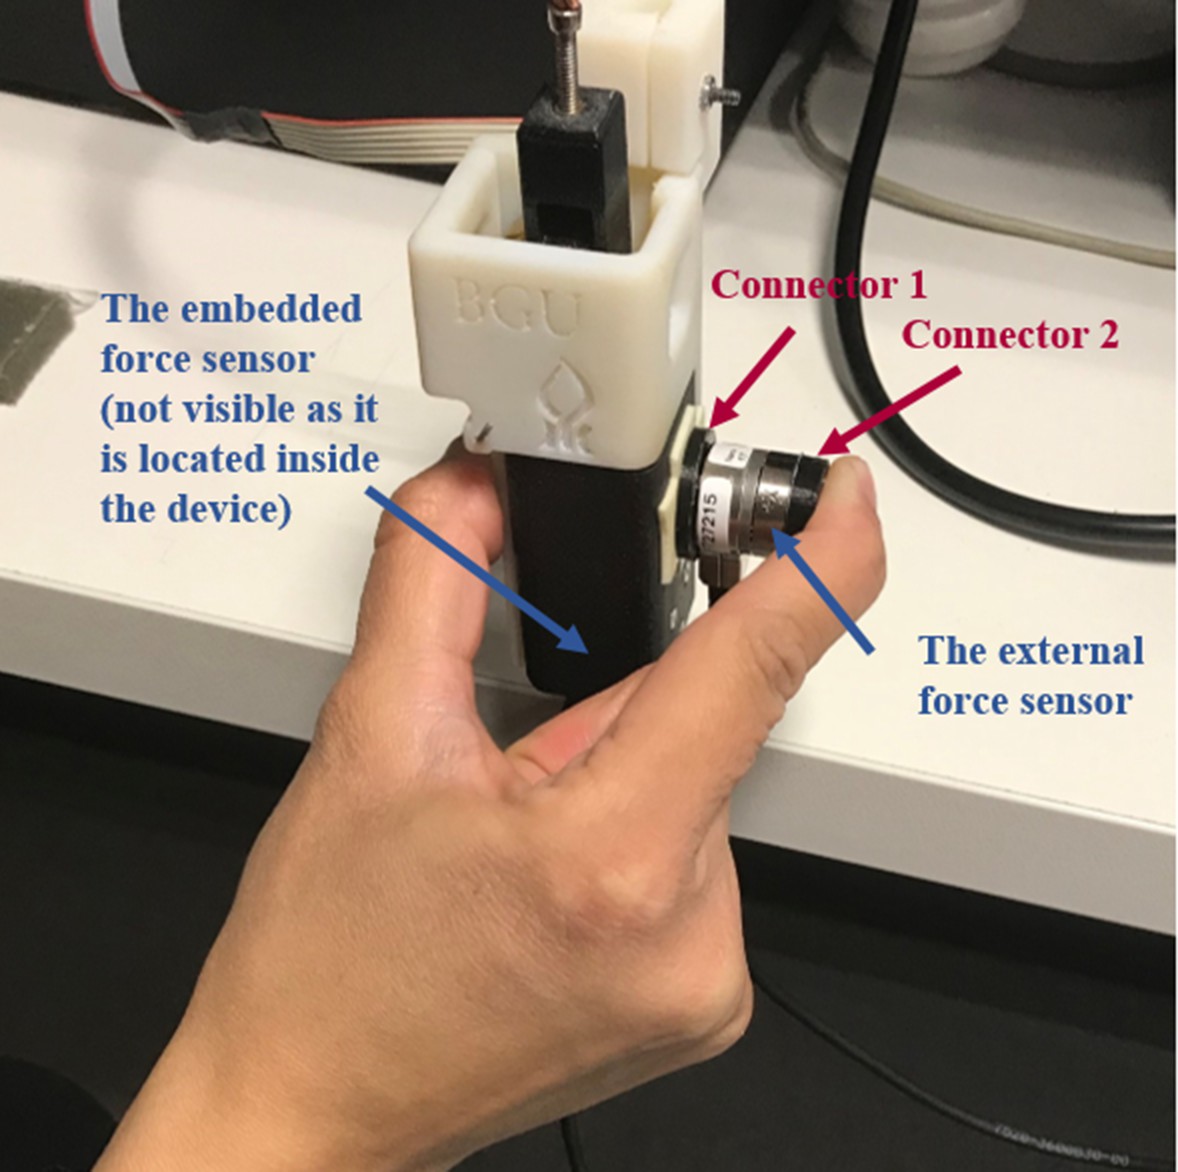
The experimental system of the grip force mapping experiment.
The system consists of two force sensors: (1) The embedded force sensor, which was mounted on the lower end of the device so that participants did not place their fingers directly above the force sensor (not visible here because it located inside the outer black part of the aperture. (2) An external force sensor, which was connected to the outer black part of the aperture, where the participants gripped the device during the previous experiments.
Appendix 2—figure 2
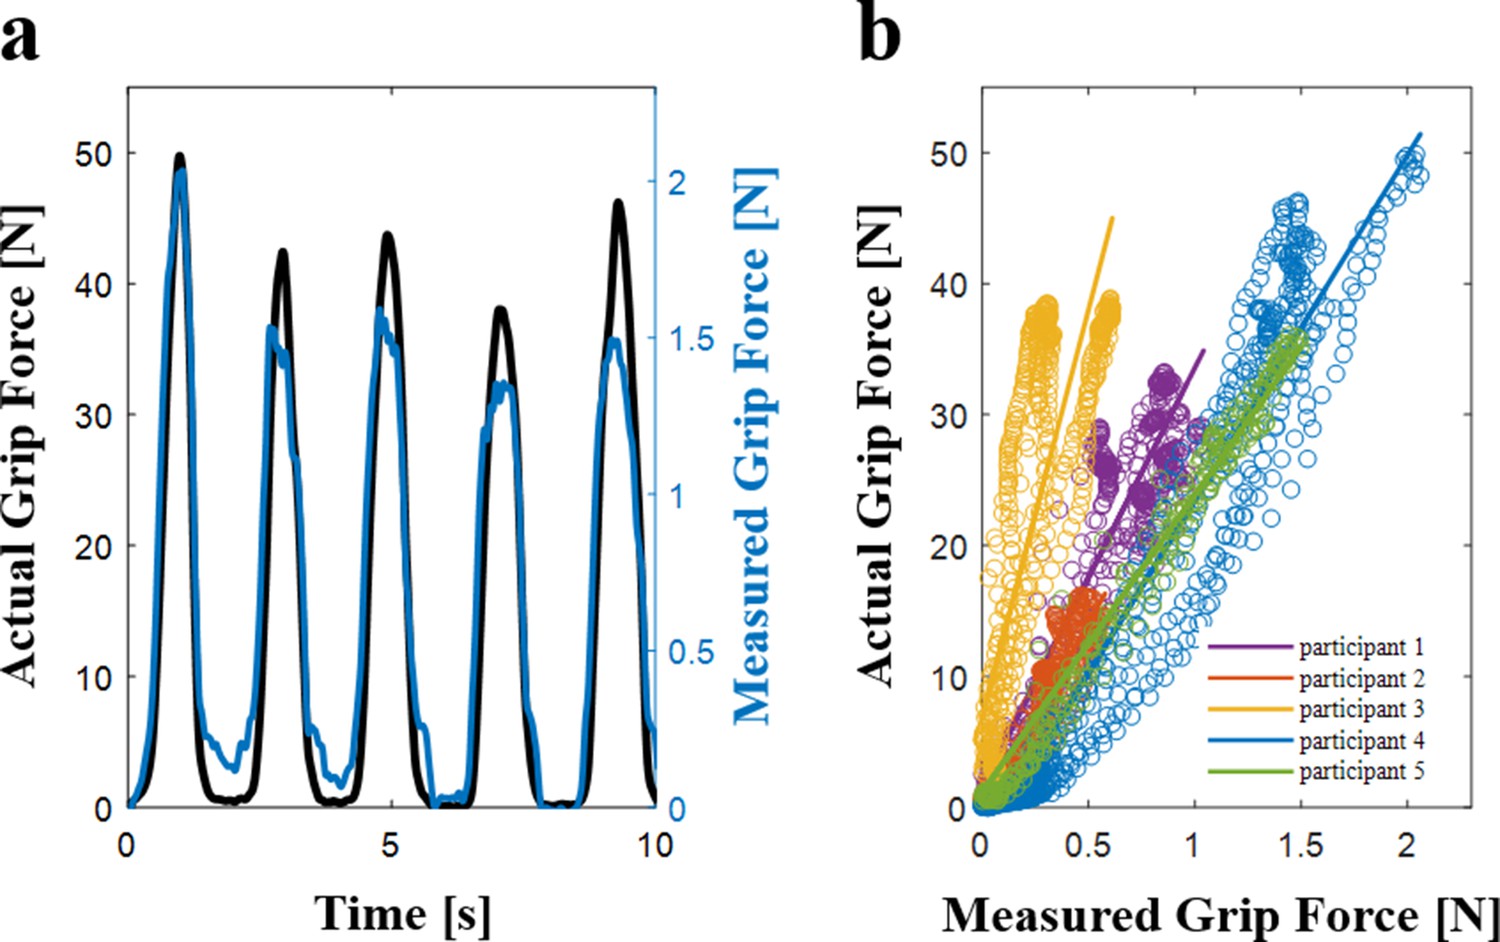
Control Experiment.
(a) The actual and the measured grip force as a function of time of a typical participant. (b) The linear regression between the actual and the measured grip force of all the participants (N = 5). The abscissa is the downscaled measured grip force using the embedded force sensor and the ordinate is the actual grip force recorded using the external force sensor. The markers represent the recorded grip force and the solid lines show the fitted regression lines.
Videos
Video 1
Experimental system with the skin-stretch device.
This video clip demonstrates the way in which participants performed the experiments; what they did with their right hand and what they saw on the screen. In addition, the video clip includes a zoom in on the skin-stretch device without the participant’s hand. The zoom in allowed us to show the tactor displacement during interaction with the elastic force field.
Additional files
Download links
A two-part list of links to download the article, or parts of the article, in various formats.
Downloads (link to download the article as PDF)
Open citations (links to open the citations from this article in various online reference manager services)
Cite this article (links to download the citations from this article in formats compatible with various reference manager tools)
Stretching the skin immediately enhances perceived stiffness and gradually enhances the predictive control of grip force
eLife 9:e52653.
https://doi.org/10.7554/eLife.52653


