A microtranslatome coordinately regulates sodium and potassium currents in the human heart
- School of Medicine and Public Health, University of Wisconsin-Madison, United States
Figures
Figure 1 with 1 supplement

Complex of ion channel transcripts with nascent proteins.
(A) Scheme of the RNA-IP protocol in which channel-specific antibodies are used to pull down nascent proteins and associated transcripts. RNP: ribonucleoprotein. (B) Lanes 1 and 2, RT-PCR products from input lysate of human left ventricle (LV), and iPSC-CM. Lanes 3–16 shows the corresponding RNA-IP’s using an anti-hERG1a or anti-NaV1.5 antibodies; Lane seven shows the control (+) and represents signal amplified from purified plasmid template. Similar results were obtained in at least three independent experiments. (N = 5 for anti-hERG1a and N = 3 for anti-Nav1.5 using human LV and iPSC-CMs).
-
Figure 1—source data 1
RNA-IP Blots raw data for Figure 1B.
- https://doi.org/10.7554/eLife.52654.004
Figure 1—figure supplement 1
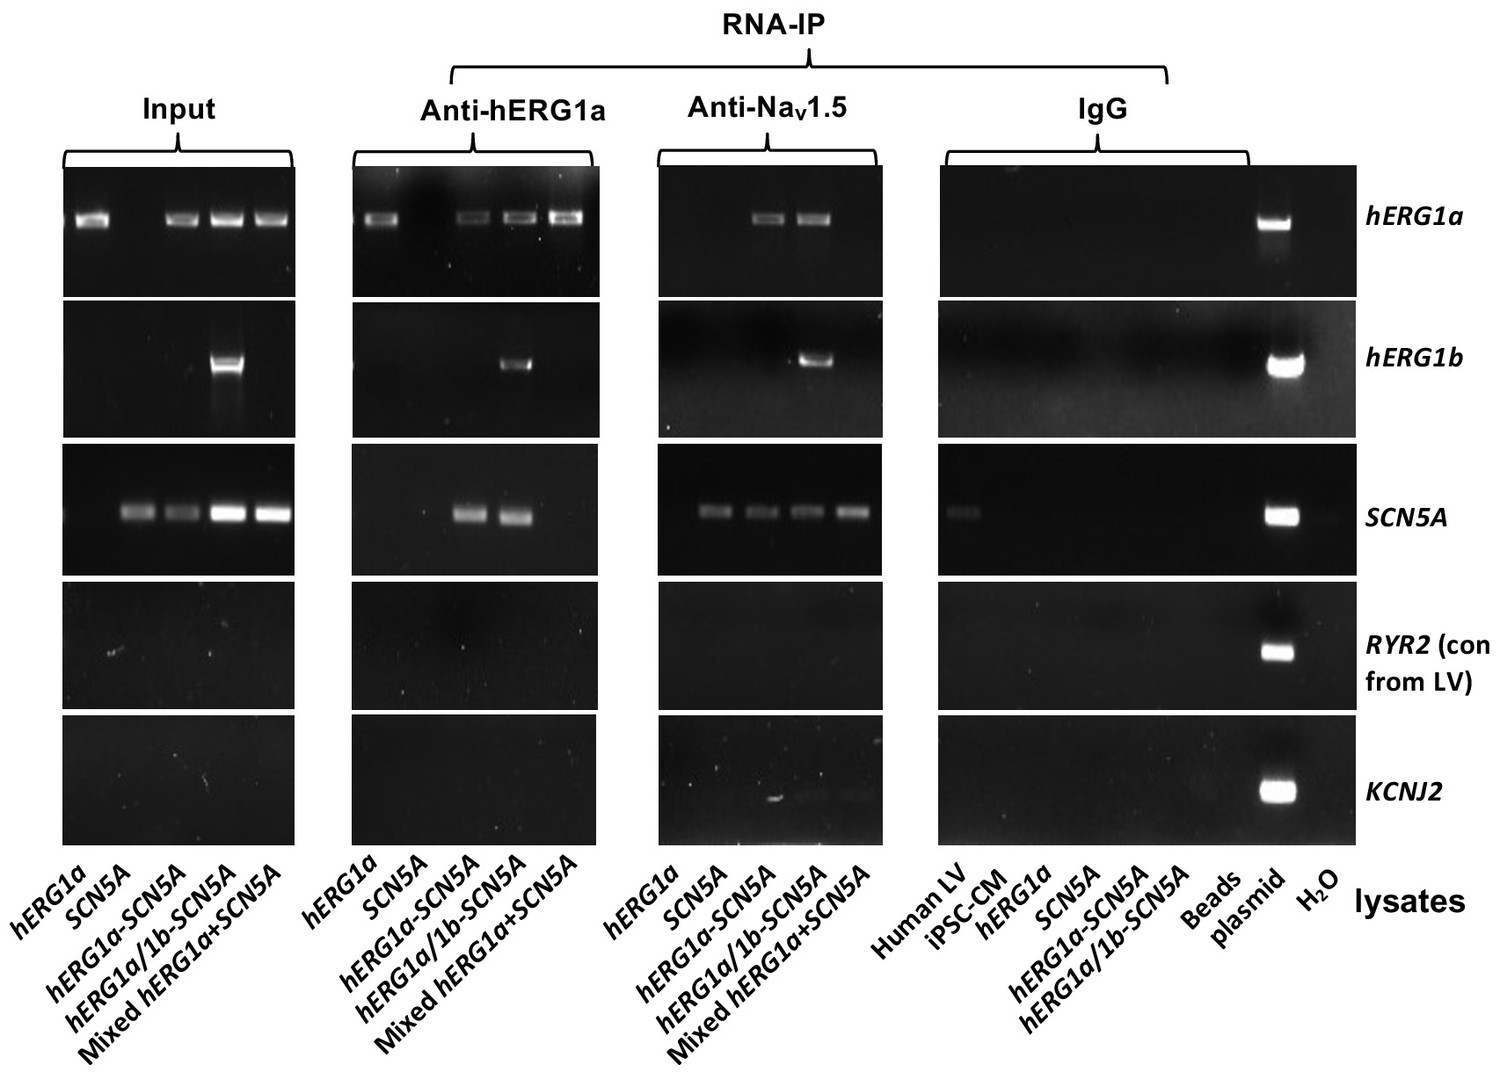
Complete RNA-IP from Figure 1.
Lanes 1–6, RT-PCR products from input lysate of human left ventricle (LV), iPSC-CM, and HEK293 cells expressing: hERG1a; SCN5A; hERG1a plus SCN5A; and hERG1a plus hERG1b and SCN5a. Lane seven shows RT-PCR product from lysates independently expressing hERG1a and SCN5A, mixed. Lanes 8–14 shows the corresponding RNA-IP’s using an anti- hERG1a antibody, followed by a bead-only control and H2O control. The next group shows the corresponding RNA-IP’s using the anti-Nav1.5 antibody, followed by a group of IgG controls. H2O and beads lanes show absence of template contamination; control (+) represents signal amplified from purified plasmid template.
Figure 2 with 3 supplements
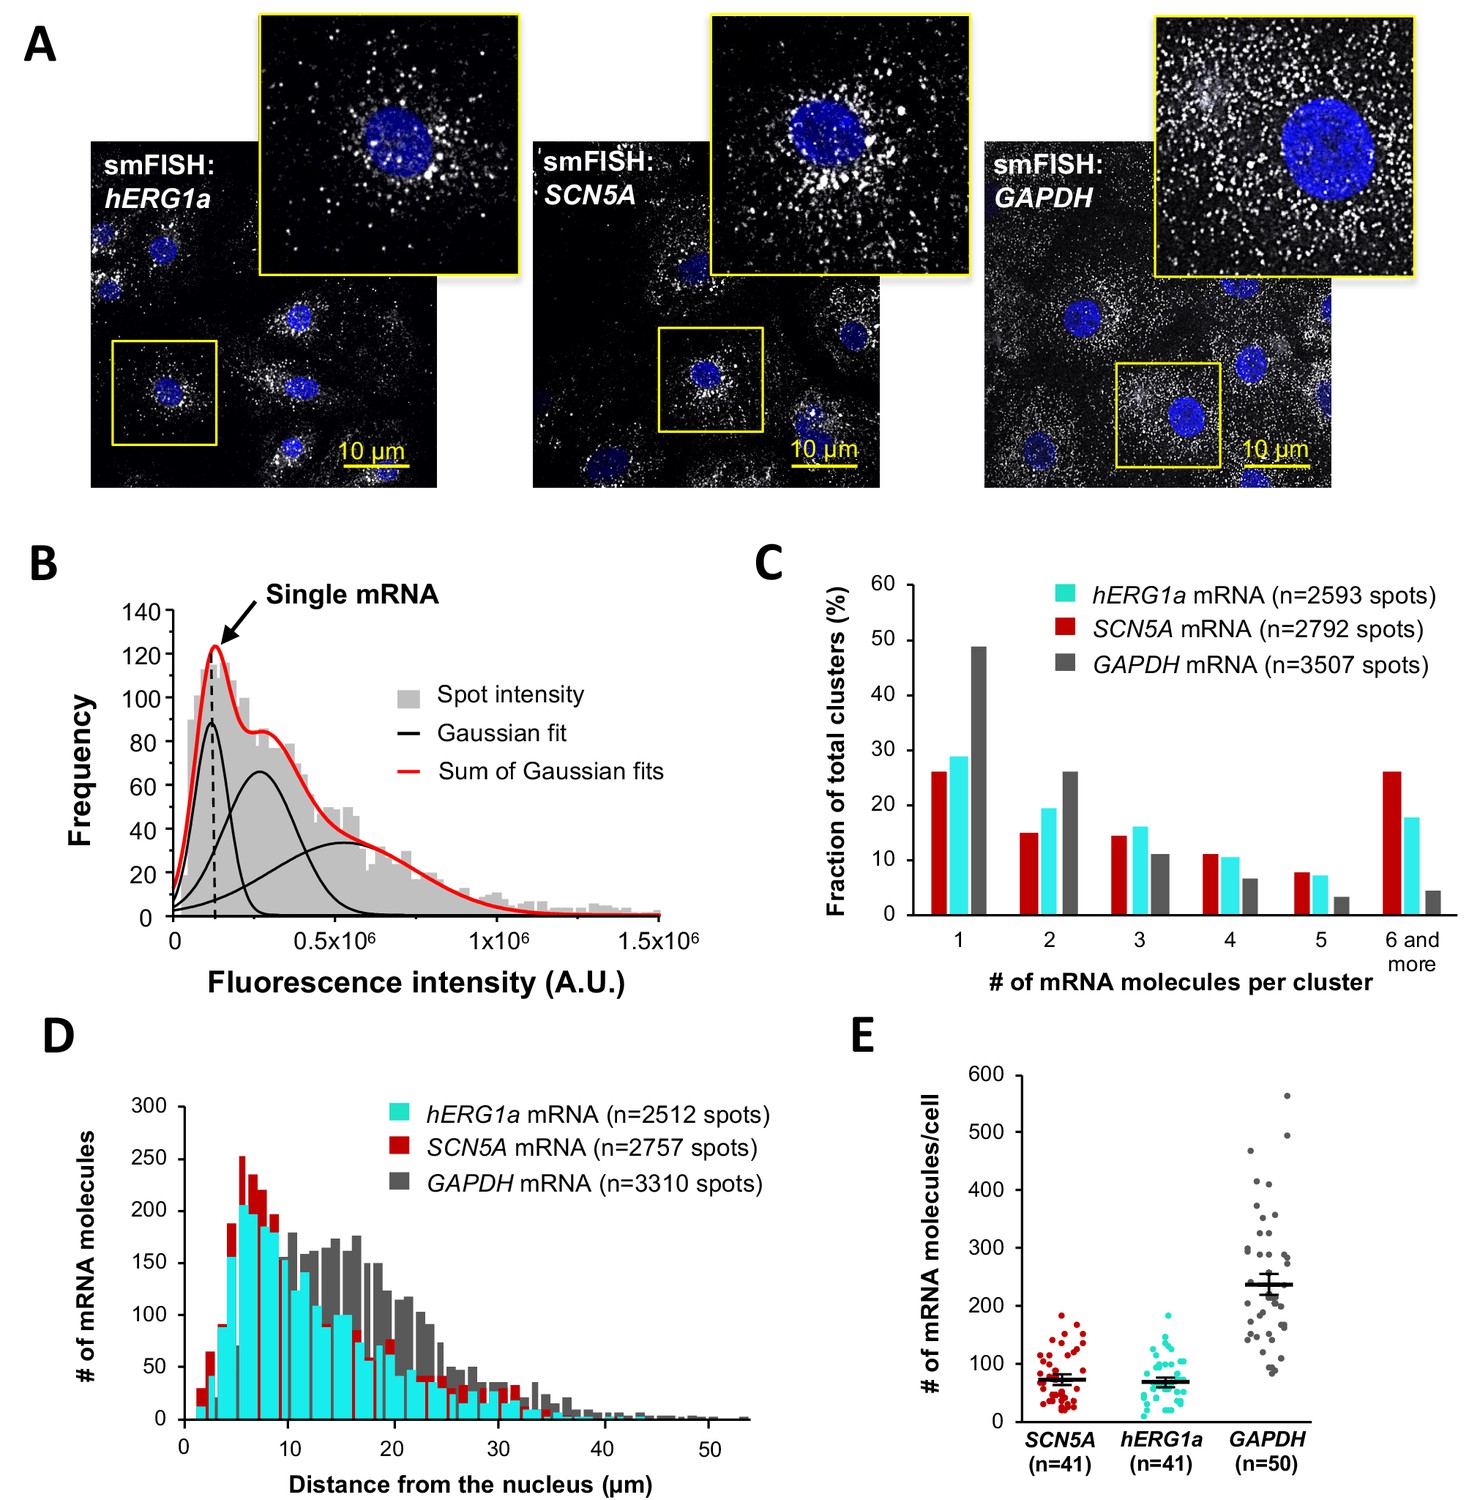
Quantitative description of single hERG1a and SCN5A transcripts and their distribution in iPSC-CMs.
(A) Representative confocal images and enlargement (outlined in yellow) of iPSC-CMs subjected to the smFISH protocol. (B) By fitting the intensity histogram of smFISH signals (n = 2611 spots) to the sum of Gaussian functions (red line), the typical intensity corresponding to a single mRNA molecule (vertical dashed line) was extracted. (C) The distribution of the number of mRNA molecules associated in clusters for each transcript evaluated by smFISH. (D) Histogram showing the cytoplasmic distribution of mRNA signals with distance from the nucleus. (E) The number of mRNAs detected per cell was plotted for SCN5A, hERG1a and GAPDH (lines represent mean ±SE).
-
Figure 2—source data 1
Intensities plot for determination of single mRNA intensity raw data for Figure 2B.
- https://doi.org/10.7554/eLife.52654.010
-
Figure 2—source data 2
Clusterization of transcripts raw data for Figure 2C.
- https://doi.org/10.7554/eLife.52654.011
-
Figure 2—source data 3
Distance of mRNA from the nucleus raw data for Figure 2D.
- https://doi.org/10.7554/eLife.52654.012
-
Figure 2—source data 4
Numbers of mRNA per cells raw data for Figure 2E.
- https://doi.org/10.7554/eLife.52654.013
Figure 2—figure supplement 1
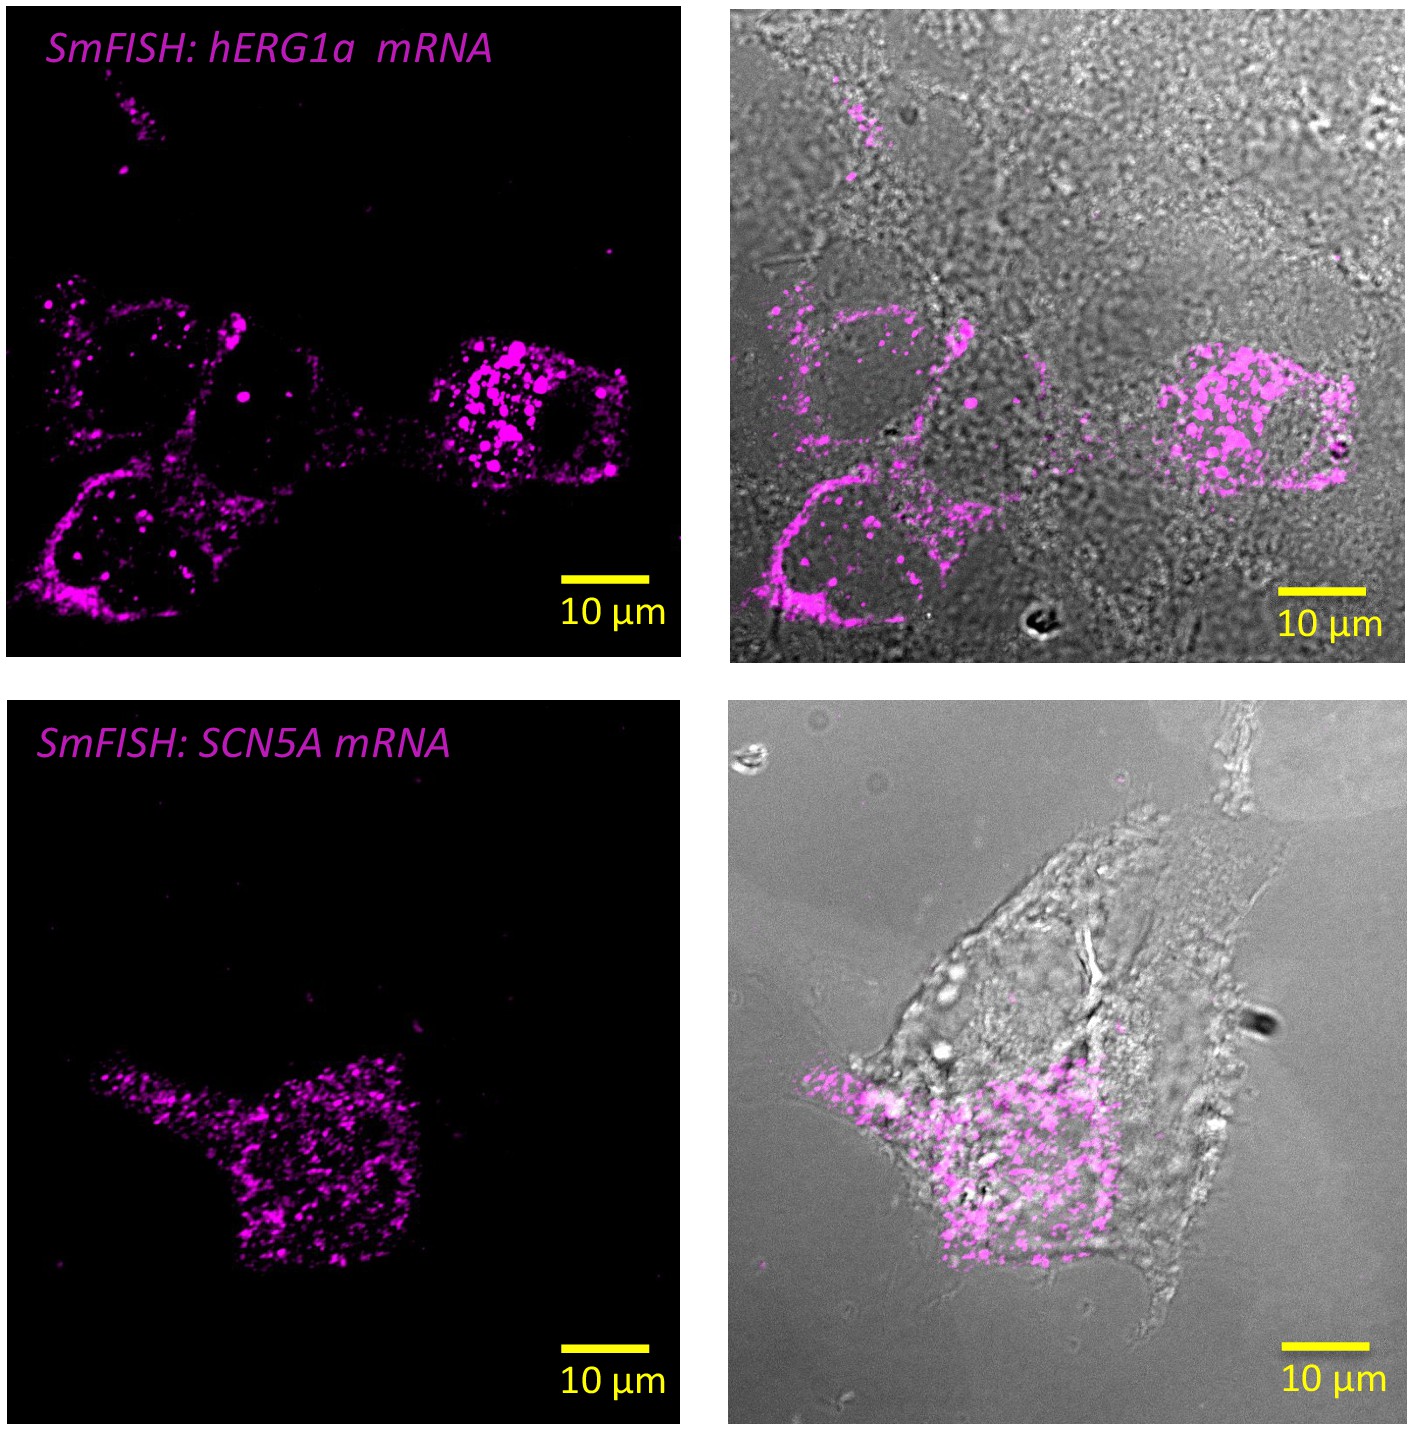
Specificity of the probes used in smFISH experiments.
Representative images of smFISH for either hERG1a (top panel) or SCN5A (bottom panel) mRNAs performed in HEK293 cells transiently transfected with hERG1a or SCN5A. Only the cells expressing hERG1a or SCN5A showed a positive signal for smFISH revealing the specificity of the probes used in smFISH experiments.
Figure 2—figure supplement 2
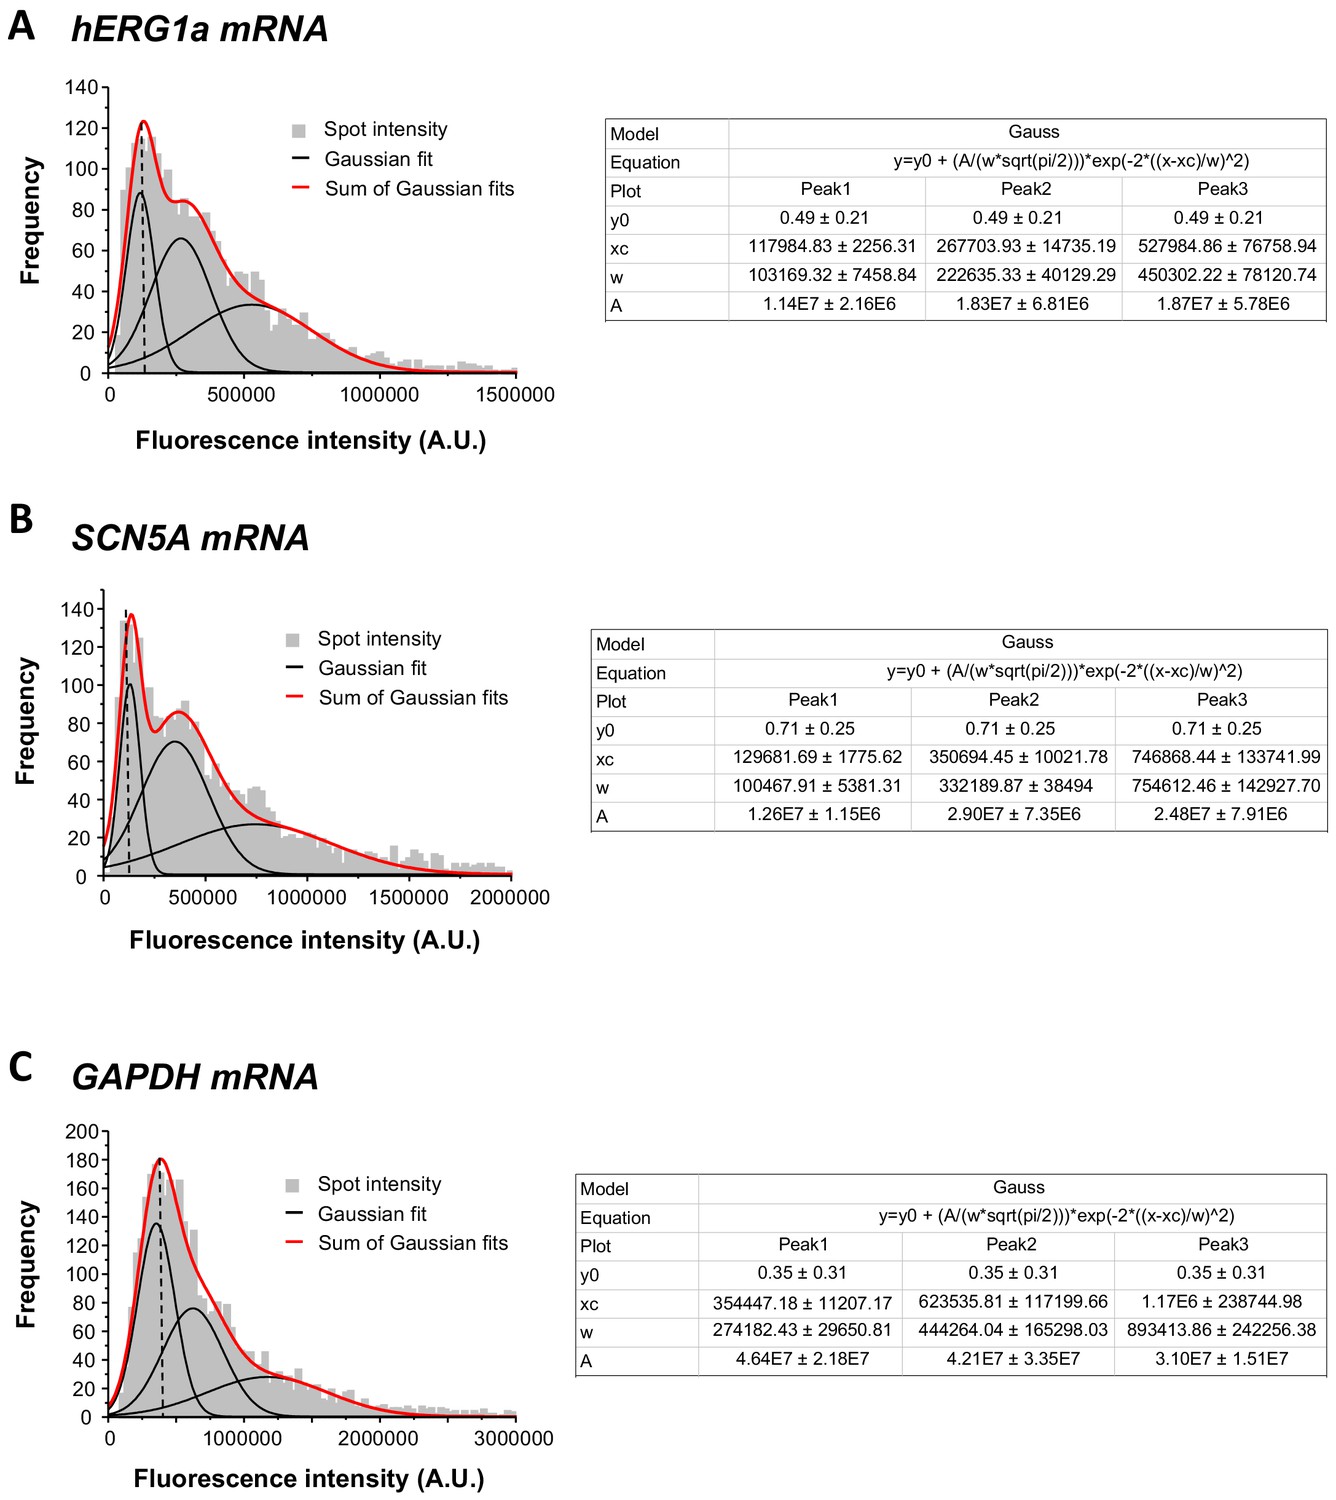
Single mRNA intensity determination.
The distribution of total fluorescence intensity of smFISH signals for hERG1a (2611 spots; A), SCN5A (2815 spots; B), and GAPDH (3507 spots; c). By fitting the histogram to the sum of Gaussian functions (red line), the typical intensity corresponding to a single mRNA molecule (vertical dashed line) was extracted.
-
Figure 2—figure supplement 2—source data 1
Single mRNA intensity determination for Figure 2—figure supplement 2.
- https://doi.org/10.7554/eLife.52654.008
Figure 2—figure supplement 3
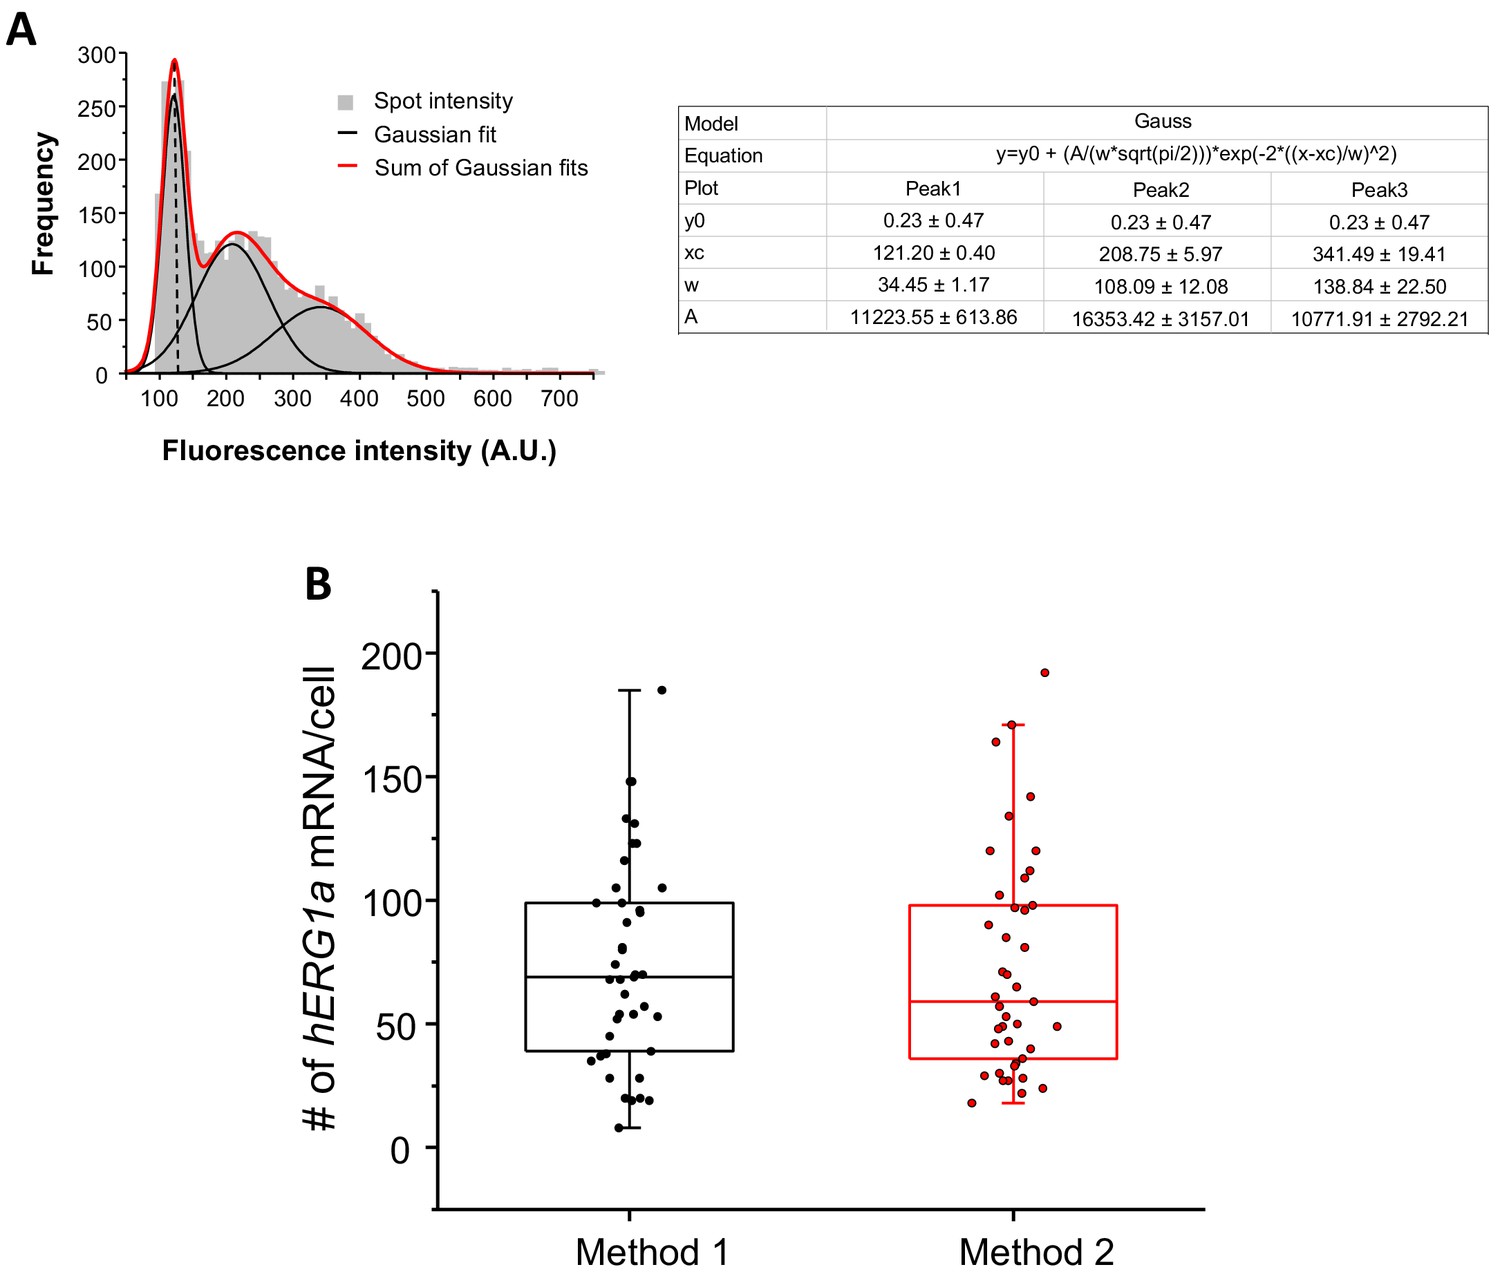
Quantification of mRNA expression using two different methods.
(A) The distribution of total fluorescence intensity of smFISH signals for hERG1a (2892 spots) obtained using FISHQUANT software for analysis. By fitting the histogram to the sum of Gaussian functions (red line), the typical intensity corresponding to a single mRNA molecule (vertical dashed line) was extracted. (B) Comparison of the number of mRNA molecules detected per cells for hERG1a using two different methods of analysis (Method 1: manual using ImageJ; Method 2: Semi-automatic using FISHQUANT).
Figure 3 with 1 supplement
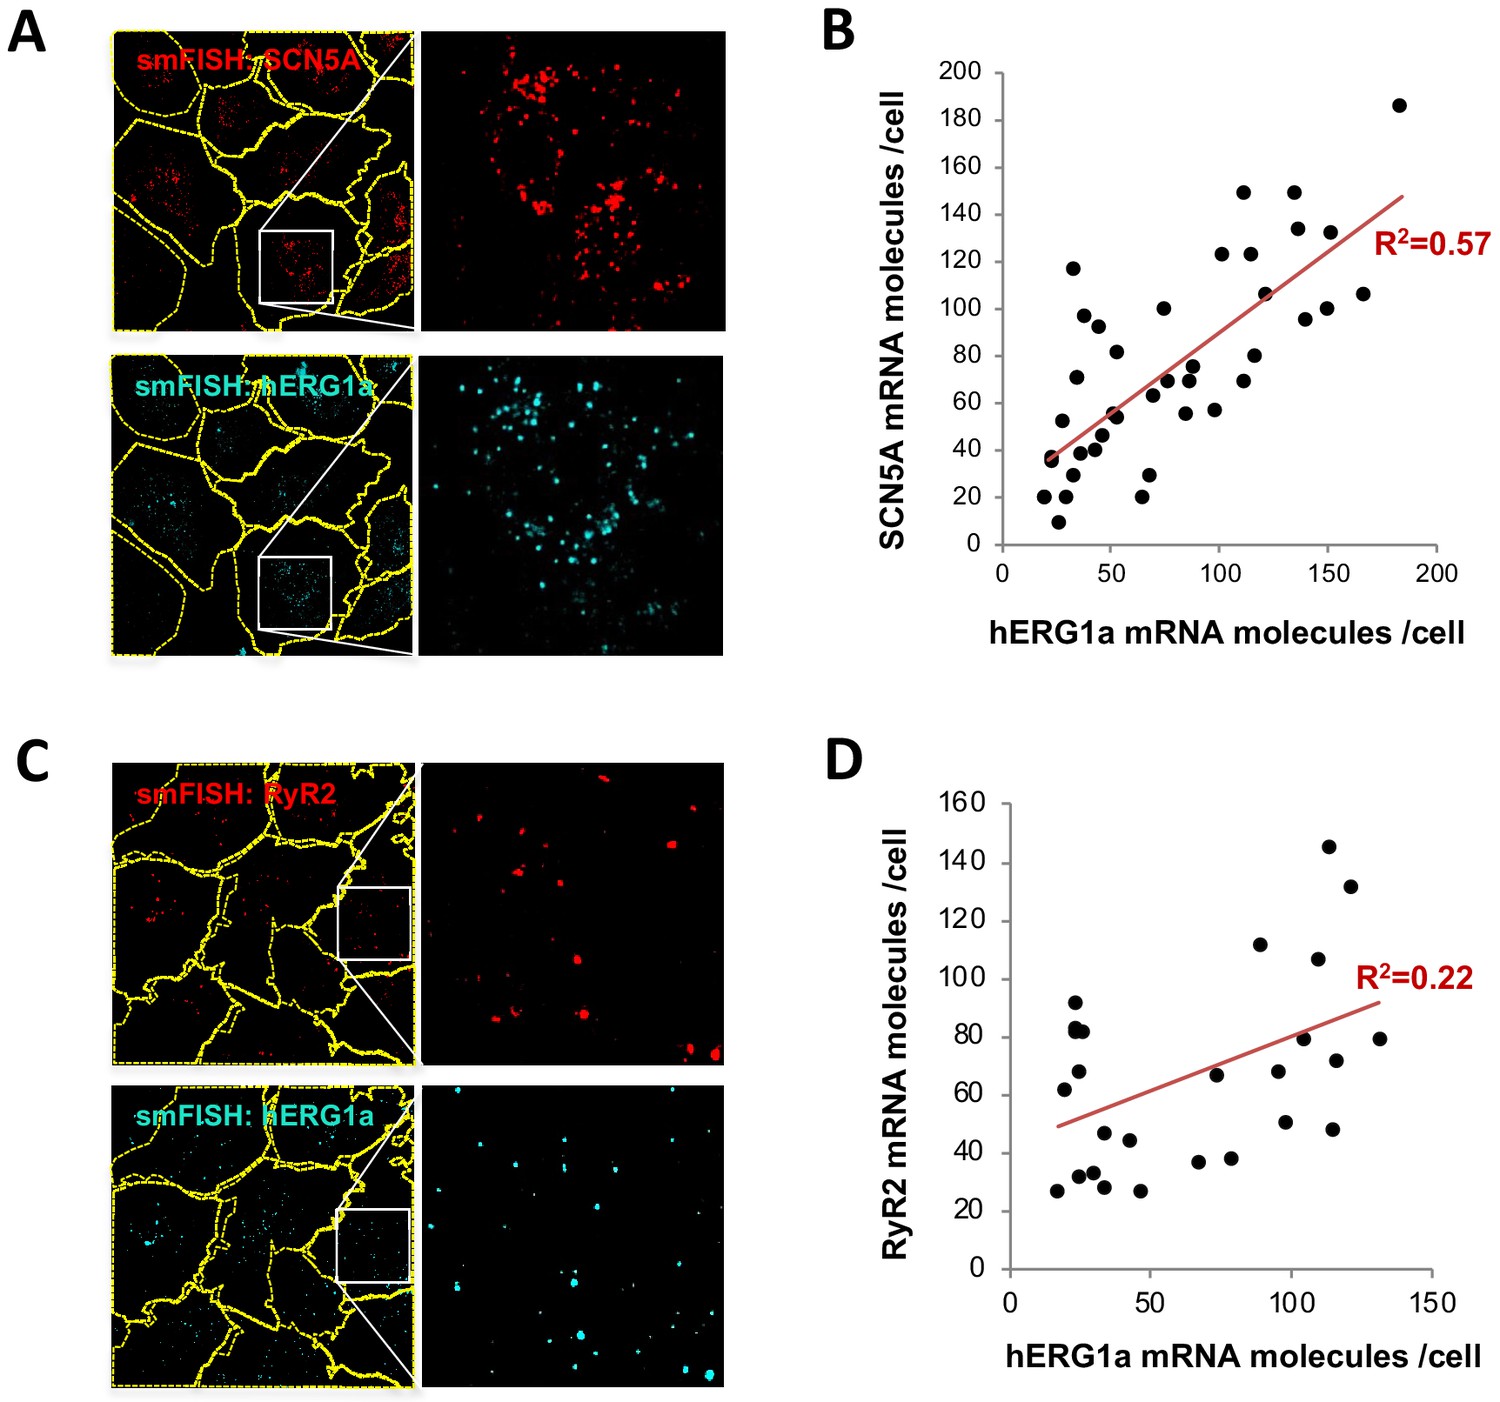
hERG1a and SCN5A transcript expression levels correlate.
(A) Representative confocal images and enlargements of double smFISH experiments for SCN5A (red) and hERG1a (cyan) mRNAs. (B) The number of mRNA molecules detected per cell in double smFISH experiments were plotted for SCN5A and hERG1a and the coefficient of determination R2 was determined from the Pearson’s correlation coefficient R (n = 41 cells; N = 2). (C) Representative confocal images and enlargements of double smFISH experiments for RyR2 (red) and hERG1a (cyan) mRNAs. (D) The number of hERG1a mRNA was plotted against the number of RYR2 mRNAs per cells and showed a low correlation in their expression (n = 26 cells; N = 2).
-
Figure 3—source data 1
Correlation analysis of hERG1a and SCN5A mRNA expressions raw data for Figure 3B.
- https://doi.org/10.7554/eLife.52654.017
-
Figure 3—source data 2
Correlation analysis of hERG1a and RyR2 mRNA expressions raw data for Figure 3D.
- https://doi.org/10.7554/eLife.52654.018
Figure 3—figure supplement 1
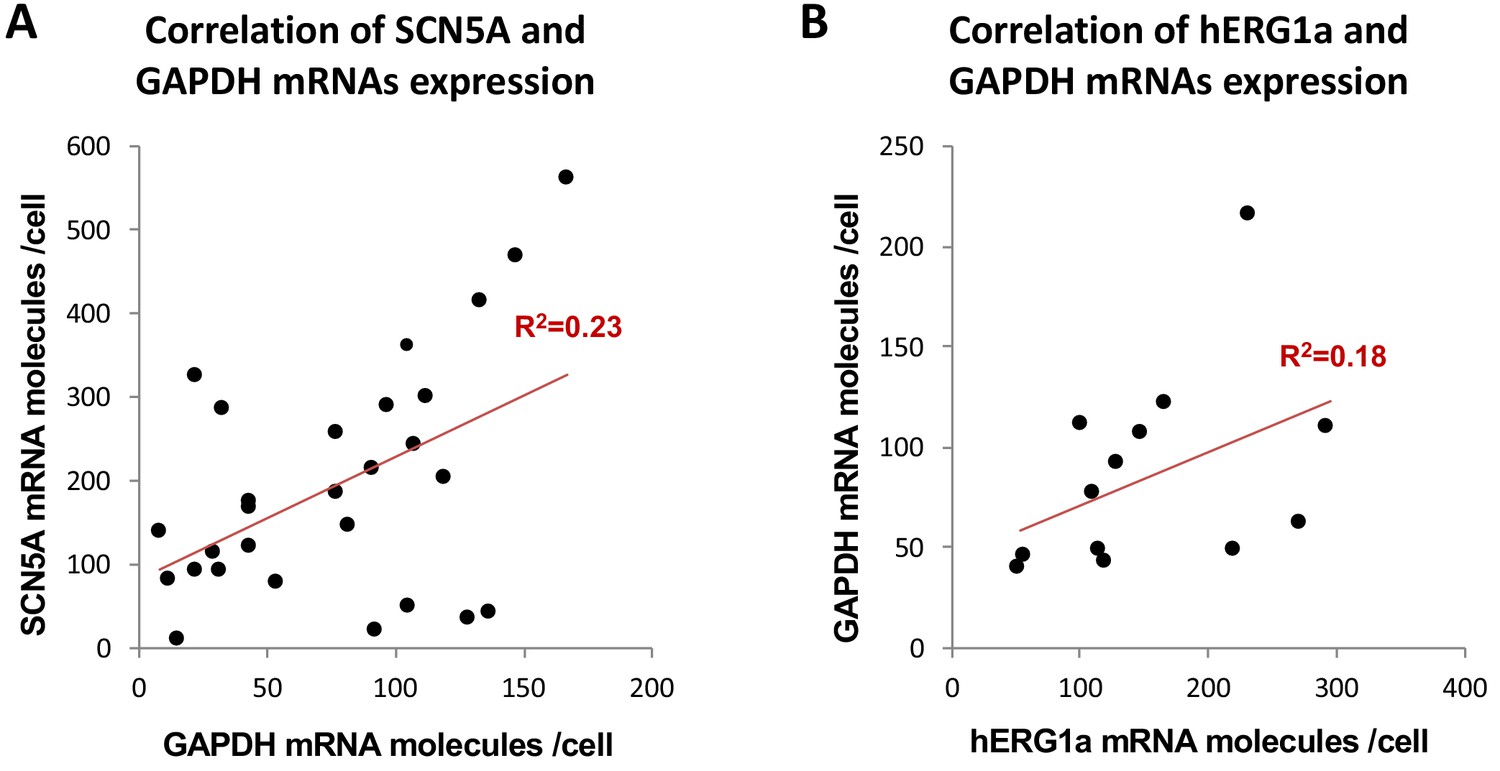
Correlation of mRNA expression.
The number of mRNA molecules detected per cells in double smFISH experiments were plotted for SCN5A and GAPDH (28 cells, (A), and hERG1a and GAPDH (13 cells, (B). The Pearson’s correlation coefficient (R2) were calculated for each pairs of mRNAs.
-
Figure 3—figure supplement 1—source data 1
Correlation of mRNA expression for Figure 3—figure supplement 1.
- https://doi.org/10.7554/eLife.52654.016
Figure 4

hERG1a and SCN5a transcript colocalization.
(A) Representative confocal images and enlargement (outlined in yellow) of iPSC-CMs subjected to smFISH showing the colocalization of hERG1a and SCN5A mRNAs. (B) Comparison of the average number of associated hERG1a and SCN5A mRNAs particles observed vs. expected by chance using different overlap criteria illustrated (mean ±SE; n = 41 cells; N = 2). (C) Diagram illustrating that the association of hERG1a and SCN5A mRNAs account for 24% and 23% of their total population respectively. (D) Representative confocal images of smFISH for hERG1a and RyR2 transcripts. (E) Comparison of the average number of associated hERG1a and RyR2 mRNAs particles observed vs. expected by chance using different overlap criteria (mean ±SE; n = 26 cells; N = 2).
-
Figure 4—source data 1
Association of hERG1a and SCN5A transcripts raw data for Figure 4B.
- https://doi.org/10.7554/eLife.52654.020
-
Figure 4—source data 2
Proportion of hERG1a and SCN5A mRNA association raw data for Figure 4C.
- https://doi.org/10.7554/eLife.52654.021
-
Figure 4—source data 3
Association of hERG1a and RyR2 transcripts raw data for Figure 4E.
- https://doi.org/10.7554/eLife.52654.022
Figure 5 with 1 supplement
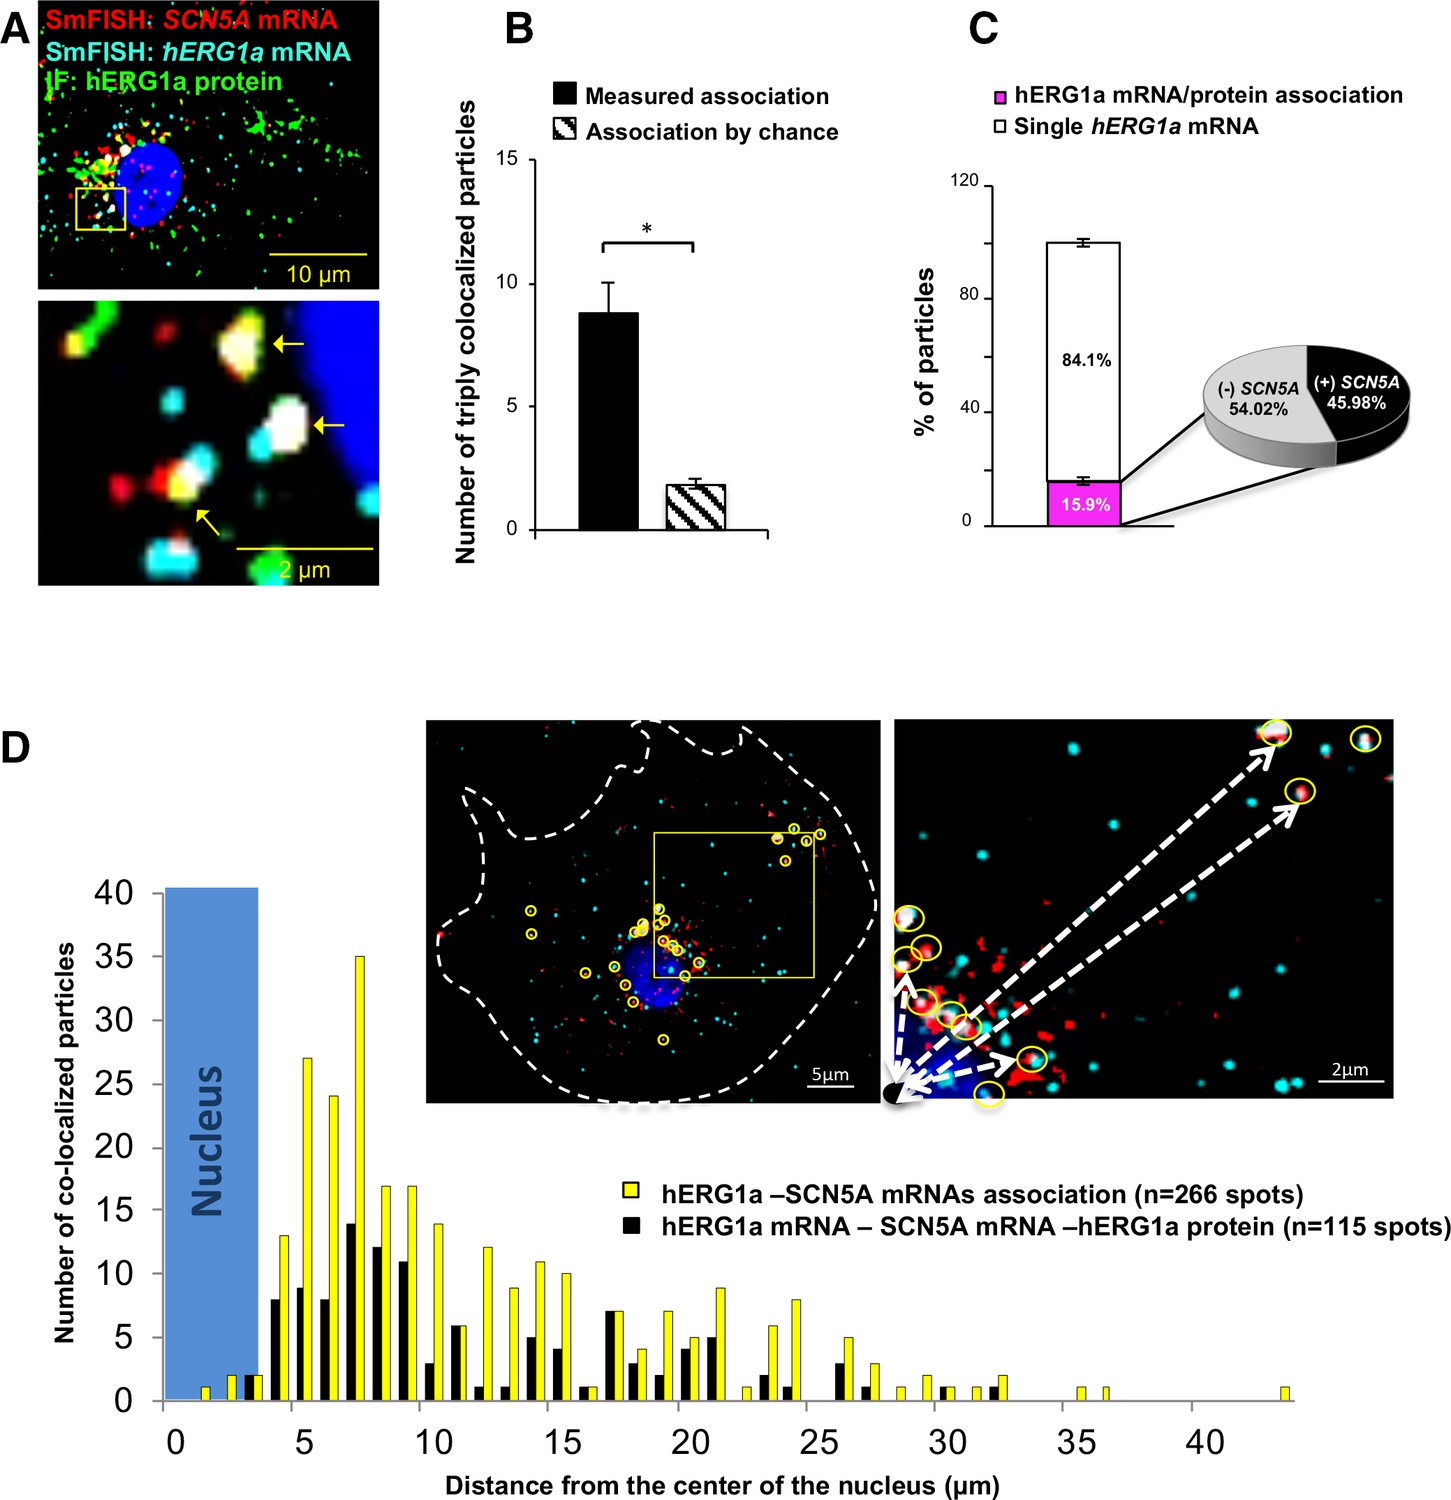
Cotranslational association of hERG1a protein and hERG1a and SCN5A mRNAs.
(A) Representative confocal images and enlargement of iPSC-CMs subjected to immunofluorescence (IF) combined with smFISH protocol. Arrows indicate triply colocalized particles. (B) The average number of particles comprising hERG1a and SCN5A mRNAs and hERG1a protein per cell compared to the expected number based on chance using a maximum distance of 2 pixels between center of mass (minimum 50% overlap; mean ±SE; n = 13 cells, N = 2). (C) Histogram showing that 16% of hERG1a mRNA associate with hERG1a protein (actively translated population); of that percentage, 46% also interact with SCN5A transcripts (mean ±SE; n = 13 cells; N = 2). (D) Histogram showing the distribution of colocalized mRNA spots through the cytoplasm and from the nucleus revealing that RNP complexes are mostly localized within 10 µm from the nucleus. In the top right corner, representative examples of colocalized spots (yellow circles) and analysis of distance from the nucleus (white dashed arrows).
-
Figure 5—source data 1
Association of hERG1a and SCN5A mRNAs with hERG1a protein raw data for Figure 5B.
- https://doi.org/10.7554/eLife.52654.026
-
Figure 5—source data 2
Proportion of co-translational association raw data for Figure 5C.
- https://doi.org/10.7554/eLife.52654.027
-
Figure 5—source data 3
Distribution of associated mRNAs raw data for Figure 5D.
- https://doi.org/10.7554/eLife.52654.028
Figure 5—figure supplement 1
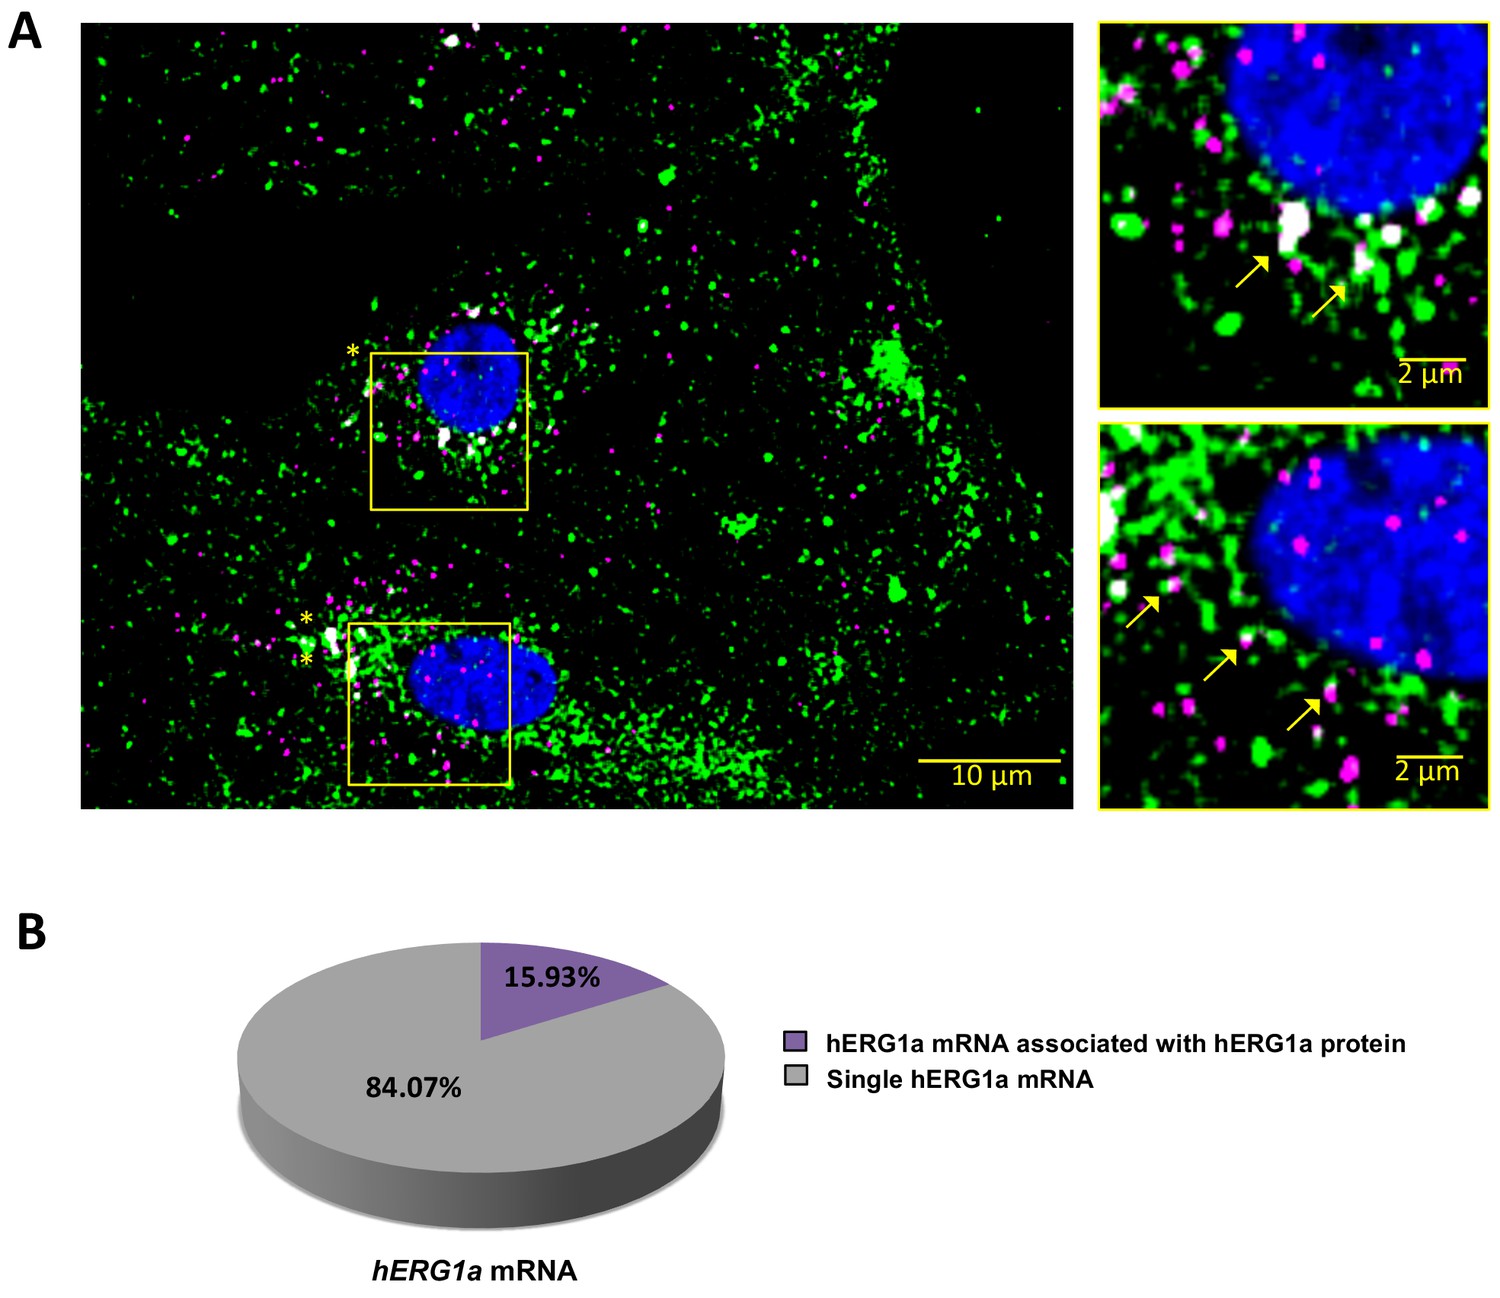
hERG1a mRNA protein interaction.
(A) Representative confocal images and enlargement (outlined in yellow) of iPSC-CMs subjected to Immunofluorescence combined with smFISH protocol showing the colocalization (yellow arrows) of hERG1a mRNA (magenta) and hERG1a protein (green). (B) Pie chart showing the percentage of hERG1a mRNA population interacting with hERG1a protein revealing that 16% of hERG1a mRNA were actively translated at the moment of fixation.
-
Figure 5—figure supplement 1—source data 1
Association of hERG1a and SCN5A mRNAs with hERG1a protein raw data for Figure 5—figure supplement 1.
- https://doi.org/10.7554/eLife.52654.025
Figure 6
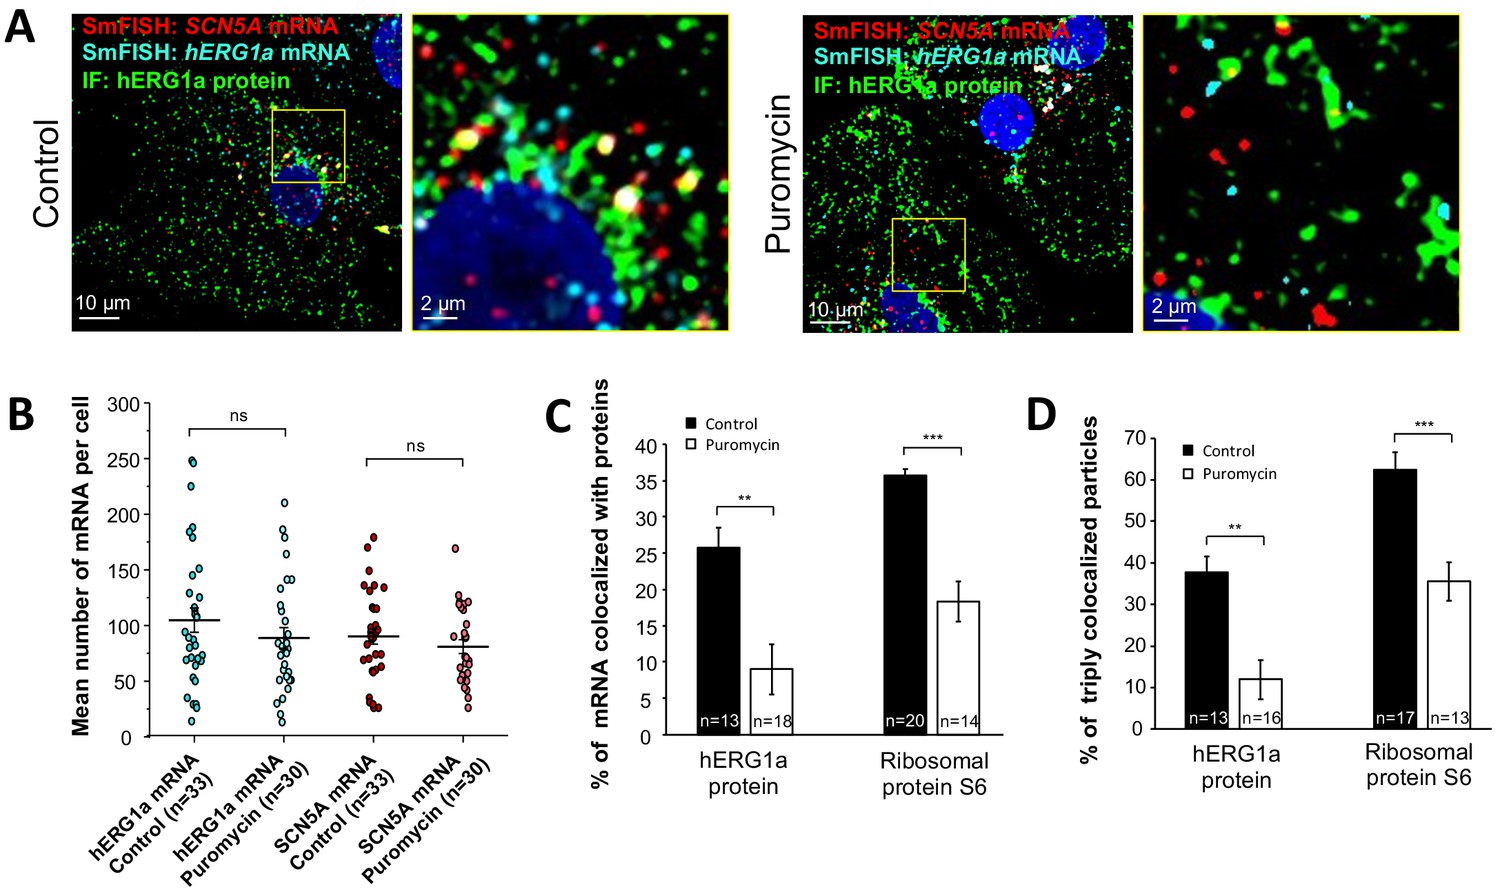
Distribution and association of hERG1a and SCN5A transcripts under puromycin treatment in iPSC-CMs.
(A) Representative confocal images and enlargement (outlined in yellow) of iPSC-CMs subjected to immunofluorescence combined with smFISH for control cells (left panel) or cells treated with 100 µM puromycin for 15 min (right panel). (B) The number of mRNAs detected per cell was plotted for SCN5A and hERG1a in the presence of puromycin and compared to control cells (lines represent mean ±SE). (C) Histogram showing the reduction of association between hERG1a mRNA and hERG1a protein after puromycin treatment compared to non-treated cells (mean ±SE). (D) Histogram showing that the % of triply colocalized particles (hERG1a protein or the ribosomal subunit S6 associated with both hERG1a and SCN5A mRNAs) is decreased upon puromycin treatment (mean ±SE).
-
Figure 6—source data 1
Number of mRNA per cell after puromycin raw data for Figure 6B.
- https://doi.org/10.7554/eLife.52654.030
-
Figure 6—source data 2
hERG1a and SCN5A mRNAs association raw data for Figure 6C.
- https://doi.org/10.7554/eLife.52654.031
-
Figure 6—source data 3
hERG1a and SCN5A transcripts cotranslational association raw data for Figure 6D.
- https://doi.org/10.7554/eLife.52654.032
Figure 7 with 1 supplement
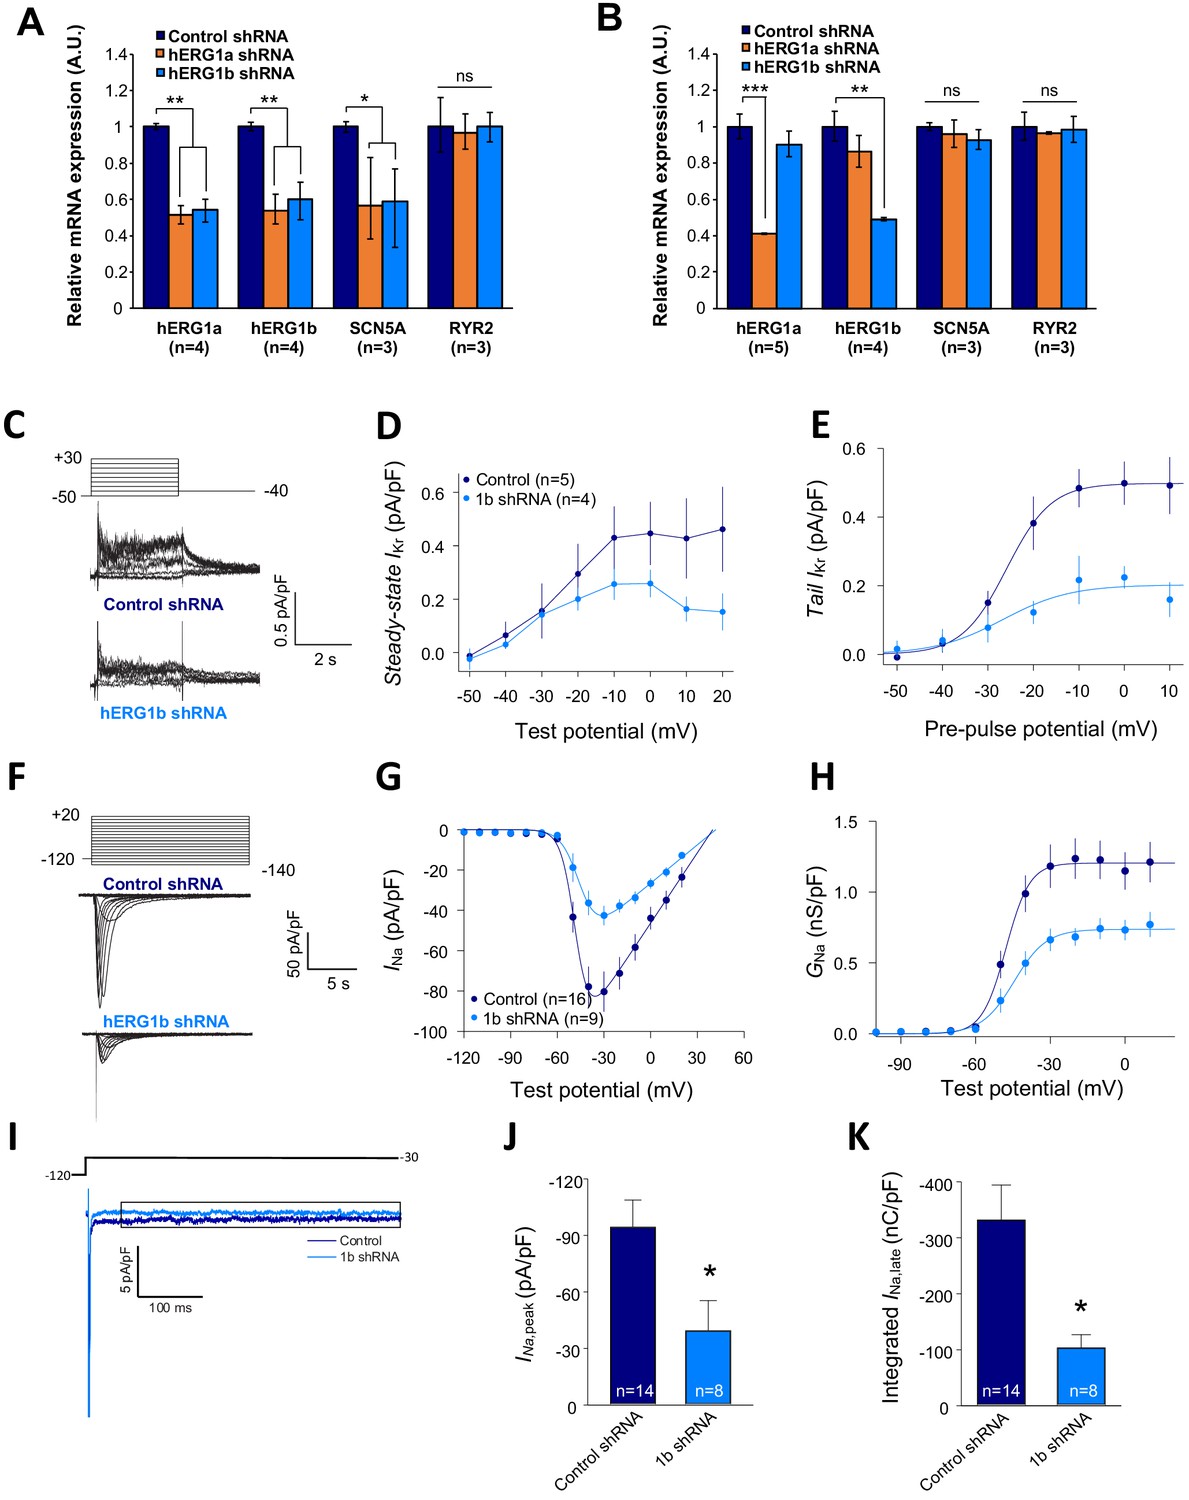
Co-knockdown of IKr and INa by hERG transcript-specific shRNA.
(A) Effects of hERG1a or hERG1b silencing on channel mRNA expression levels detected by RT-qPCR (mean ±95% CI) in iPSC-CMs. A non-targeting shRNA (scrambled shRNA) is used as a control. (B) Effects of specific hERG1a or hERG1b silencing on ion channel mRNAs expressed alone in HEK293 cells. (C) Representative family of traces show IKr in presence of control (upper) or hERG1b shRNA (lower). (D) Summary of steady-state current density vs. test potential shows effect of hERG1b shRNA (mean ±SE). (E) Effects of 1b shRNA on peak tail current vs. pre-pulse potential (mean ±SE). (F) Representative family of traces recorded from iPSC-CMs showing effects of hERG1b-specific shRNA compared to control shRNA on peak INa. (G) Summary current-voltage plot of peak INa vs. test potential (mean ±SE). (H) Summary conductance (G)-voltage plot based on data from G (mean ±SE). (I) Late sodium current representative trace in control and 1b shRNA-transfected cells, measured by applying a single pulse protocol of 800 ms. (J) Summary statistics of peak INa showed a decrease upon transfection with hERG1b shRNA (mean ±SE). (K) Late INa measured as the integral from 50 to 800 ms from the beginning of the pulse showed a decrease upon transfection with hERG1b shRNA (mean ±SE).
-
Figure 7—source data 1
Co-knockdown of transcripts by qPCR raw data for Figure 7A.
- https://doi.org/10.7554/eLife.52654.036
-
Figure 7—source data 2
Specificity of shRNA raw data for Figure 7B.
- https://doi.org/10.7554/eLife.52654.037
-
Figure 7—source data 3
IKr is reduced upon hERG silencing raw data for Figure 7D–E.
- https://doi.org/10.7554/eLife.52654.038
-
Figure 7—source data 4
Reduction of peak INa after hERG silencing raw data for Figure 7G–H.
- https://doi.org/10.7554/eLife.52654.039
-
Figure 7—source data 5
Decrease of INa,late current upon hERG silencing raw data for Figure 7J–K.
- https://doi.org/10.7554/eLife.52654.040
Figure 7—figure supplement 1
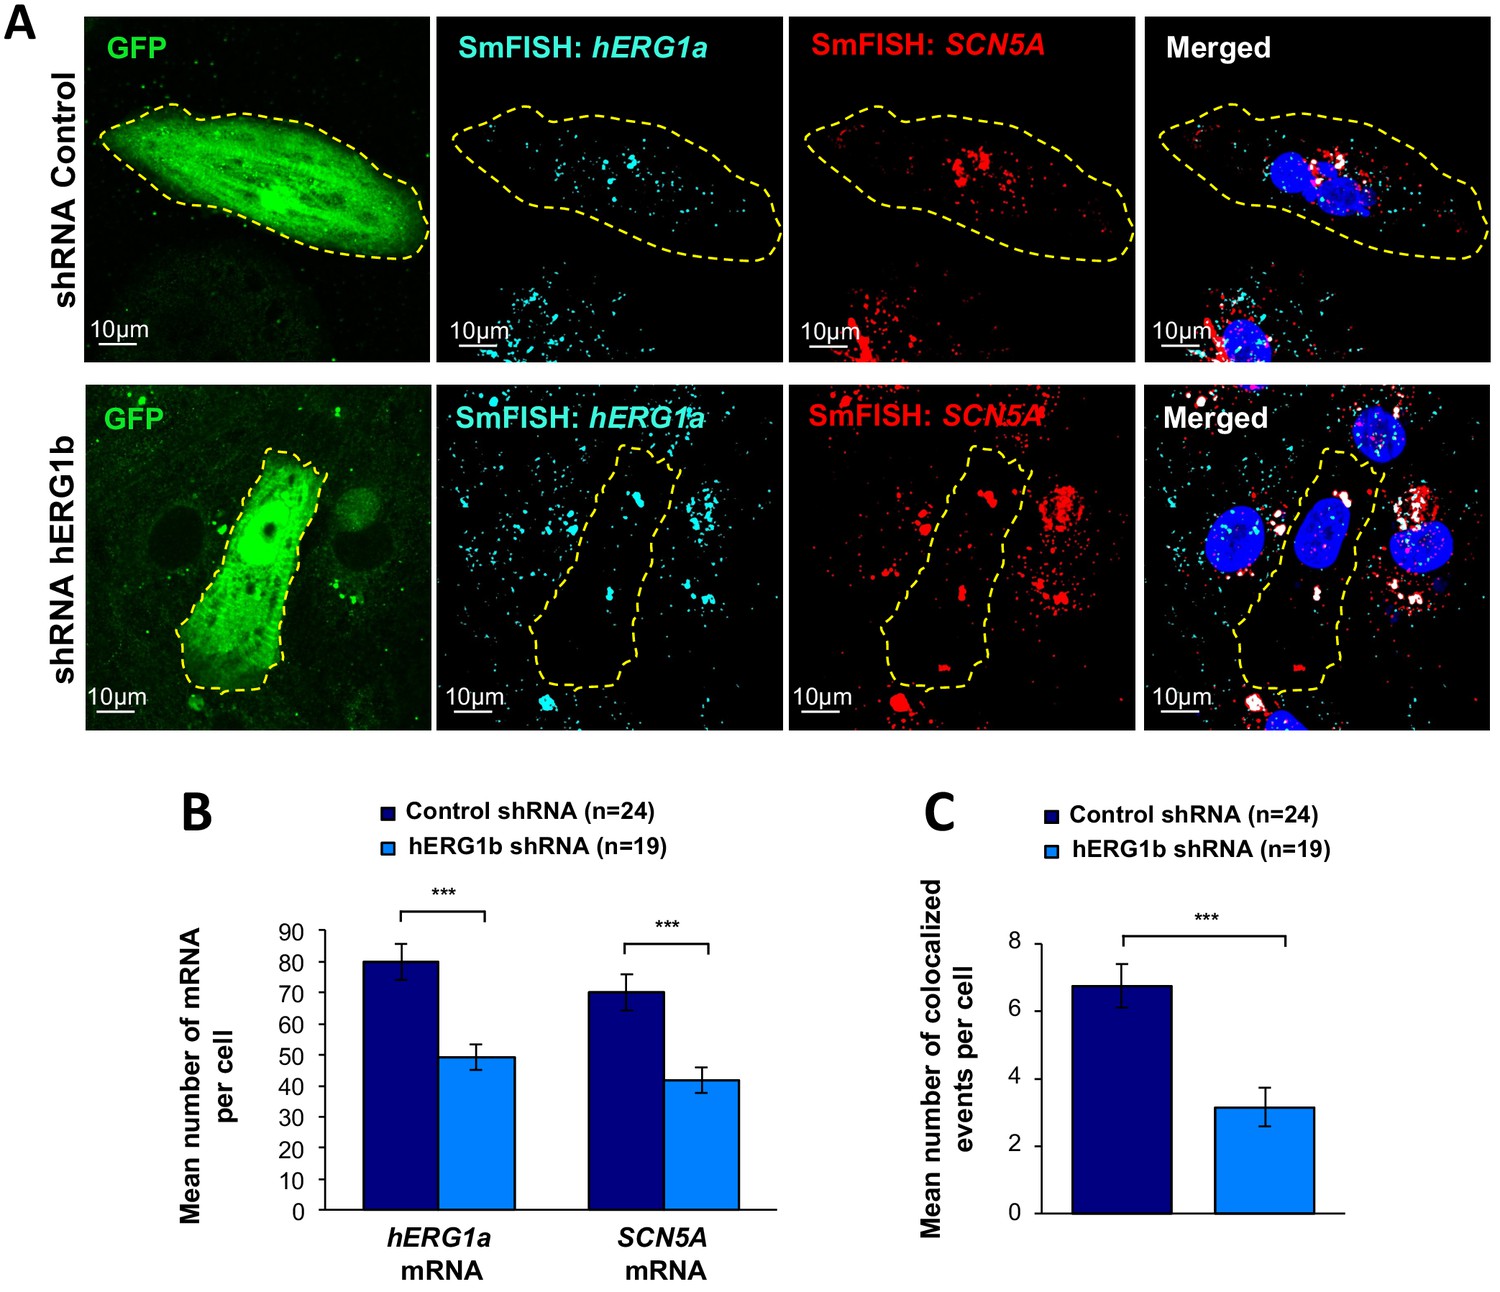
Co-knockdown of hERG and SCN5A mRNAs by hERG transcript-specific shRNA.
(A) Representative confocal images of smFISH for hERG1a and SCN5A transcripts in iPSC-CMs transfected with either a control or hERG1b shRNA. (B) Histogram of the average number of transcripts detected per cell for hERG1a or SCN5A transcripts in presence of hERG1b shRNA compared to a scrambled shRNA (mean ±SE). (C) Histogram of the mean number of hERG1a transcript colocalized with SCN5A transcript in cells silenced for hERG1b compared with control (mean ±SE).
-
Figure 7—figure supplement 1—source data 1
Co-knockdown of hERG and SCN5A by hERG transcript-specific shRNA for Figure 7—figure supplement 1.
- https://doi.org/10.7554/eLife.52654.035
Figure 8
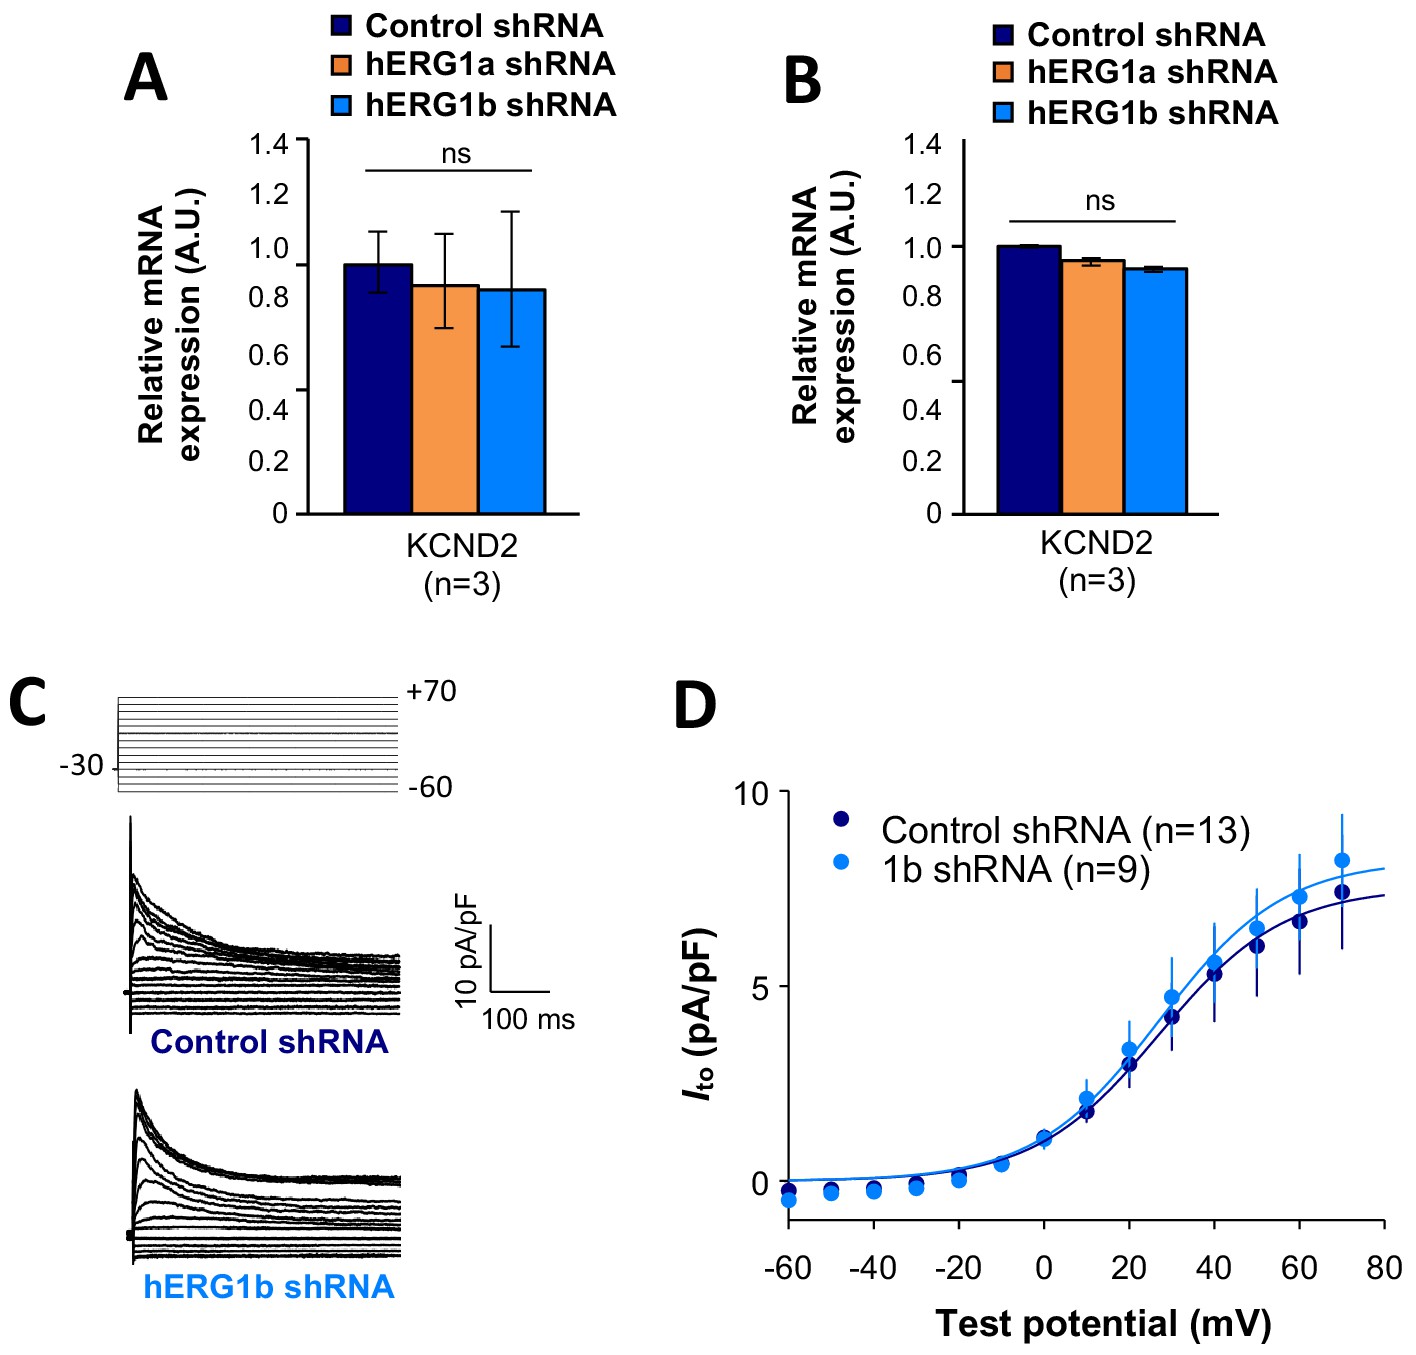
Effects of hERG1b silencing on Ito and KV4.2 channels in iPSC-CMs.
(A) Effects of hERG1a or hERG1b silencing on KV4.2 channel mRNA expression levels detected by RT-qPCR (mean ±95% CI) in IPSC-CMs. A non-targeting shRNA (scrambled shRNA) is used as a control. (B) Effects of specific hERG1a or hERG1b silencing on KV4.2 channel mRNAs expressed alone in HEK293 cells. (C) Representative family of traces show Ito in presence of control (upper) or hERG1b shRNA (lower). (D) Summary of steady-state current density vs. test potential shows effect of hERG1b shRNA (mean ±SE).
-
Figure 8—source data 1
KCND2 is not affected by the co-knockdown effect raw data for Figure 8A–B.
- https://doi.org/10.7554/eLife.52654.042
-
Figure 8—source data 2
Ito current is not affected by the silencing of hERG raw data for Figure 8D.
- https://doi.org/10.7554/eLife.52654.043
Author response image 1
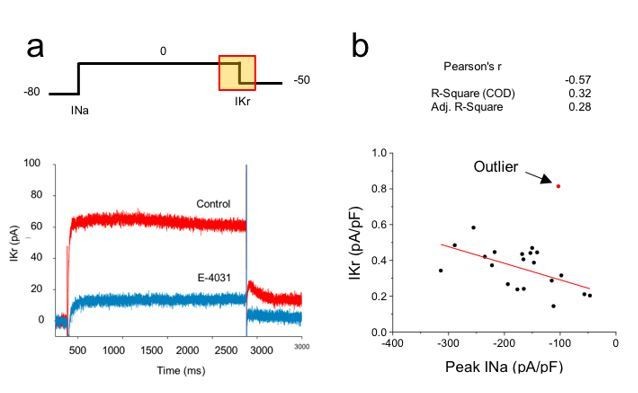
Correlation analysis of hERG and sodium currents.
(A) Voltage step protocol used to measure both sodium (INa) and hERG (IKr) currents in the same cell, using cesium as the charge carrier for hERG channels. The region from where IKr was measured is highlighted in the protocol (yellow square). Representative traces before (Control) and after perfusing E-4031 (10 µM) to block hERG channels, validating that the recorded current is IKr. (B) Current density of hERG channels were plotted in function of Nav1.5 current density and correlation coefficients are shown on top of the graph. One cell (red dot) was excluded from the correlation analysis as it meets the outlier criteria. n = 20 cells of 2 independent experiments (N = 2).
Author response image 2
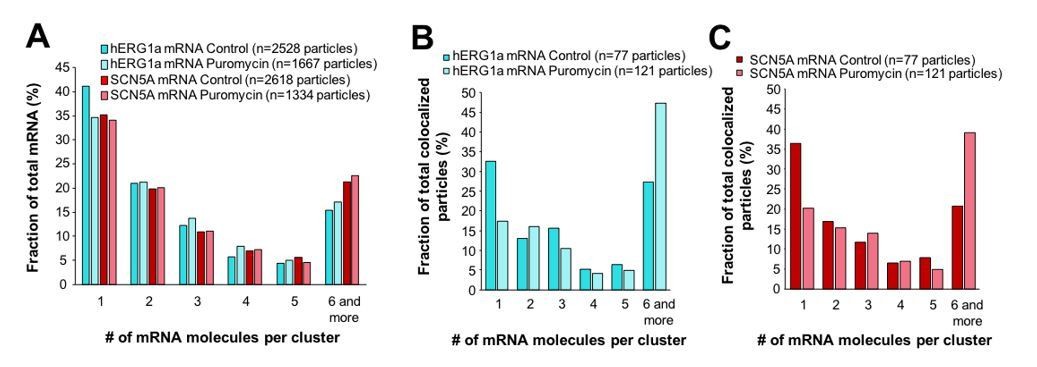
Effect of puromycin on hERG and SCN5A cluster distribution.
(A) The distribution of the number of mRNA molecules associated in clusters for each transcript evaluated by smFISH in presence or absence (control) of puromycin. (B) Histogram showing the distribution of colocalized particles in clusters as a fraction of total hERG colocalized particles with or without puromycin treatment. (C) Histogram showing the distribution of colocalized particles in clusters as a fraction of total SCN5A colocalized particles with or without puromycin treatment.
Additional files
-
Supplementary file 1
List of probes used in smFISH experiments.
The probes were designed using Stellaris probe Designer software with the following parameters: 18 to 20 nucleotides oligo length, a masking level of 5, a minimum spacing length of 2 nucleotides and a maximum number of probes of 48. Due to the length of the N-terminal specific sequence for hERG1a mRNA, the number of probes used to detect hERG1a is limited to 35.
- https://doi.org/10.7554/eLife.52654.044
-
Supplementary file 2
Summary of correlation analysis perfomed in iPSC-CMs.
The linear correlation between the different combination of mRNAs was evaluated using the Pearson correlation coefficient. Because the Pearson coefficient is highly sensitive to outliers and only assess linear correlation, the Spearman’s correlation coefficient was also calculated. Both tests revealed a significant correlation between hERG1a and SCN5A mRNAs and no significant correlation for hERG1a/RyR2, hERG1a/GAPDH and SCN5A/GAPDH pairs. Levels of significance were adjust with a Bonferroni correction taking into account correlation coefficients and either linear correlation or non-linear correlation for Pearson’s and Spearman’s test respectively.
- https://doi.org/10.7554/eLife.52654.045
-
Supplementary file 3
Summary of colocalization analysis perfomed in iPSC-CMs for different association criteria.
Comparison of the average number of mRNAs particles observed to be associated and the expected number based on chance alone using centroid positions and different association criteria (from touching to 67% overlap). The significance is tested with a paired t-test Bonferroni’s correction. The number of hERG1a and SCN5A mRNAs observed to be associated is significantly above that expected by chance alone for all association criteria tested while no significant differences are observed for hERG1a/RyR2, hERG1a/GAPDH and SCN5A/GAPDH associations.
- https://doi.org/10.7554/eLife.52654.046
-
Supplementary file 4
Voltage dependence of activation and inactivation parameters for the sodium channels in cells transfected with a control shRNA or a hERG1b specific shRNA.
Parameters were obtained after fitting to a Boltzmann equation activation and inactivation data.
- https://doi.org/10.7554/eLife.52654.047
-
Supplementary file 5
Voltage dependence of activation of hERG channels in cells transfected with a control shRNA or a hERG1b specific shRNA.
Parameters were obtained by fitting the experimental data of the I-V curve of the peak tail IKr to a Boltzmann equation.
- https://doi.org/10.7554/eLife.52654.048
-
Transparent reporting form
- https://doi.org/10.7554/eLife.52654.049
Download links
A two-part list of links to download the article, or parts of the article, in various formats.
Downloads (link to download the article as PDF)
Open citations (links to open the citations from this article in various online reference manager services)
Cite this article (links to download the citations from this article in formats compatible with various reference manager tools)
A microtranslatome coordinately regulates sodium and potassium currents in the human heart
eLife 8:e52654.
https://doi.org/10.7554/eLife.52654


