Anti-PD-1 immunotherapy leads to tuberculosis reactivation via dysregulation of TNF-α
- NIHR Biomedical Research Centre, School of Clinical and Experimental Sciences, Faculty of Medicine, University of Southampton, United Kingdom
- Institute for Life Sciences, University of Southampton, United Kingdom
- Africa Health Research Institute, South Africa
- Department of Tropical and Infectious Diseases, Institute of Primate Research, National Museums of Kenya, Kenya
- Wellcome Centre for Infectious Diseases Research in Africa, Institute of Infectious Disease and Molecular Medicine, University of Cape Town, South Africa
- TB Centre and Department of Clinical Research, London School of Hygiene and Tropical Medicine, United Kingdom
- Department of Clinical Sciences, Liverpool School of Tropical Medicine, United Kingdom
- NIHR Biomedical Research Centre, School of Cancer Sciences, University of Southampton, United Kingdom
- The Francis Crick Institute, United Kingdom
- BioPhysics Group, Department of Mechanical Engineering, University College London, United Kingdom
- Department of Infectious Diseases, Imperial College London, United Kingdom
- Department of Infection and Immunity, University College London, United Kingdom
Figures
Figure 1 with 2 supplements
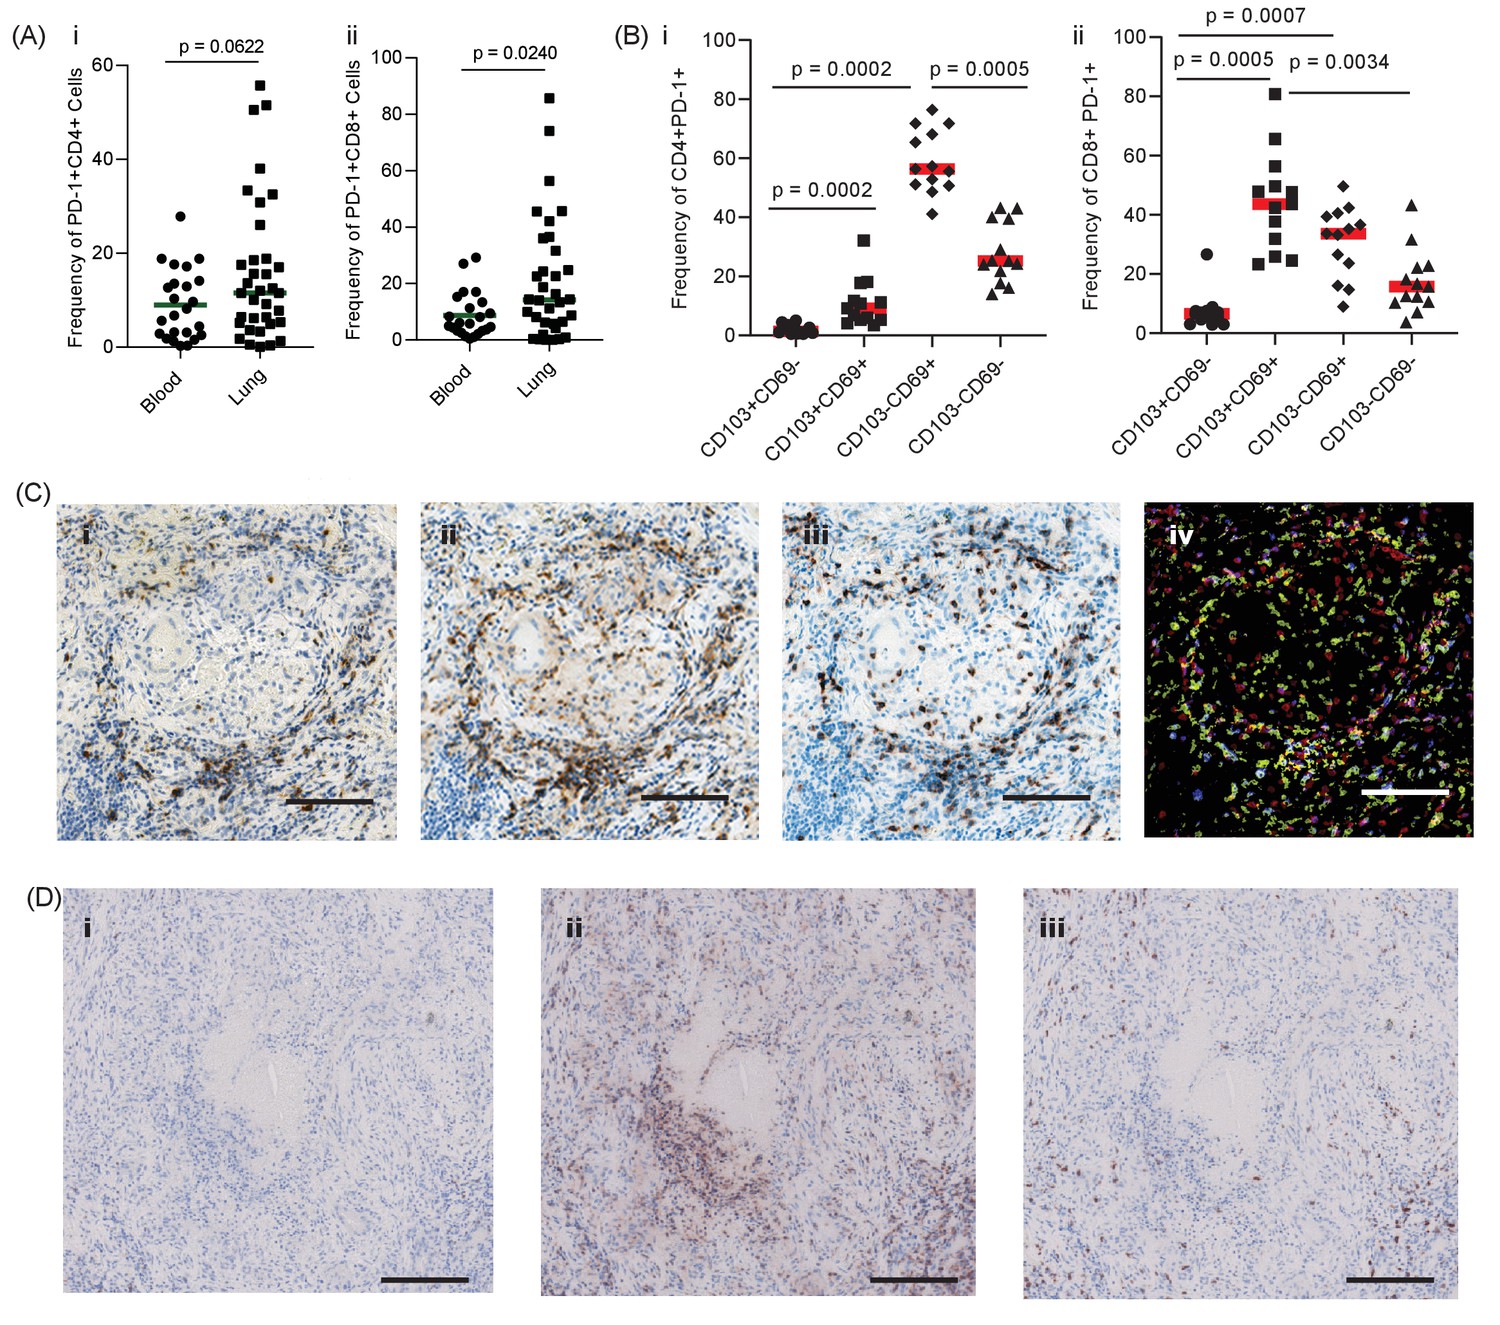
PD-1 is expressed in human TB granulomas.
(A) Analysis of PD-1 expression by T cells in the lung and peripheral circulation of thirty-five TB patients undergoing medically indicated lung resection. PD-1 shows a trend towards higher expression by lung CD4+ (i) and is significantly higher on lung CD8+ (ii) T cells. Significance analysed by one-tailed unpaired Mann-Whitney test. (B) Flow cytometric analysis of lung parenchyma CD4+ (i) and CD8+ (ii) T cells from TB patients based on the expression of PD-1, CD69 and CD103 demonstrates increased PD-1 expression in the resident T cells in the lung parenchymal cells. Significance analysed by Kruskal-Wallis test with Dunn’s multiple comparison test. (C) Immunohistochemical staining for PD-1+, CD4+ and CD8+ expression in human lung TB granulomas. PD-1 is expressed around the central macrophage core in the same region as CD4+ (ii) and CD8+ (iii) T cells. Co-localization of PD-1 (blue), CD4+ (red) and CD8+ (yellow) using false colour of the immunostaining shows co-localisation of PD-1 with both CD4+ and CD8+ cells (purple and green respectively) (iv). Scale bar 100 μm. (D) PD-1 is not expressed in caseating granulomas where immunopathology is present in human lung biopsies (i). Six biopsies taken as part of routine clinical care were studied. CD4+ (ii) and CD8+ (iii) expressing cells are present in the same area, and so absence of PD-1 immunoreactivity is not due to lack of viable cells. Scale bar 200 μm.
Figure 1—figure supplement 1
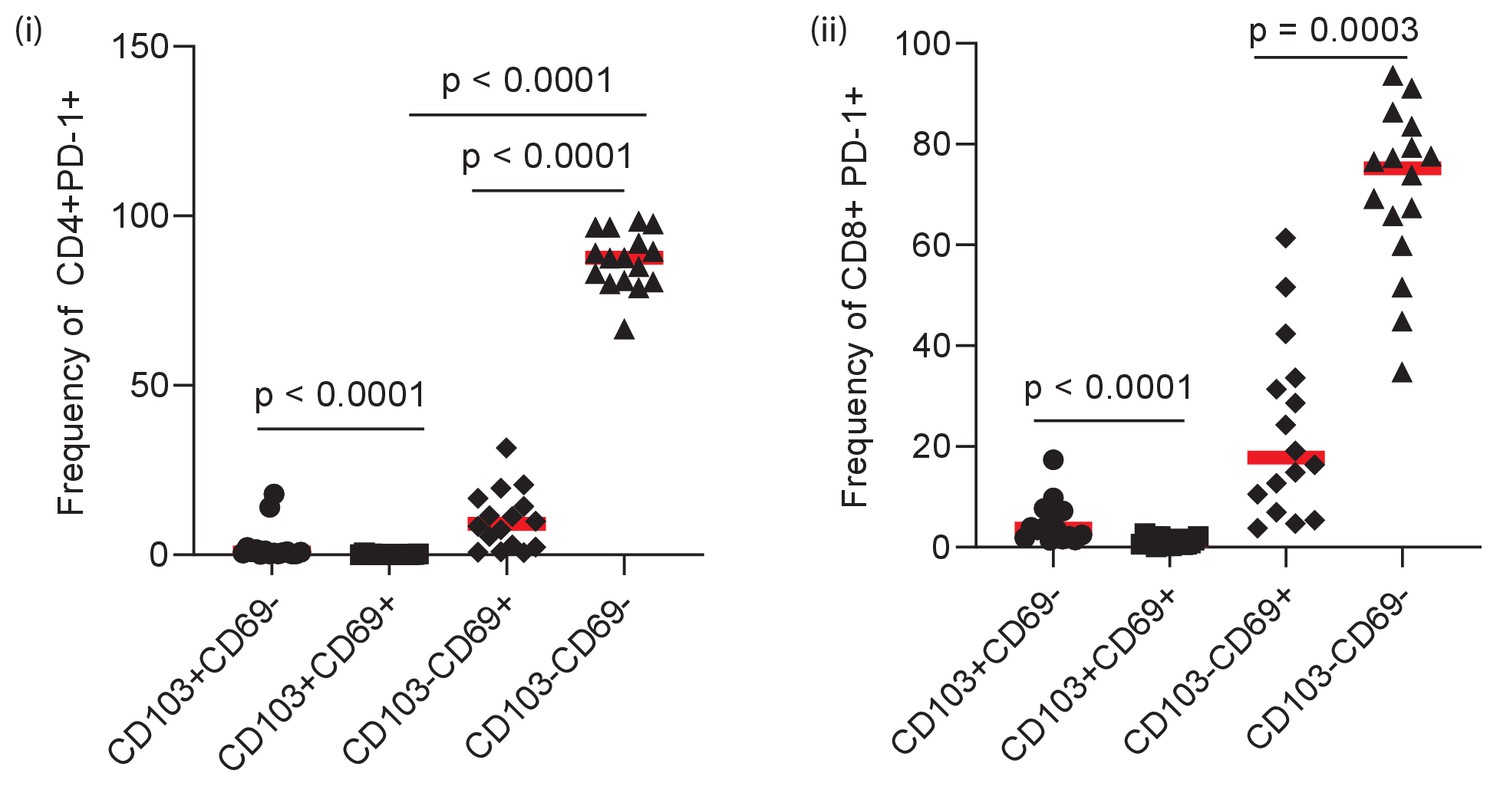
PD-1 expression on peripheral CD4+ and CD8+ T-cells is predominantly on CD103- and CD69-negative cells.
Significance was analyzed by one-tailed unpaired Mann-Whitney test.
Figure 1—figure supplement 2
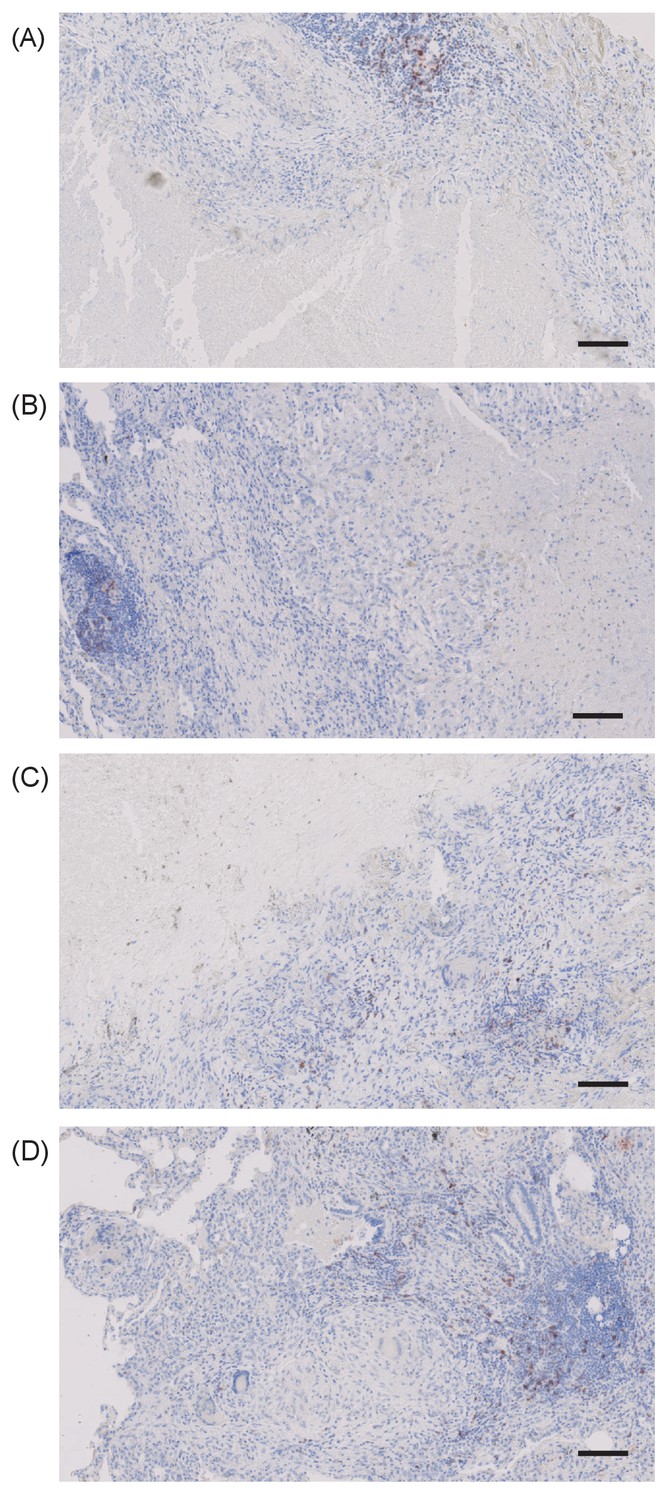
PD-1 expressing cells are absent in the immediate region surrounding caseous necrosis in human TB granulomas.
Images from four different clinical samples are presented. Scale bar 100 μm.
Figure 2 with 2 supplements
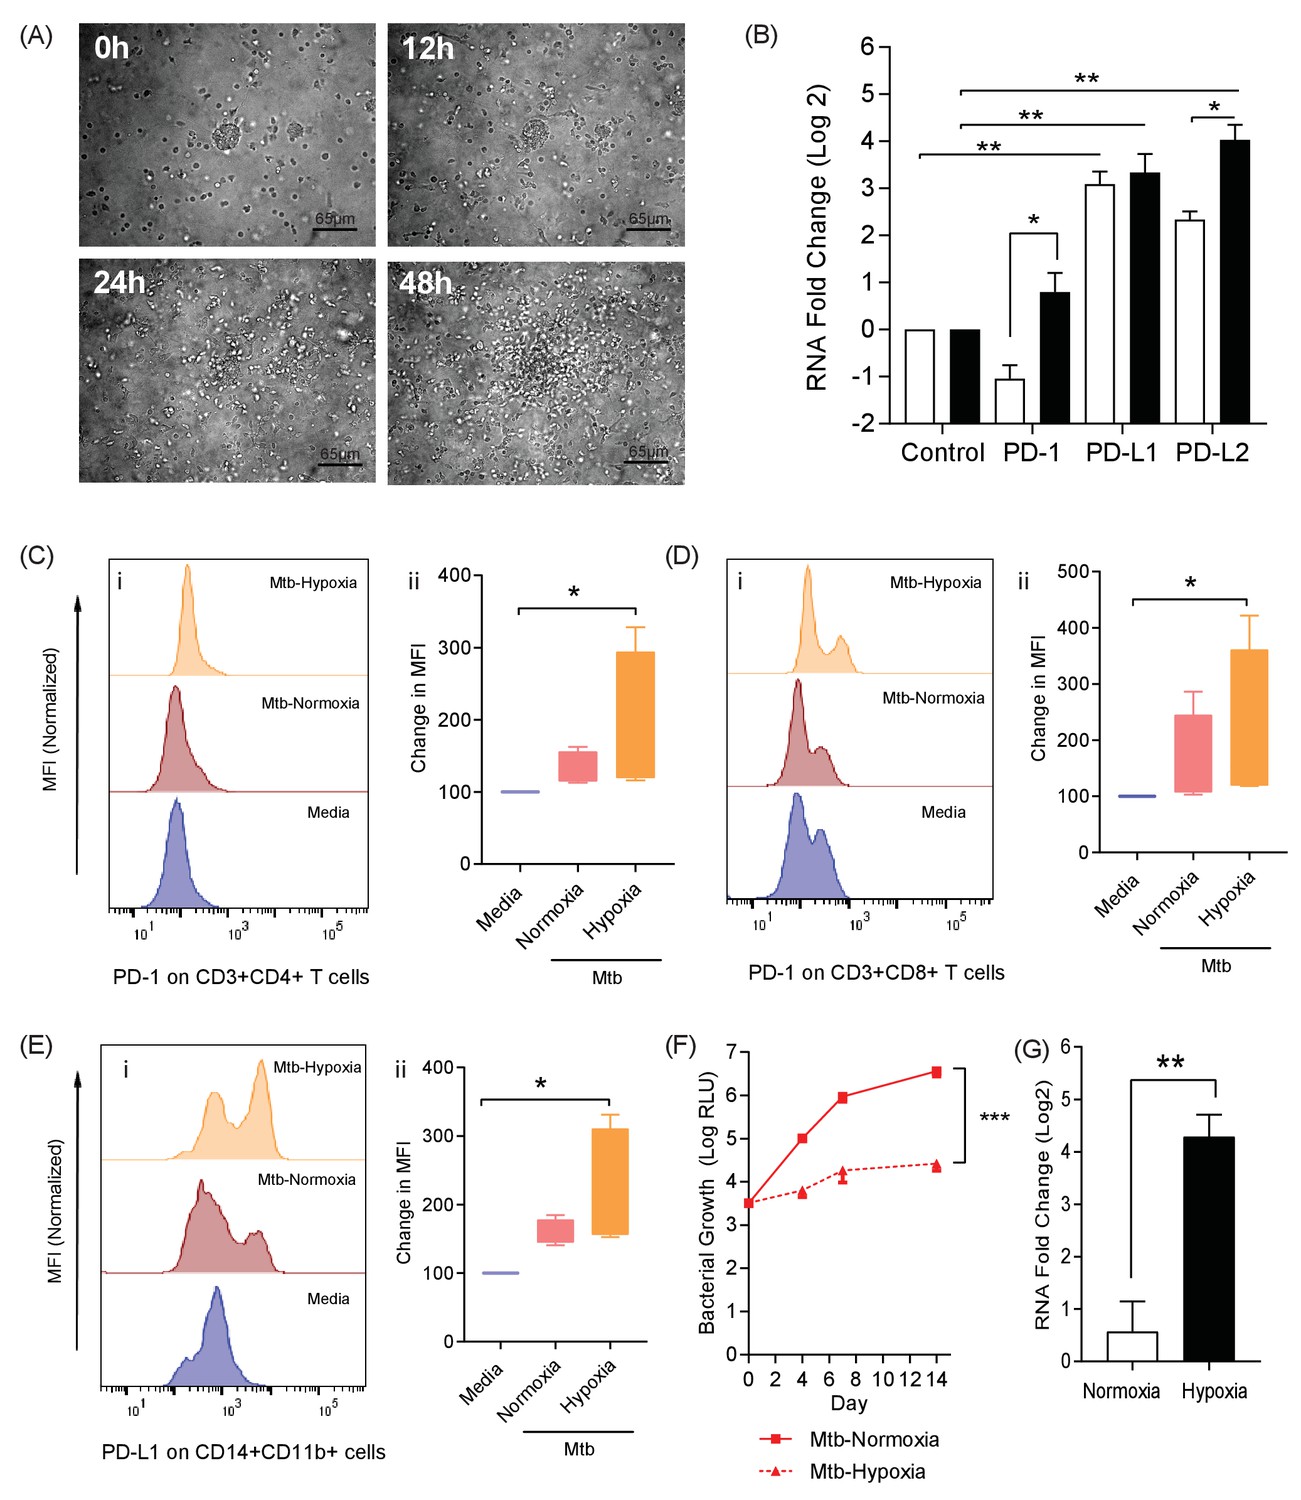
The PD-1/PD-L1 axis is upregulated in the 3D TB granuloma system.
(A) Still images from time-lapse microscopy imaging demonstrating increasing cellular aggregation of PBMC around a focus of ultraviolet killed Mtb H37Rv in the 3D granuloma system at times 0, 12, 24 and 48 hr post encapsulation in the matrix. The Z projection shows the cells contained within the designated volume in a 2D reconstruction. Full time course in Video 1. (B) Gene expression of PD-1 and its ligands in the 3D microsphere model. RNA was extracted from live Mtb-infected PBMC and relative expression investigated by qRT-PCR at day four post infection. Open bars, normoxia, filled bars 1% hypoxia. PD-L1 and PD-L2 are upregulated by Mtb infection, and in 1% hypoxia PD-1 expression is increased and PD-L2 expression further augmented (n = 4). Results are normalised against the housekeeping genes GAPDH, β-Microbulin and FANTA and showed similar results. β-microglobulin used for (B). *p<0.05, **p<0.01. (C–E) Surface expression of PD-1 and PD-L1. PBMCs were decapsulated from Mtb-infected microspheres at day seven and surface expression of PD-1 and its ligand PD-L1 were analysed by flow cytometry. PD-1 is expressed in CD4+ (C) and CD8+(D) T cells in PBMC from Mtb infected microspheres incubated in normoxia. PD-1 expression was significantly upregulated in 1% hypoxia. Representative flow cytometry plots and level of expression of PD-1 by the CD4+ and CD8+ T cell fractions are shown (n = 4). (E) PD-L1 expression on CD14+CD11b+ cells within PBMC in Mtb infected microspheres is upregulated in both normoxia and 1% hypoxia at day 7 (n = 4). Significance of *p<0.05. (F) Growth of Mtb H37Rv ffLux+ in microspheres in normoxia and 1% hypoxia measured at day 3, 7 and 14. Hypoxia reduces Mtb growth. (G) Hypoxia inducible factor 1α (HIF-1α) mRNA levels were increased in Mtb-infected microspheres incubated in 1% hypoxia. RNA was extracted from decapsulated microspheres and normalised to uninfected microspheres in the same environment. Results were normalised to the housekeeping genes GAPDH, β-microglobulin and FANTA to check the housekeeping gene are not affected by hypoxia. Similar results all three of the housekeeping genes. β-microglobulin used for this graph. Significance ***p<0.001.
Figure 2—figure supplement 1
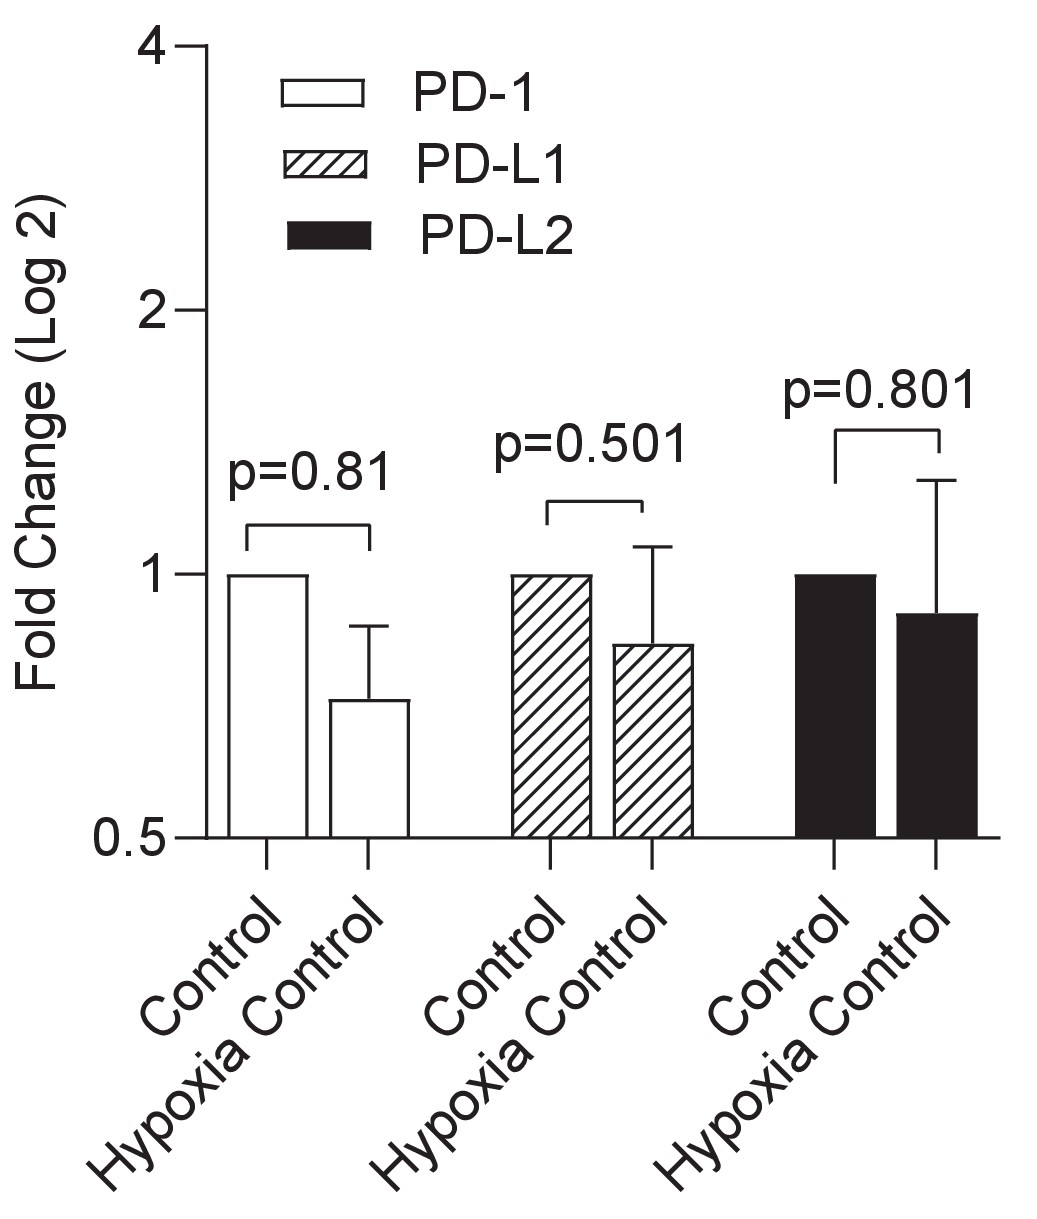
Hypoxia alone has no significant effect on expression of the PD-1/PD-L1/2 axis.
Gene expression PD-1 and its ligands in uninfected cells was compared between normoxic and hypoxic conditions in the microsphere model. RNA was extracted from uninfected PBMCs and relative expression investigated by qRT-PCR at day 4. Open bars PD-1, filled bars PD-L1 and black bars PD-L2 respectively. Results were normalised against the housekeeping genes GAPDH, β-Microbulin and FANTA and showed similar results. No significant changes in gene expression were noted in uninfected microspheres. β-microglobulin used for the analysis presented.
Figure 2—figure supplement 2
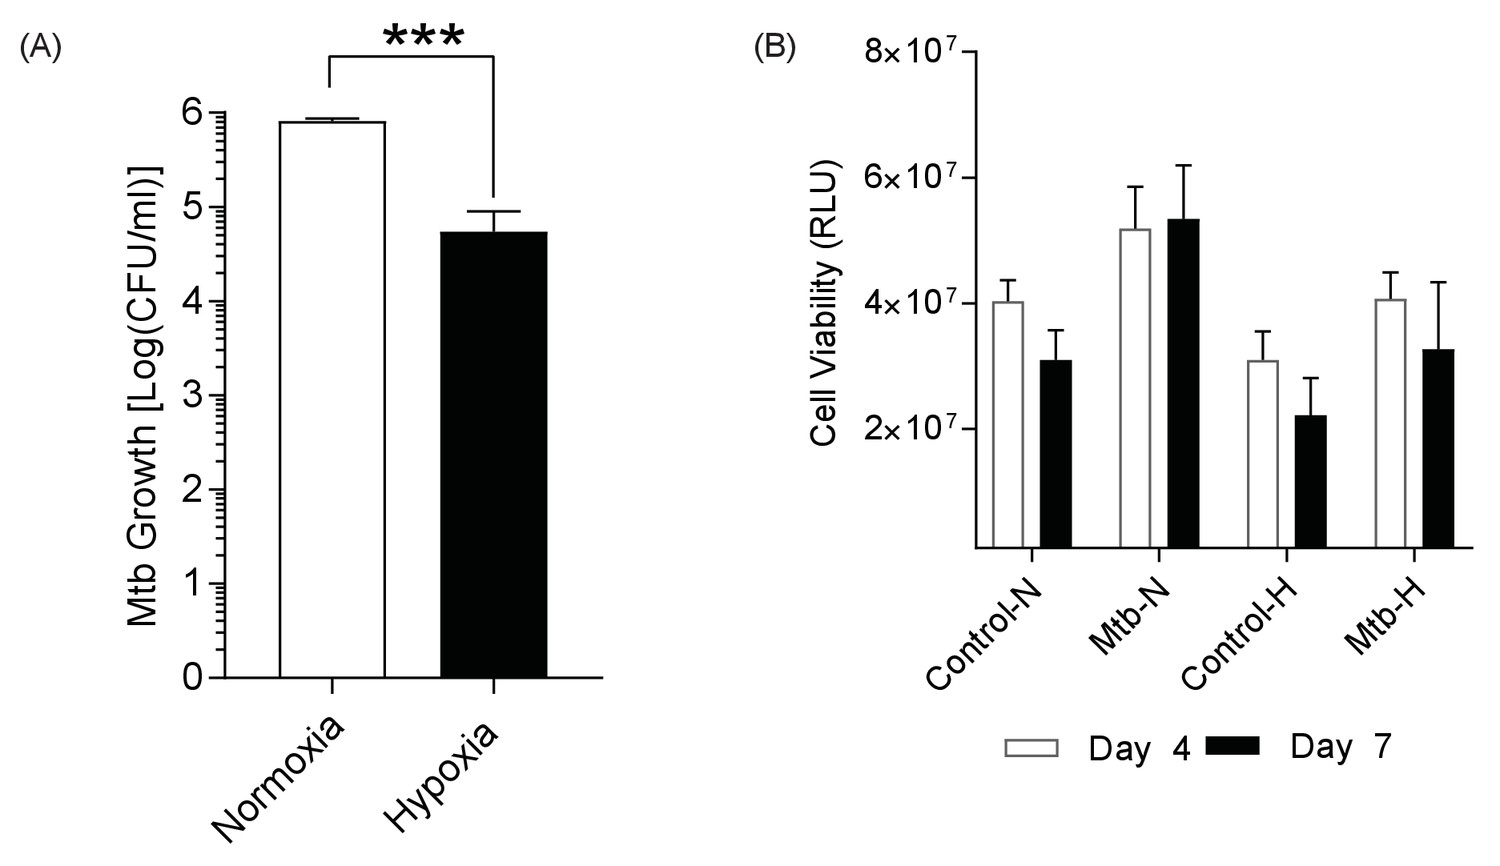
Mtb growth is reduced in hypoxia, while host cell viability is unchanged.
(A) Mtb H37Rv ffluc+ growth in 1% hypoxia. Microspheres were decapsulated in a media containing 5 mM EDTA and 0.1% saponin at day 14. The lysate was centrifuged, re-suspended in 1 ml PBS, serially diluted and grown in Middlebrook 7H11 media for 3 weeks before colony counting. (B) Host cell viability using 3D CytoxGlo viability assay (Promega) shows no significant difference between normoxia (open bars) and hypoxia (filled bars) at day 4 and day 7.
Figure 3 with 1 supplement
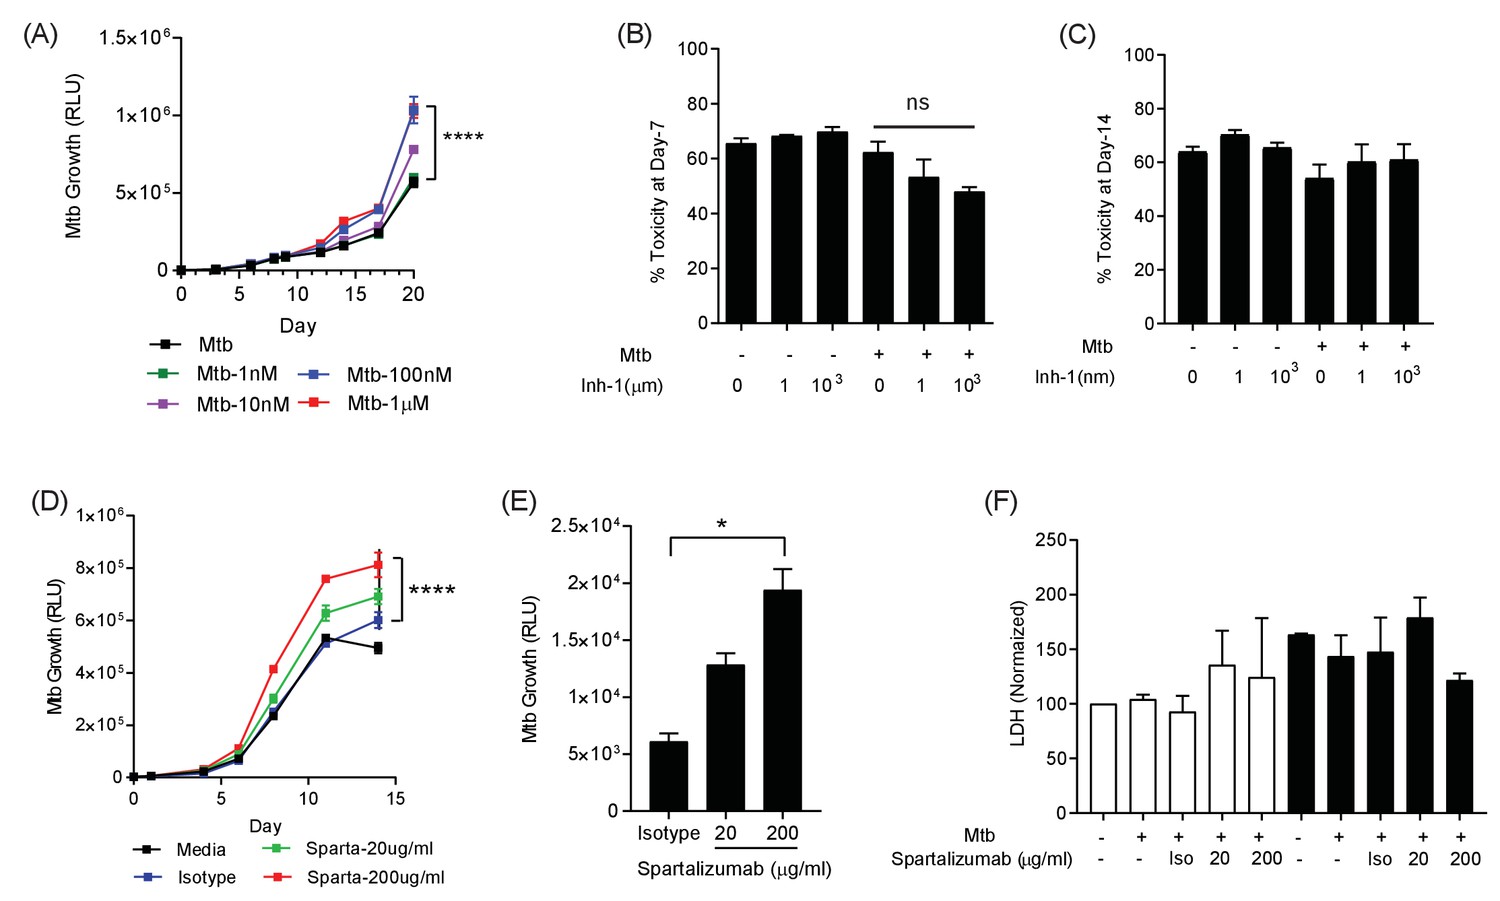
PD-1 pathway inhibition increases Mtb growth.
(A) Inhibition of PD-1 receptors by small chemical inhibitor one increases Mtb growth in a dose-response manner (1–1000 nM). Inhibitor concentration 1 nM (green), 10 nM (purple), 100 nM (blue) and 1 µM (red). (B) Inhibitor one was not toxic to Mtb-infected PBMC, analysed by CytoTox-Glo assay (Day 7). (C) Cellular toxicity was no different at day 14 as analysed by LDH release. Concentration 1 and 1000 nM were analysed for toxicity. (D) Spartalizumab, a therapeutic monoclonal anti-PD-1 antibody, progressively increased Mtb growth in microspheres in normoxia in a dose-dependent manner. (E) Spartalizumab also increased Mtb growth in hypoxia. Media (black), isotype (blue), spartalizumab 20 µg/ml (green) and 200 µg/ml (red). (F) The anti-PD-1 antibody had no effect on cell survival in microspheres in normoxia (clear bars) and 1% hypoxia (filled bars). Cytotoxity is determined by measuring LDH release at day 14 and normalized by the control. ****p<0.0001.
Figure 3—figure supplement 1

Small chemical inhibition of PD-1/PD-L1 interaction in 1% hypoxia measured at day 14 shows a dose-dependent increase in Mtb growth with PD-1 inhibition.
***p<0.0001 with one-way ANOVA with Dunnett’s multiple comparison test.
Figure 4 with 3 supplements
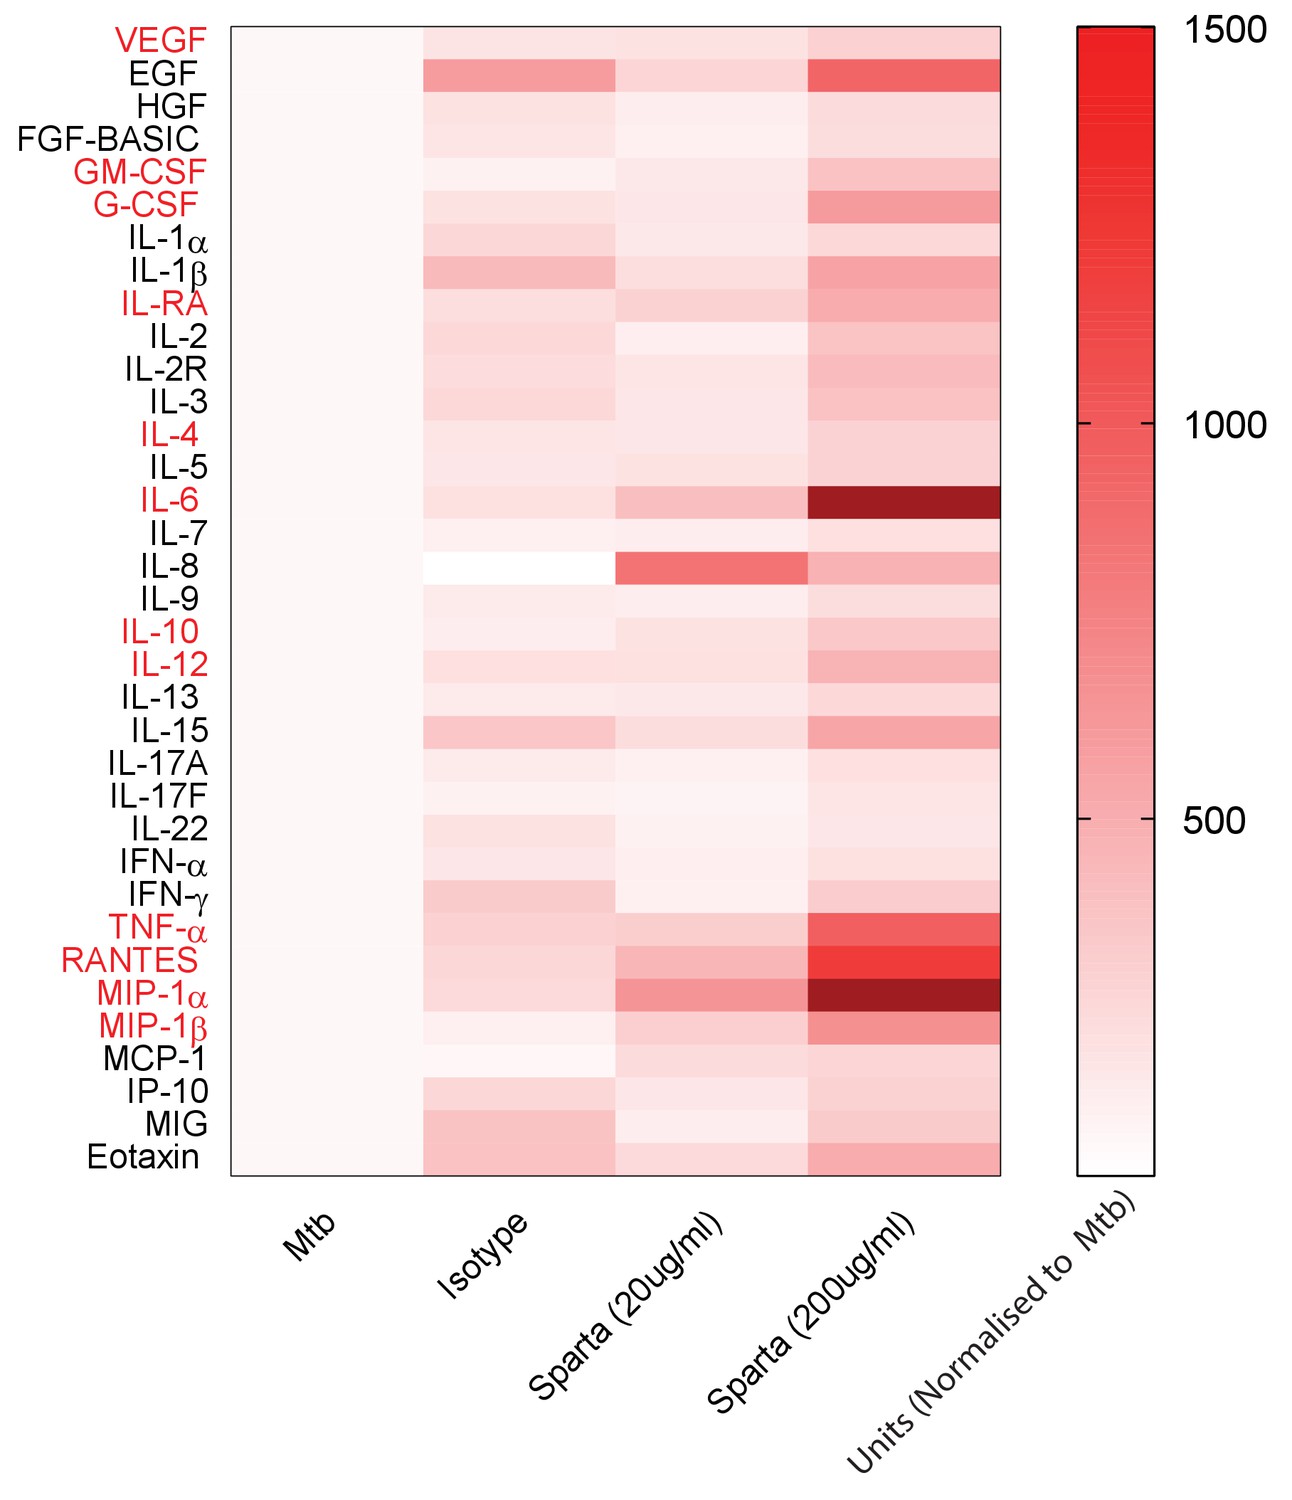
PD-1 inhibition increases secretion of multiple cytokines and growth factors.
PD-1/PD-L1 signalling was inhibited by Spartalizumab, a humanized IgG4 anti-PD1 monoclonal antibody, in Mtb-infected microspheres at 20 and 200µ/ml in normoxia. Supernatants were collected at day 14 and accumulation of cytokines and growth factors was analysed by Luminex 35-multiplex assay. Concentrations were normalized to secretion by Mtb infected microspheres to demonstrate relative fold change, and individual concentrations are shown in Figure 4—figure supplement 1. The experiment was performed twice with three replicates. Red font: **p<0.001 for Spartalizumab versus isotype control.
Figure 4—figure supplement 1
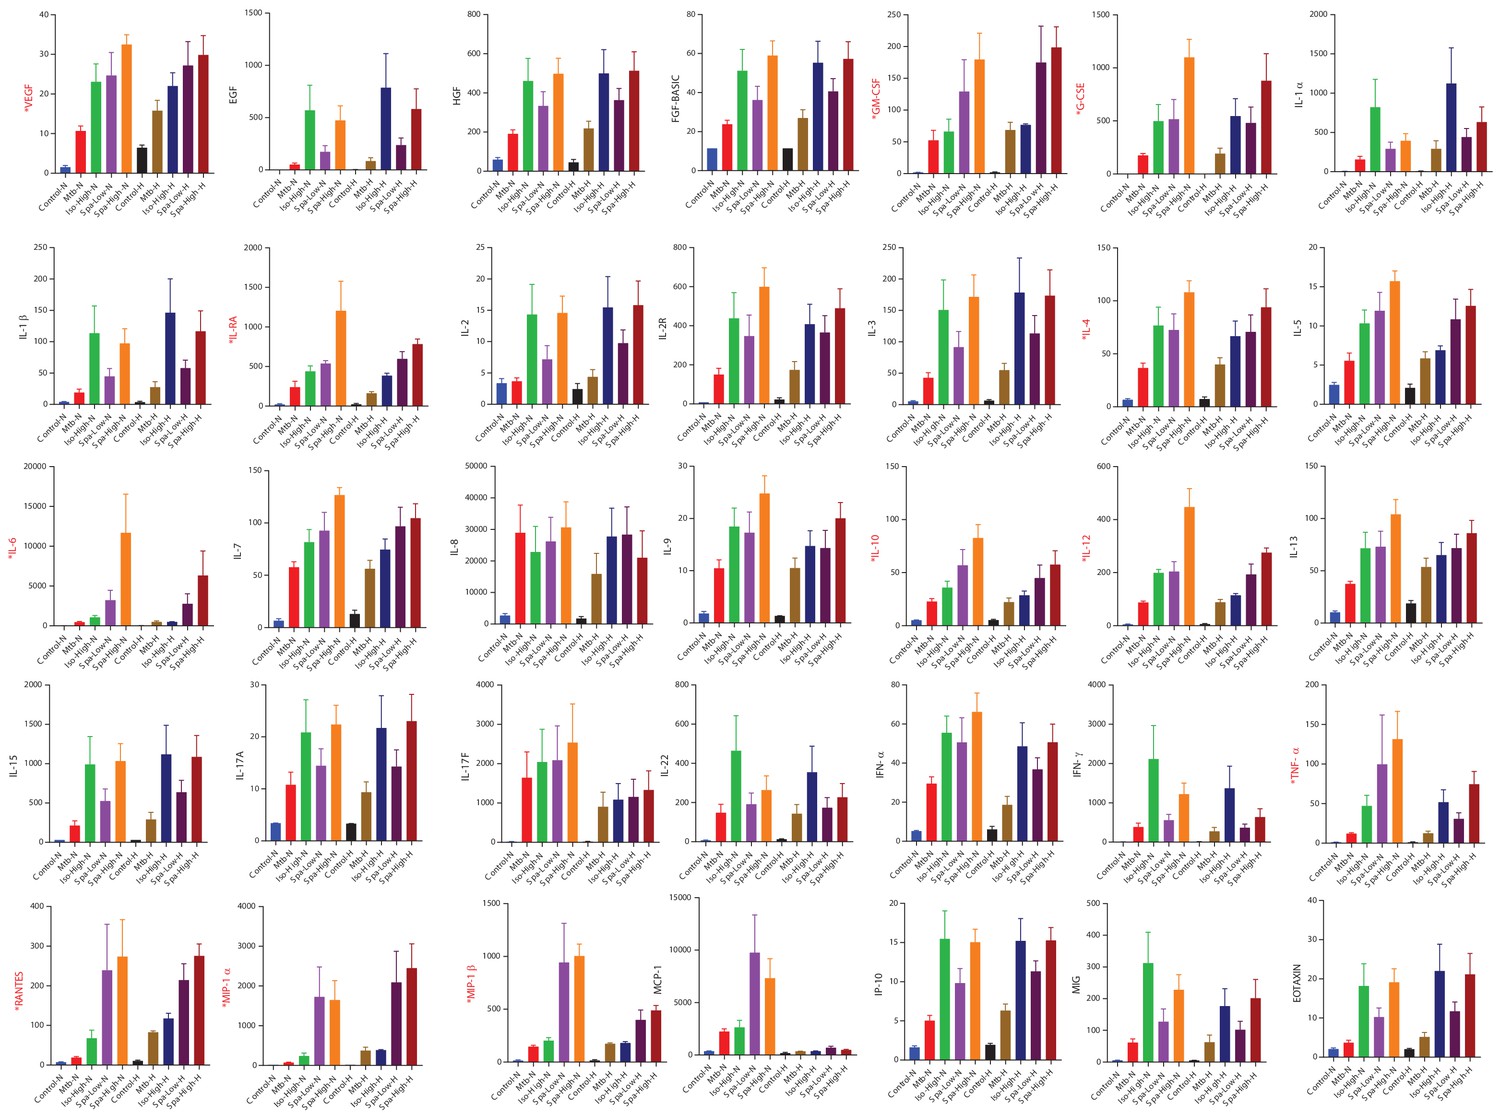
Cytokine accumulation around microspheres after inhibition of PD-1/PD-L1 signalling with Spartalizumab, a humanized IgG4 anti-PD1 monoclonal antibody at 20 and 200 µg/ml in normoxia (N) and 1% hypoxia (H).
Supernatants were collected at day 14 and a Luminex 35-multiplex assay was performed. The experiment was performed twice with three replicates. Concentrations are in pg/ml. Labels in red correspond to significantly raised cytokine values. Red font: Significance **p<0.001.
Figure 4—figure supplement 2
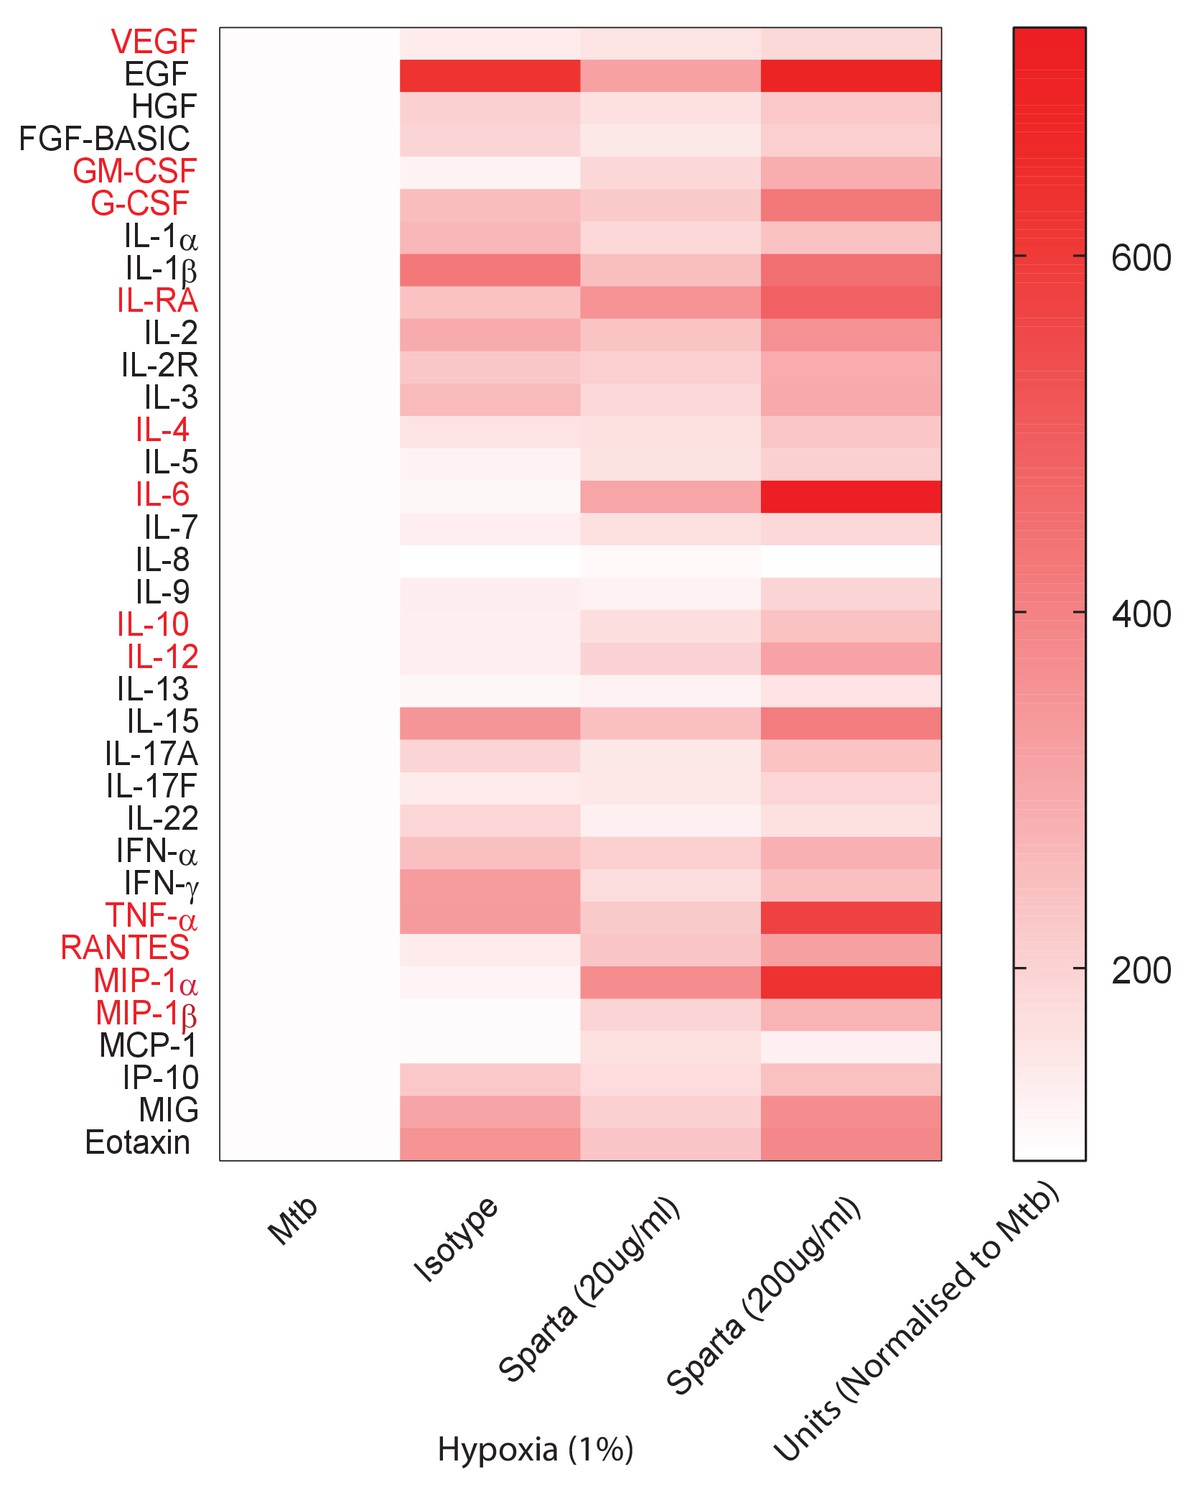
PD-1 inhibition increases secretion of multiple cytokines and growth factors in 1% hypoxia.
Supernatants were collected at day 14 and accumulation of cytokines and growth factors was analysed by Luminex 35-multiplex assay. Concentrations were normalized to secretion by Mtb infected microspheres to demonstrate relative fold change, and individual concentrations are shown in Figure 4—figure supplement 1. The experiment was performed twice with three replicates. Red font: **p<0.001 for Spartalizumab versus Isotype control.
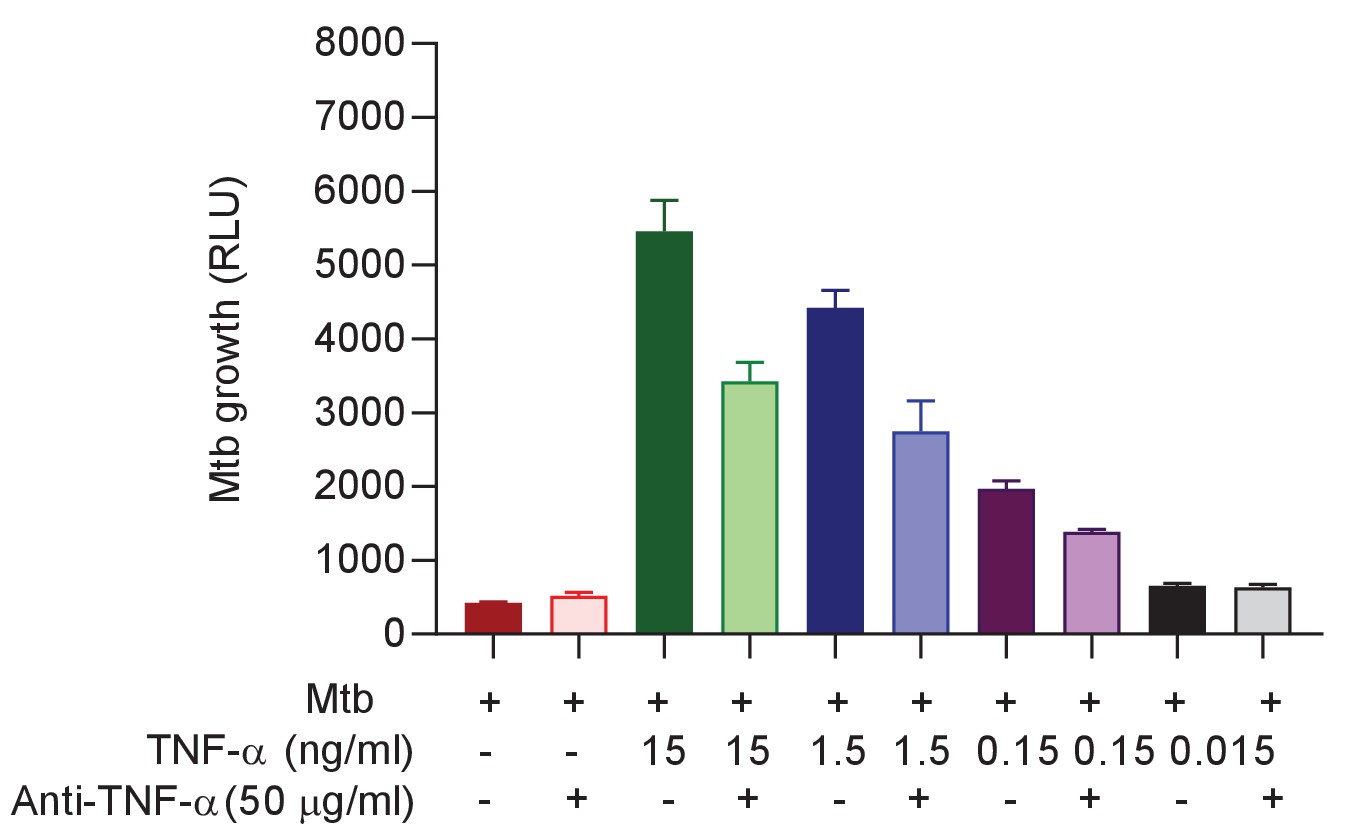
Figure 4—figure supplement 3
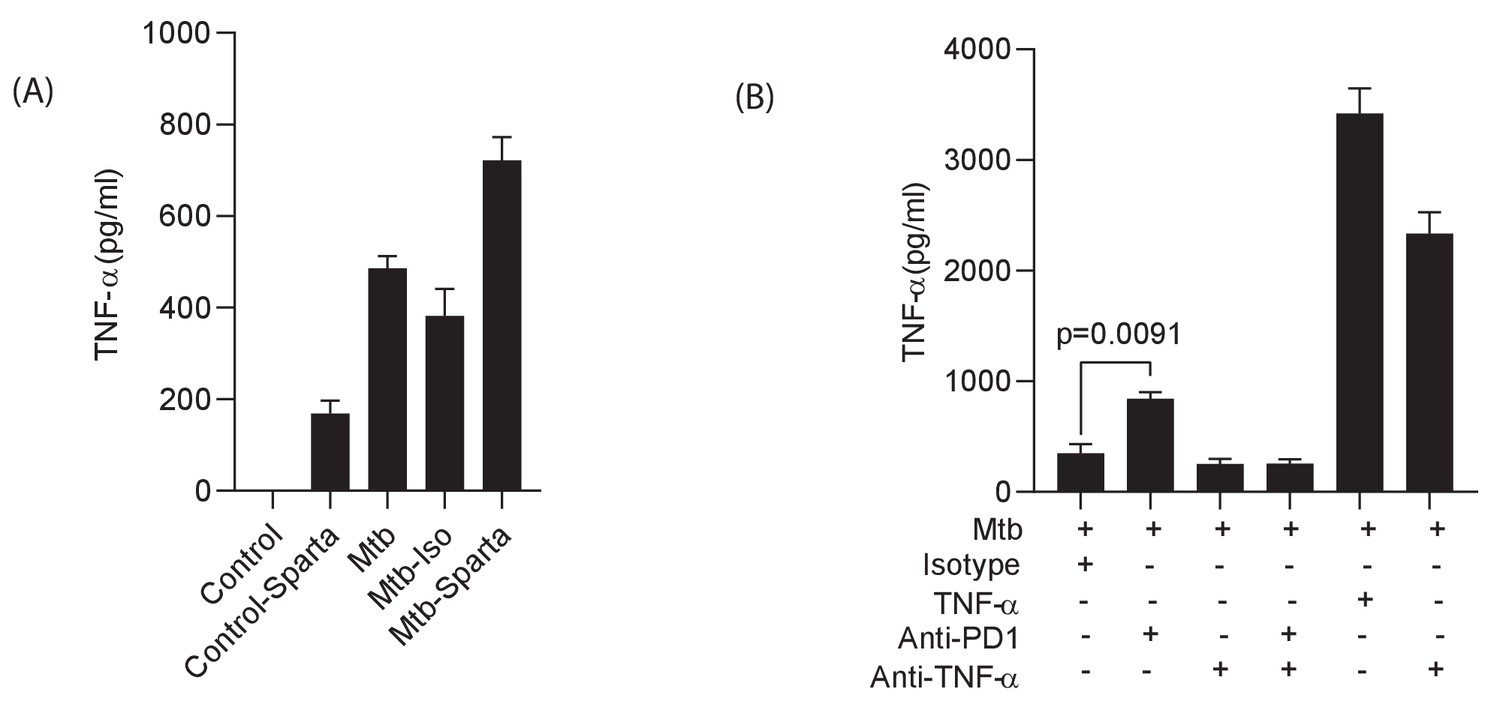
Spartalizumab induces TNF-α secretion in uninfected and infected microspheres, which is neutralised by anti-TNF-α.
PBMCs which were uninfected or infected with Mtb were encapsulated in alginate-collagen matrix after pre- incubation in Spartalizumab at 200 μg/ml. The supernatant was collected to measure TNF-α secretion at day 7. (A) Spartalizumab induces TNF-α secretion in uninfected cells above background, which is accentuated with Mtb infection. (B) Anti-PD-1 antibody increases TNF-α secretion from Mtb infected cells above isotype, and the detectable levels are suppressed by anti-TNF antibody (50 μg/ml).
Figure 5 with 4 supplements
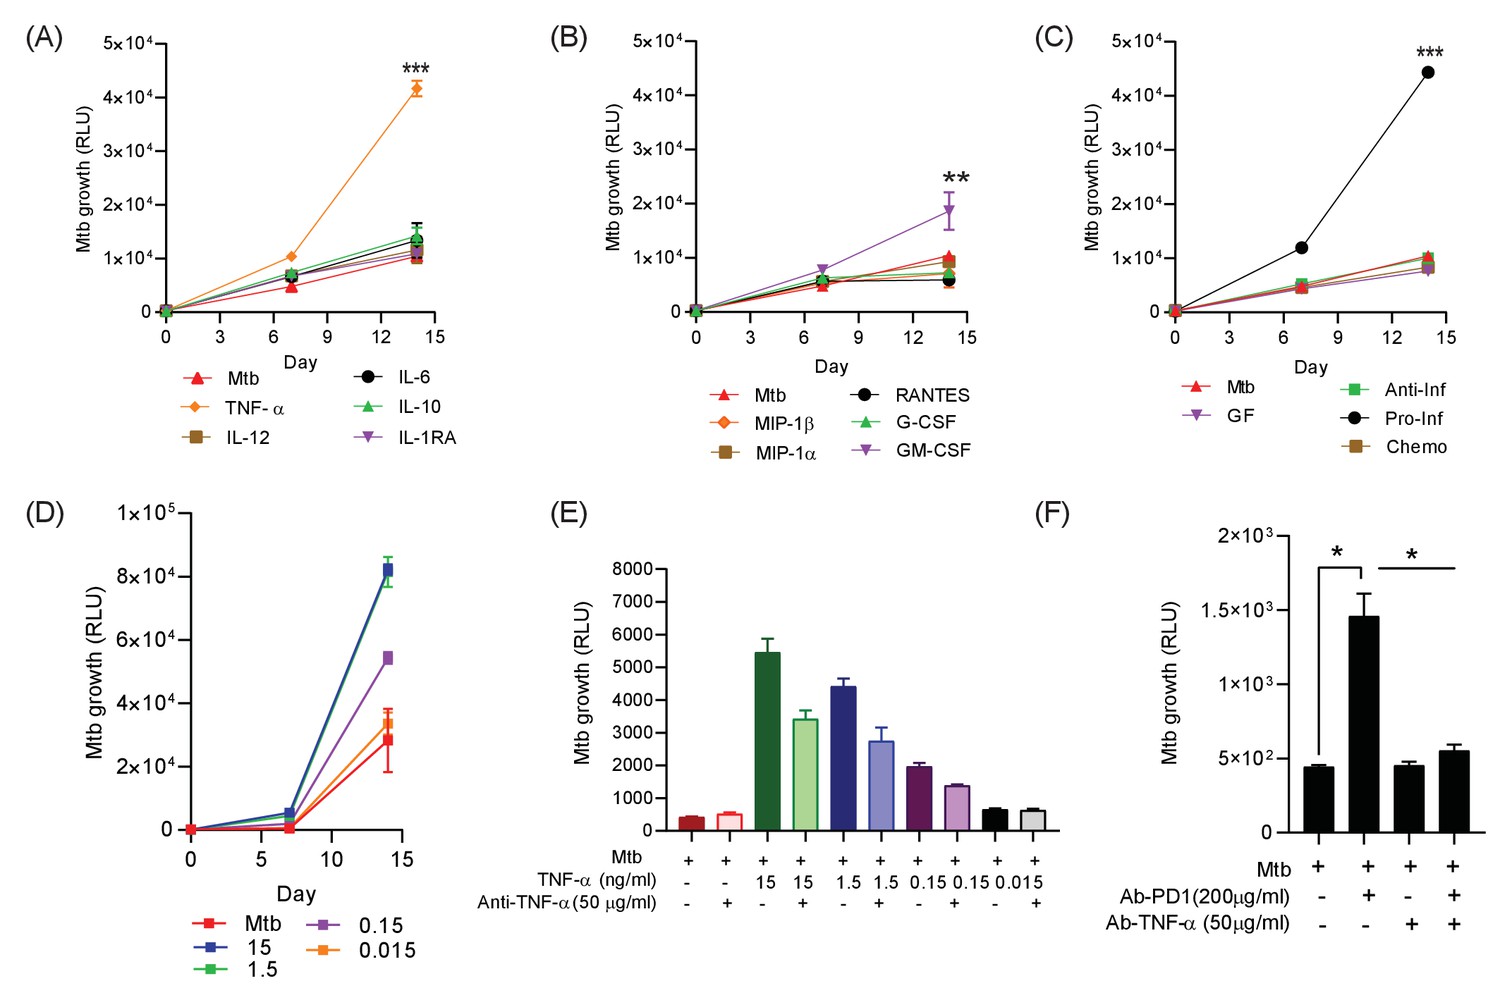
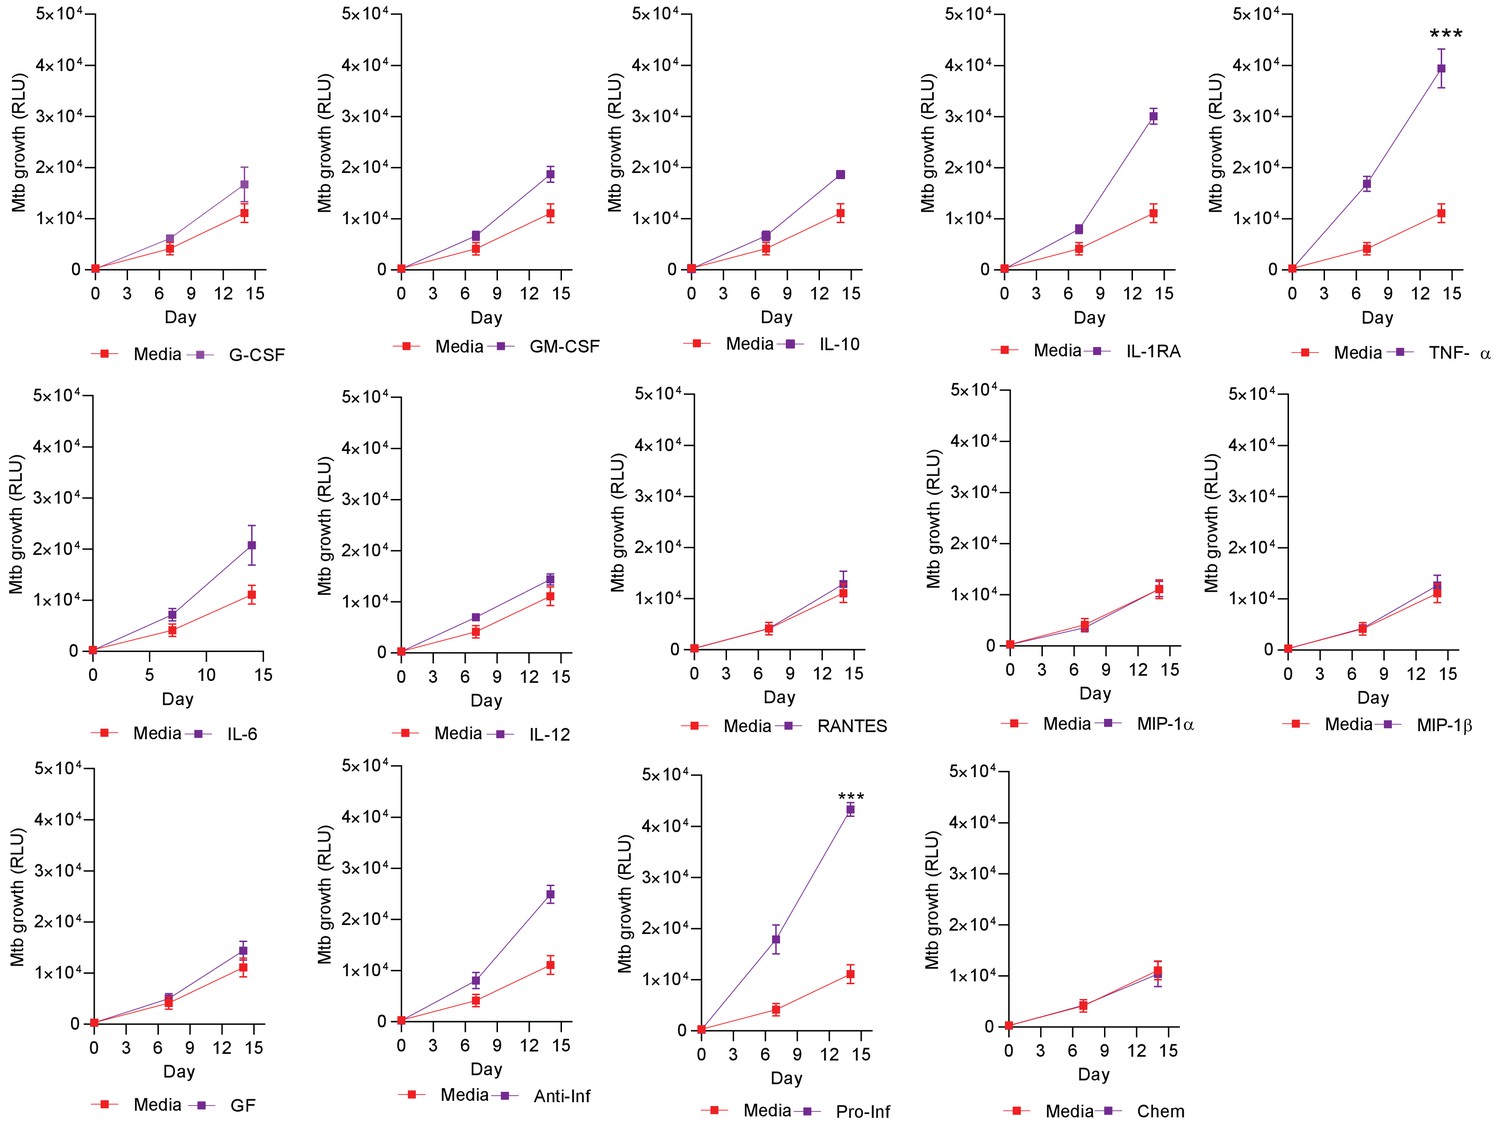
Addition of TNF-α increases Mtb growth in microspheres in normoxia.
Recombinant human G-CSF, GM-CSF, IL-4, IL-6, IL-10, IL-12, TNF-α, IL-1RA, MIP-1α, MIP-1β or RANTES were added either individually (A and B) or in combination pools (C) to Mtb-infected microspheres at ‘low’ concentrations, defined as that measured in media around spheres after anti-PD-1 treatment. Recombinant human TNF-α increases growth of Mtb, whilst other pro-inflammatory cytokines did not (A). GM-CSF has a lesser growth-promoting effect (B). The only combination pool that increased Mtb growth was the pro-inflammatory cytokine pool, containing TNF-α (C). (D) TNF-α results in a dose-dependent increase in the Mtb growth over time. (E) Anti-TNF-α neutralising antibodies partially suppress the increased Mtb growth caused by TNF-α augmentation. Anti-TNF-α from Thermo Fisher Scientific. (F) Anti-PD1 antibody incorporation within microspheres increases of Mtb growth at day 7, and this effect is reversed by concurrent anti-TNF-α neutralising antibodies within microspheres. The constituent of the cytokine pools are: Growth factor pool (GF: GM-CSF and G-CSF), Anti-Inflammatory cytokine pool (Anti-Inf: IL-10 and IL-1RA), Pro-Inflammatory cytokine pool (Pro-Inf: TNF-α, IL-6 and IL-12) and Chemokine pool (Chemo: RANTES, MIP-1α, MIP-1β).
Figure 5—figure supplement 1
Individual Mtb growth curves at ‘high’ cytokine concentration, five times the concentration measured in media after anti-PD-1 treatment.
Human recombinant G-CSF, GM-CSF, IL-4, IL-6, IL-10, IL-12, TNF-α, IL-1RA, MIP-1α, MIP-1β and RANTES were added to microspheres either individually or in combination pools to microspheres at five times the concentrations in Figure 5, determined by the concentration measured in the media around the microspheres. TNF-α increases Mtb growth in microspheres alone and in the pro-inflammatory pool.
Figure 5—figure supplement 2
Anti-TNF-α neutralizing antibodies supress the Mtb growth following TNF-α from a different source (Anti-TNF-α from Sigma-Aldrich, UK).
Figure 5—figure supplement 3
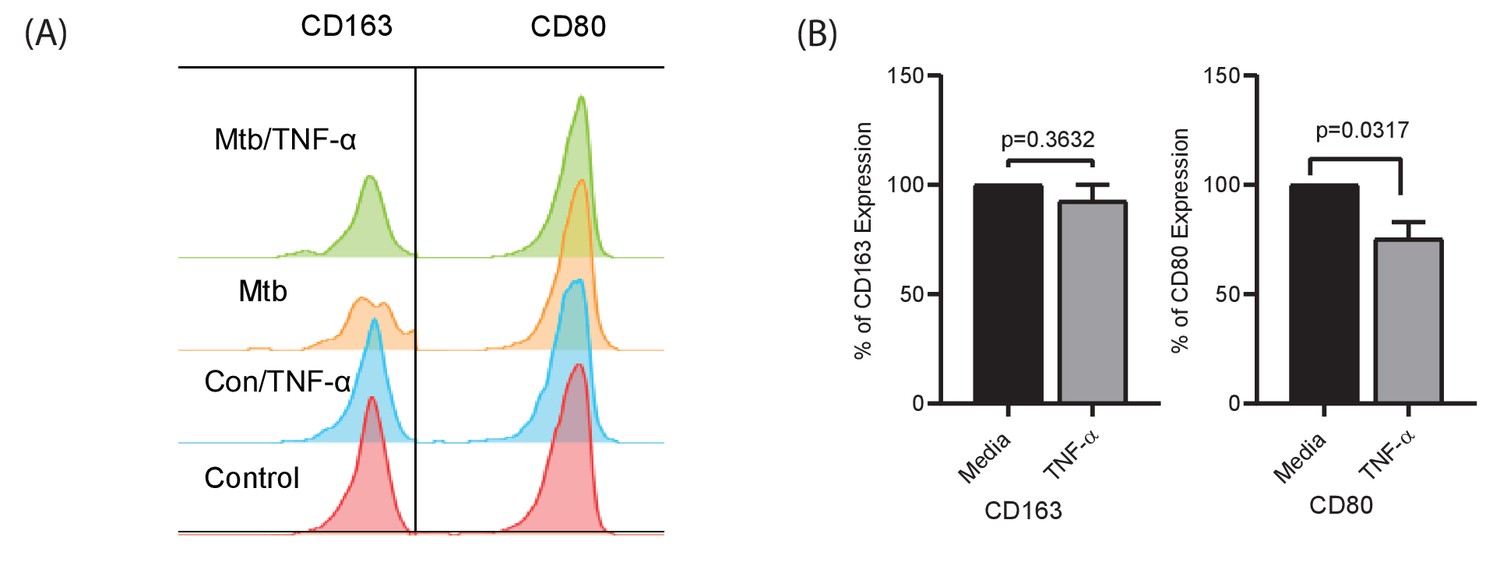
TNF-α skews polarization of monocytes to macrophages with lower CD80 expression.
PBMCs were infected with Mtb H37Rv at MOI of 0.1 and encapsulated in alginate-collagen microspheres after overnight incubation. Microspheres were then incubated in complete RPMI (with L-Glutamine and 10% human serum) with TNF-α 7.5 ng/ml. Uninfected PBMCs were encapsulated and treated similarly as a comparator for TNF-α stimulation. At day 7, the microspheres were decapsulated in 0.5 mM EDTA solution at pH of 7.2. Double staining with CD14 and CD11b defined macrophages, which were classified by CD80 and CD163 expression. (A) Histogram showing expression of CD163 and CD80 where there was significant decrease in CD80 expression as shown if Figure (B). TNF suppressed the relative geometric mean of CD80, but did not affect CD163 expression. This experiment was performed in four separate donors.
Figure 5—figure supplement 4
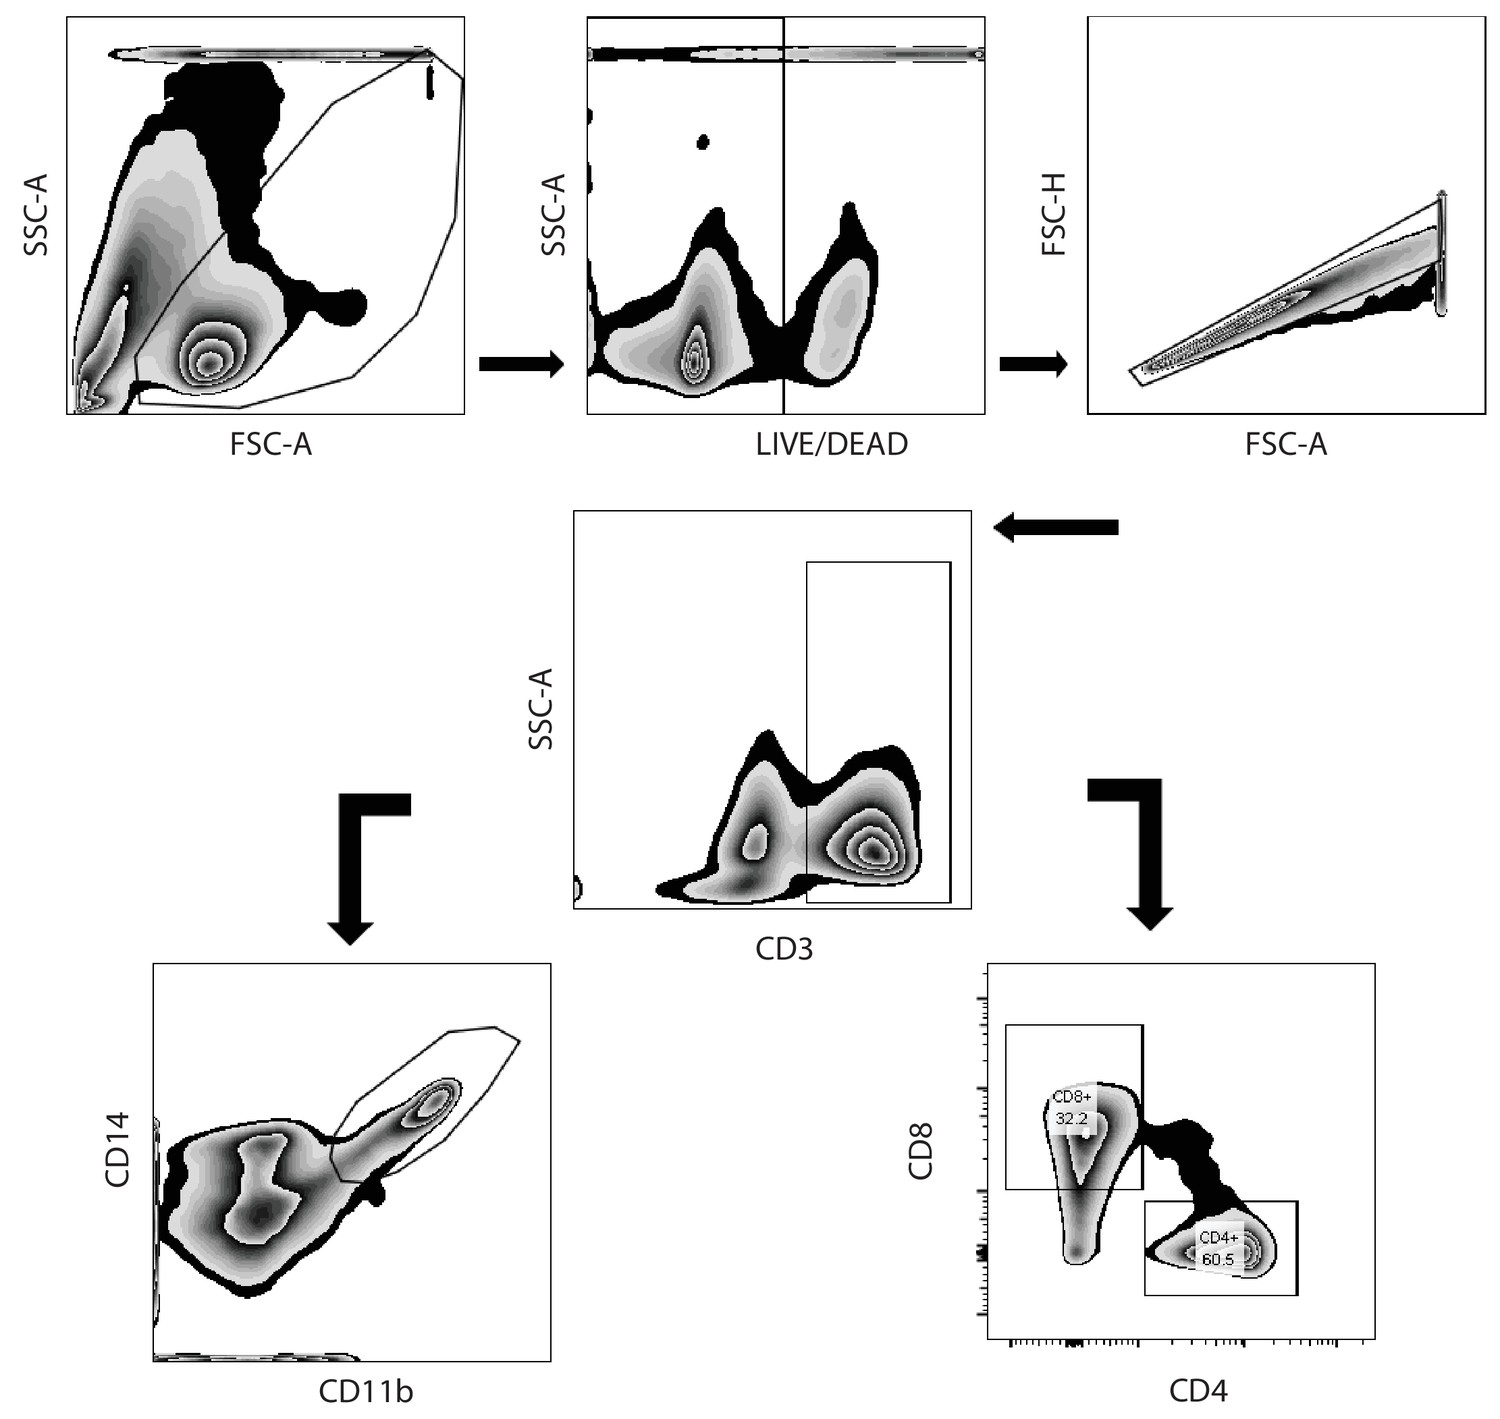
Hierarchical gating strategy used to identify lymphocyte and monocytic populations from decapsulated microspheres containing human peripheral blood monocular cells.
Single cells were decapsulated from microspheres in 5 mM EDTA, washed and processed for flow cytometry. First doublets were excluded from live cells, then cells were gated as CD3+ and CD3-. Subsequently, lymphocytes were further classified into CD4+ and CD8+, which are sub-categorized based on PD-1 staining. Double staining with both CD14 and CD11b defined macrophages, which were further analysed for PD-L1, CD80 and CD163 surface expression. All the antibodies and clone number are listed in the text and the key resources table.
Figure 6
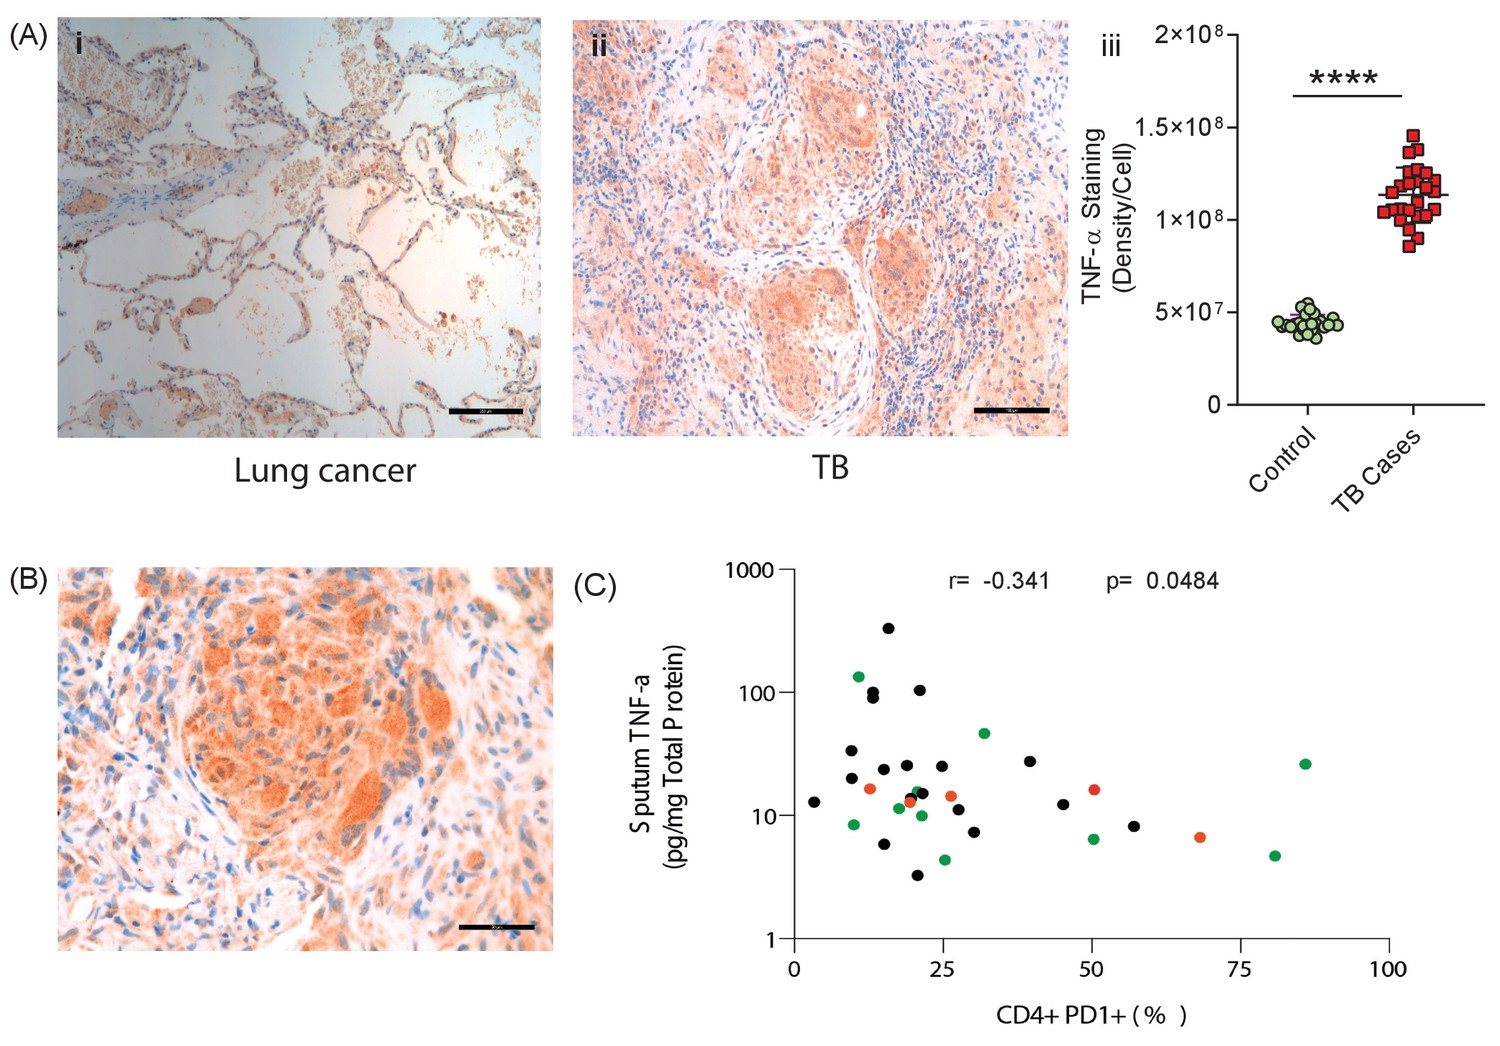
TNF-α is expressed in human TB granulomas and sputum TNF-α concentrations negatively correlate with circulating PD-1 expression.
(A) TNF-α is expressed within human lung TB granulomas, with greater immunoreactivity than control lung tissue at the excision margin of lung cancer (i and ii). Quantification of TNF-α immunostaining (n = 5) in TB cases was significantly higher than controls (n = 5) (iii). (B) TNF-α immunostaining was extensive in the lung granuloma of a patient that developed TB whilst treated with pembrolizumab, a humanized anti-PD-1 antibody (n = 1). (C) CD4+ T cell PD-1 expression on circulating PBMC negatively correlates with sputum TNF-α concentration in a separate cohort where paired sputum and PBMCs samples are available. Green dots, healthy controls; Black TB cases; Orange respiratory symptomatics. Analysis by Spearman’s correlation analysis gave r-value of −0.341 with p=0.0484.
Videos
Video 1
Cell migration over 48 hr around a central cluster of macrophages infected with UV-killed Mtb within a 3D alginate-collagen matrix.
Migration is seen in the first 24 hr, without aggregation, and then progressive granuloma formation occurs.
Tables
Key resources table
| Reagent type (species) or resource | Designation | Source or reference | Identifiers | Additional information |
|---|---|---|---|---|
| Strain, strain background (Mycobacterium tuberculosis) | H37Rv | (From Ref: 20) | Used at multiple of infection of 0.1 | |
| Strain, strain background (Mycobacterium tuberculosis) | H37Rv pMV306hsp+LuxAB+G13+CDE | (From Ref: 20) | Used at multiple of infection of 0.1 | |
| Strain, strain background (Mycobacterium tuberculosis) | H37Rv pMV306hsp encoding the wild-type FFluc | (From Ref: 20) | Used at multiple of infection of 0.1 | |
| Biological sample (Antibodies) | ||||
| Antibody | anti-CD45-V500 Horizon (Clone no. HI30) | BD Biosciences | Cat.No.563792 | Monoclonal mouse antibody |
| Antibody | anti-CD3 Brilliant Violet 785 (Clone no. OKT3) | Biolegend | Cat.No.317330 | Monoclonal mouse antibody |
| Antibody | anti-CD3-PE (Clone no. HIT3a) | Biolegend | Cat.No.300308 | Monoclonal mouse antibody |
| Antibody | anti-CD4 Brilliant Ultra Violet 496 (Clone no. SK3) | BD Bioscience | Cat.No.612937 | Monoclonal mouse antibody |
| Antibody | anti-CD4-PerCP (Clone no. OKT4) | Biolegend | Cat.No.317432 | Monoclonal mouse antibody |
| Antibody | anti-CD8 Brilliant Violet 605 (Clone no. RPA-T8) | Biolegend | Cat.No.301040 | Monoclonal mouse antibody |
| Antibody | anti-CD8-APC (Clone no. SK1) | Biolegend | Cat.No.344722 | Monoclonal mouse antibody |
| Antibody | anti-CD103-APC (Clone no. Ber-ACT8) | BD Biosciences | Cat.No.563883 | Monoclonal mouse antibody |
| Antibody | anti-CD69 Brilliant Ultra Violet 395 (Clone no. FN50) | Biolegend | Cat.No.310902 | Monoclonal mouse antibody |
| Antibody | anti-HLA-DR-PerCP (Clone no. L243) | Biolegend | Cat.No.307628 | Monoclonal mouse antibody |
| Antibody | anti-CD279-BB515 (Clone no. EH12.1) | BD Biosciences | Cat.No.564494 | Monoclonal mouse antibody |
| Antibody | anti- CD-274-BB515 (Clone no. MIH1) | BD Biosciences | Cat.No.564554 | Monoclonal mouse antibody |
| Antibody | anti-PD-1 Brilliant Violet 421 (Clone no.EH12.1) | BD Biosciences | Cat.No.562516 | Monoclonal mouse antibody |
| Antibody | anti-CD11b-APC (Clone no. ICRF44) | Biolegend | Cat.No.301310 | Monoclonal mouse antibody |
| Antibody | anti-CD45-APC/Cy7 (Clone no. 2D1) | Biolegend | Cat.No.368516 | Monoclonal mouse antibody |
| Antibody | anti-CD14-AP/APC (Clone no. HCD14) | Biolegend | Cat.No.325608 | Monoclonal mouse antibody |
| Antibody | anti-True-Stain Monocyte Blocker | Biolegend | Cat.No.426102 | Monoclonal mouse antibody |
| Antibody | anti-CD4 (Clone no. M7310) | DAKO | Cat.No.M7310 | Monoclonal mouse antibody |
| Antibody | anti-CD8 (Clone no. M7103) | DAKO | Cat.No. M7103 | Monoclonal mouse antibody |
| Antibody | anti-PD1 (Clone no. ab5287) | Abcam | Cat.No.ab52587 | Monoclonal mouse antibody |
| Antibody | anti-TNF-α (Clone no. ab1793) | Abcam | Cat.No.ab1793 | Monoclonal mouse antibody |
| Antibody | Spartalizumab | Selleckchem | Cat.No.A2017 | 20 µg/ml and 200 µg/ml, monoclonal, mouse IgG4 |
| Antibody | IgG4 | Sino Biologicals | Cat.No.13505-HNAH | 20 µg/ml and 200 µg/ml,monoclonal, mouse IgG4 |
| Antibody | Mouse IgG1 kappa Isotype Control (P3.6.2.8.1), | Thermo Fisher Scientific | Cat.No.16-4714-82 | 50 µg/ml, mouse monoclonal IgG2A |
| Antibody | Mouse IgG1 Negative Control, clone Ci4 | Merck Life Sciences | Cat.No.MABC002 | 51 µg/ml, mouse monoclonal IgG2A |
| Antibody | anti-TNF-α | Thermo Fisher Scientific | Cat.No.16-7348-81 | 52 µg/ml, mouse monoclonal IgG2A |
| Sequence-based reagent (Applied Biosystems TaqMan Gene Expression primers) | GAPDH | Thermo Fisher Scientific | #Hs02758991_g1 | |
| β2-Microbulin | Thermo Fisher Scientific | #Hs00608023_m1 | ||
| FNTA | Thermo Fisher Scientific | #Hs00357739_m1 | ||
| PDCD1 | Thermo Fisher Scientific | #Hs01550088_m1 | ||
| CD274 | Thermo Fisher Scientific | #Hs00204257_m1 | ||
| PDCD1LG2 | Thermo Fisher Scientific | #Hs00228839_m1 | ||
| HIF-1α | Thermo Fisher Scientific | #Hs00153153_m1 | ||
| Commercial assay or kit | CytoTox-Glo Cytotoxicity Assay | Promega | G9291 | Commercial assay or kit |
| Lactate Dehydrogenase Activity Assay Kit | Merck | 11 644 793 001 | Commercial assay or kit | |
| Cytokine and Chemokine 35-Plex Human ProcartaPlex Panel | Thermo Fisher Scientific | LHC6005M | Commercial assay or kit | |
| Chemical compound, drug | PD-1/PD-L1 Inhibitor 1 | Cambridge Biosciences, UK | #1675201-83-8 | Chemical compound |
| Recombinant Human G-CSF | ImmunoTools | Cat.No.11343115 | 1 ng/ml and 5 ng/ml | |
| Recombinant Human GM-CSF | ImmunoTools | Cat.No.11343125 | 0.25 ng/ml and 1.25 ng/ml | |
| Recombinant Human IL-1RA/IL1 F3 | ImmunoTools | Cat.No.11344876 | 1.25 ng/ml and 6.25 ng/ml | |
| Recombinant Human IL-10 | ImmunoTools | Cat.No.11340105 | 0.2 ng/ml and 1 ng/ml | |
| Recombinant Human IL-6 | ImmunoTools | Cat.No.11340066 | 10.0 ng/ml and 50.0 ng/ml | |
| Recombinant Human IL-12 | ImmunoTools | Cat.No.11349125 | 0.5 ng/ml and 2.5 ng/ml | |
| Recombinant Human TNF-α | ImmunoTools | Cat.No.11343017 | 0.3 ng/ml, 1.5 ng/ml,7.5 ng/ml and 15 ng/ml | |
| Recombinant Human IL-15 | ImmunoTools | Cat.No.11340155 | 0.5 ng/ml, 5 ng/ml and 50 ng/ml | |
| Recombinant Human IL-17A | ImmunoTools | Cat.No.11340176 | 1 ng/ml, 10 ng/ml and 100 ng/ml | |
| Recombinant Human IL-17F | ImmunoTools | Cat.No.11349176 | 1 ng/ml, 10 ng/ml and 100 ng/ml | |
| Recombinant Human RANTES | ImmunoTools | Cat.No.11343196 | 0.3 ng/ml and 1.5 ng/ml | |
| Recombinant Human MIP-1α | ImmunoTools | Cat.No.11343206 | 1.5 ng/ml and 7.5 ng/ml | |
| Recombinant Human MIP-1β | ImmunoTools | Cat.No.11343223 | 1.0 ng/ml and 5 ng/ml | |
| Recombinant Human MCP | ImmunoTools | Cat.No.11343386 | 1 ng/ml, 10 ng/ml and 100 ng/ml | |
| Software, algorithm | FlowJo | BD Bioscences | version 10.6.1 | Software |
| BD FACSDiva Software | BD Biosciences | Software | ||
| Graphpad Prism | GraphPad Software LLC | v7.05 | Software |
Additional files
-
Source data 1
Primary data for figures provided in manuscript.
- https://cdn.elifesciences.org/articles/52668/elife-52668-data1-v2.xlsx
-
Supplementary file 1
PD-1 expressing cells for each subset expressed as percentage of live CD45+ cells, with range in parentheses.
- https://cdn.elifesciences.org/articles/52668/elife-52668-supp1-v2.xlsx
-
Transparent reporting form
- https://cdn.elifesciences.org/articles/52668/elife-52668-transrepform-v2.docx
Download links
A two-part list of links to download the article, or parts of the article, in various formats.
Downloads (link to download the article as PDF)
Open citations (links to open the citations from this article in various online reference manager services)
Cite this article (links to download the citations from this article in formats compatible with various reference manager tools)
Anti-PD-1 immunotherapy leads to tuberculosis reactivation via dysregulation of TNF-α
eLife 9:e52668.
https://doi.org/10.7554/eLife.52668


