Identification of a molecular basis for the juvenile sleep state
- Department of Psychiatry, Perelman School of Medicine at the University of Pennsylvania, United States
- Department of Medicine, Perelman School of Medicine at the University of Pennsylvania, United States
- Department of Biology, University of New Mexico, United States
- Department of Neuroscience, Perelman School of Medicine at the University of Pennsylvania, United States
- Chronobiology and Sleep Institute, Perelman School of Medicine at the University of Pennsylvania, United States
Figures
Figure 1 with 2 supplements

Pdm3 controls sleep ontogeny in Drosophila.
(A) Ontogeny screen design (B) Primary sleep ontogeny screen. Ontogeny ratio = (min daytime sleep, young) / (min daytime sleep, mature). (C) Secondary screen of primary hits (n ≥ 8 flies per genotype/age in B and C). (D) Representative sleep traces of genetic controls (top) and pdm3 knockdown (bottom). Young flies are shown in blue and mature flies are shown in orange. Comparison of (E) total sleep, (F) day sleep and (G) night sleep in pdm3 RNAi and controls at day 1 versus day 4–5 (n = 97, 106, 119, 95, 140, 145 left to right in E-G). (H) Total sleep time with re-expression of PDM3 (right) versus a control UAS-GFP construct (middle) (n = 24, 24, 19, 16, 30, 31 left to right). Graphs in this figure and all others unless otherwise specified are presented as means ± SEM. ****p<0.0001, ***p<0.001, **p<0.01, *p<0.05; multiple Student’s t tests with Holm-Sidak correction, alpha = 0.05 (E–H).
Figure 1—figure supplement 1
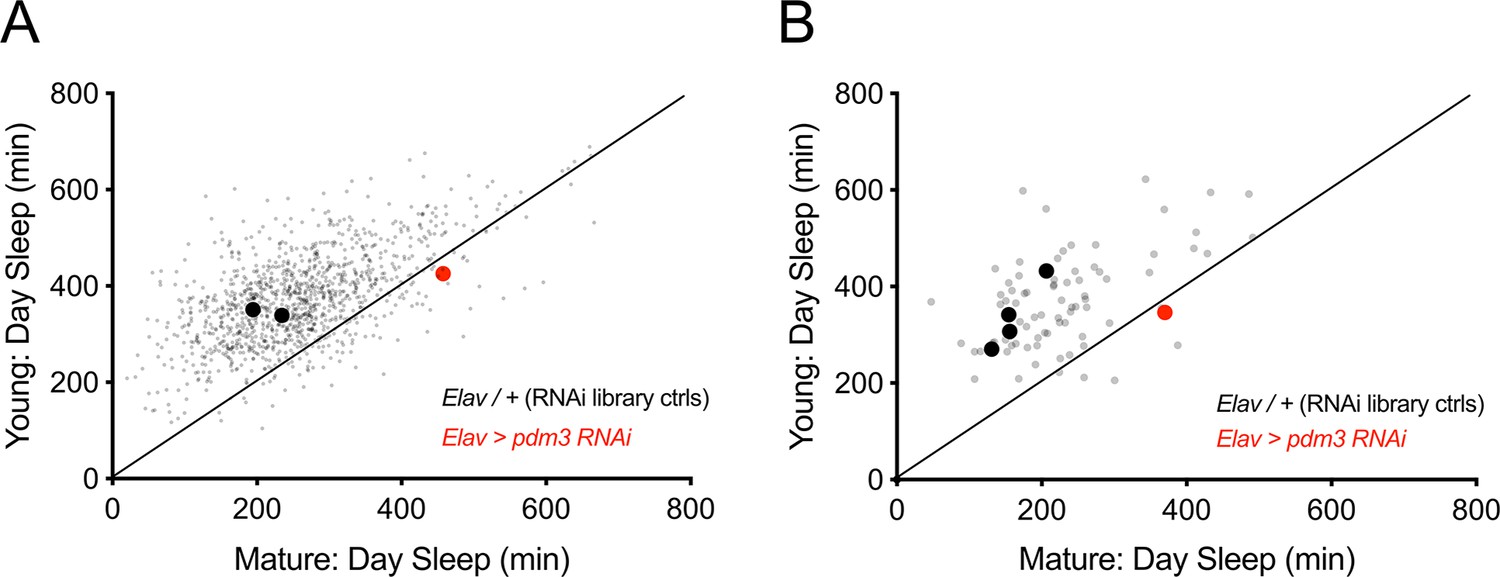
Young versus mature sleep amounts in primary and secondary sleep ontogeny screens.
Daytime sleep in young flies is plotted against daytime sleep in mature flies of the same genotype. Genotypes that fall below or along the plotted identity line (day sleep in young = day sleep in mature) have abnormal sleep ontogeny. (A) Primary sleep ontogeny screen. (B) Secondary screen of primary hits (n ≥ 8 flies per genotype/age in A and B).
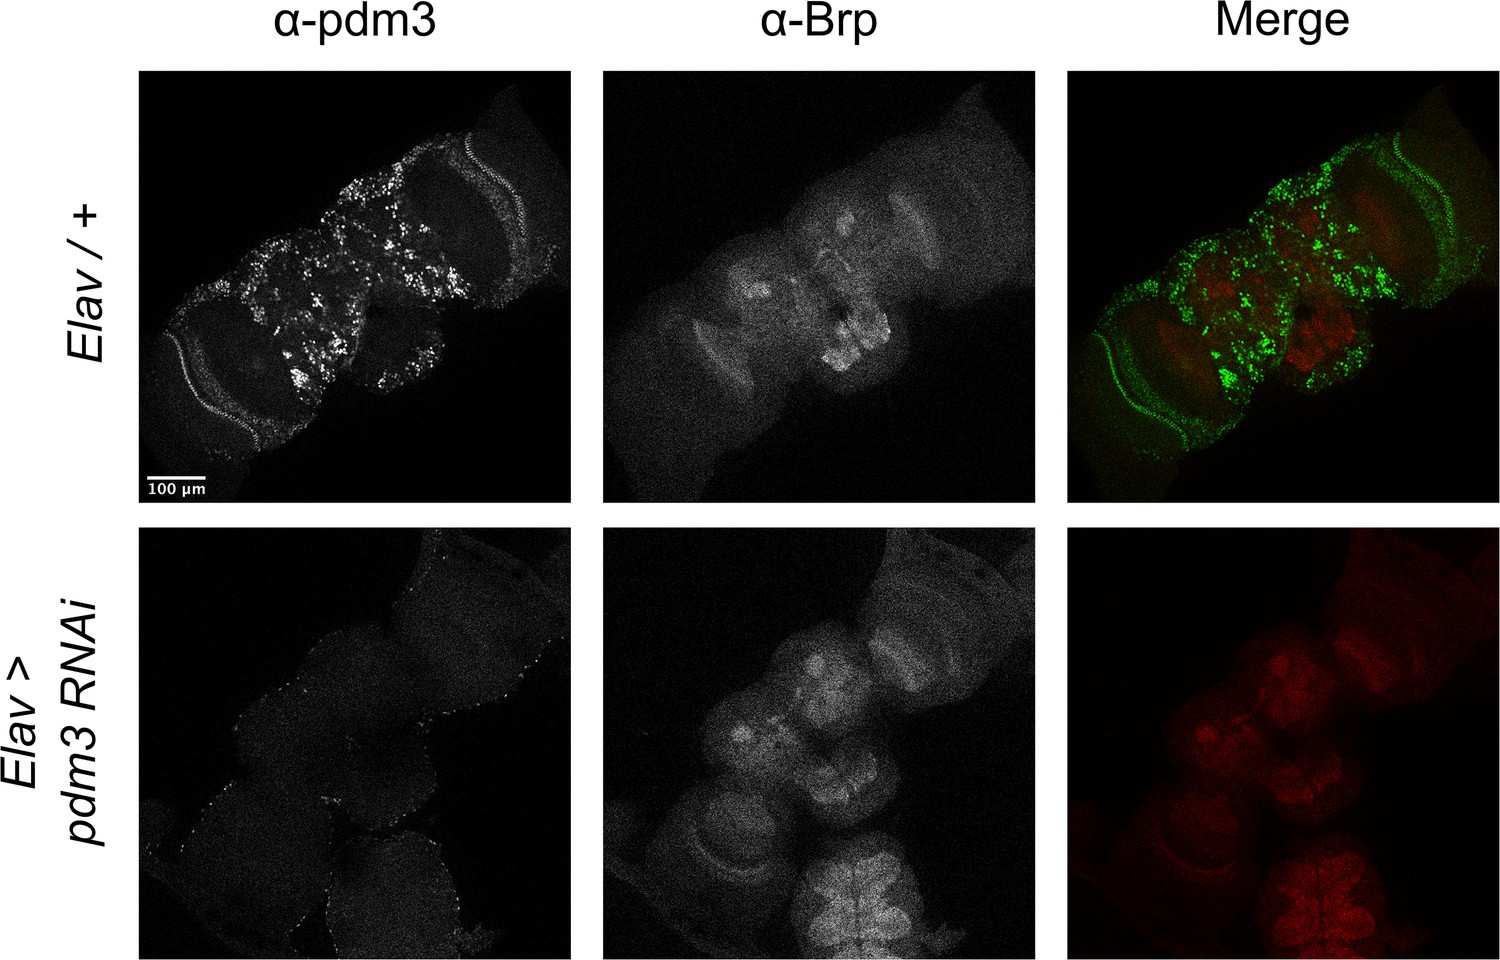
Figure 1—figure supplement 2
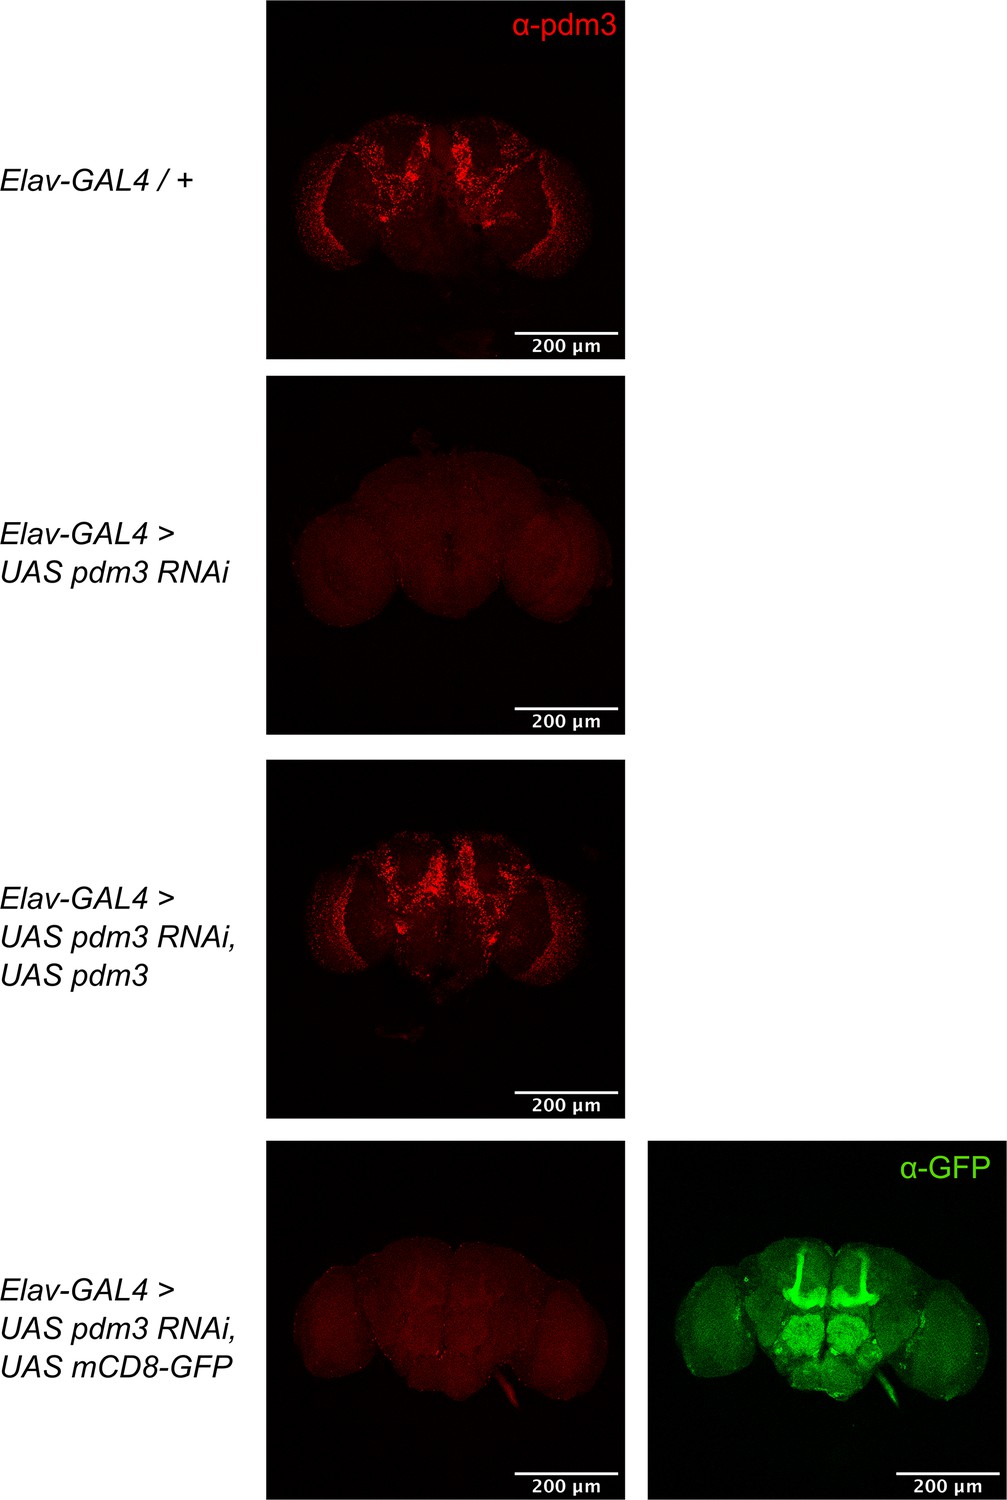
Confirmation of pdm3 knockdown.
Staining with anti-PDM3 antibody to confirm pdm3 knockdown and rescue. Co-expression of a control construct, UAS-GFP, in the setting of pdm3 RNAi does not affect PDM3 protein levels in the brain.
Figure 2 with 3 supplements
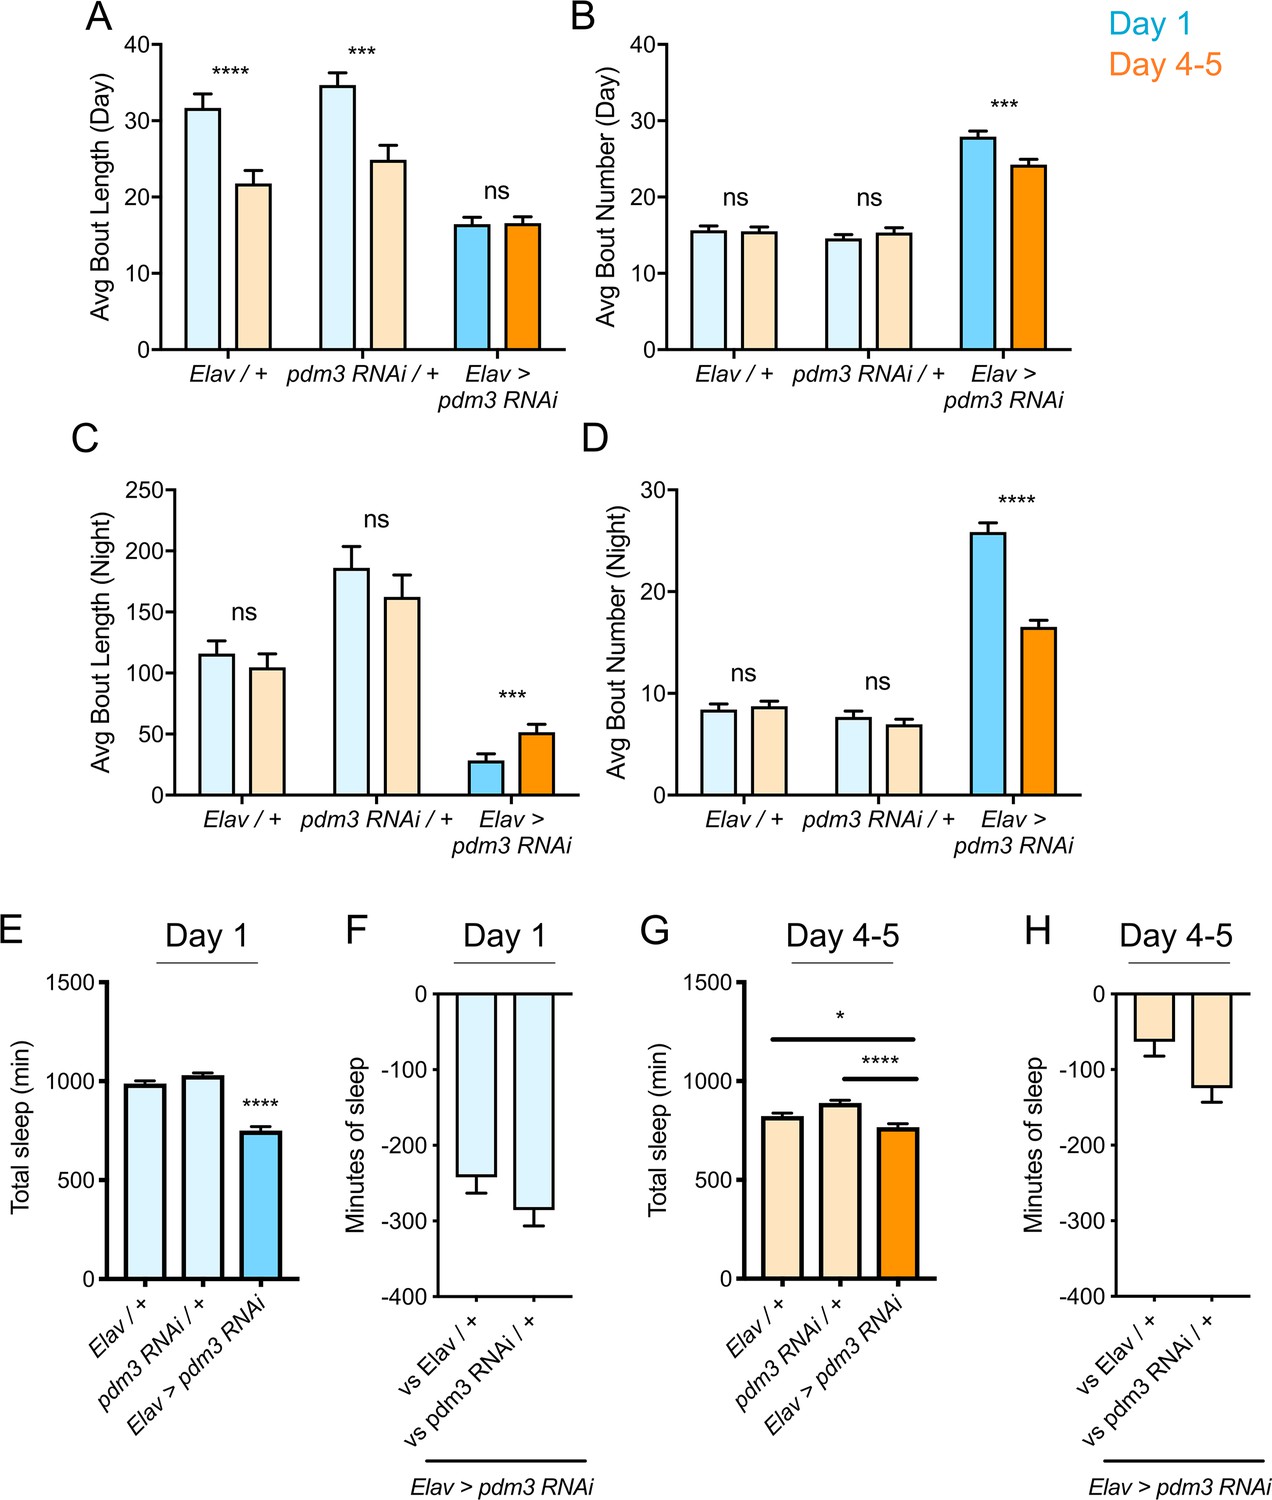
Effects of pdm3 knockdown on sleep architecture.
(A) Day sleep average bout length and (B) day sleep average bout number in pdm3 RNAi and controls at day 1 (blue) versus day 4–5 (orange). (C) Night bout length and (D) night average bout number in pdm3 RNAi and controls (n = 97, 106, 119, 95, 140, 145 left to right in A-D). (E) Total sleep time at day 1, pdm3 RNAi versus controls (n = 97, 119, 140 left to right). (F) Minutes of sleep lost in Elav-GAL4 >UAS pdm3 RNAi at day one compared to each genetic control. (G) Total sleep time at day 4–5, pdm3 RNAi versus controls (n = 106, 95, 145 left to right). (H) Minutes of sleep lost in Elav-GAL4 >UAS pdm3 RNAi at day 4–5 compared to each genetic control. ****p<0.0001, ***p<0.001, **p<0.01, *p<0.05; multiple Student’s t tests with Holm-Sidak correction, alpha = 0.05 (A–D); ANOVA with Tukey’s test (E–H).
Figure 2—figure supplement 1
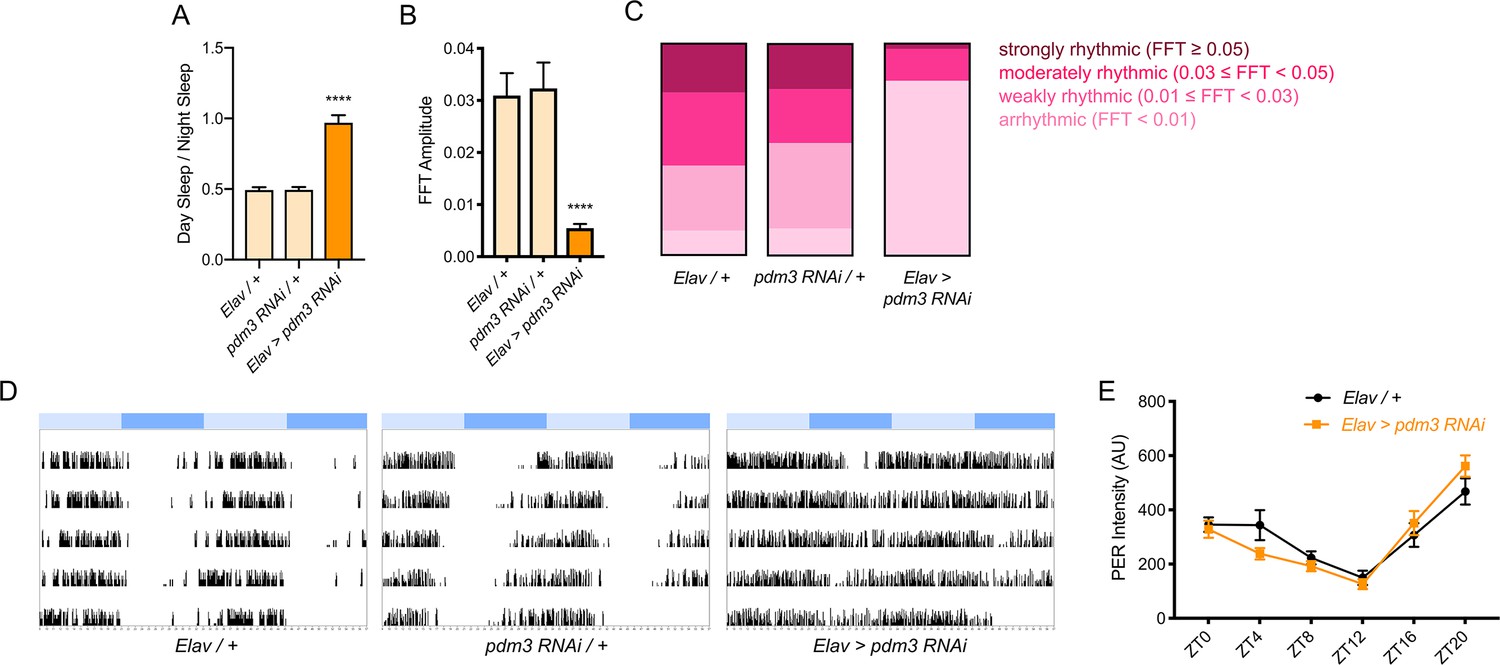
Pdm3 knockdown disrupts behavioral rhythms but leaves molecular clock intact.
(A) Quantification of sleep redistribution as ratio of day/night sleep in mature flies (n = 106, 95, 145 left to right). (B) FFT amplitude of free-running rhythms in constant darkness (mature flies) (n = 29, 25, 28 left to right). (C) Classification of rhythm strength based on FFT value. (D) Representative actograms for each genotype in constant darkness. (E) Intensity of PER protein levels in sLNv core clock cells across the circadian day in pdm3 knockdown and controls (n = 7–9 brains per condition).
Figure 2—figure supplement 2
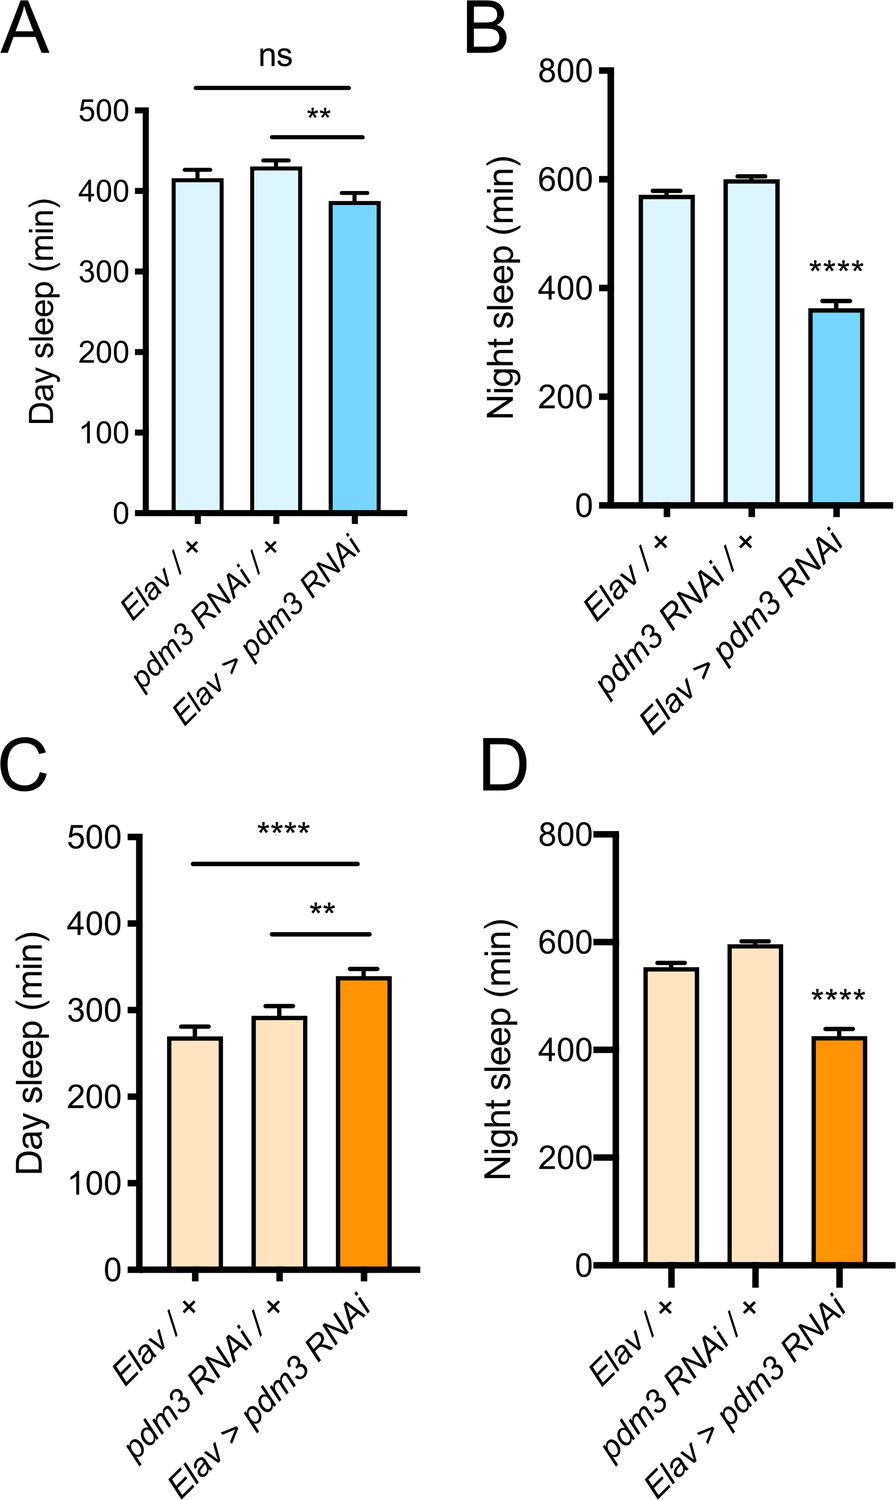
Comparison of sleep duration within age groups with pdm3 knockdown.
Day (A) and night (B) sleep duration at day 1, pdm3 RNAi versus controls (n = 97, 119, 140 left to right). Day (C) and night (D) sleep duration at day 4–5, pdm3 RNAi versus controls (n = 106, 95, 145 left to right) ****p<0.0001, ***p<0.001, **p<0.01, *p<0.05; ANOVA with Tukey’s test (A–D).
Figure 2—figure supplement 3
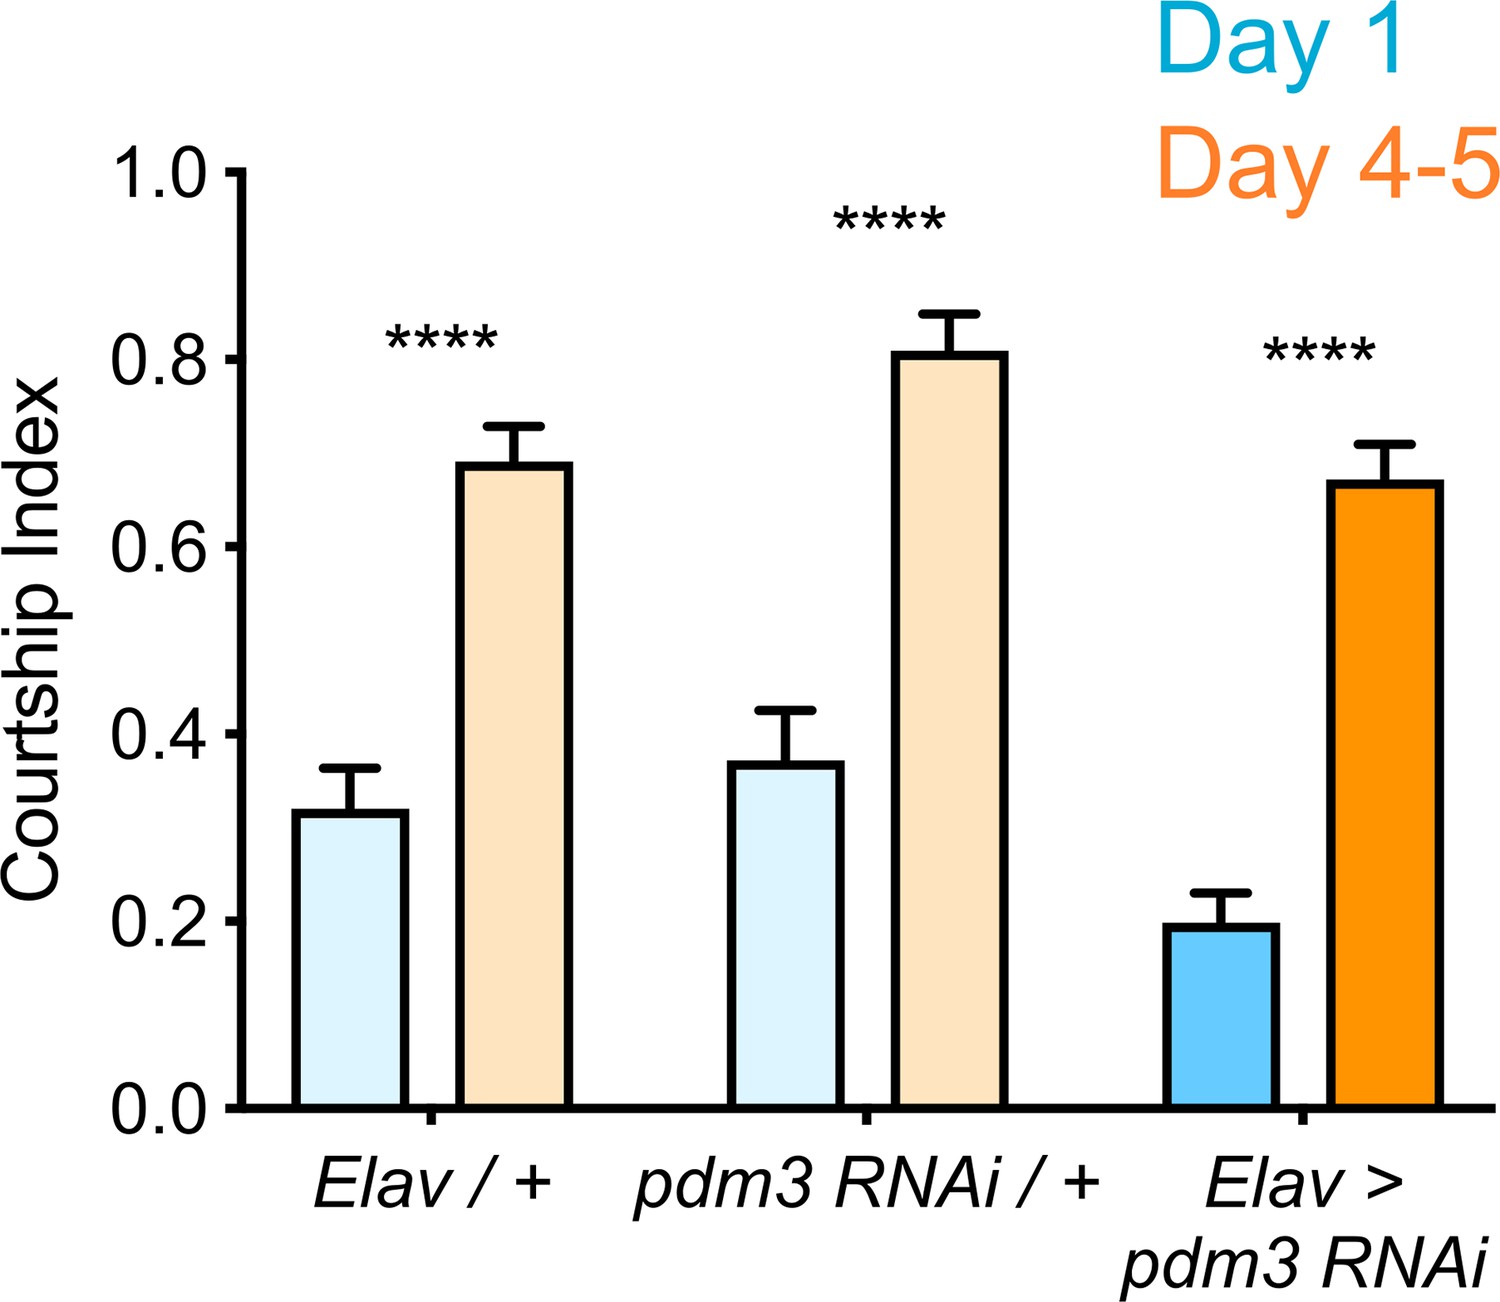
Maturation of courtship behaviors are unaffected by pdm3 knockdown.
Courtship Index (time spent engaged in courtship behavior/total assay time) at day 1 versus day 4–5 in controls and pdm3 RNAi (darker bars, right) (n = 28, 27, 21, 28, 23, 28 left to right). ****p<0.0001; multiple Student’s t tests with Holm-Sidak correction, alpha = 0.05.
Figure 3 with 1 supplement

Pdm3 acts during mid-pupal development to control sleep ontogeny.
(A) Drosophila life cycle. (B) Total sleep in mature adults with pdm3 knockdown post-eclosion and genetic controls (n = 50, 60, 70 left to right). (C) Total sleep with pre-eclosion pdm3 knockdown in day 1 (blue) versus day 4–5 (orange) (n = 44, 42, 38, 42, 35, 50 left to right) (D) Total sleep with pdm3 knockdown from embryo to the 3rd instar larval stage (n = 76, 79, 82, 64, 73, 99 left to right). (E) Total sleep (left) and day sleep bout number (right) with pdm3 knockdown from the 3rd instar larval stage up to the mid pupal stage (n = 33, 32, 32, 31, 32, 32 left to right). (F) Total sleep (left) and day sleep bout number (right) with pdm3 knockdown from the 3rd instar larval stage to the late pupal stage (n = 30, 32, 32, 32, 32, 31 left to right). (G) Summary of temporal mapping and dissociation of sleep ontogeny from sleep architecture ****p<0.0001, ***p<0.001, **p<0.01, *p<0.05; multiple Student’s t tests with Holm-Sidak correction, alpha = 0.05 (C, D, E/F left); ANOVA with Tukey’s test (B, E/F right).
Figure 3—figure supplement 1
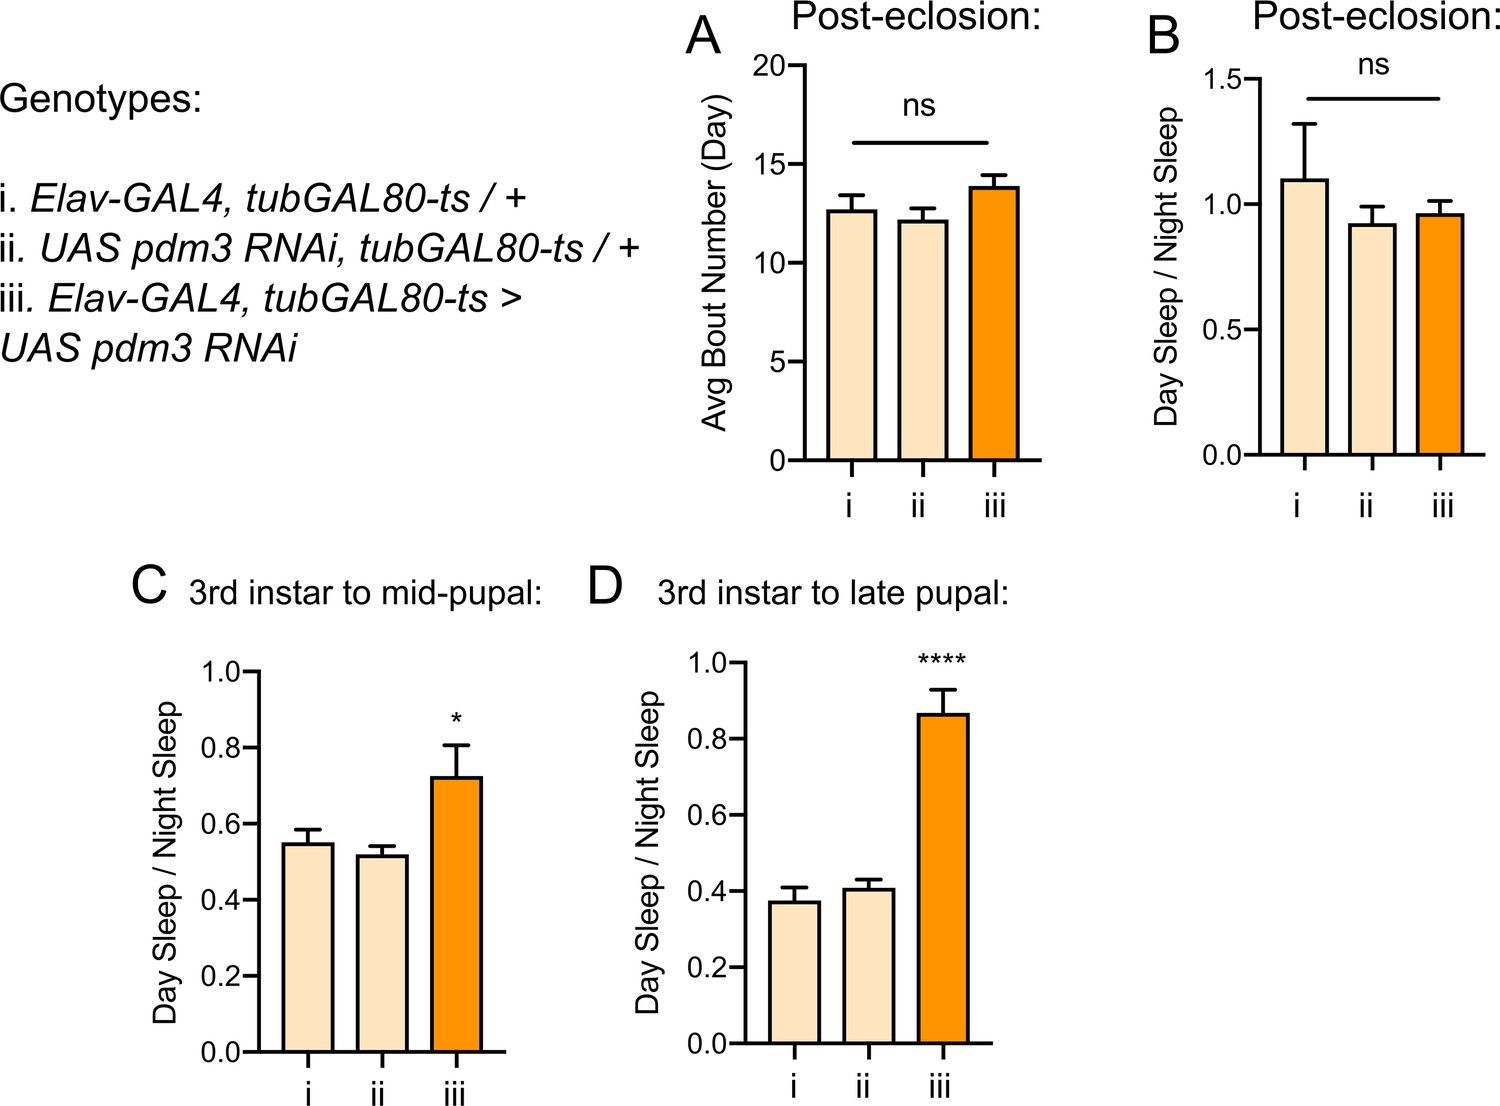
Sleep architecture with temporally-restricted pdm3 knockdown.
(A) Day average sleep bout number with pdm3 knockdown post-eclosion. (B) Ratio of day/night sleep distribution with pdm3 knockdown post-eclosion (n = 50, 60, 70 left to right in A,B). Ratios of day-night sleep distribution with pdm3 knockdown from (C) 3rd instar larval stage to mid-pupal stage and (D) 3rd instar larval stage to late pupal stage (C: n = 32, 31, 32 left to right, D: n = 32, 32, 31 left to right). ****p<0.0001, *p<0.05; ANOVA with Tukey’s test (A–D).
Figure 4 with 2 supplements
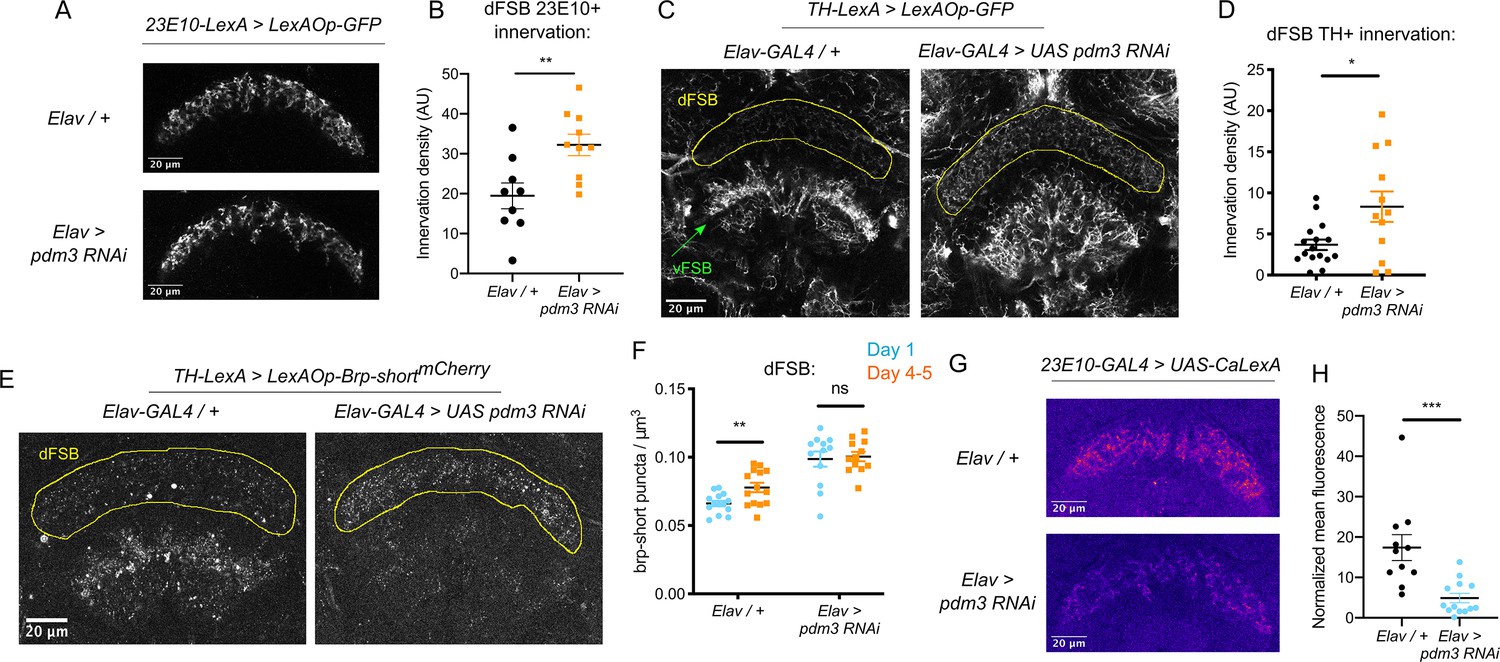
Loss of PDM3 increases inhibitory DA input to the sleep-promoting dFSB.
(A) Projections of 23E10+ dFSB neurons in controls (top) and pdm3 RNAi (bottom). (B) Innervation density of 23E10+ neurites in the adult dFSB (n = 9 controls, 10 pdm3 RNAi). (C) TH+ projections to the FSB in controls (left) and pdm3 RNAi (right). (D) Innervation density of TH+ neurites in the adult dFSB (n = 16 controls, 12 pdm3 RNAi). (E) Labeling of TH+ pre-synaptic sites in the FSB with Brp-shortmCherry. (F) TH+ synapse density in the dFSB in controls (left) and pdm3 RNAi (right) at day 1 and day 4–5 (n = 14, 14, 12, 12 left to right). (G) Pseudocolored CaLexA signal in 23E10+ neurons in day one controls (top) versus pdm3 RNAi (bottom), quantified in (H) (n = 11 controls, 13 pdm3 RNAi). ****p<0.0001, ***p<0.001, **p<0.01, *p<0.05; unpaired two-tailed Student’s t test plus Welch’s correction (B,D,H), multiple Student’s t tests with Holm-Sidak correction, alpha = 0.05 (F).
Figure 4—figure supplement 1
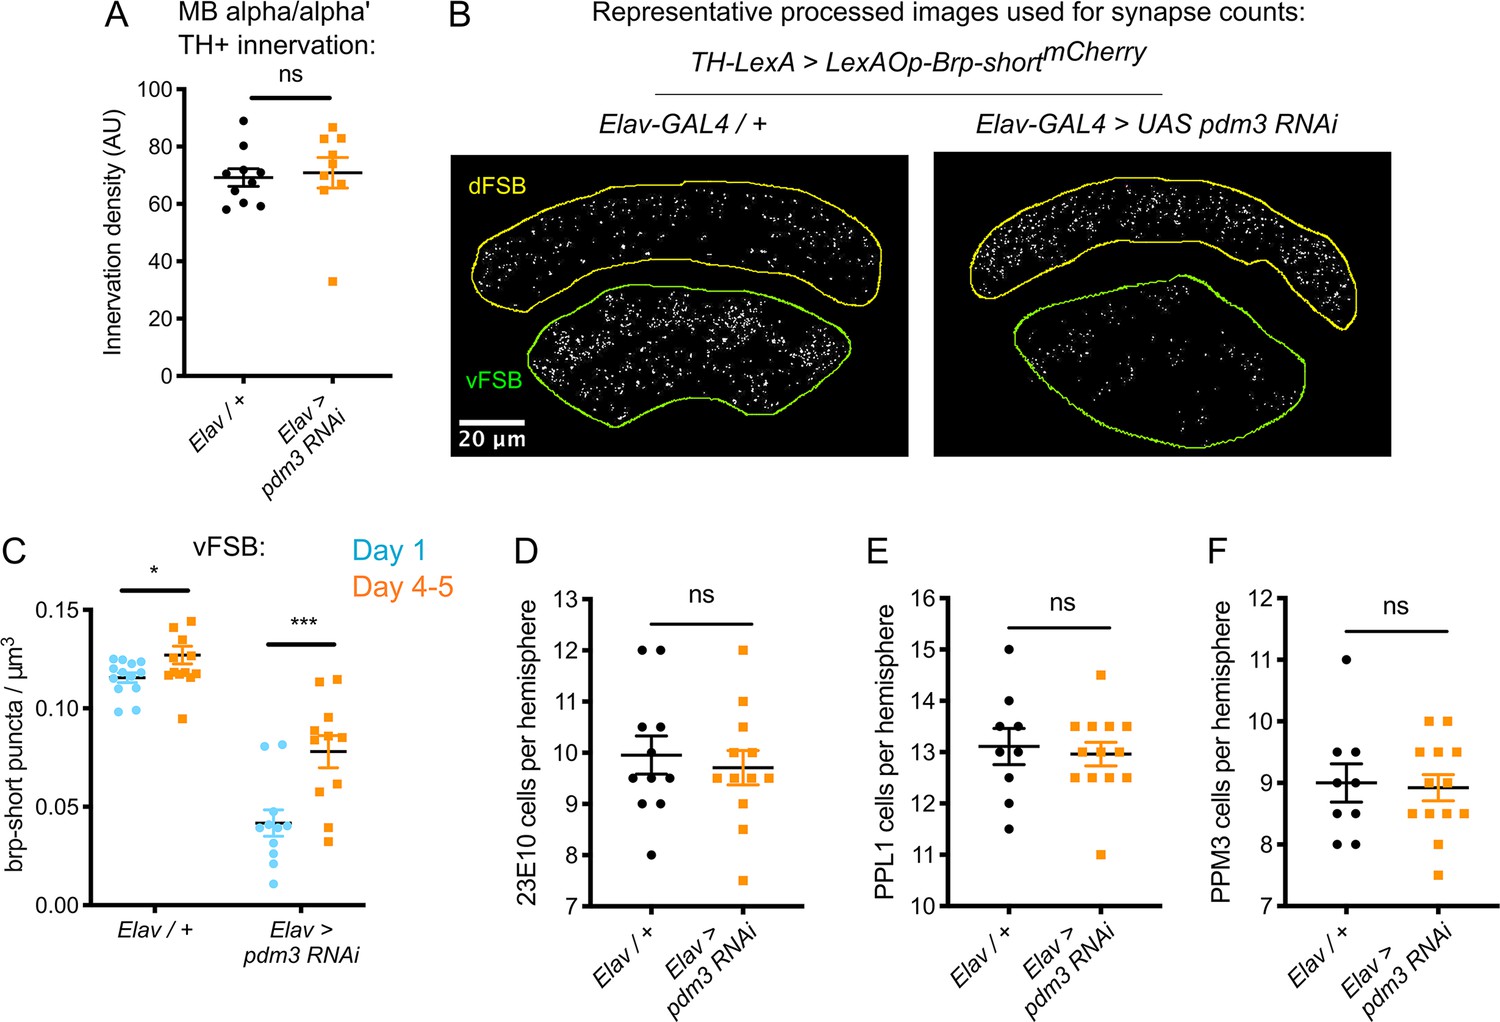
Additional characterization of dopaminergic innervation and cell counts in the setting of pdm3 knockdown.
(A) TH+ innervation in the mushroom body (MB) (n = 10 controls, nine pdm3 RNAi). (B) Representative processed images used for 3D counting of Brp-shortmCherry synaptic puncta. (C) TH+ synapse density in the vFSB at day 1 versus day 4–5 in pdm3 RNAi and controls (n = 14, 14, 12, 12 left to right). (D–F) Numbers of 23E10+ (D), TH+ PPL1 (E) and TH+ PPM3 (F) cells per hemisphere (n = 11 controls, 12 pdm3 RNAi in D, n = 9 controls, 13 pdm3 RNAi in E,F). ****p<0.0001, ***p<0.001, **p<0.01, *p<0.05; unpaired two-tailed Student’s t test plus Welch’s correction (A,D–F), multiple Student’s t tests with Holm-Sidak correction, alpha = 0.05 (C).
Figure 4—figure supplement 2
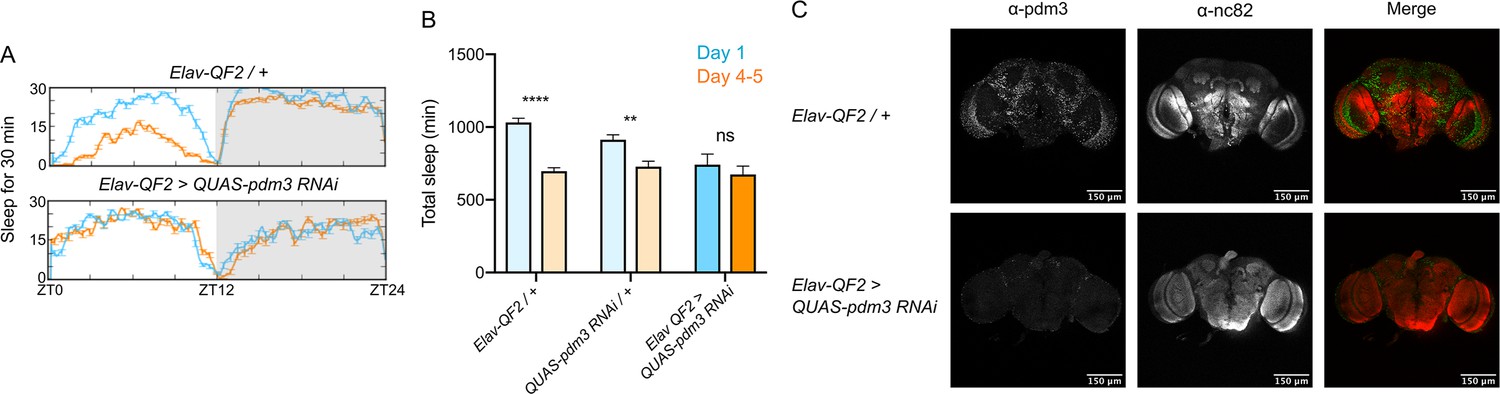
Confirmation of QF2-QUAS system for panneuronal pdm3 knockdown.
(A) Representative sleep trace of controls (top) and pdm3 knockdown using the QF2-QUAS system. (B) Total sleep time with pdm3 RNAi and controls in the QF2-QUAS system at day 1 versus day 4–5 (n = 16, 22, 15, 11, 16, 24 left to right). (C) Anti-PDM3 staining to confirm pdm3 knockdown with Elav-QF2 >QUAS-pdm3 RNAi. ****p<0.0001, **p<0.01; multiple Student’s t tests with Holm-Sidak correction, alpha = 0.05 (B).
Figure 5 with 1 supplement
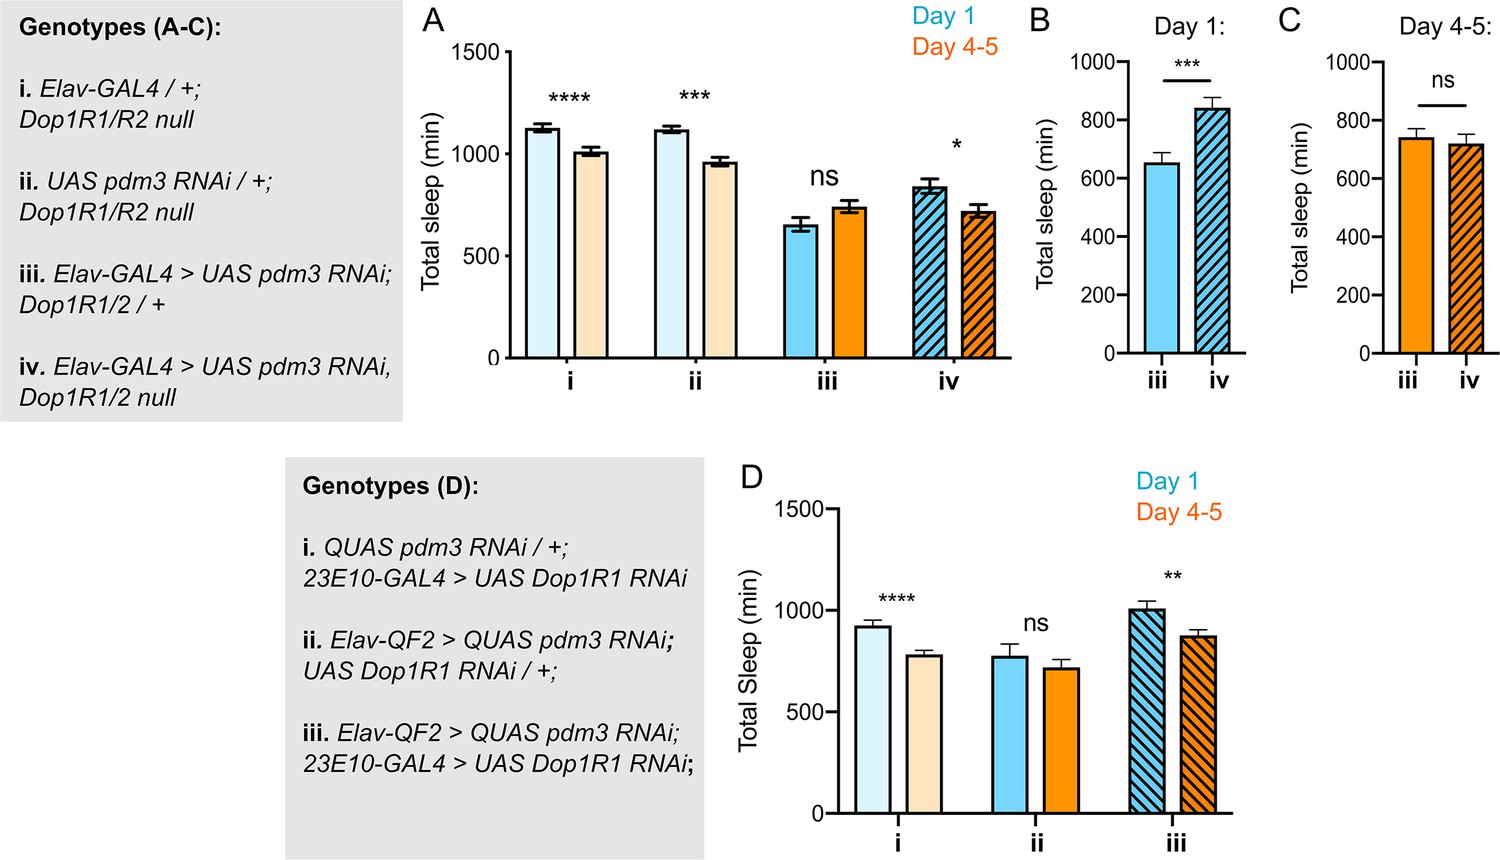
Reducing Dop1R1 signaling restores normal sleep ontogenetic change.
(A) Dop1R1/R2-/- with pdm3 RNAi and controls (n = 55, 92, 72, 96, 58, 97, 45, 75 left to right). Comparison of total sleep amount in Elav-pdm3 RNAi with and without Dop1R1/R2 null mutation in day 1 (B) and day 4–5 (C). (D) Dop1R1 knockdown in 23E10+ neurons in the setting of pan-neuronal pdm3 RNAi and controls (n = 39, 46, 17, 25, 33, 50 left to right). ****p<0.0001, ***p<0.001, **p<0.01, *p<0.05; multiple Student’s t tests with Holm-Sidak correction, alpha = 0.05 (A, D), unpaired two-tailed Student’s t test plus Welch’s correction (B,C).
Figure 5—figure supplement 1
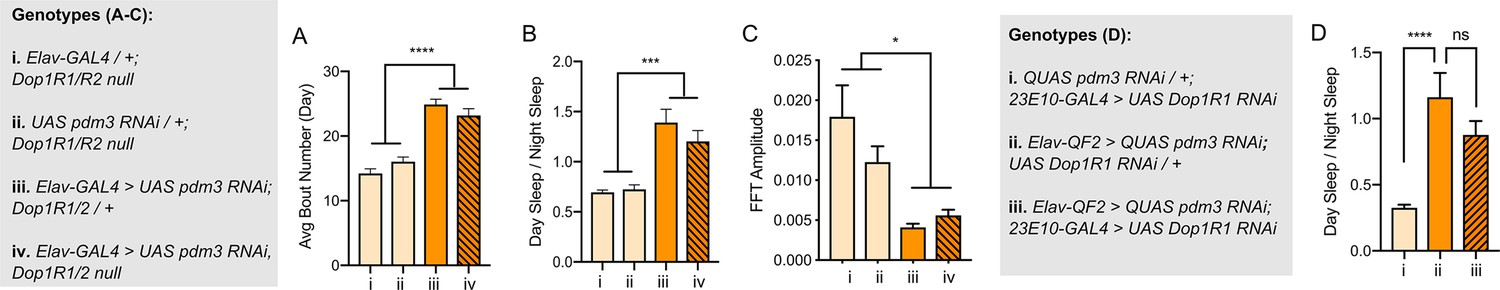
Reducing dopaminergic signaling does not rescue aberrant sleep architecture.
(A–C) Dop1R1/2 null mutation with pdm3 RNAi: (A) day sleep bout number, (B) ratio of day/night sleep, and (C) FFT amplitude are shown in mature flies (n = 92, 96, 97, 75 left to right in A-C). (D) 23E10-GAL4 > Dop1 R1 RNAi in the setting of pan-neuronal pdm3 RNAi: ratio of day/night sleep (n = 52, 33, 51 left to right) ****p<0.0001, ***p<0.001, *p<0.05; ANOVA with Tukey’s test (A–D).
Figure 6 with 2 supplements
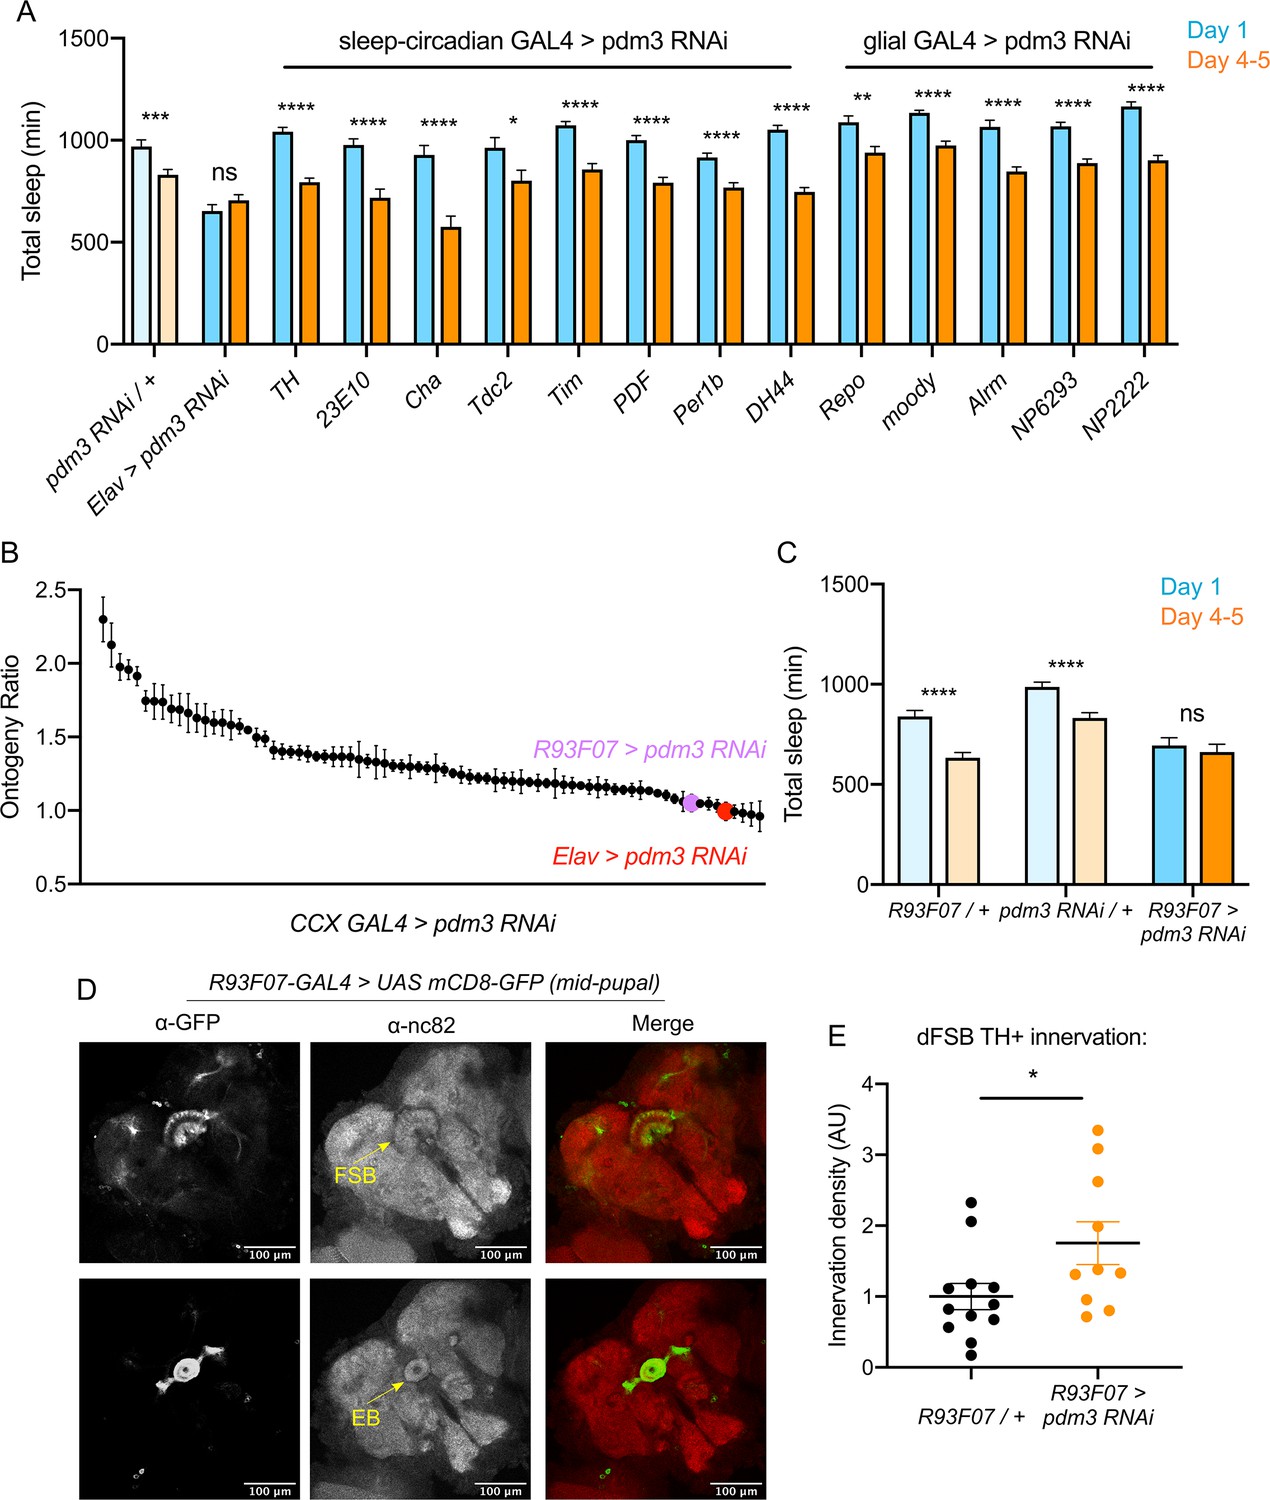
Pdm3 acts in R93F07+ CCX target cells to control sleep ontogeny.
(A) Total sleep time: pdm3 knockdown with spatially restricted GAL4 drivers with expression in sleep/circadian circuitry or glial expression (n ≥ 8 per genotype/age). (B) Spatial mapping screen of FlyLight GAL4 lines with adult CCX expression patterns (n ≥ 8 per genotype/age). (C) Total sleep time in R93F07-GAL4 > UAS pdm3 RNAi versus controls (n = 41, 32, 40, 40, 40, 40 left to right). (D) At the mid-pupal stage, R93F07-GAL4 is expressed in the FSB (top) as well as the ellipsoid body (EB, bottom). (E) Innervation density of TH+ neurites in the adult dFSB (labeled by TH-LexA >LexAOp GFP) with R93F07-GAL4 driving pdm3 RNAi (n = 12 controls, 10 pdm3 RNAi). ****p<0.0001, ***p<0.001, **p<0.01, *p<0.05; multiple Student’s t tests with Holm-Sidak correction, alpha = 0.05 (A, C), unpaired two-tailed Student’s t test plus Welch’s correction (E).
Figure 6—figure supplement 1
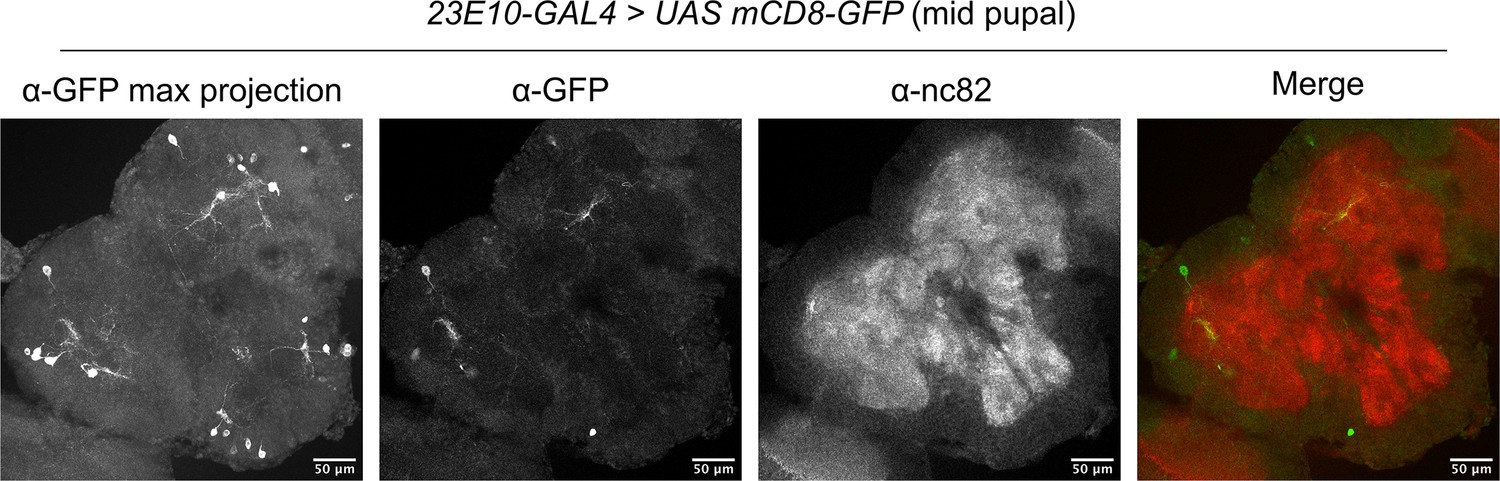
Expression pattern of 23E10-GAL4 in the mid-pupal brain.
Figure 6—figure supplement 2
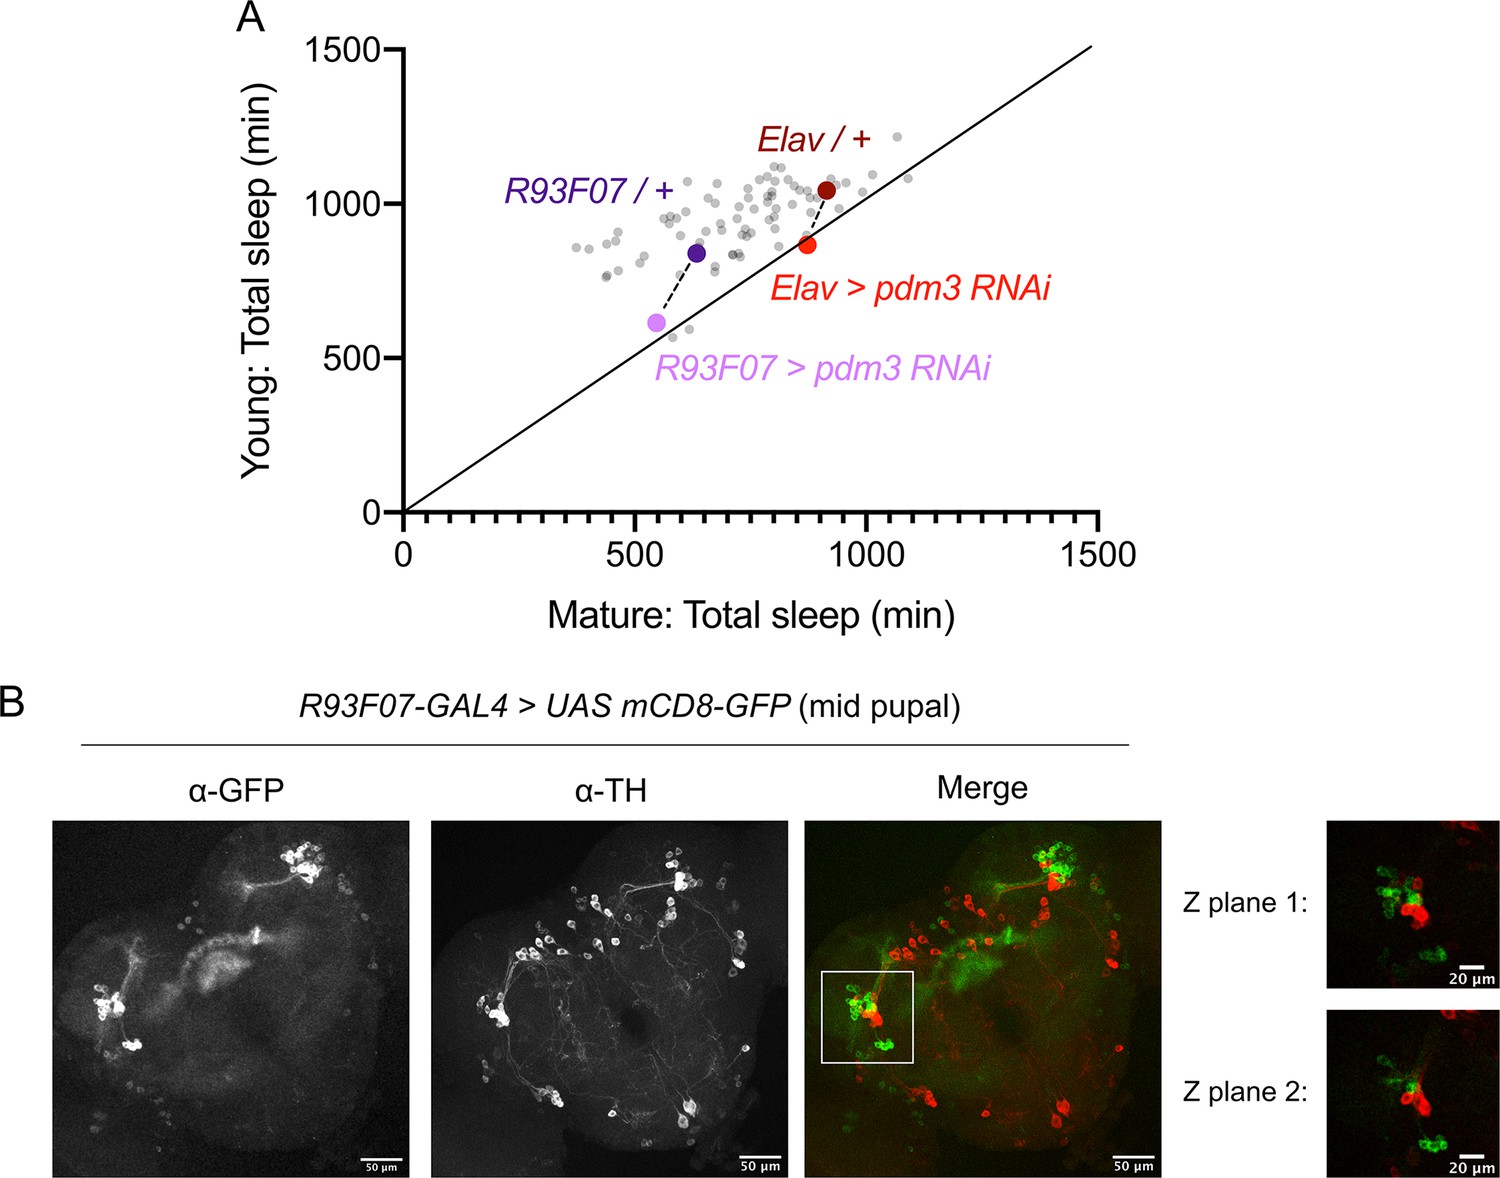
Sleep amounts from spatial mapping screen identifying R93F07+ cells.
(A) Spatial mapping screen of FlyLight CCX-expressing GAL74 lines, plotted as total sleep time in young versus mature flies of each genotype (n ≥ 8 per genotype/age). Compared to genetic controls (darker dots), Elav or R93F07 GAL4 >pdm3 RNAi (lighter dots) results in young and mature flies having the same amount of sleep. Relationship between genetic controls and pdm3 RNAi is shown by the dotted lines. Co-labeling of TH+ neurons (labeled by anti-TH) and R93F07+ neurons (labeled by anti-GFP). (B) R93F07+ cells are not dopaminergic. While the merged Z-stack shows some apparent overlap in TH+ and R93F07-GFP signal, this stems from overlap of Z planes rather than true co-labeling.
Figure 7
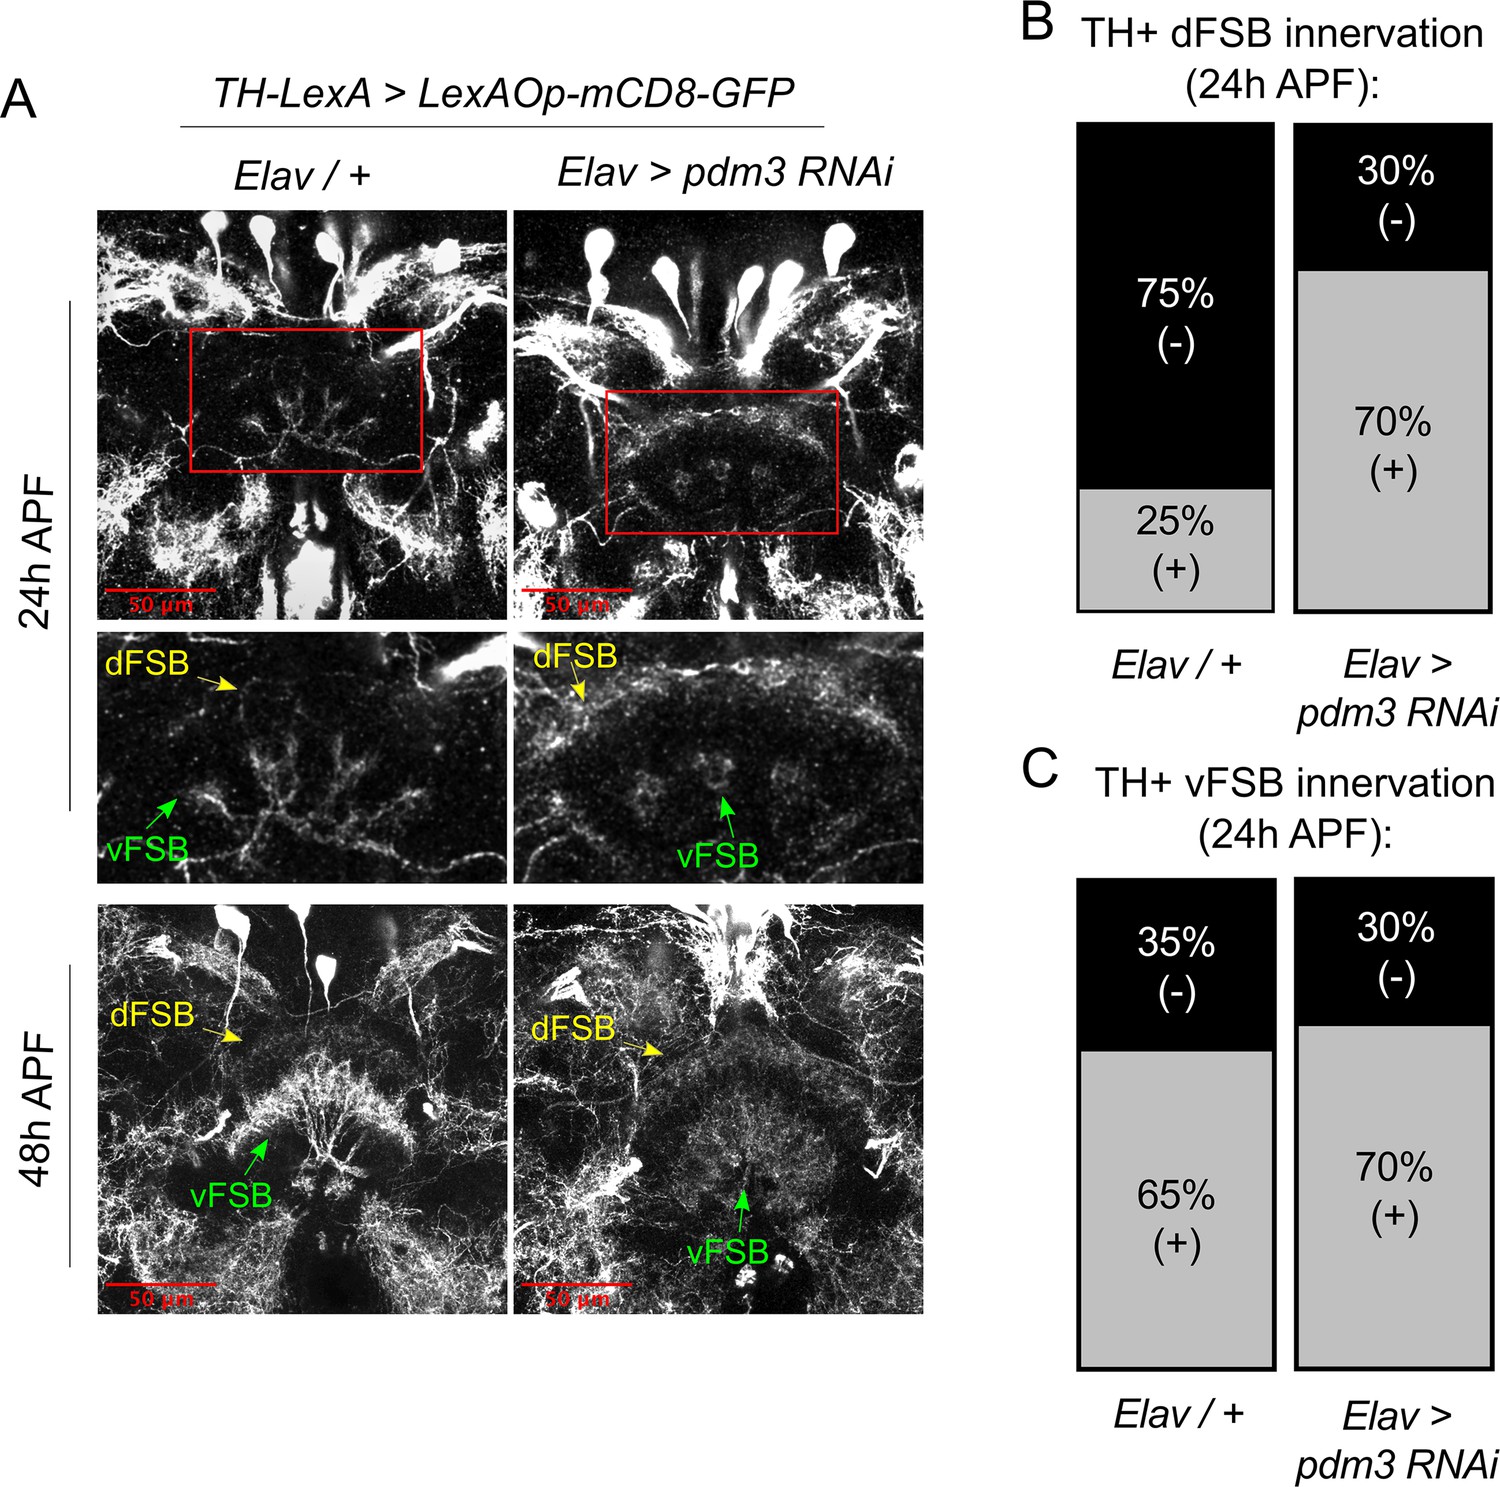
Pdm3 controls TH+ dFSB innervation during pupation.
(A) TH+ innervation in the FSB at 24 hr after puparium formation (APF) (top) and 48 hr APF (bottom). (B,C) Percentage of brains with TH+ innervation in the dFSB (B) or vFSB (C) at 24 hr APF (gray = positive for innervation, black = negative; n = 10 controls, 10 pdm3 RNAi).
Figure 8 with 3 supplements
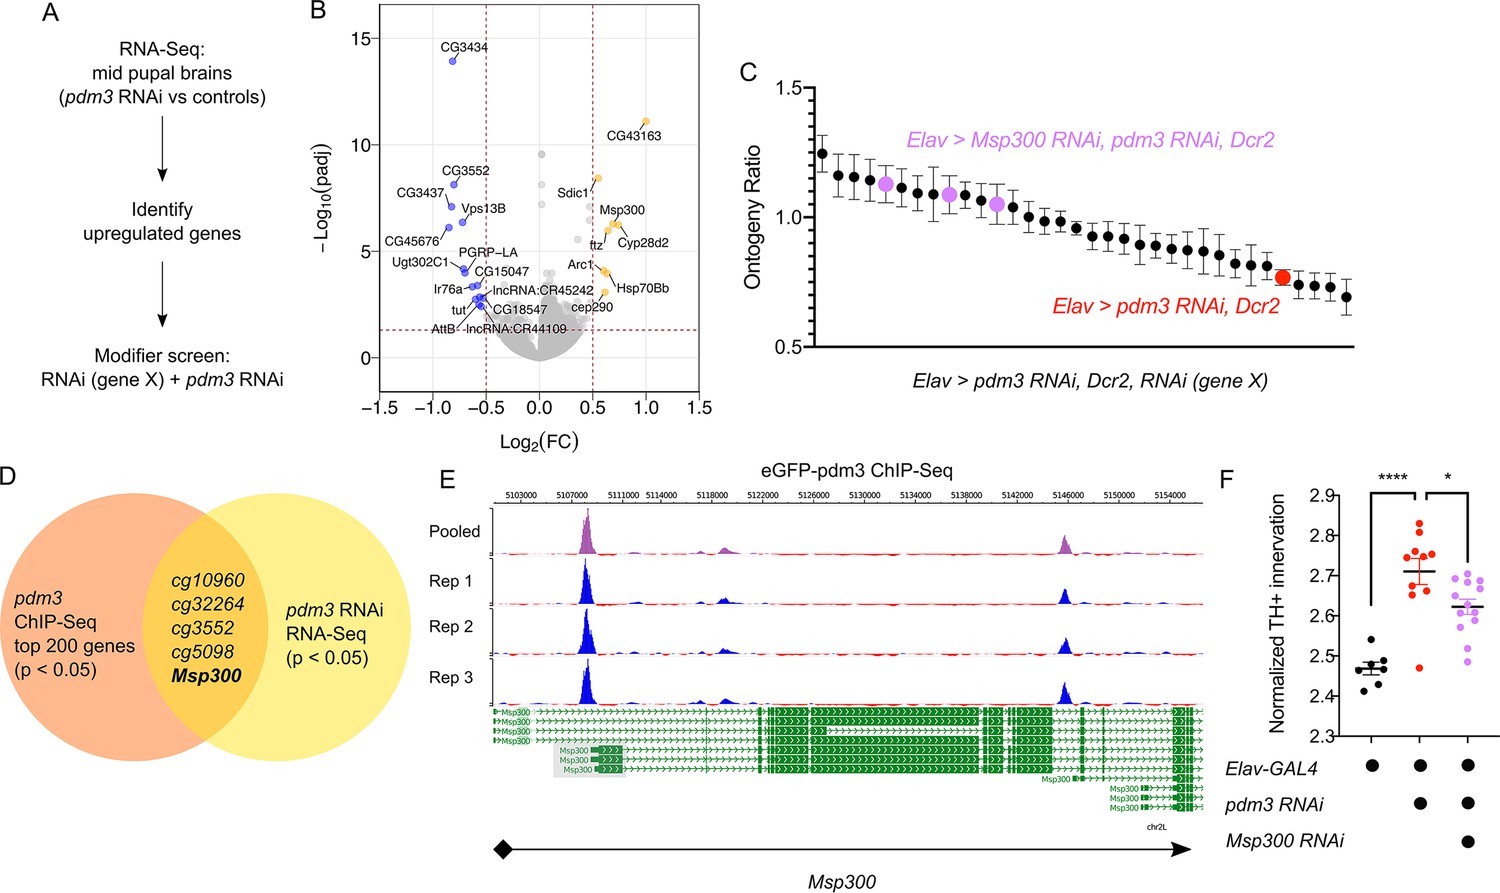
Pdm3 controls expression of the synaptic gene Msp300 to regulate sleep ontogeny.
(A) Scheme of RNA-Seq and subsequent modifier screen. (B) Volcano plot of RNA-Seq data highlighting significant changes in gene expression with pdm3 knockdown compared to controls in mid-pupal brains. Labeled genes have −log10(padj) >1.3 and absolute value of log2(Fold Change)>0.5. Yellow = increased expression, blue = decreased expression upon pdm3 knockdown (n = 4 biological replicates per genotype, 40 brains per replicate for RNA-Seq). (C) Modifier screen with co-expression of RNAi targeting upregulated genes from RNA-Seq alongside pdm3 RNAi (n ≥ 16 per genotype/age). (D) Overlap of hits from RNA-Seq and pdm3 ENCODE ChIP-Seq experiments. (E) Control-normalized peaks of PDM3 binding within the Msp300 gene. The strongest binding peak occurs upstream of the first exon in the RD, RL and RB transcript isoforms (shaded gray box). (F) Quantification of TH+ staining in the dFSB with Msp300 RNAi and pdm3 RNAi (n = 7, 10, 13 left to right). RNA-Seq statistical analysis is detailed in Materials and methods. ****p<0.0001, *p<0.05; ANOVA with Tukey’s test (F).
Figure 8—figure supplement 1
Confirmation of PDM3 protein reduction at the mid-pupal developmental timepoint used for RNA-Seq experiments.
Figure 8—figure supplement 2
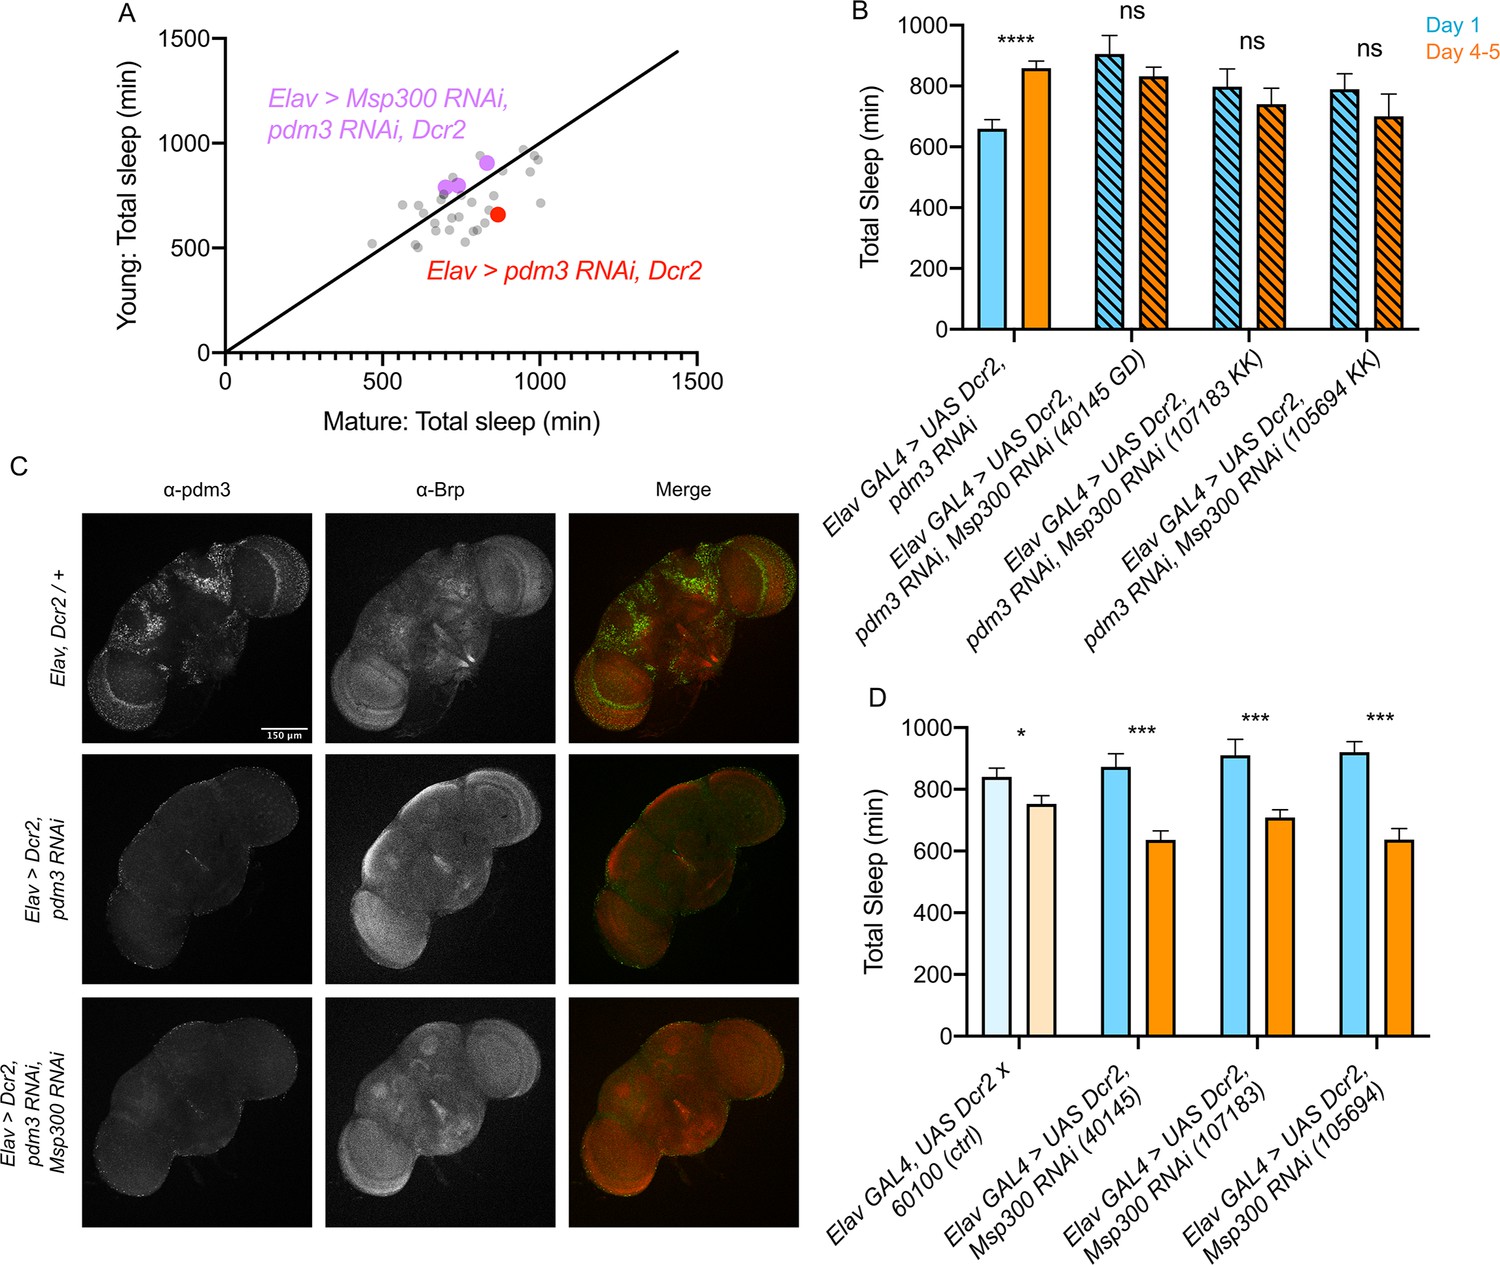
Additional modifier screen data and further characterization of Msp300 phenotype.
(A) Modifier screen with co-expression of RNAi targeting upregulated genes from RNA-Seq alongside pdm3 RNAi, plotted as total sleep time in young versus mature flies of each genotype (n ≥ 16 per genotype/age). Overlaid identity line represents young = mature total sleep time. (B) Total sleep time in Elav-pdm3 RNAi with co-expression of Msp300 RNAi (n = 32, 40, 14, 38, 14, 42, 26, 24 left to right). (C) Confirmation of PDM3 protein reduction with co-expression of Msp300 RNAi line with strongest effect on modifying sleep ontogeny (VDRC #105694). (D) Total sleep time with Elav >Msp300 RNAi only (n = 14, 27, 10, 24, 12, 24, 12, 24 left to right). ****p<0.0001, ***p<0.001, *p<0.05; multiple Student’s t tests with Holm-Sidak correction, alpha = 0.05 (B,D).
Figure 8—figure supplement 3
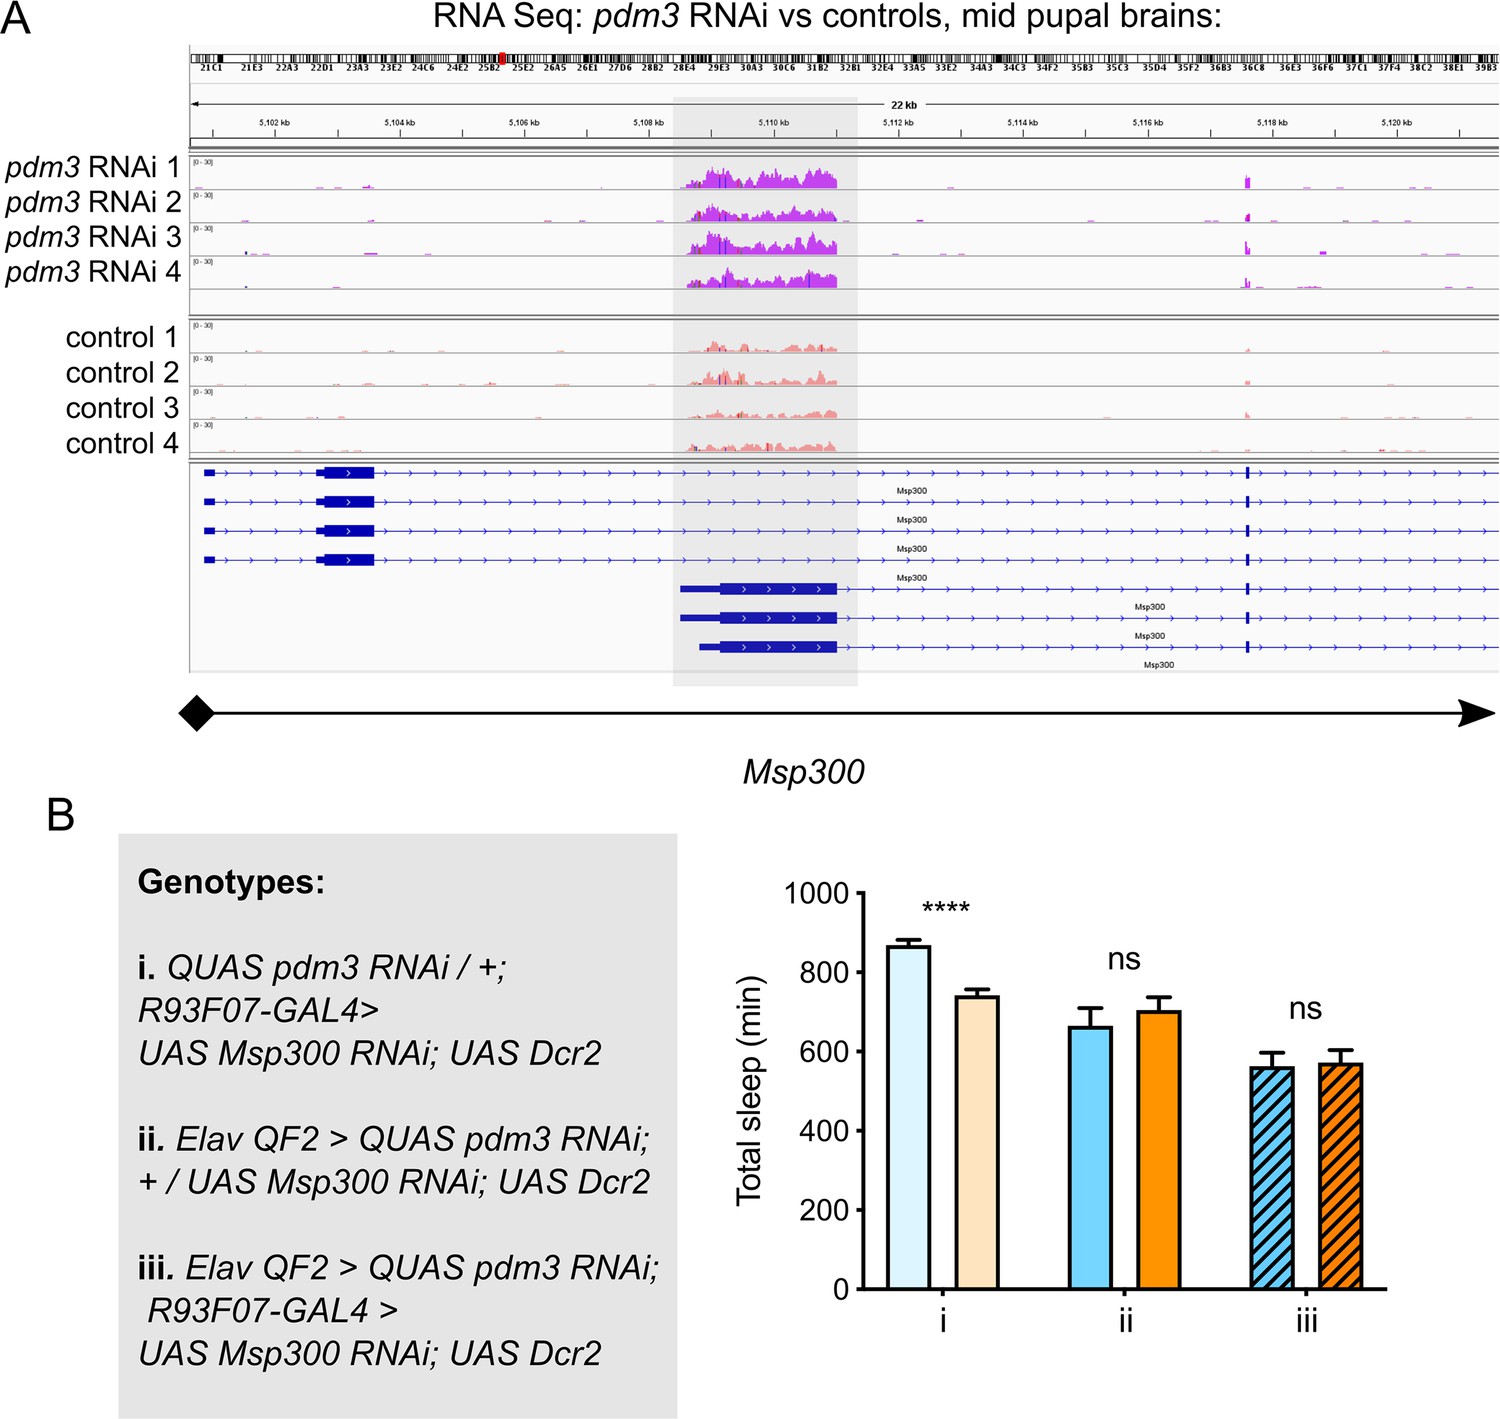
Molecular and cellular interactions between Msp300 and PDM3.
(A) Visualization of reads from RNA-Seq in pdm3 RNAi (top, dark pink) versus controls (bottom, light pink), indicating a greater read pileup in pdm3 RNAi in the first exon common to Msp300 isoforms RD, RL and RB (gray box). (B) Msp300 knockdown in R93F07+ neurons in the setting of pan-neuronal pdm3 RNAi and controls (n = 90, 52, 31, 49, 56, 53 left to right). ****p<0.0001; multiple Student’s t tests with Holm-Sidak correction, alpha = 0.05.
Tables
Key resources table
| Reagent type (species) or resource | Designation | Source or reference | Identifiers | Additional information |
|---|---|---|---|---|
| Gene Drosophila melanogaster | pdm3 | FBgn0261588 | ||
| Gene Drosophila melanogaster | Msp300 | FBgn0261836 | ||
| Genetic reagent (D. melanogaster) | hs-hid; Elav-GAL4; UAS Dcr2 | Dragana Rogulja | ||
| Genetic reagent (D. melanogaster) | UAS-pdm3 RNAi | BloomingtonDrosophilaStock Center | BSC #53887, TRiP HMJ21205 | |
| Genetic reagent (D. melanogaster) | UAS-pdm3 RNAi | ViennaDrosophilaResource Center | VDRC #30538, Construct ID 4312 | |
| Genetic reagent (D. melanogaster) | ElavC155-GAL4 | Amita Sehgal | ||
| Genetic reagent (D. melanogaster) | UAS-mCD8-GFP | BloomingtonDrosophilaStock Center | ||
| Genetic reagent (D. melanogaster) | UAS-pdm3-short | John Carlson | ||
| Genetic reagent (D. melanogaster) | tubGAL80-ts | BloomingtonDrosophilaStock Center | BSC #7017 | |
| Genetic reagent (D. melanogaster) | R23E10-LexA | BloomingtonDrosophilaStock Center | BSC #52693 | |
| Genetic reagent (D. melanogaster) | TH-LexA | Ronald Davis | ||
| Genetic reagent (D. melanogaster) | LexAOp-GFP | BloomingtonDrosophilaStock Center | BSC #32203 | |
| Genetic reagent (D. melanogaster) | LexAOp-Brp-short-mCherry | Takashi Suzuki | ||
| Genetic reagent (D. melanogaster) | 23E10-GAL4 | BloomingtonDrosophilaStock Center | BSC #49032 | |
| Genetic reagent (D. melanogaster) | UAS-CaLexA | J. Wang | ||
| Genetic reagent (D. melanogaster) | ElavC155-QF2 | BloomingtonDrosophilaStock Center | BSC #66466 | |
| Genetic reagent (D. melanogaster) | QUAS-pdm3 RNAi | This study | Figure 4—figure supplement 2; available upon request | |
| Genetic reagent (D. melanogaster) | Dop1R1[attp] | Krystyna Keleman | ||
| Genetic reagent (D. melanogaster) | UAS-Dcr2 | BloomingtonDrosophilaStock Center | BSC #24651 | |
| Genetic reagent (D. melanogaster) | UAS-Msp300 RNAi | ViennaDrosophilaResource Center | VDRC #105694 | |
| Genetic reagent (D. melanogaster) | UAS-Msp300 RNAi | ViennaDrosophilaResource Center | VDRC #109023 | |
| Genetic reagent (D. melanogaster) | UAS-Msp300 RNAi | ViennaDrosophilaResource Center | VDRC #107183 | |
| Antibody | anti-PDM3 (Guinea pig polyclonal) | Cheng-Ting Chien | 1:500 | |
| Antibody | anti-GFP (Mouse monoclonal) | Sigma | Cat# G6539-200UL | 1:500 |
| Antibody | anti-GFP (Rabbit polyclonal) | Fisher | Cat# A11122 | 1:500 |
| Antibody | anti-PER (Guinea pig polyclonal) | Amita Sehgal | 1:1000 | |
| Antibody | anti-PDF C7 (Mouse monoclonal) | Developmental Studies Hybridoma Bank | 1:500 | |
| Antibody | anti-nc82 (Brp) (Mouse monoclonal) | Developmental Studies Hybridoma Bank | 1:100 | |
| Antibody | Alexa Fluor 488 Donkey anti-Rabbit | Thermo Fisher | 1:1000 | |
| Antibody | Alexa Fluor 555 Donkey anti-GP | Thermo Fisher | 1:1000 | |
| Antibody | Alexa Fluor 488 Donkey anti-Mouse | Thermo Fisher | 1:1000 | |
| Antibody | Alexa Fluor 647 Donkey anti-Mouse | Thermo Fisher | 1:1000 | |
| Recombinant DNA reagent | QUAS-WALIUM20 (vector) | Jonathan Zirin, Fly Transgenic RNAi Project | ||
| Sequence-based reagent | HMJ21205 pdm3 RNAi hairpin | Synthesized in this study, sequence from TRiP database | ||
| Restriction enzyme | NheI | New England Biolabs | Cat. #: R3131S | |
| Restriction enzyme | EcoRI | New England Biolabs | Cat # R3101L | |
| Commercial assay or kit | Plasmid Midi Kit | Qiagen | Cat # 12143 | |
| Software, algorithm | Prism 8 | Prism |
Additional files
-
Supplementary file 1
Top gene expression changes (p-adj <0.05 and Fold Change > 1.2) from RNA-Seq analysis of mid-pupal brains in Elav-GAL4 >pdm3 RNAi and controls.
- https://cdn.elifesciences.org/articles/52676/elife-52676-supp1-v2.xlsx
-
Transparent reporting form
- https://cdn.elifesciences.org/articles/52676/elife-52676-transrepform-v2.pdf
Download links
A two-part list of links to download the article, or parts of the article, in various formats.
Downloads (link to download the article as PDF)
Open citations (links to open the citations from this article in various online reference manager services)
Cite this article (links to download the citations from this article in formats compatible with various reference manager tools)
Identification of a molecular basis for the juvenile sleep state
eLife 9:e52676.
https://doi.org/10.7554/eLife.52676


