Brain aging comprises many modes of structural and functional change with distinct genetic and biophysical associations
- Wellcome Centre for Integrative Neuroimaging (WIN FMRIB), University of Oxford, United Kingdom
- Department of Statistics and Actuarial Science, Simon Fraser University, Canada
- Big Data Institute, University of Oxford, United Kingdom
Figures
Figure 1 with 10 supplements
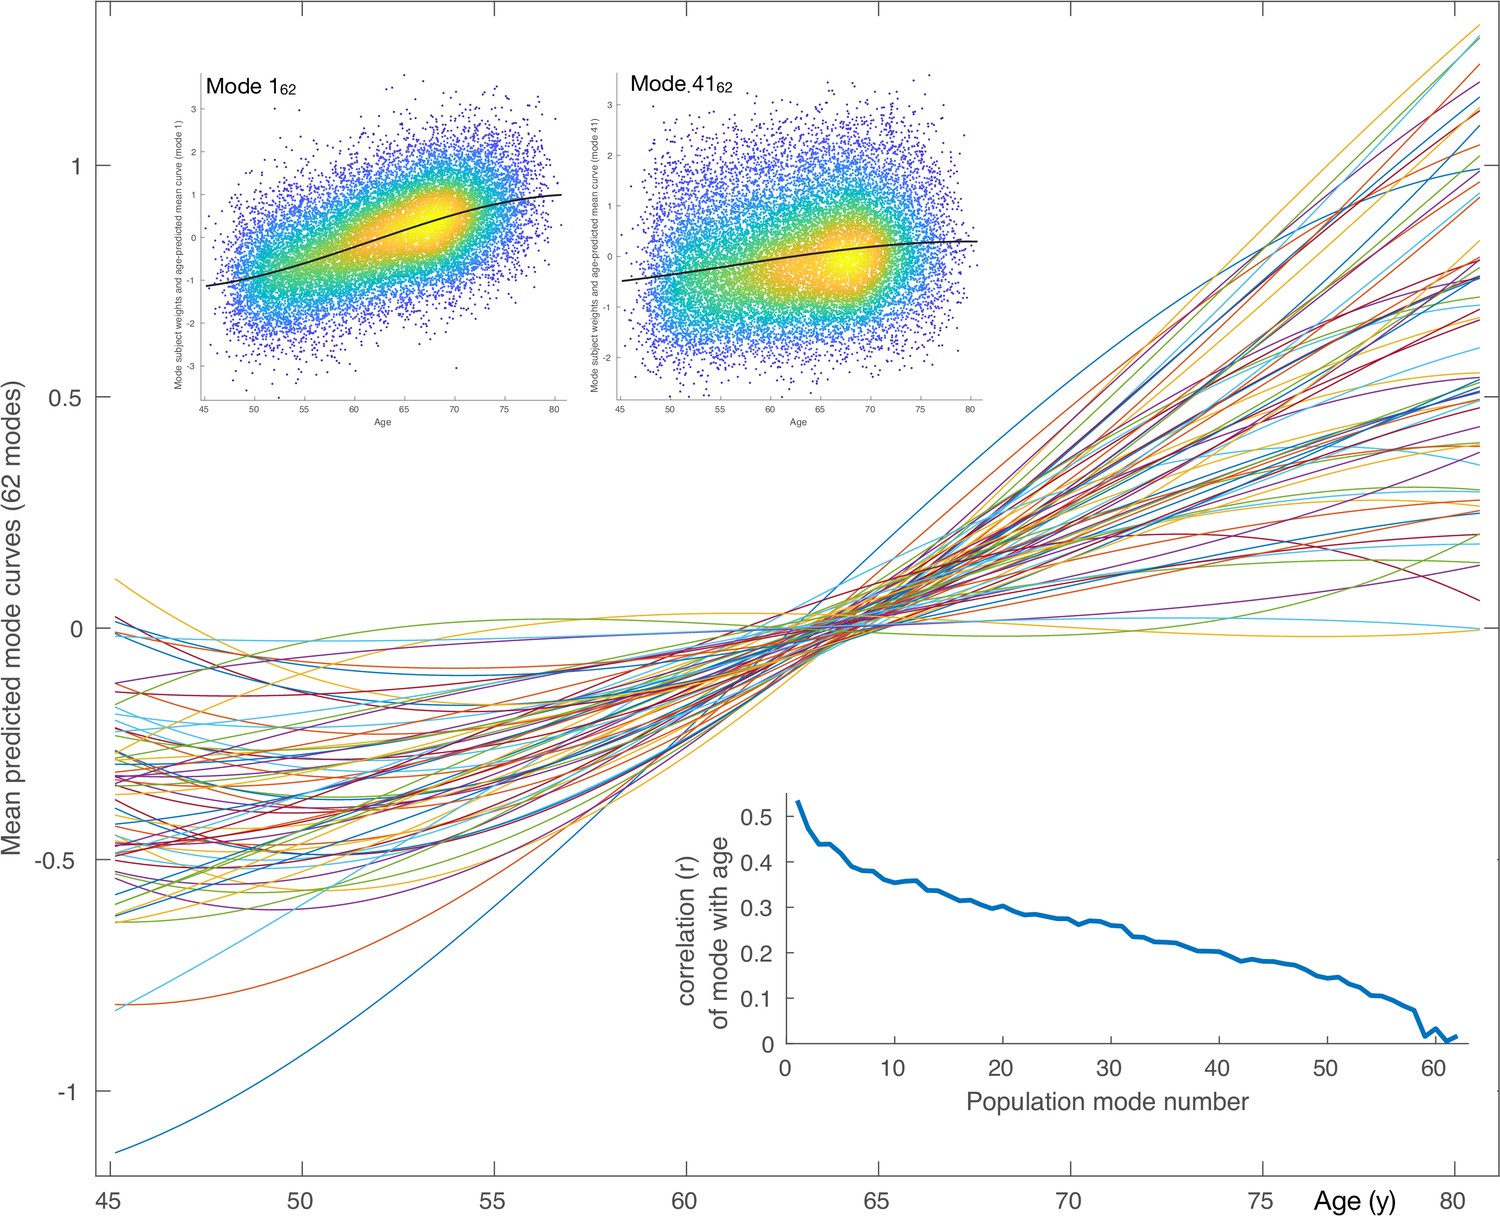
Mean aging curves for the 62 brain-aging modes.
The main plot shows the mean aging curves based on a cubic age model - that is, fitting the subject-weight-vectors from each mode as a function of age, age-squared and age-cubed. Therefore, the x axis is age in years, and the y axis is the unitless values in the original modes’ subject-weight-vectors . The scatter plots show two example modes, with their respective mean aging curves shown along with the full data (the modes’ subject weights, with a single point for each subject). The inset blue plot shows the strength of age prediction for all modes, quantified simply as correlation of actual age with mode subject-weights.
Figure 1—figure supplement 1

Hierarchical clustering of the 62 brain-aging modes, and their mapping onto six lower-dimensional mode-clusters.
(A) Hierarchical clustering carried out on the basis of the absolute values of the correlations (of subject-weights) between modes (shown below the diagonal). The same correlation values, but with negatives shown in blue, are shown above the diagonal. Arrows show approximate correspondence between hierarchical clusters and low-dimensional mode-clusters (with mode 162 appearing to a reasonable extent in mode-clusters 16 and 26). (B) The precise mapping between 62 modes and 6 mode-clusters, quantified by correlating subject-weight-vectors between the two. (C) The 6 mode-cluster mean aging curves.
Figure 1—figure supplement 2
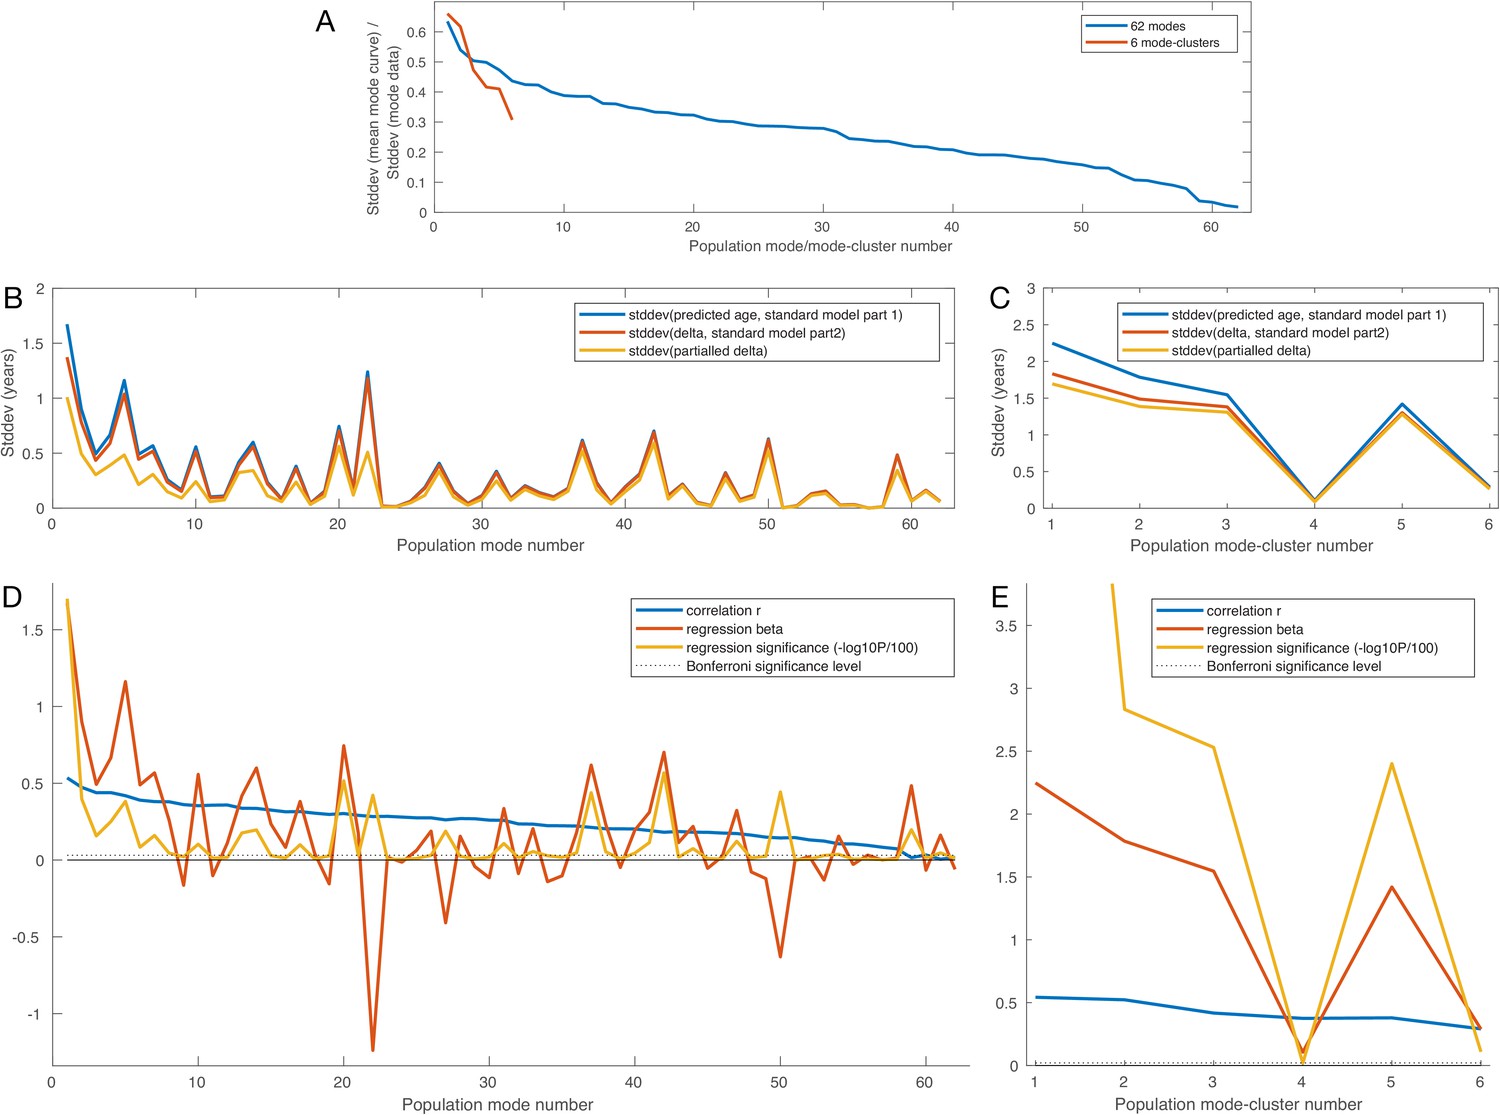
Model standard deviations, age correlations and age regressions for all modes and mode-clusters.
See Materials and methods for details. Units for the y axes in D,E are not marked, as they are different for the different curves, and made clear for each curve in the figure legends.
Figure 1—figure supplement 3
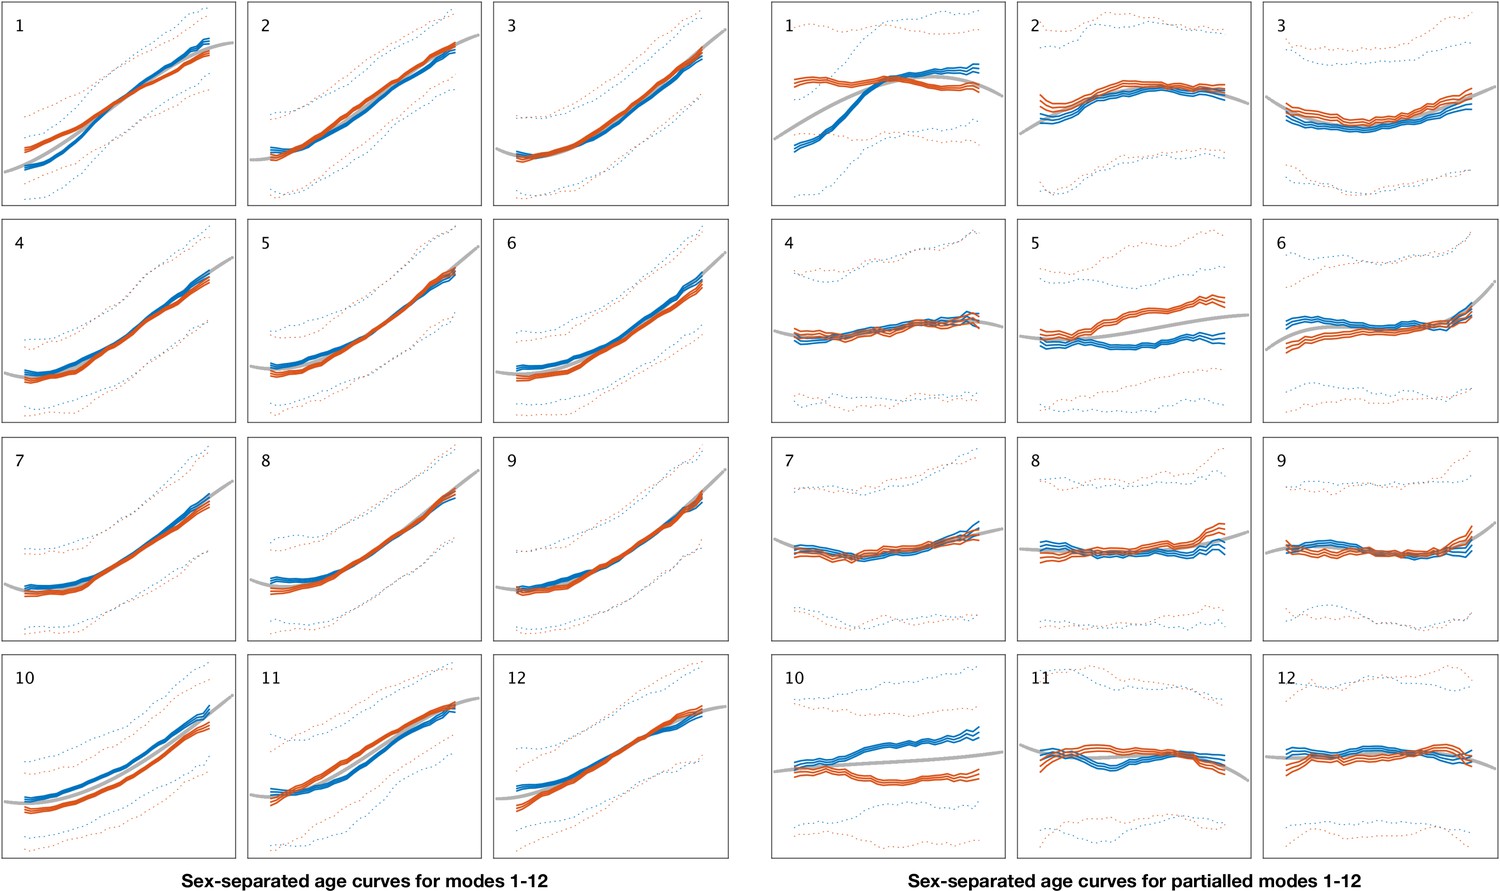
Sex-separated mean age curves for modes 1–12.
Left: Mean curves for modes 1–12, from the original subject-weight-vector mode values. The solid grey curve is the fitted age curve using the cubic age model (all subjects combined, see Materials and methods). The blue curves show the females-only sliding-window mean age curve (see Materials and methods); the central line is the mean, and the two outer solid lines show the standard error for the mean. The dotted lines show the 25th and 75th percentiles of the data. Orange curves show the same quantities for males. For clarity, axes are not annotated; in all cases, the x-axis is age (from 45-81y), and the y-axis is the unitless subject-weight-vector values. Right: The same plots are shown for the partialled subject-weight-vectors (the original subject-weights after regressing out all other modes).
Figure 1—figure supplement 4

Sex-separated mean age curves for modes 13–24.
See Figure 1—figure supplement 3 for details.
Figure 1—figure supplement 5
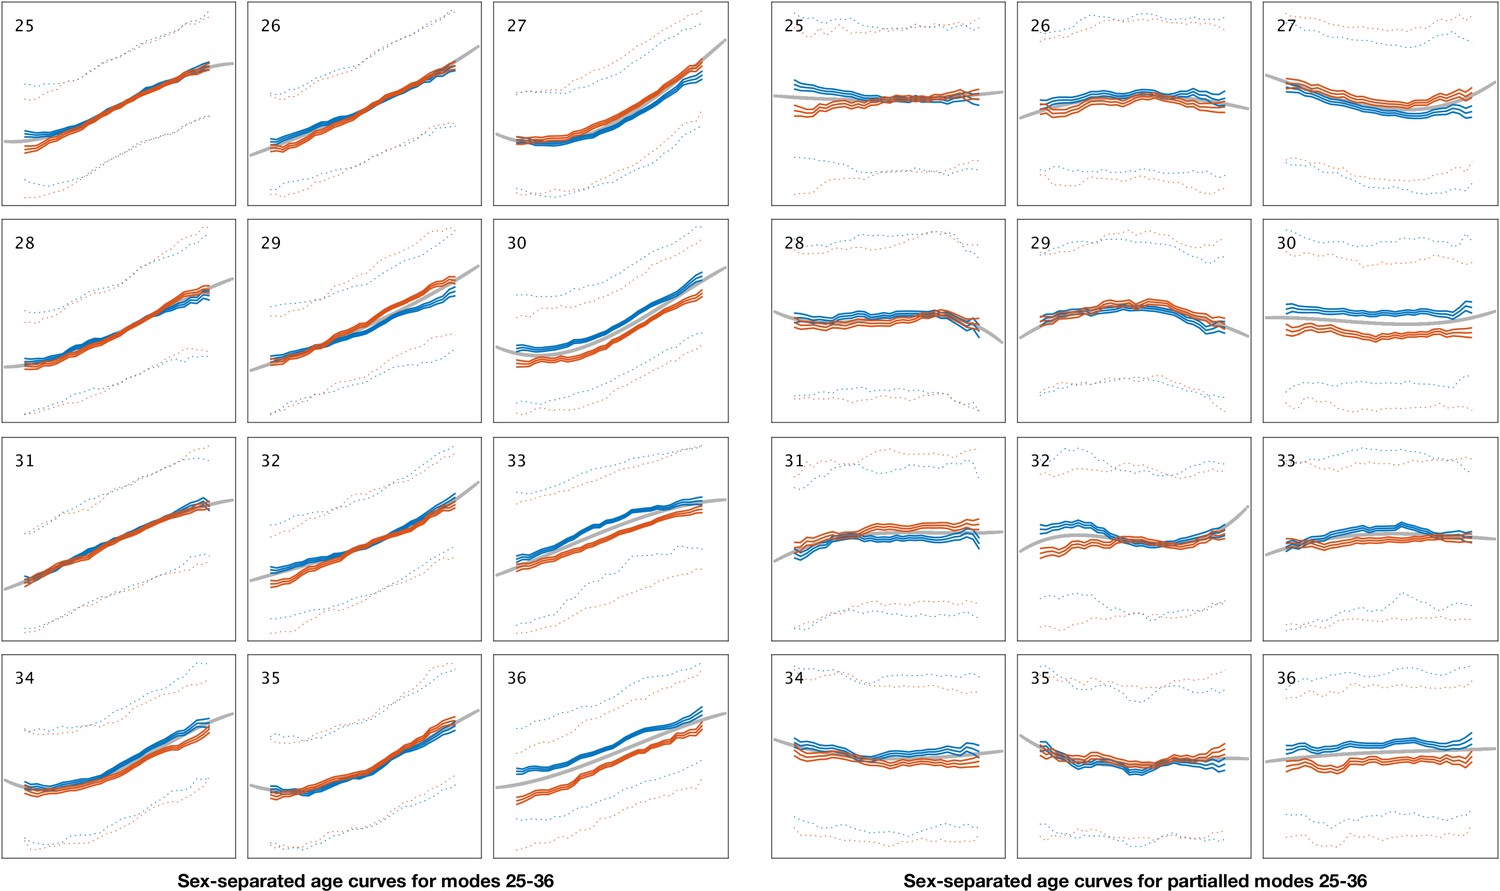
Sex-separated mean age curves for modes 25–36.
See Figure 1—figure supplement 3 for details.
Figure 1—figure supplement 6
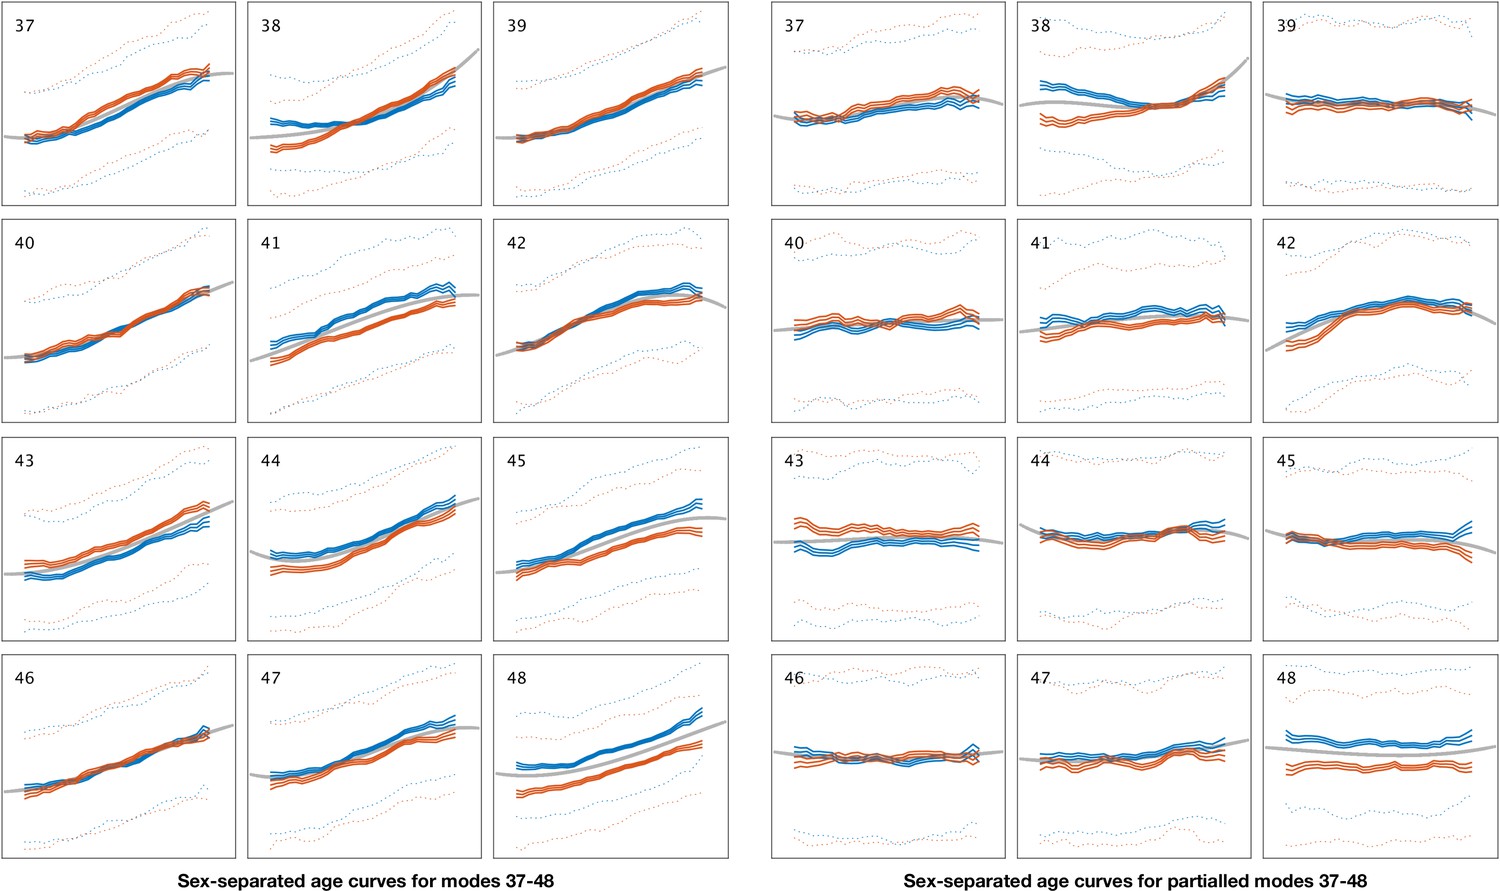
Sex-separated mean age curves for modes 37–48.
See Figure 1—figure supplement 3 for details.
Figure 1—figure supplement 7
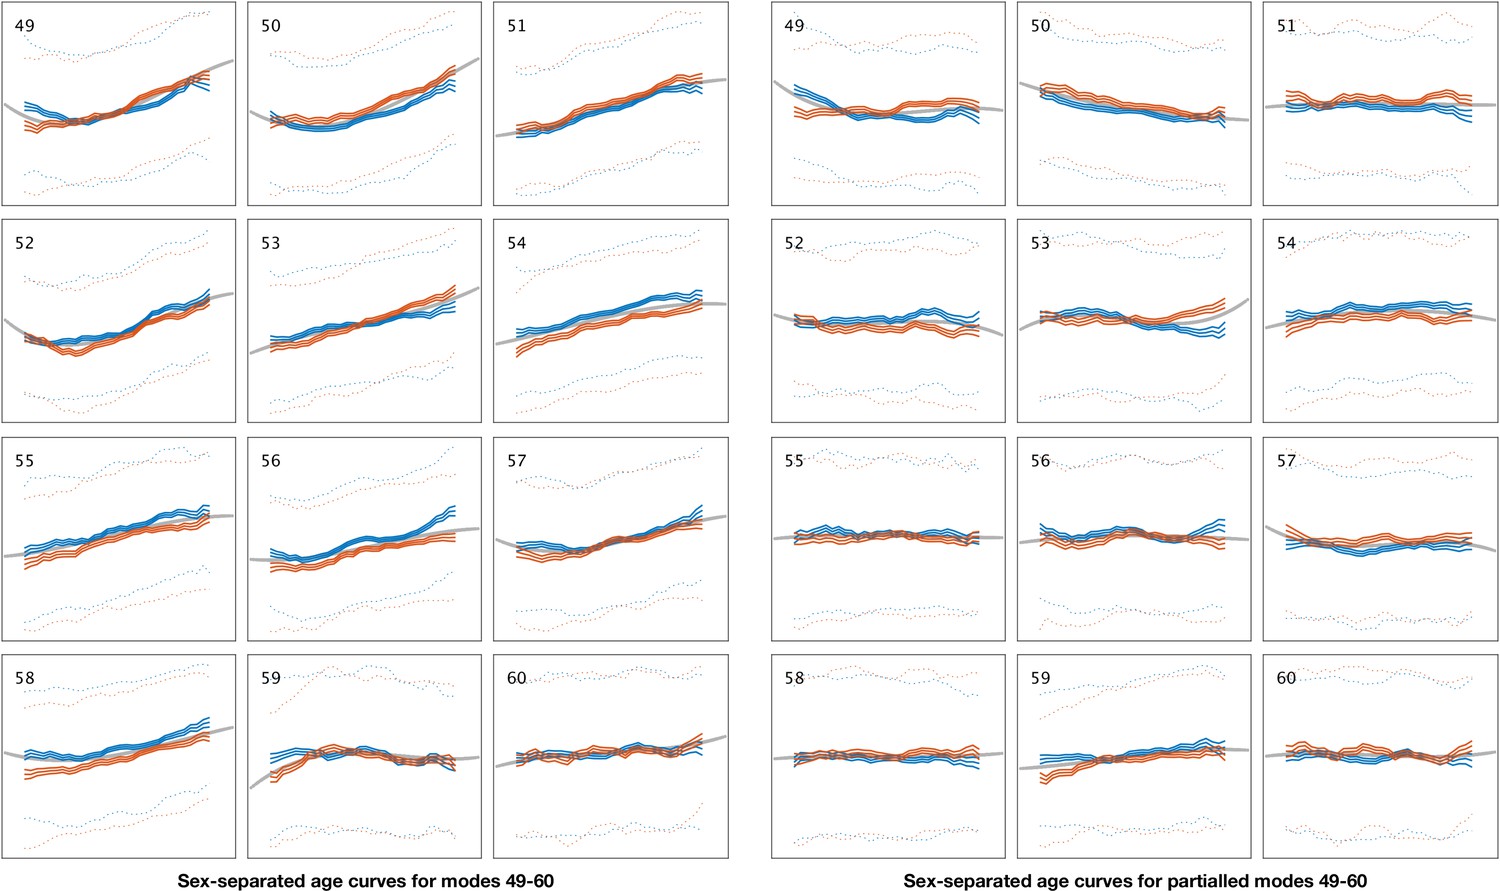
Sex-separated mean age curves for modes 49–60.
See Figure 1—figure supplement 3 for details.
Figure 1—figure supplement 8
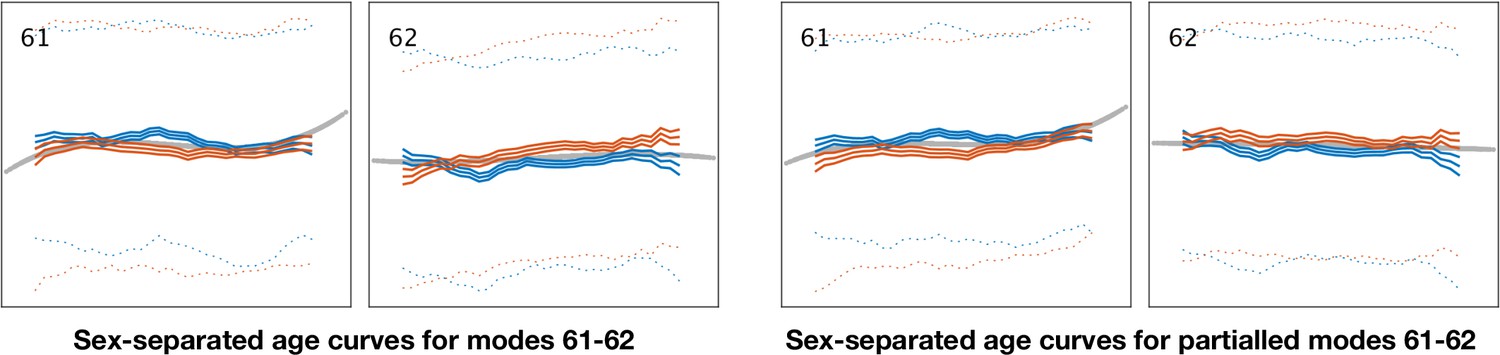
Sex-separated mean age curves for modes 61–62.
See Figure 1—figure supplement 3 for details.
Figure 1—figure supplement 9
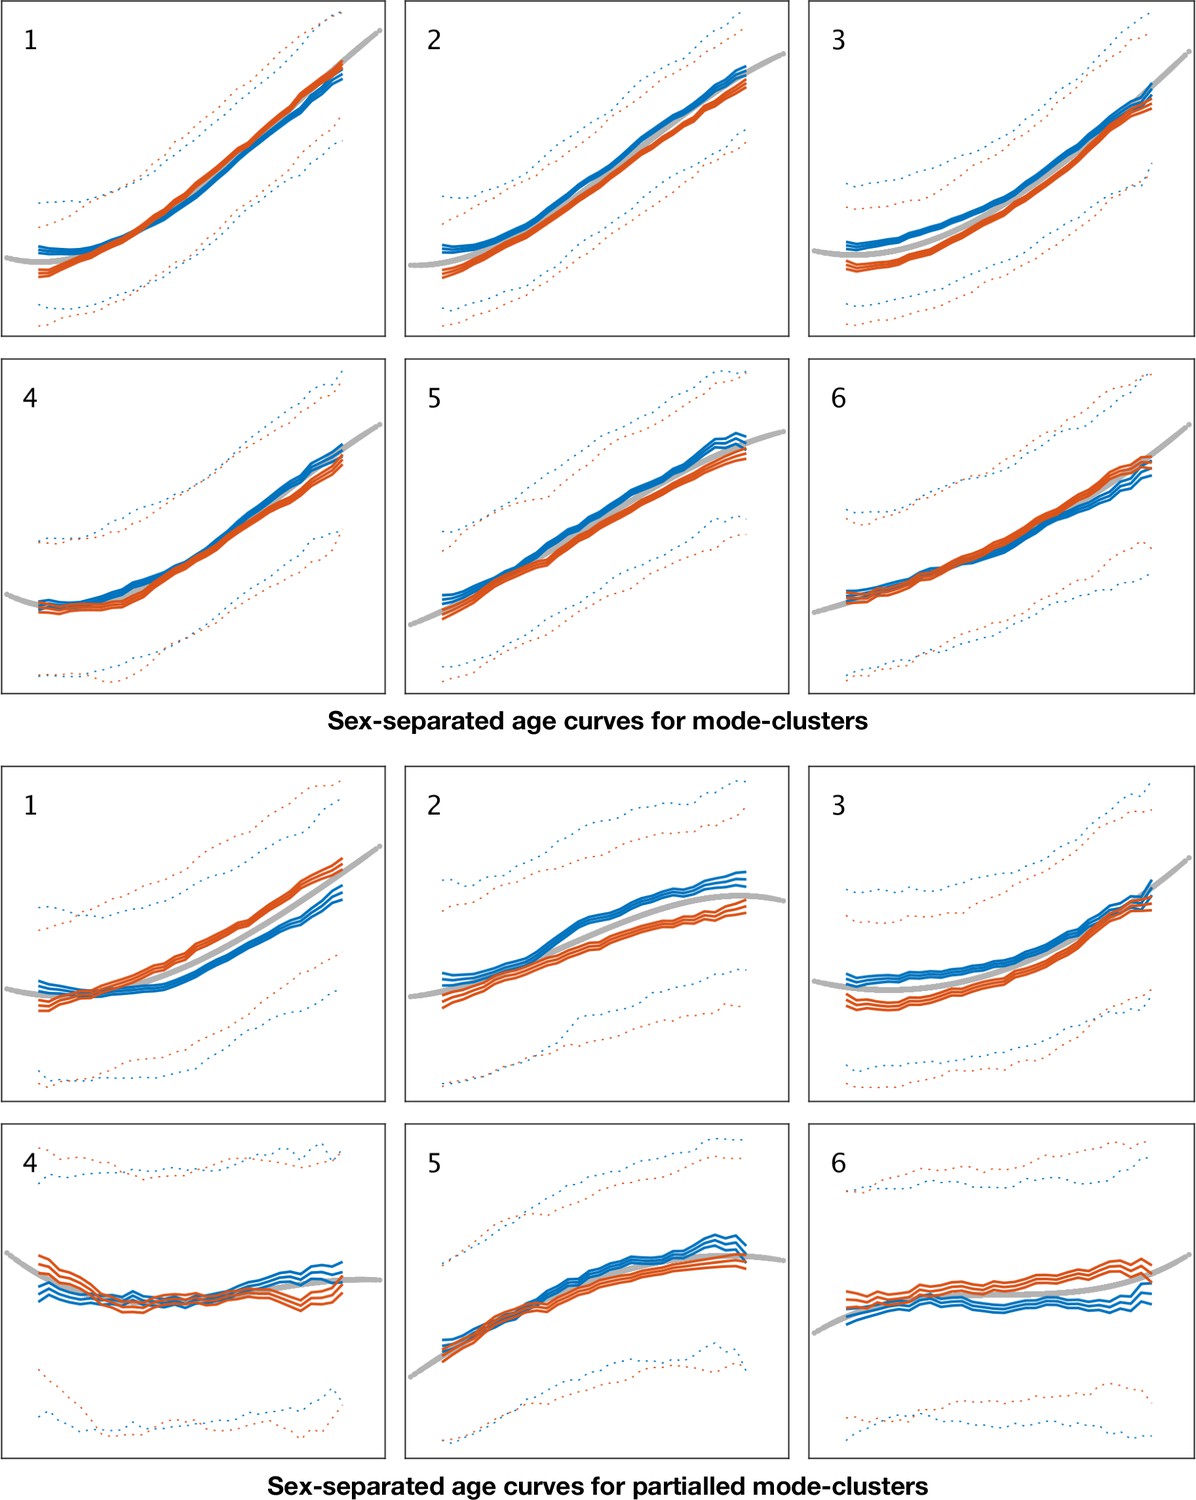
Sex-separated mean age curves for mode-clusters 1–6.
See Figure 1—figure supplement 3 for details.
Figure 1—figure supplement 10
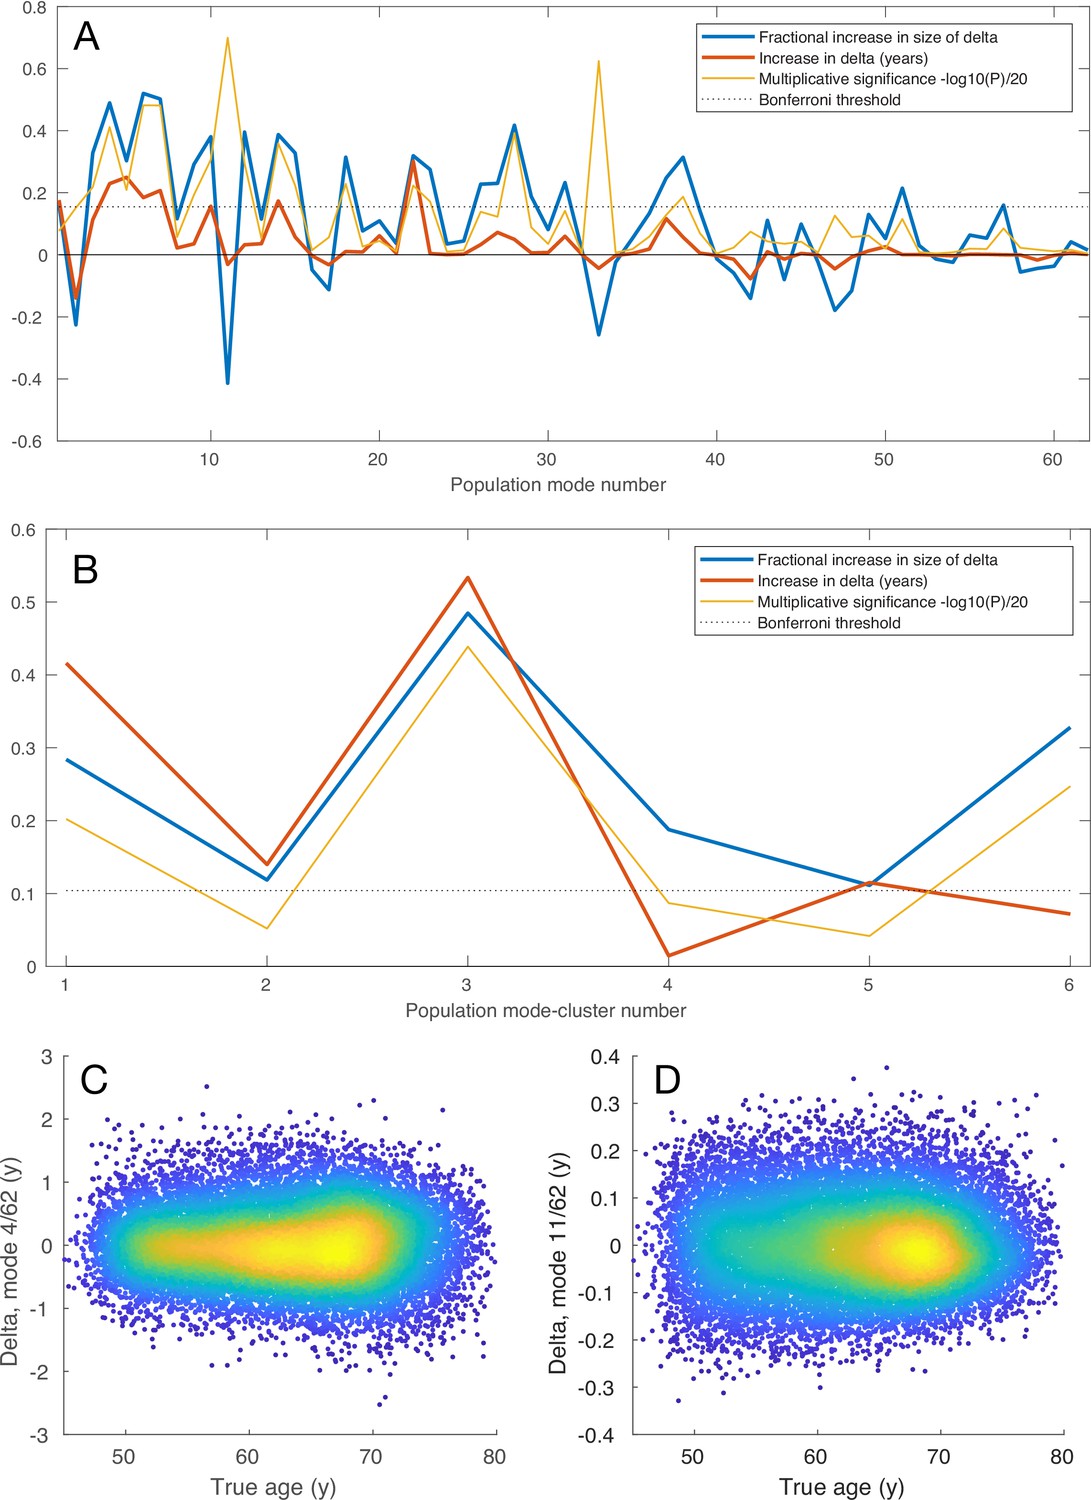
Non-additive modelling of brain-aging.
Non-additive modelling shows where modes and mode-clusters have the scale of brain-age delta changing as a function of age (see Materials and methods). In most cases (e.g. C, mode 462), delta is either constant or increases with aging. In a few cases (e.g. D, mode 1162), delta is decreasing with age.
Figure 2 with 2 supplements
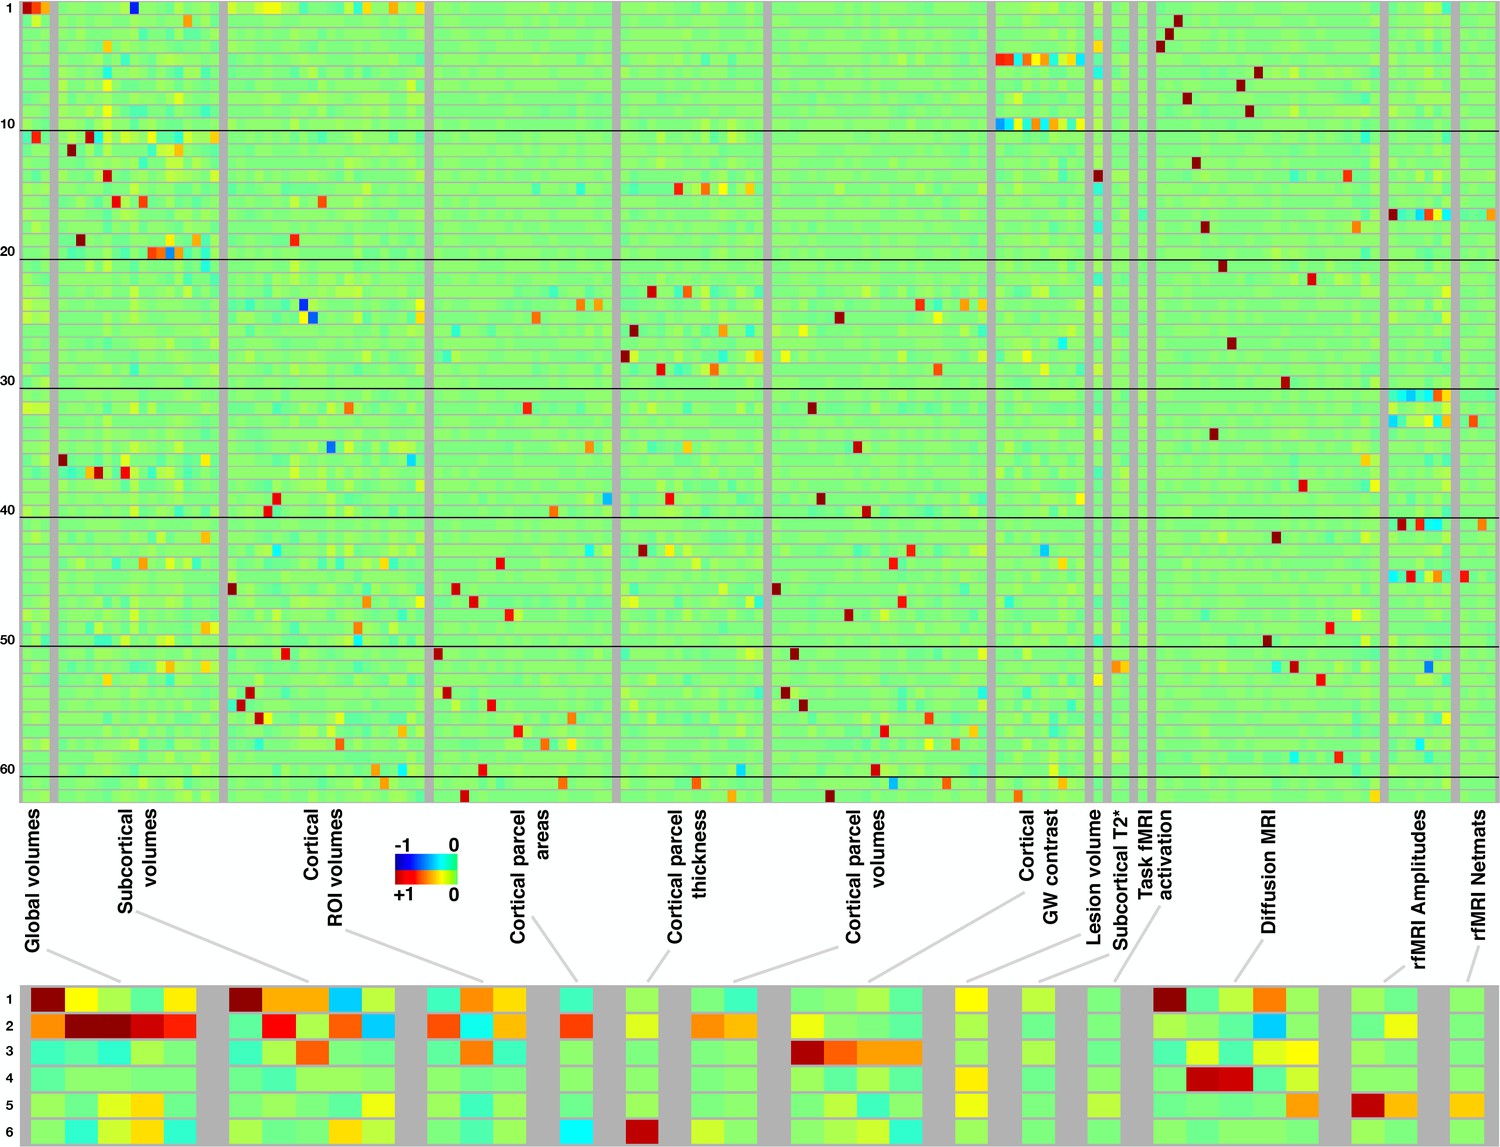
Mapping of 62 brain-aging modes and 6 mode-clusters onto different classes of strucural and functional imaging-derived phenotypes (IDPs).
Above: Each row shows the mapping of one brain-aging mode onto the imaging data, with black lines delineating groups of 10 modes for ease of reference. The full plots spanning all 3913 IDPs are shown in Figure 2—figure supplement 1; here, each class of IDPs is reduced using PCA and then ICA to the most representative pseudo-IDPs (see Materials and methods), meaning that each column in the plot relates to a fixed and distinct combination of original IDPs. IDP classes have fewer/greater distinct values here dependent on the number of IDPs in a class, and how highly they correlate with each other. Colour-coded values shown are unitless and mapped into the range −1:1. Below: The equivalent (separately computed) summary figure mapping the 6 mode-clusters onto IDPs.
Figure 2—figure supplement 1

Mapping of brain-aging modes and mode-clusters onto individual IDPs.
See Materials and methods for details, and Data availability for the complete listing of IDPs (x axis) and tables listing the strongest weights from these mappings. See Figure 2 for a simpler, more interpretable summary of this, where the x axis is reduced to different classes of IDPs.
Figure 2—figure supplement 2
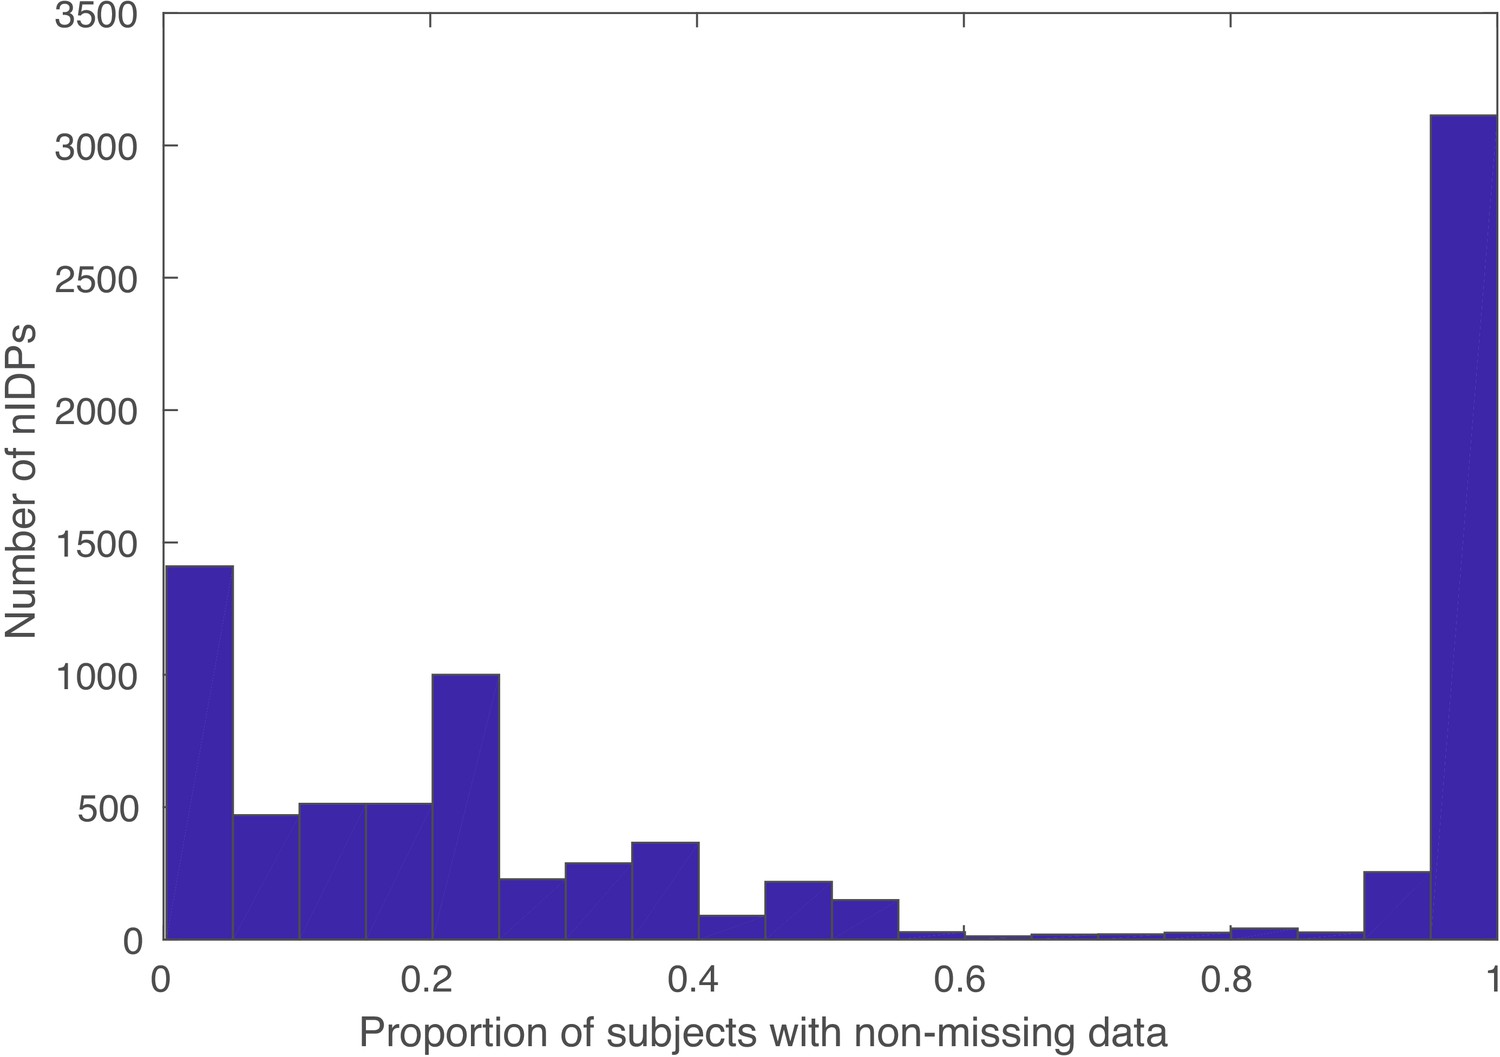
Histogram of proportions of subjects of (non-missing) data for each nIDP (non-imaging-derived phenotypes).
nIDPs are not retained if fewer than 40 subjects have data present.
Figure 3 with 3 supplements
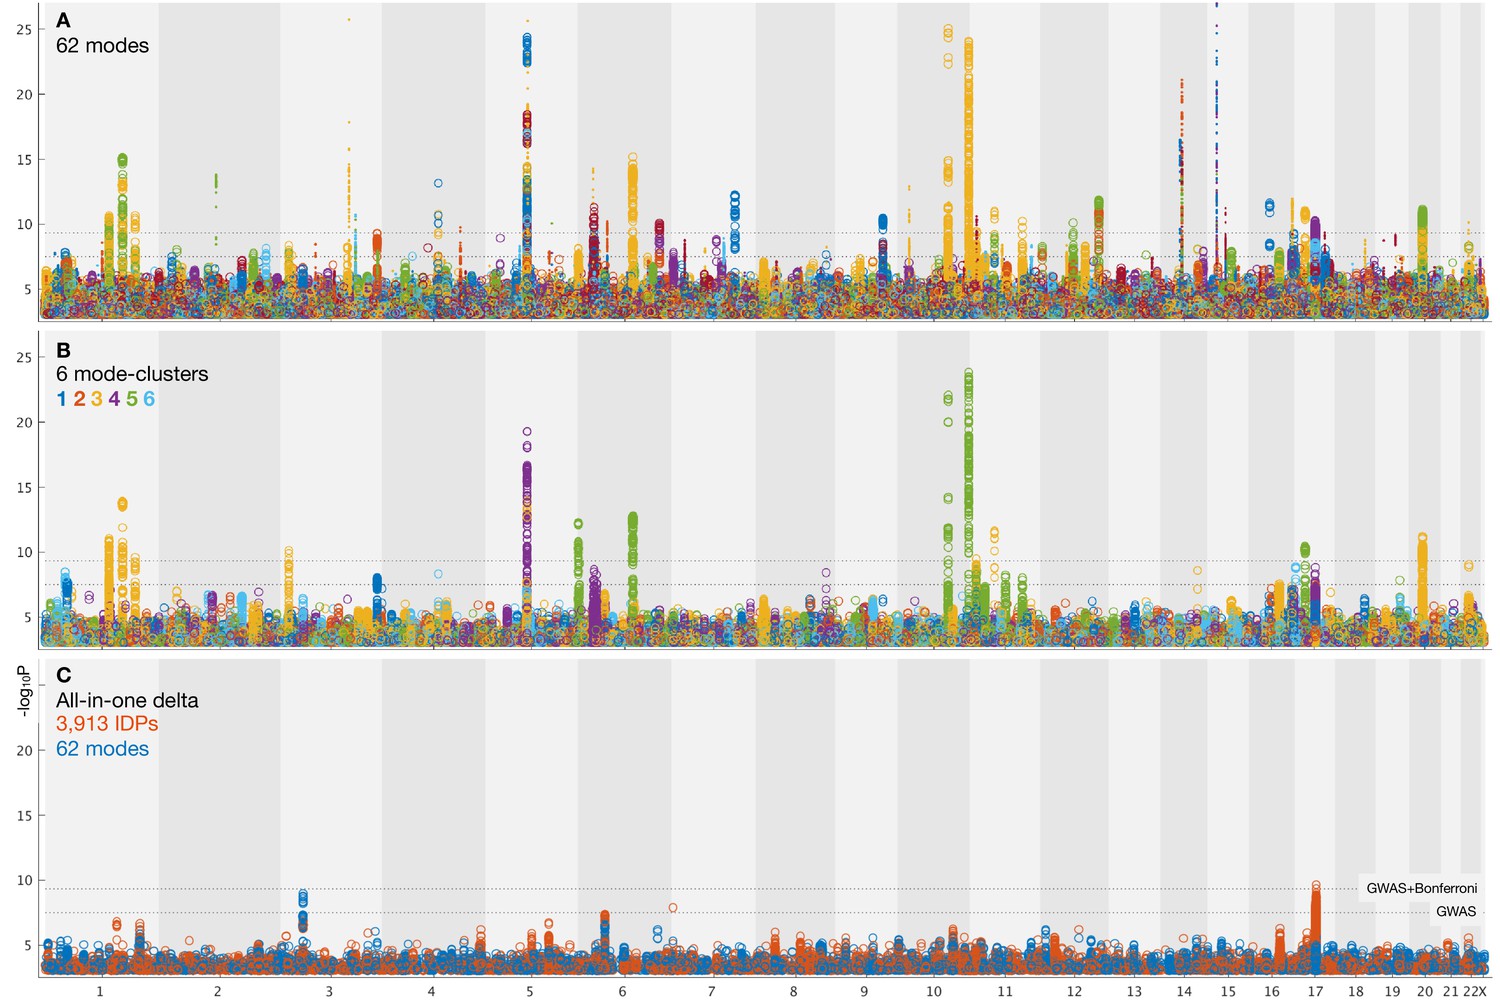
Summary plots for GWAS of brain aging.
(A) Separate GWAS for each of the 62 modes of brain aging. The y axis is (significance of the genetic association) and the x axis is SNPs, arranged according to chromosomes 1:22 and X. For convenience of display some points of even higher significance (with redundant content compared with the points seen here) are truncated; for complete plots see Figure 3—figure supplement 1, and for individual plots (one per mode), see Data availability. The lower dotted line shows the standard GWAS threshold correcting for multiple comparisons ( =7.5), and the upper line shows the result of an additional Bonferroni correction for the main 62+6 separate GWAS ( =9.33). Circles denote the first 31 brain-aging modes (i.e., those with the strongest aging effect) and dots the next 31 (with weaker aging). (B) Separate GWAS for each of the 6 mode-clusters of brain aging. Again, see Figure 3—figure supplement 1 and Data availability for complete and individual plots. (C) GWAS plots for two all-in-one estimates of brain-aging delta (with no points removed). In orange is shown the GWAS for the single delta estimated using all 3913 IDPs according to the approach in Smith et al. (2019). In blue is shown the GWAS for the single delta estimated using the 62 modes. In both cases, the richness of genetic associations is clearly greatly reduced, compared with identifying distinct associations for each mode in its own right.
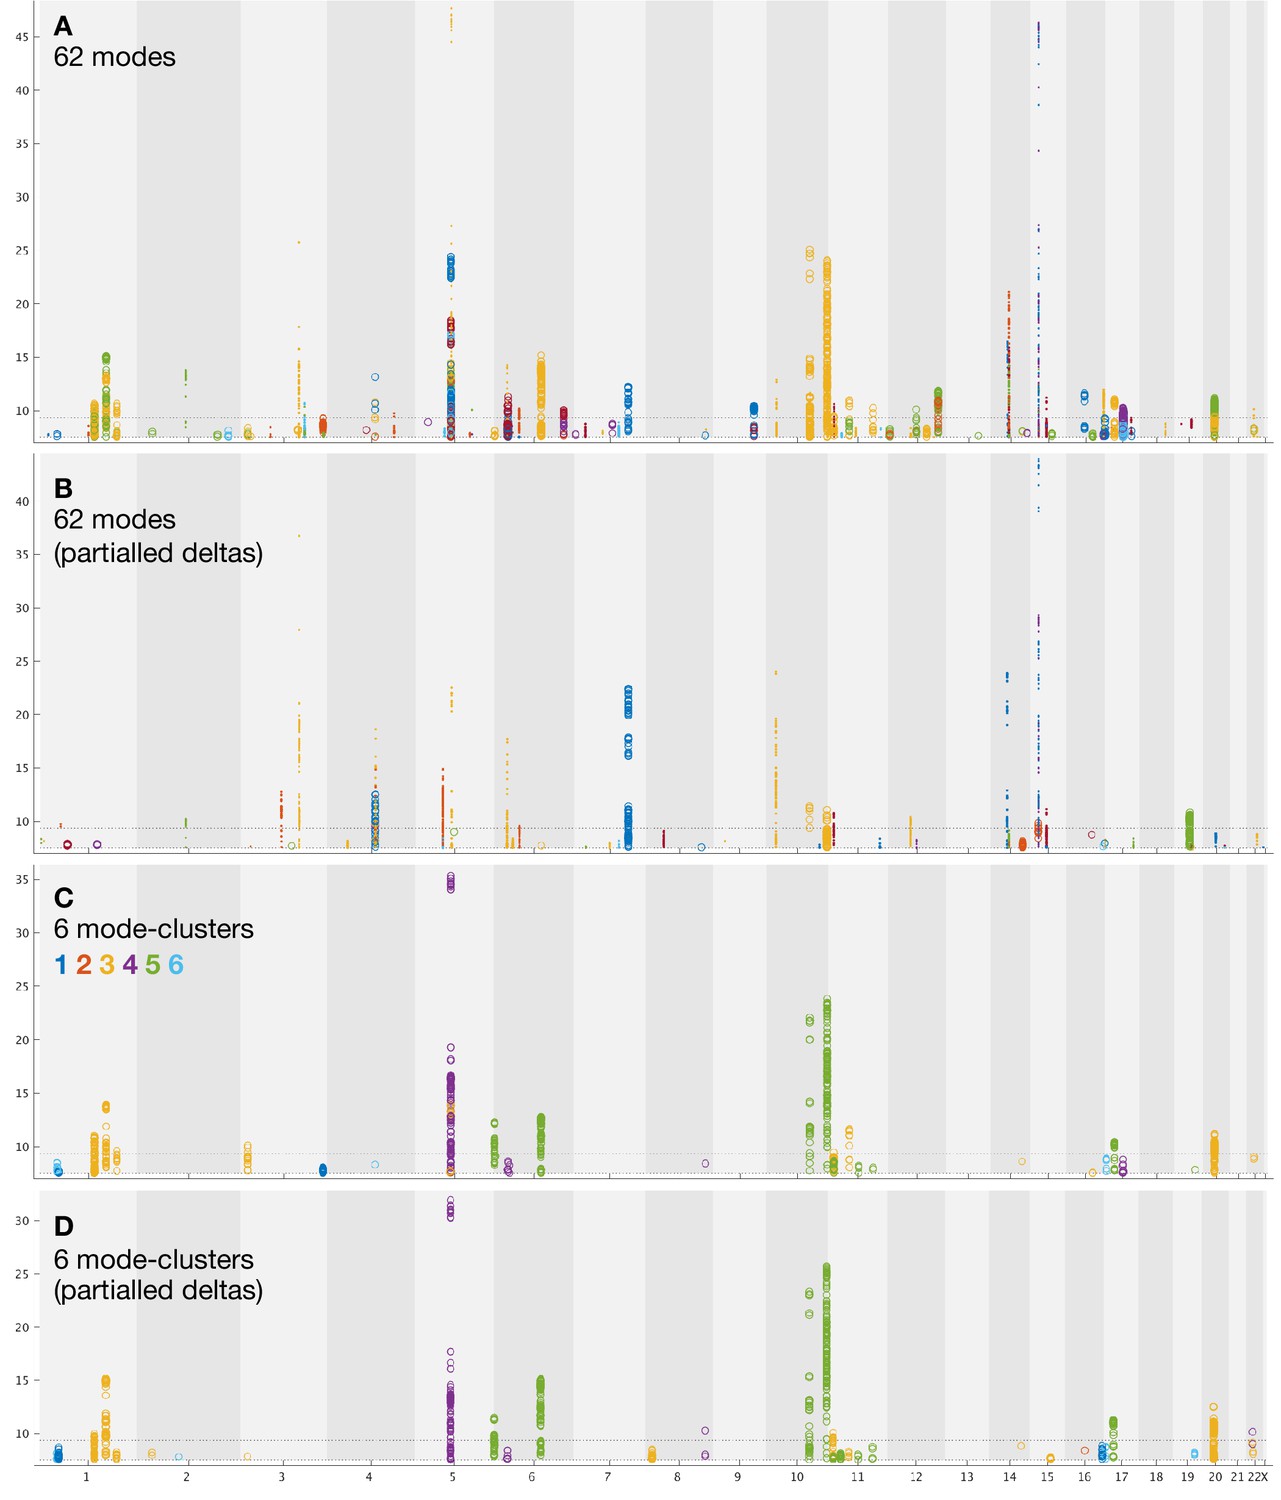
Figure 3—figure supplement 1
Summary plots for GWAS of brain aging.
See main text Figure 3 for general plot overview. (A) Separate GWAS for deltas from each of the 62 modes of brain aging. This is only different than Figure 3A in that the lower threshold is raised to 7.5 to exclude all non-significant associations, and there is no upper truncation excluding ‘redundant’ higher SNPs. (B) GWAS for 62 modes’ partialled delta estimates. (C) GWAS for deltas from each of the 6 mode-clusters of brain aging. (D) GWAS for 6 mode-clusters’ partialled delta estimates. In all cases, see links in Data availability for a complete set of individual modes/mode-cluster GWAS plots.
Figure 3—figure supplement 2
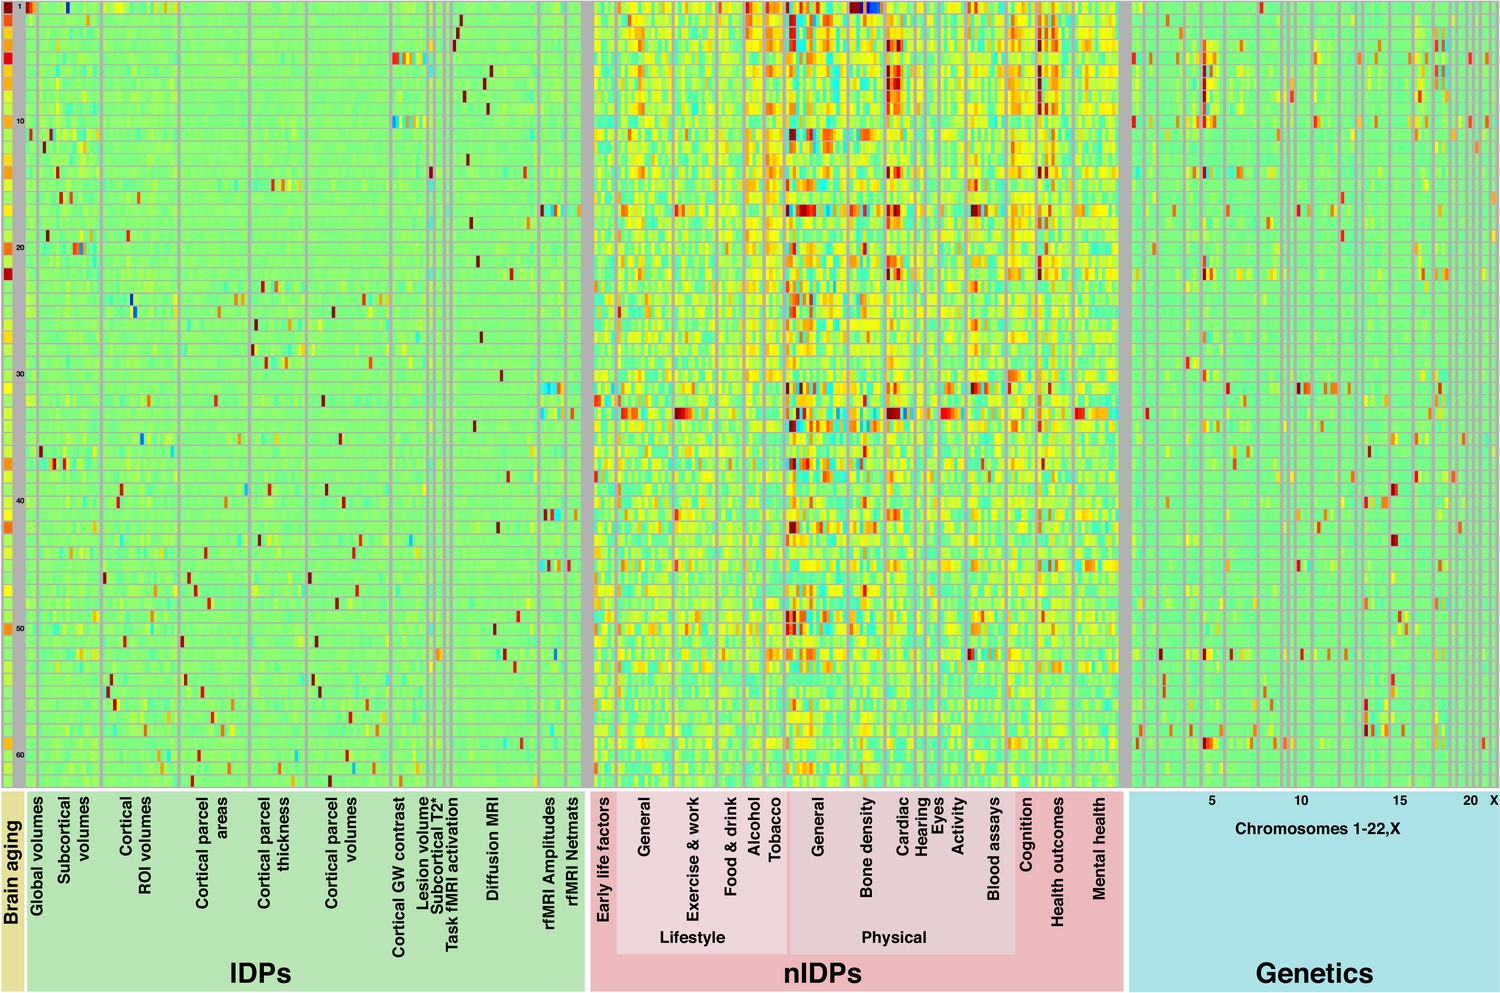
Mapping of brain-aging modes onto classes of IDPs, nIDPs and chromosomes.
This is an expansion of Figure 2 (upper), to also show how the 62 brain-aging modes map onto non-imaging measures and genetics.
Figure 3—figure supplement 3
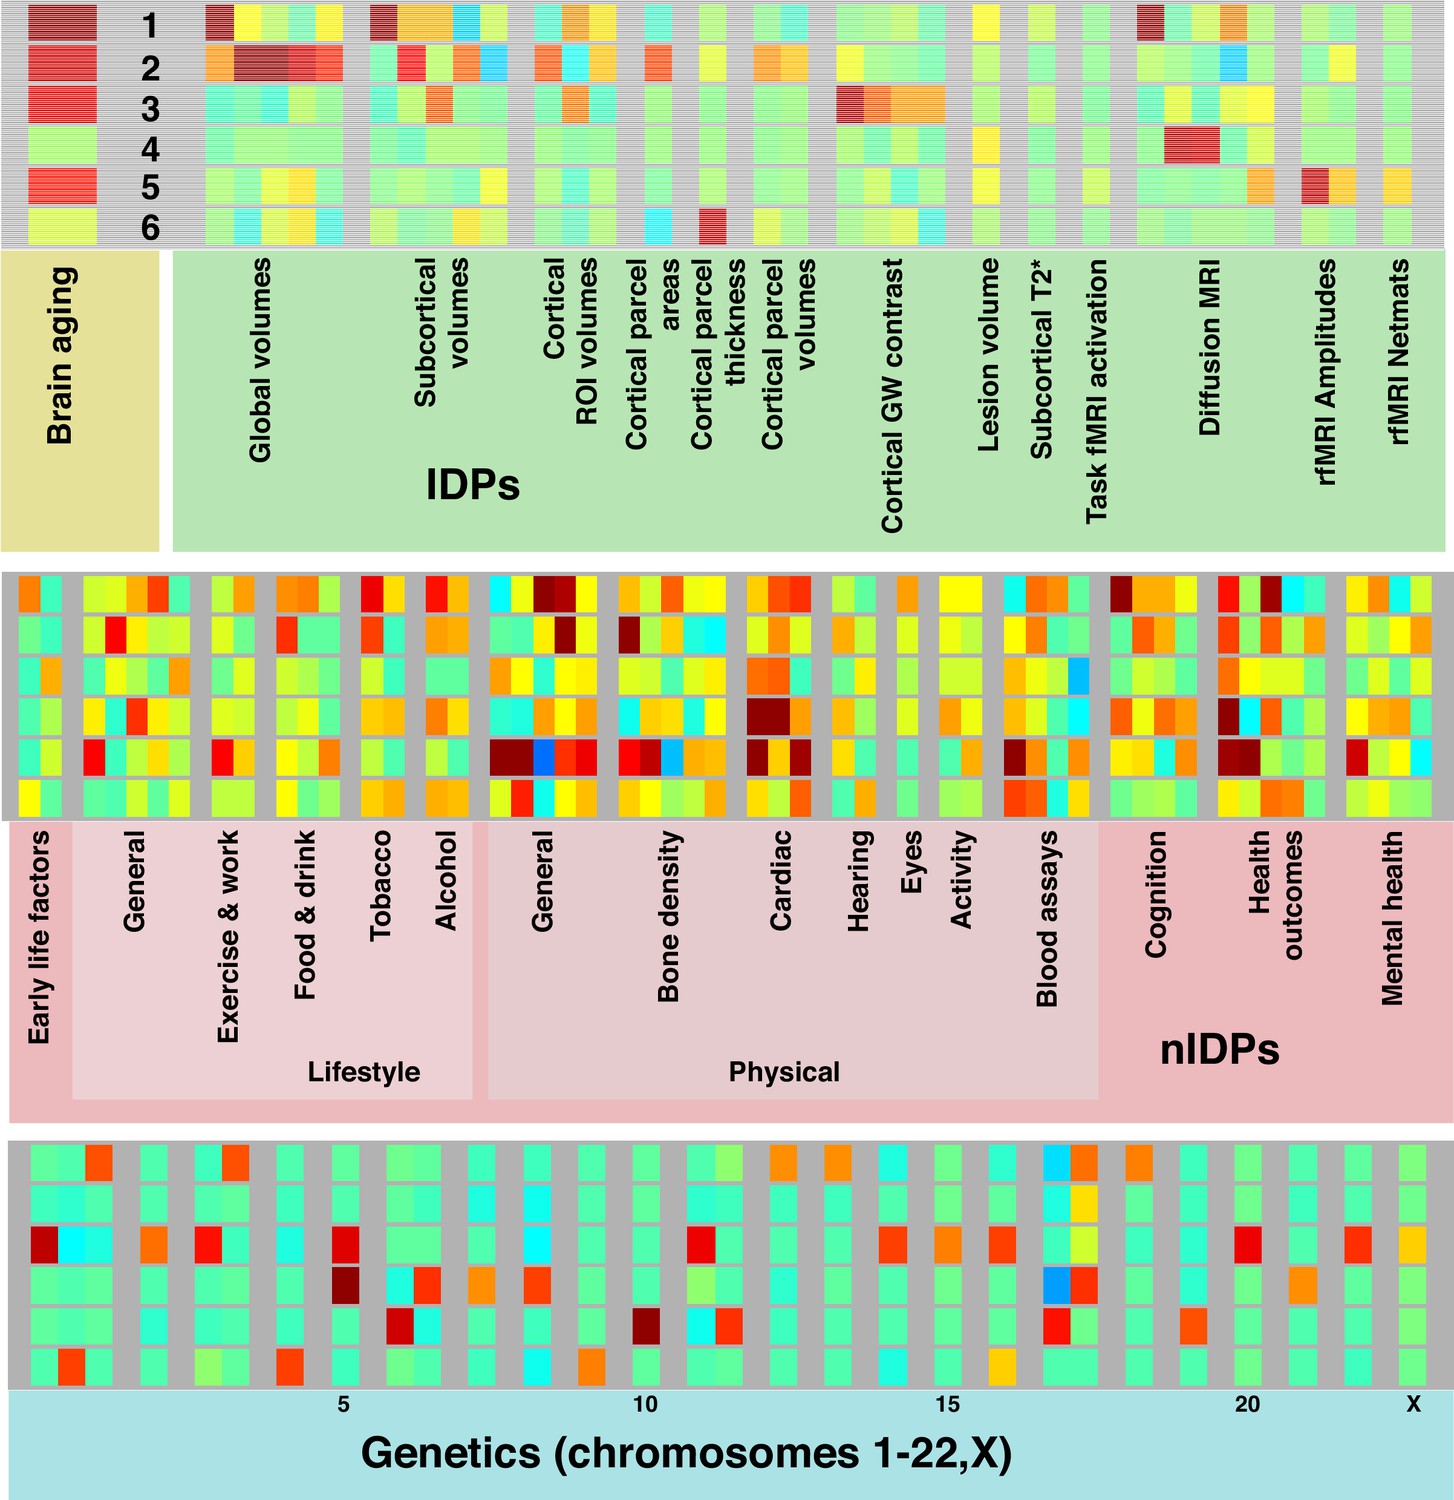
Mapping of brain-aging mode-clusters onto classes of IDPs, nIDPs and chromosomes.
This is an expansion of Figure 2 (lower), to also show how the 6 brain-aging mode-clusters map onto non-imaging measures and genetics.
Figure 4
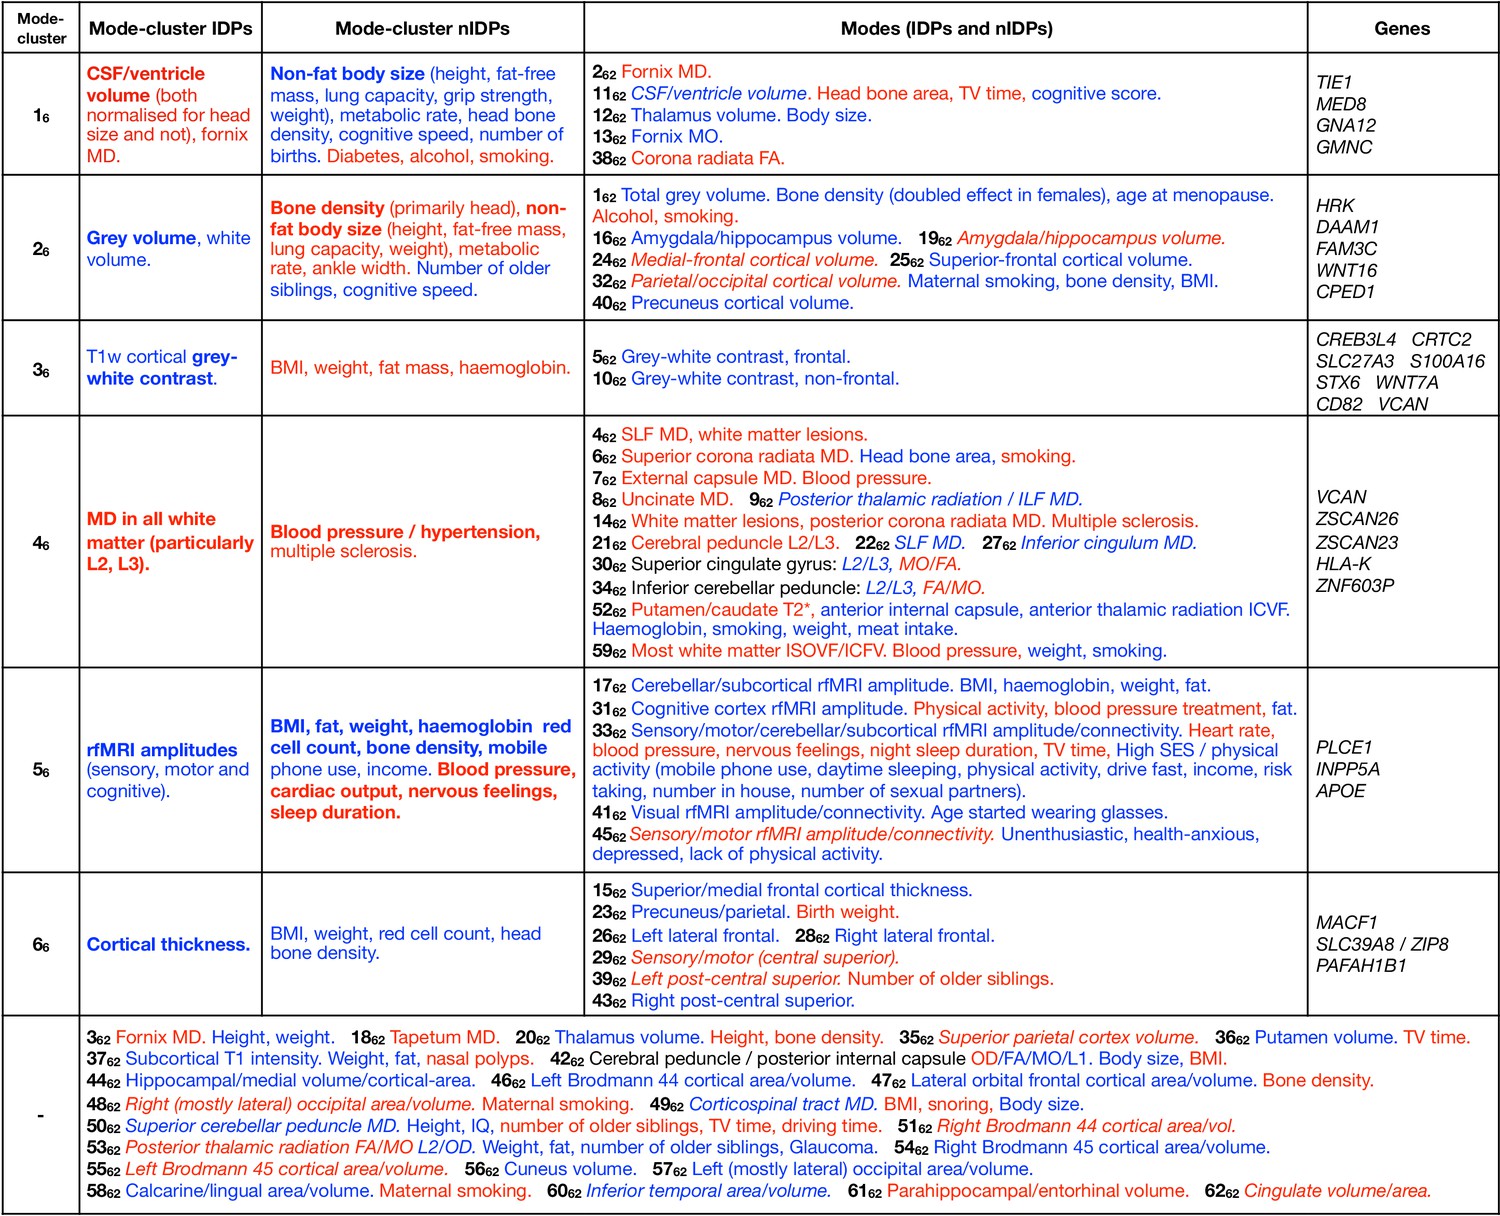
Dominant imaging, non-imaging and genetic associations between brain-age delta from all mode-clusters and modes.
The left side of the table focuses on the main patterns of associations with the 6 mode-clusters, while the right side also lists dominant associations with individual modes, grouped according to the mode-clusters. At the bottom are results from individual modes that do not have one clear associated mode-cluster. Red text signifies positive correlation with brain-age delta (meaning in general a detrimental factor with respect to aging), and blue indicates negative correlation (i.e. a positive causal factor and/or outcome with respect to aging). Where the all-in-one brain-age modelling has negative , the signs of associations between delta and IDPs becomes the inverse of the original ICA IDP weight; in such cases, the table makes this appropriate adjustment to text colour (such that the colour reflects the sign of assocation between delta and IDP, and not ICA weight), but we denote where this occurs by use of italics. Bold text indicates relatively stronger associations (in terms of strength of effects and/or number of related variables). Results included here are generally stronger than for nIDPs (see Materials and methods), and SNPs are listed only where replication succeeded. To help focus the descriptions of non-imaging variables, we largely list their associations with the partialled deltas; this therefore concentrates on unique variance in deltas. When working with partialled variables (or equivalently multiple regression), and when adjusting for some of the imaging confounds (such as head size, when considering volumetric measures), signs of associations can in some cases be non-trivial to interpret.
-
Figure 4—source data 1
Spreadsheet version of Figure 4.
- https://cdn.elifesciences.org/articles/52677/elife-52677-fig4-data1-v2.xlsx
Figure 5
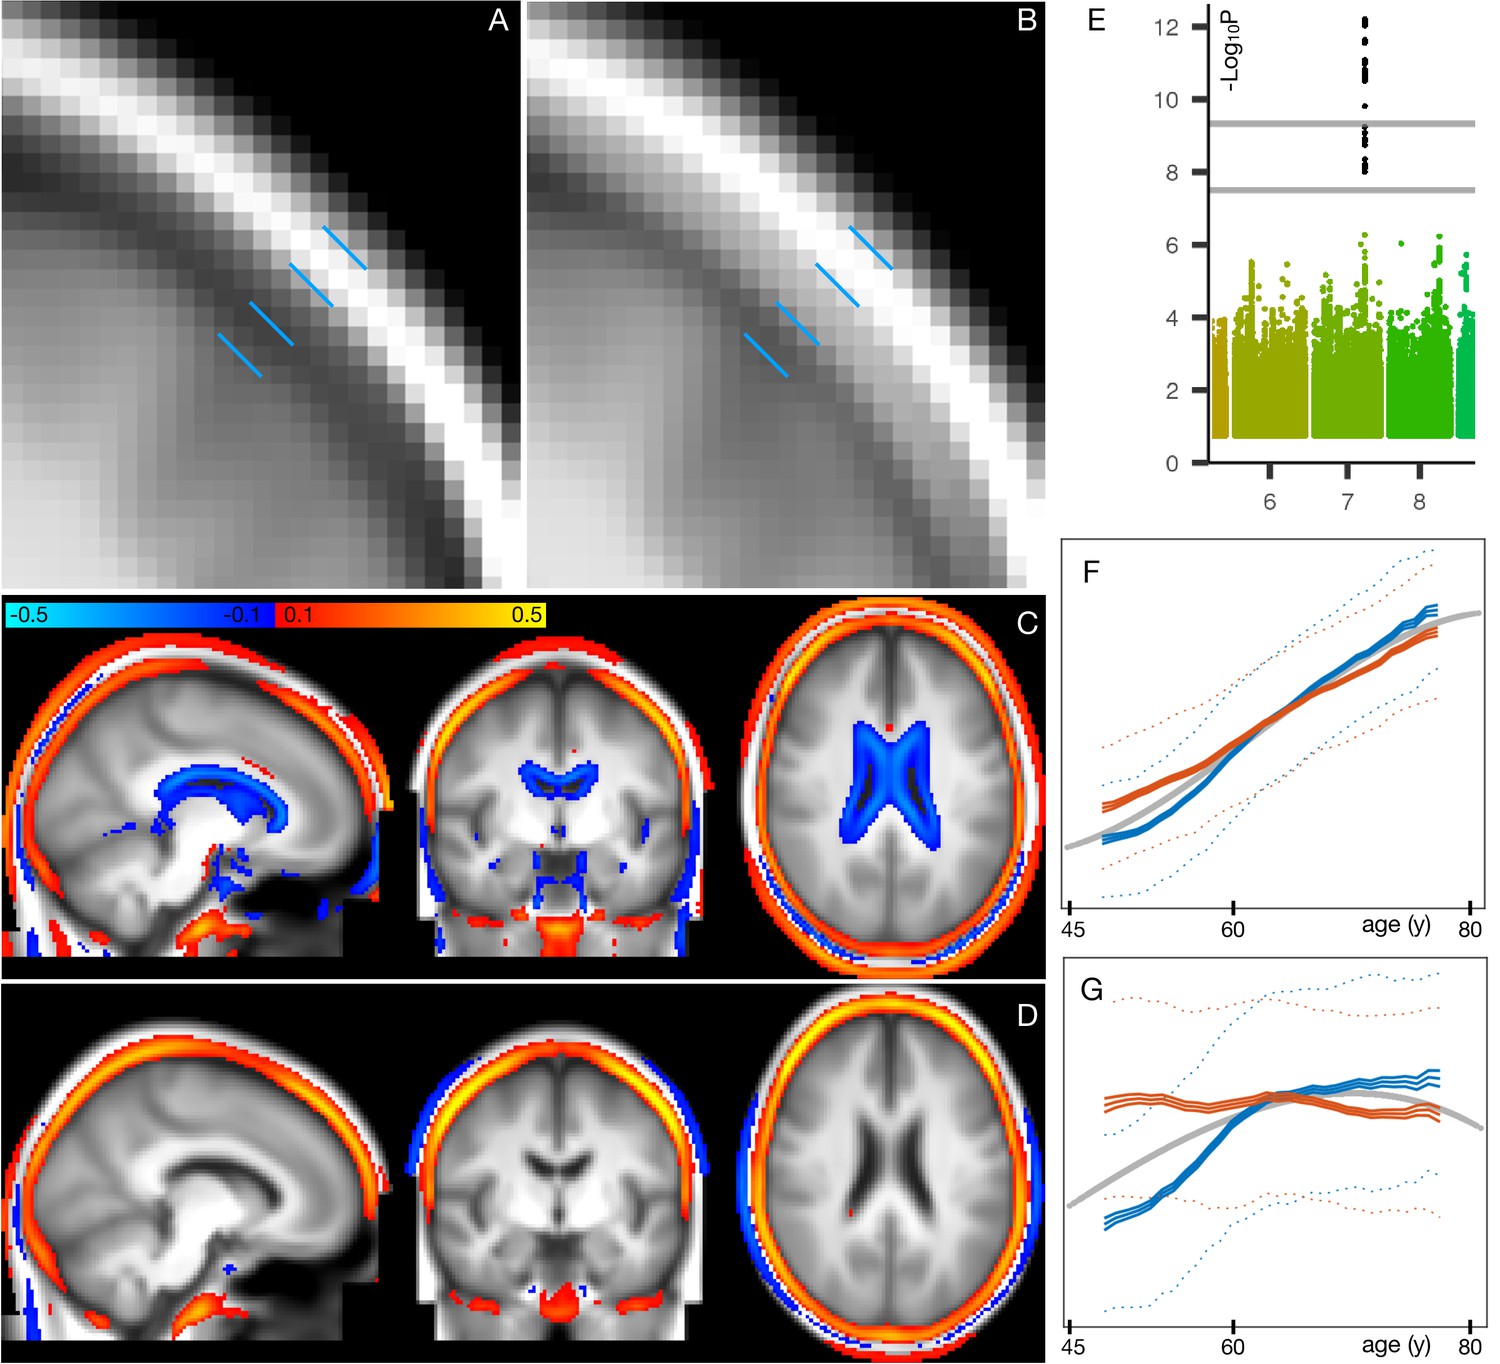
Spatial mapping of mode 162 onto original T1-weighted MRI data, along with genetic and age-dependent plots.
(A) A region-of-interest from the average T1-weighted structural image from the 1000 subjects with the lowest delta values for this mode. The images have been linearly-aligned into standard (MNI152) template space, and have not been brain-extracted, so that non-brain tissues can be seen. The blue lines delimit 3 ‘layers’ seen in cross-section; from the outside in, these are skin/fat outside the skull, the skull, and cerbrospinal fluid outside of the brain. (B) The equivalent average image from the 1000 subjects with the highest delta values. There is no obvious geometric shift (e.g. of tissue boundaries), but the intensity values are clearly higher within the skull; this is reflecting increase in bone marrow fat with brain-age delta. (C) The difference between the two average images (all images were first normalised to have a mean intensity of 1). (D) The same difference of averages, but after regressing all confounds (including age) out of the voxelwise imaging data, and working with the partialled delta values for mode 162; with this more focussed analysis, changes around the ventricle are no longer obvious, but the change in skull intensity remains. (E) The one significant genetic association (on chromosome 7) for this mode. The lower grey line shows the standard single-phenotype threshold of 7.5; the upper line shows this after Bonferroni adjustment for multiple tests (modes). This significant association was also found in the replication dataset. (F) The mean age curves for mode 162 (as described in more detail in Materials and methods and Figure 1—figure supplements 3–9). Females are shown in blue, males in orange; the y axis is the unitless mode subject-weights (averaged across subjects with an averaging sliding window). The greatest rate of age-related change is in females, in the 10y following menopause. (G) This pattern is even more striking in the partialled subject-weight curves (where other modes have first been regressed out of mode 162.).
Figure 6
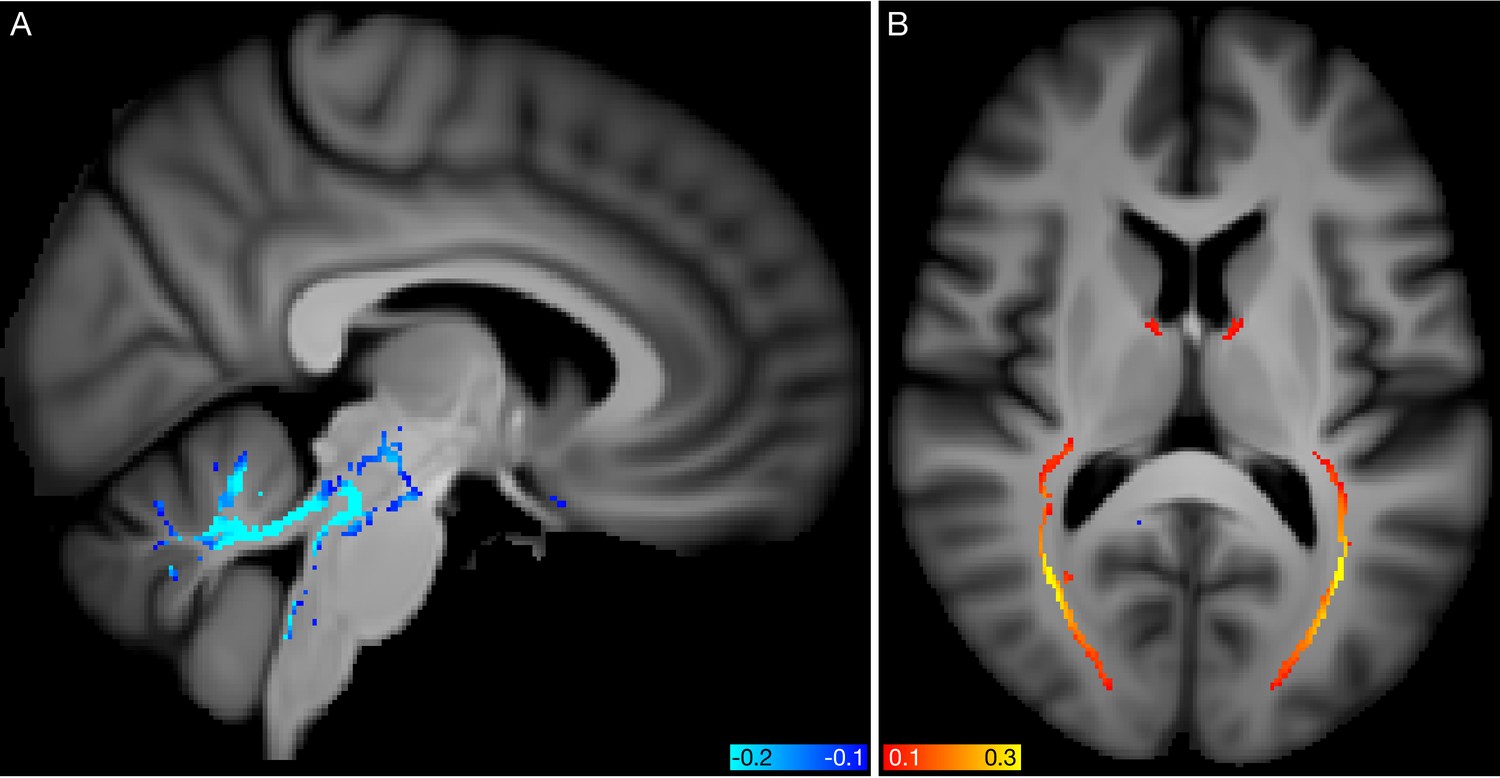
Spatial mapping of modes 5062 and 5362 from the diffusion MRI data.
(A) Voxelwise correlation of the partialled brain-age delta values (one per subject) from mode 5062, into the dMRI MD (mean diffusivity) data. The colour overlay shows correlation values, thresholded at a magnitude of 0.1. (B) Voxelwise correlation of the partialled brain-age delta from mode 5362, into the dMRI FA (fractional anisotropy) data.
Tables
Table 1
Summary results of all GWAS of brain-age delta estimates: numbers of supra-threshold SNP clusters from GWAS of all modes (discovery N = 10,612; validation N = 5,340).
Phenotypes fed into GWAS are grouped and reported on separate rows: the 62 modes’ brain-aging deltas, the 6 mode-clusters, the partialled versions of each, and the two separate all-in-one models of brain-age delta that use all 62 modes and all IDPs, respectively. The subscripts define whether the counts reported are the number of significant distinct SNP clusters for each phenotype, summed across modes/phenotypes (‘SNPs’), or the number of modes/phenotypes with at least one association (‘modes’). The superscripts describe the thresholding: either the standard single-GWAS threshold (7.5), the higher Bonferroni-adjusted threshold (9.33), or, in the case of the validation sample, the nominal 0.05 threshold (where here we are just reporting counts of validated associations from the higher discovery threshold).
| Discovery | Validation | |||||
|---|---|---|---|---|---|---|
| Phenotypes | ||||||
| 62 modes | 156 | 68 | 50 | 34 | 64 | 34 |
| 6 mode-clusters | 33 | 14 | 5 | 3 | 12 | 3 |
| 62 modes (partial) | 71 | 29 | 32 | 17 | 27 | 15 |
| 6 mode-clusters (partial) | 35 | 12 | 6 | 3 | 11 | 3 |
| all-in-one (62 modes) | 1 | 0 | 1 | 0 | 0 | 0 |
| all-in-one (IDPs) | 3 | 1 | 1 | 1 | 0 | 0 |
Additional files
Download links
A two-part list of links to download the article, or parts of the article, in various formats.
Downloads (link to download the article as PDF)
Open citations (links to open the citations from this article in various online reference manager services)
Cite this article (links to download the citations from this article in formats compatible with various reference manager tools)
Brain aging comprises many modes of structural and functional change with distinct genetic and biophysical associations
eLife 9:e52677.
https://doi.org/10.7554/eLife.52677


