Sphingosine 1-phosphate-regulated transcriptomes in heterogenous arterial and lymphatic endothelium of the aorta
- Vascular Biology Program, Boston Children's Hospital, Deapartment of Surgery, Harvard Medical School, United States
- Department of Immunology, Genetics and Pathology, Rudbeck Laboratory, Uppsala University, Sweden
- Karolinska Institutet/AstraZeneca Integrated Cardio Metabolic Centre (KI/AZ ICMC), Karolinska Institutet, Sweden
- Université de Paris, INSERM U970, Paris Cardiovascular Research Center, France
- Center for Interdisciplinary Cardiovascular Sciences, Department of Medicine, Brigham and Women's Hospital, Harvard Medical School, United States
- Harvard Medical School Research Computing, United States
- Genetics of Development and Disease Branch, National Institute of Diabetes and Digestive and Kidney Diseases, National Institutes of Health, United States
- Department of Cardiology, Boston Children’s Hospital, Harvard Medical School, United States
- Harvard Stem Cell Institute, Harvard University, United States
Figures
Figure 1 with 2 supplements
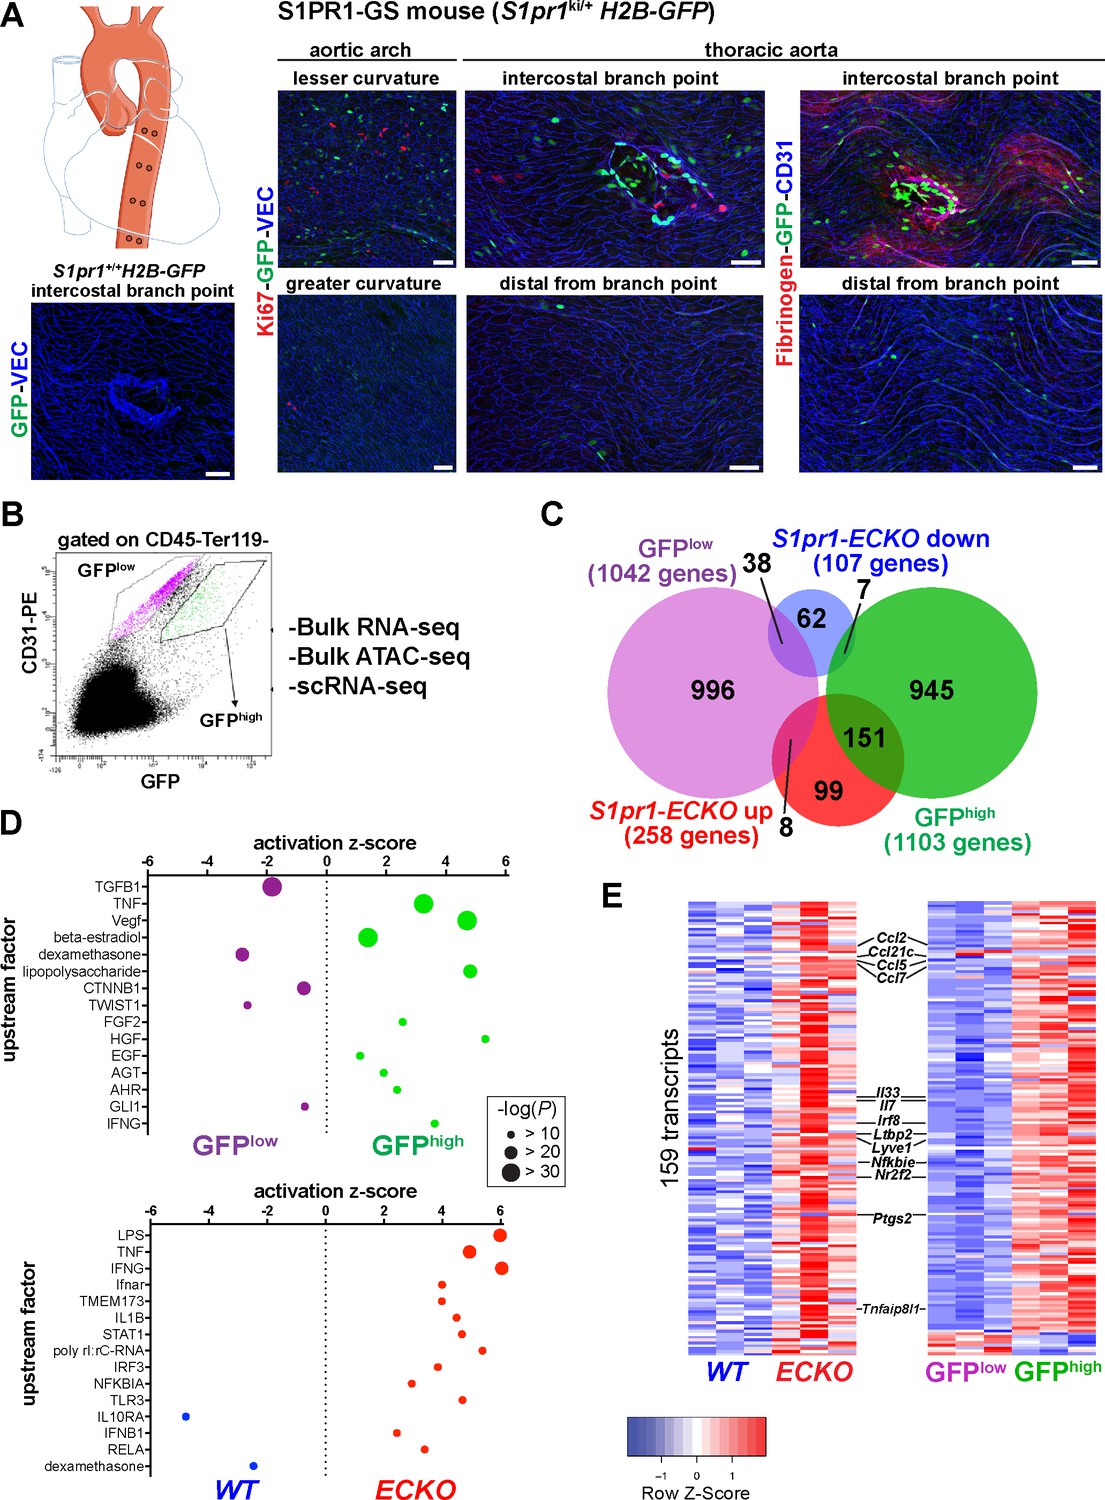
High S1PR1/ß-arrestin coupling in normal mouse aortic endothelium exhibits transcriptomic concordance with S1PR1 loss-of-function.
(A) H2B-GFP control and S1PR1-GS mouse thoracic aorta whole-mount en face preparations. Representative images from different regions of the aorta are presented and show H2B-GFP (GFP), VE-Cadherin (VEC) or CD31, Ki67 (N = 3) or Fibrinogen (N = 2) immunostaining. Scale bars are 50 µM. (B) FACS gating scheme used for isolation of GFPhigh and GFPlow MAECs showing the uncompensated CD31-PE and GFP channels. S1pr1 ECKO and WT MAECs were isolated using the GFPlow gate of this scheme (see Figure 1—figure supplement 1A). (C) Venn diagram showing differentially expressed transcripts in the GFPhigh vs. GFPlow and S1pr1 ECKO vs. WT MAECs comparisons. The number of transcripts individually or co-enriched (p-value<0.05) are indicated for each overlap (see Supplementary file 1). (D) Selected upstream factors identified by IPA analysis of GFPhigh vs. GFPlow (top) and S1pr1 ECKO vs. WT (bottom) MAEC comparisons. Activation Z-scores and P-values are indicated for each selected factor (see Supplementary file 2). (E) Expression heatmaps (row Z-scores) of the 159 S1pr1 ECKO up-regulated transcripts also differentially expressed between GFPhigh and GFPlow MAECs. Values represent individual replicates from comparison of S1pr1 ECKO vs WT (left) and GFPhigh vs GFPlow (right) and selected transcripts are labeled. For both RNA-seq experiments, three cohorts of mice were used for MAEC isolation and downstream statistical analyses (N = 3 for each experiment).
Figure 1—figure supplement 1
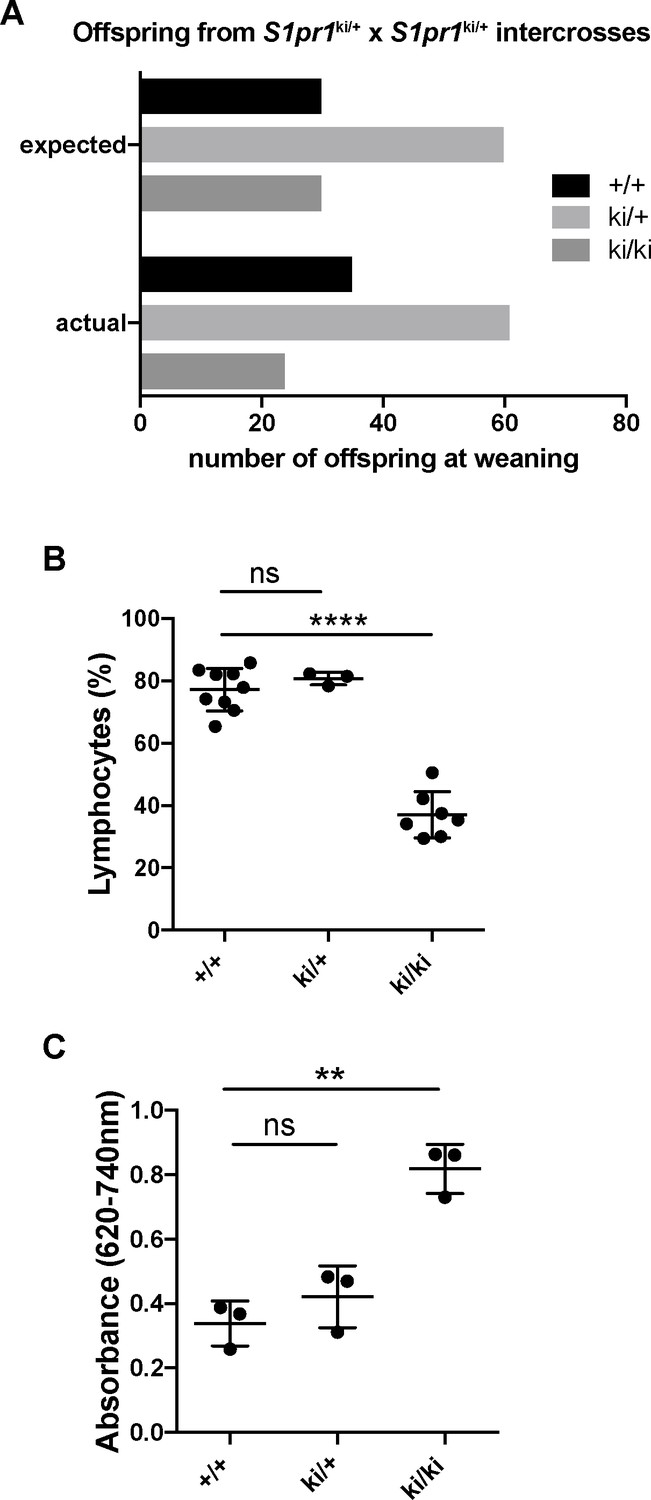
S1PR1-GS mice with a single S1pr1-knockin allele are phenotypically normal.
(A) Enumeration of S1pr1+/+, S1pr1ki/+ and S1pr1ki/ki offspring from S1pr1ki/+ intercrosses. (B) Lymphocyte counts in peripheral blood of young adult (12 week) S1pr1+/+, S1pr1ki/+ and S1pr1ki/ki mice. One-way ANOVA followed by Bonferroni’s post hoc test, ****P < 0.0001 (C) Quantification of Evans Blue dye in lungs two hours after retro-orbital injection into the venous plexus. One-way ANOVA followed by Bonferroni’s post hoc test, **P < 0.005.
Figure 1—figure supplement 2
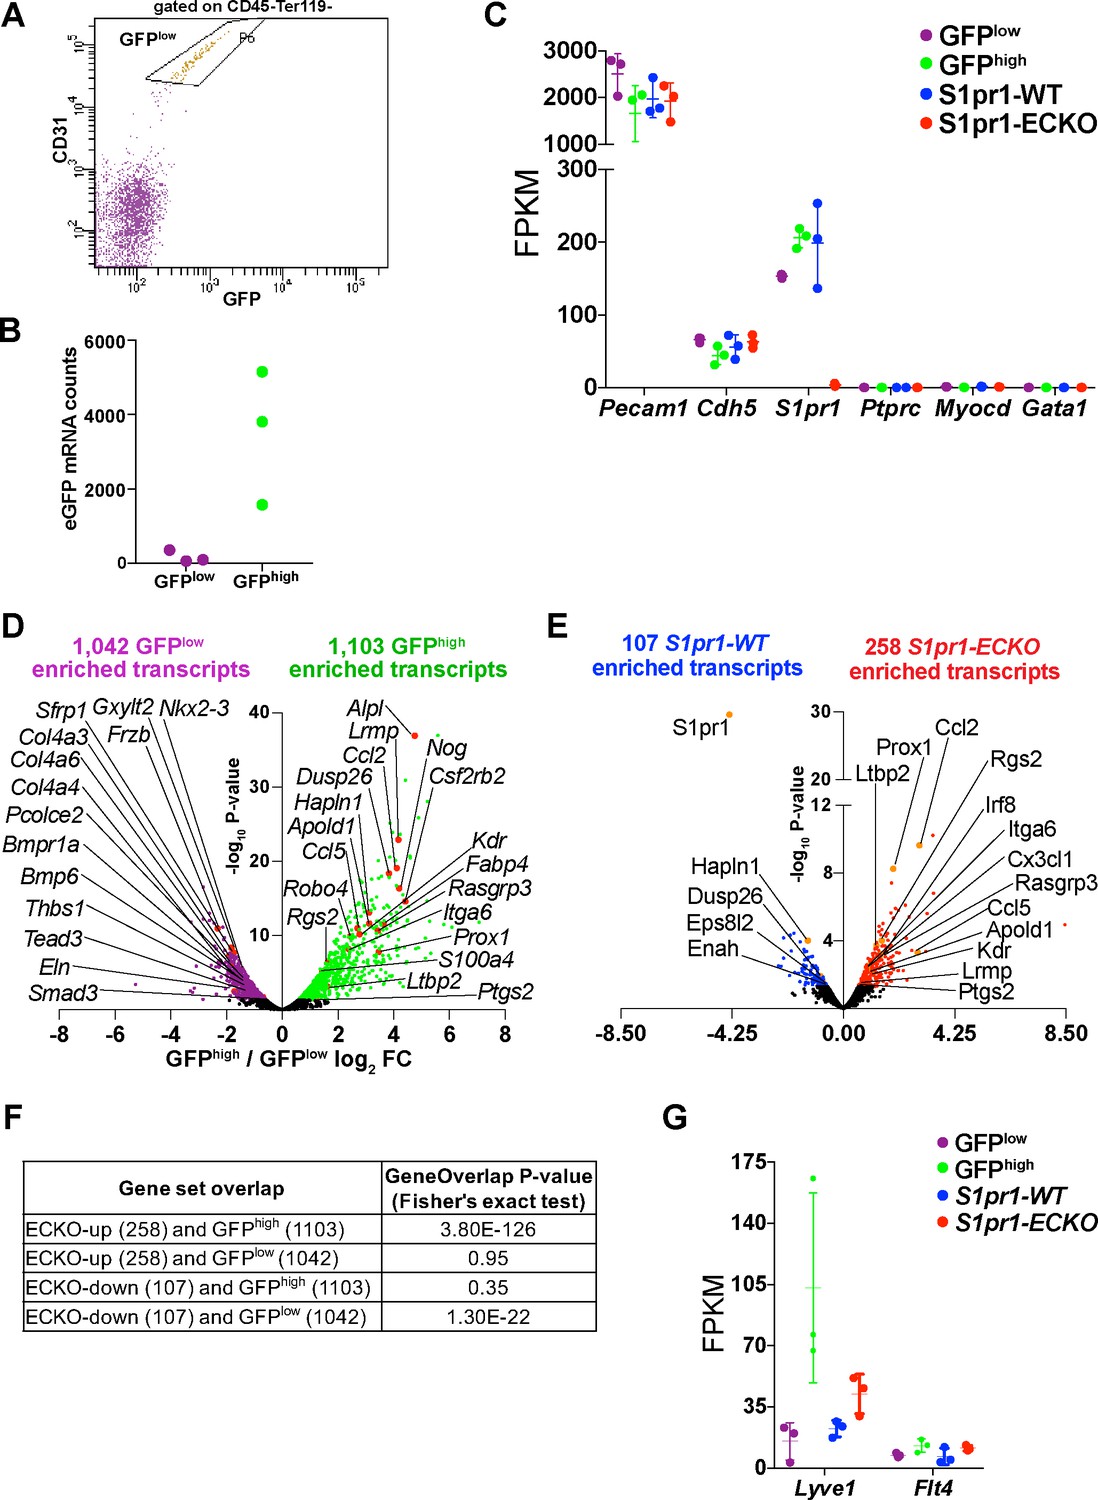
RNA-seq quality control and differential gene expression between GFPhigh and GFPlow and S1pr1 ECKO and WT MAECs.
(A) FACS gating scheme for isolation of S1pr1 WT and S1pr1 ECKO. MAECs were defined as cells in the gate labeled ‘P6’, (CD45-Ter119-CD31+). This gate was designed using the GFPlow gate shown in Figure 1B. (B) Counts of GFPhigh and GFPlow MAEC RNA-seq reads that mapped to the eGFP CDS. (C) Expression, in fragments per kilobase per million mapped fragments (FPKMs), of indicated transcripts from bulk RNA-seq of GFPhigh, GFPlow, S1pr1 ECKO and WT MAECs. (D–E) Volcano plots of all transcripts (counts per million > 1) illustrate those differentially expressed between GFPhigh and GFPlow (D) and S1pr1 ECKO and WT (E) MAECs (see Supplementary file 1). Highlighted transcripts are associated with TGFß signaling, inflammatory pathways, and/or show common regulation in GFPhigh and S1pr1 ECKO MAECs. (F) GeneOverlap (Shen et al., 2013) results showing the significance of the overlaps shown in Figure 1C. (G) Expression of transcripts associated with lymphatic endothelial cells.
Figure 2 with 3 supplements
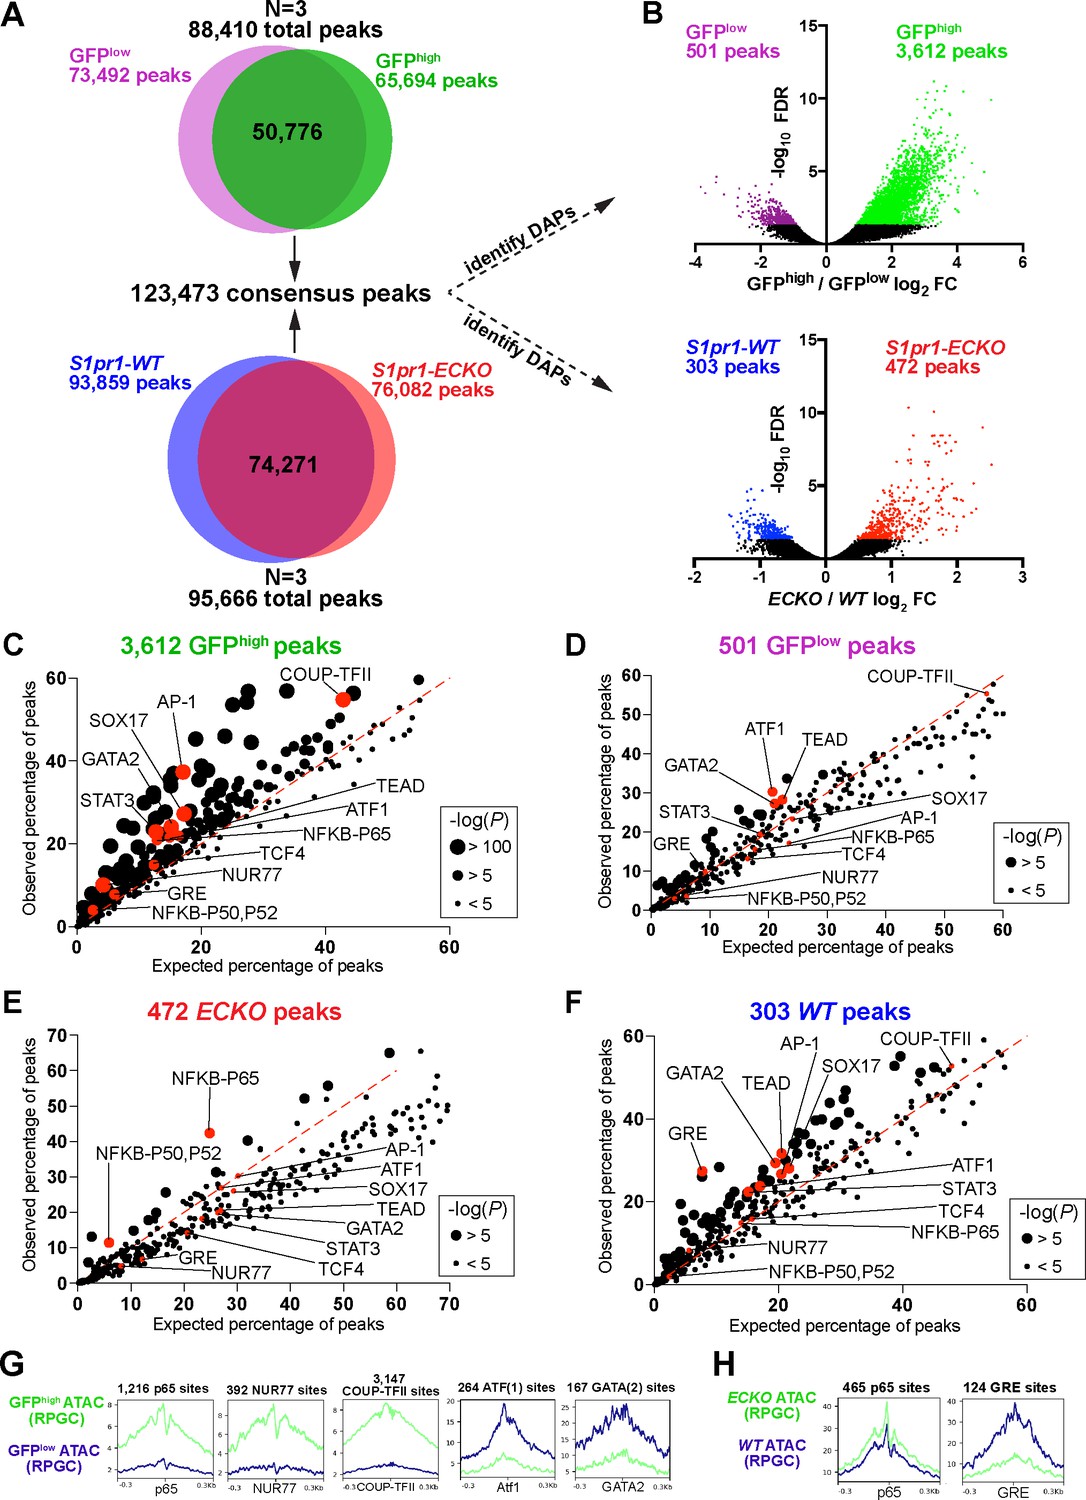
S1PR1 loss-of-function and high levels of ß-arrestin coupling are associated with an NFκB signature in open chromatin.
(A) Venn diagrams illustrating all peaks (FDR < 0.00001) identified after analysis of individual ATAC-seq replicates of GFPlow, GFPhigh, S1pr1 ECKO, and WT MAECs, and subsequent merging of these peaks into a single consensus peak set. (B) Volcano plots of all peaks for both the GFPhigh vs GFPlow and S1pr1 ECKO vs WT MAECs. Three individual experiments were performed for GFPlow vs GFPhigh and S1pr1 ECKO vs WT comparisons (N = 3). Differentially accessible peaks (DAPs) were determined using edgeR (FDR < 0.05, see Materials and methods) (colored dots). (C–F) Transcription factor (TF) binding motif enrichment analysis of DAPs. The DAPs were input to the HOMER ‘findMotifsGenome.pl’ script (see also Supplementary file 2) and observed vs expected frequencies of motif occurrances were plotted. (G–H) Graphs showing ATAC signal at predicted TF binding sites. ATAC-seq reads were centered on Tn5 cut sites, trimmed to 10 bp, and nucleotide-resolution bigwig files were generated using DeepTools with reads per genomic content (RPGC) normalization. Reads were subsequently centered on TF binding motifs identified in (C–F) and viewed as mean read densities across 600 bp windows.
Figure 2—figure supplement 1
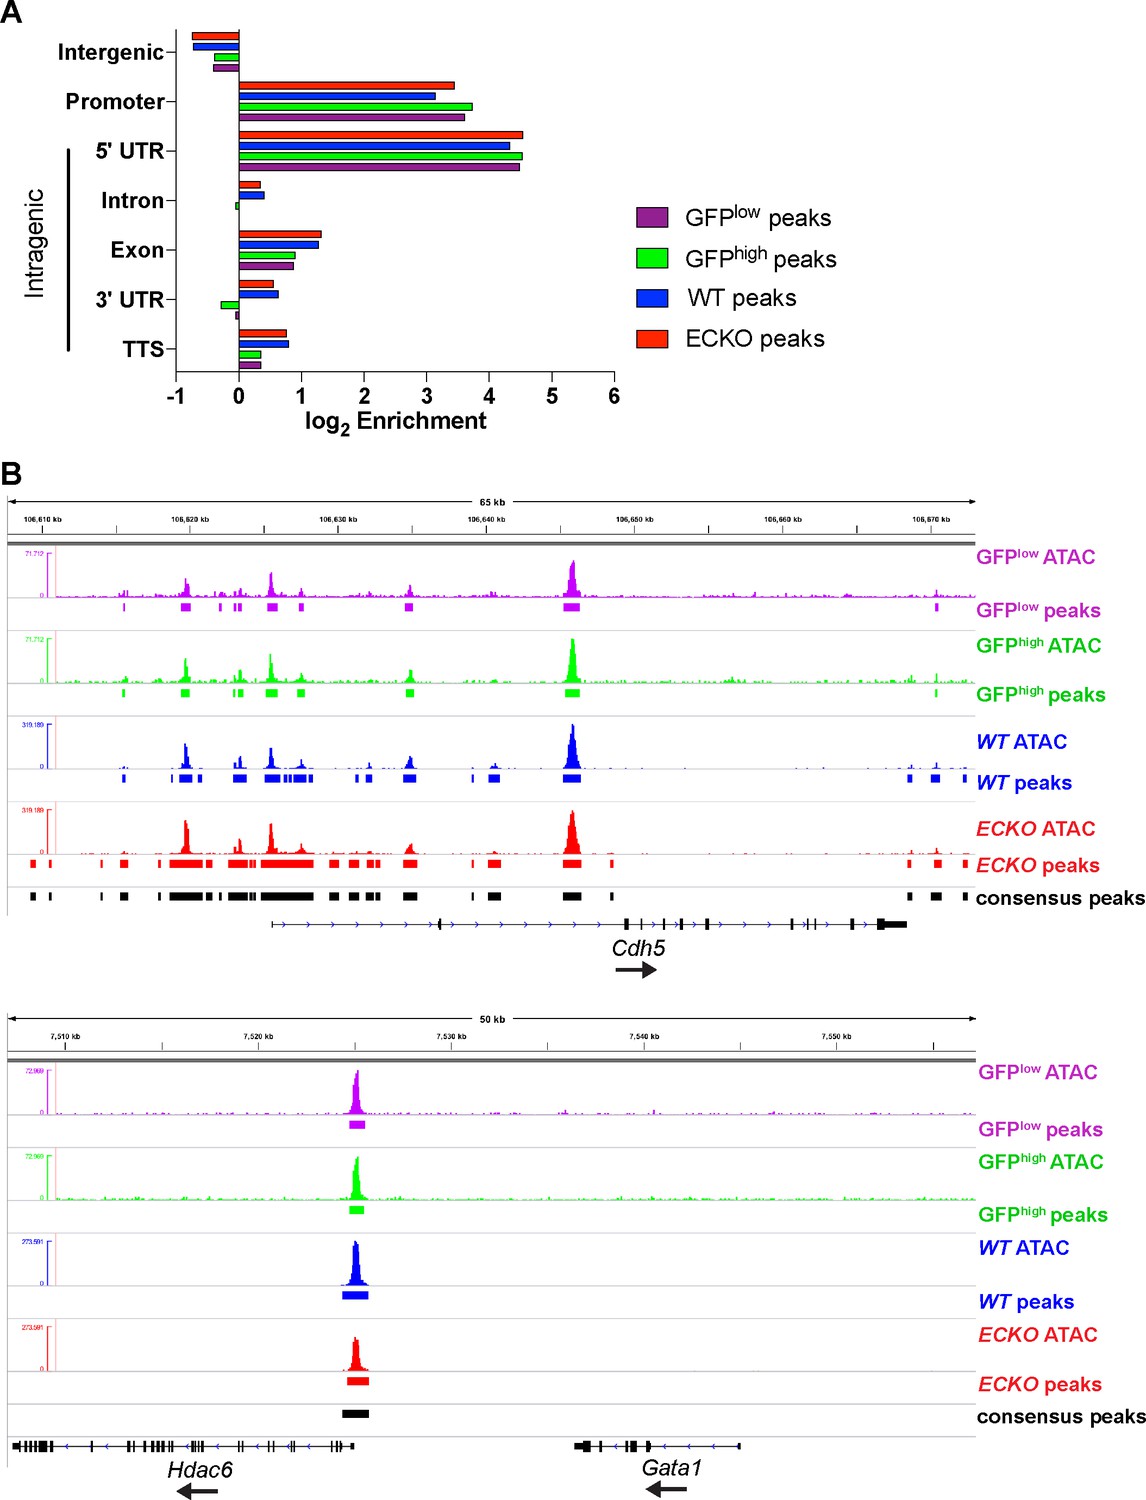
ATAC-seq quality control and peak annotation.
(A) Enrichment of GFPhigh, GFPlow, S1pr1 ECKO and WT MAECs peaks with respect to distance from UCSC-annotated transcripts (mm9). Promoters are defined as + / - 1 kb from transcription start sites. (B) ATAC-seq signal and peaks at Cdh5 and Gata1 loci.
Figure 2—figure supplement 2
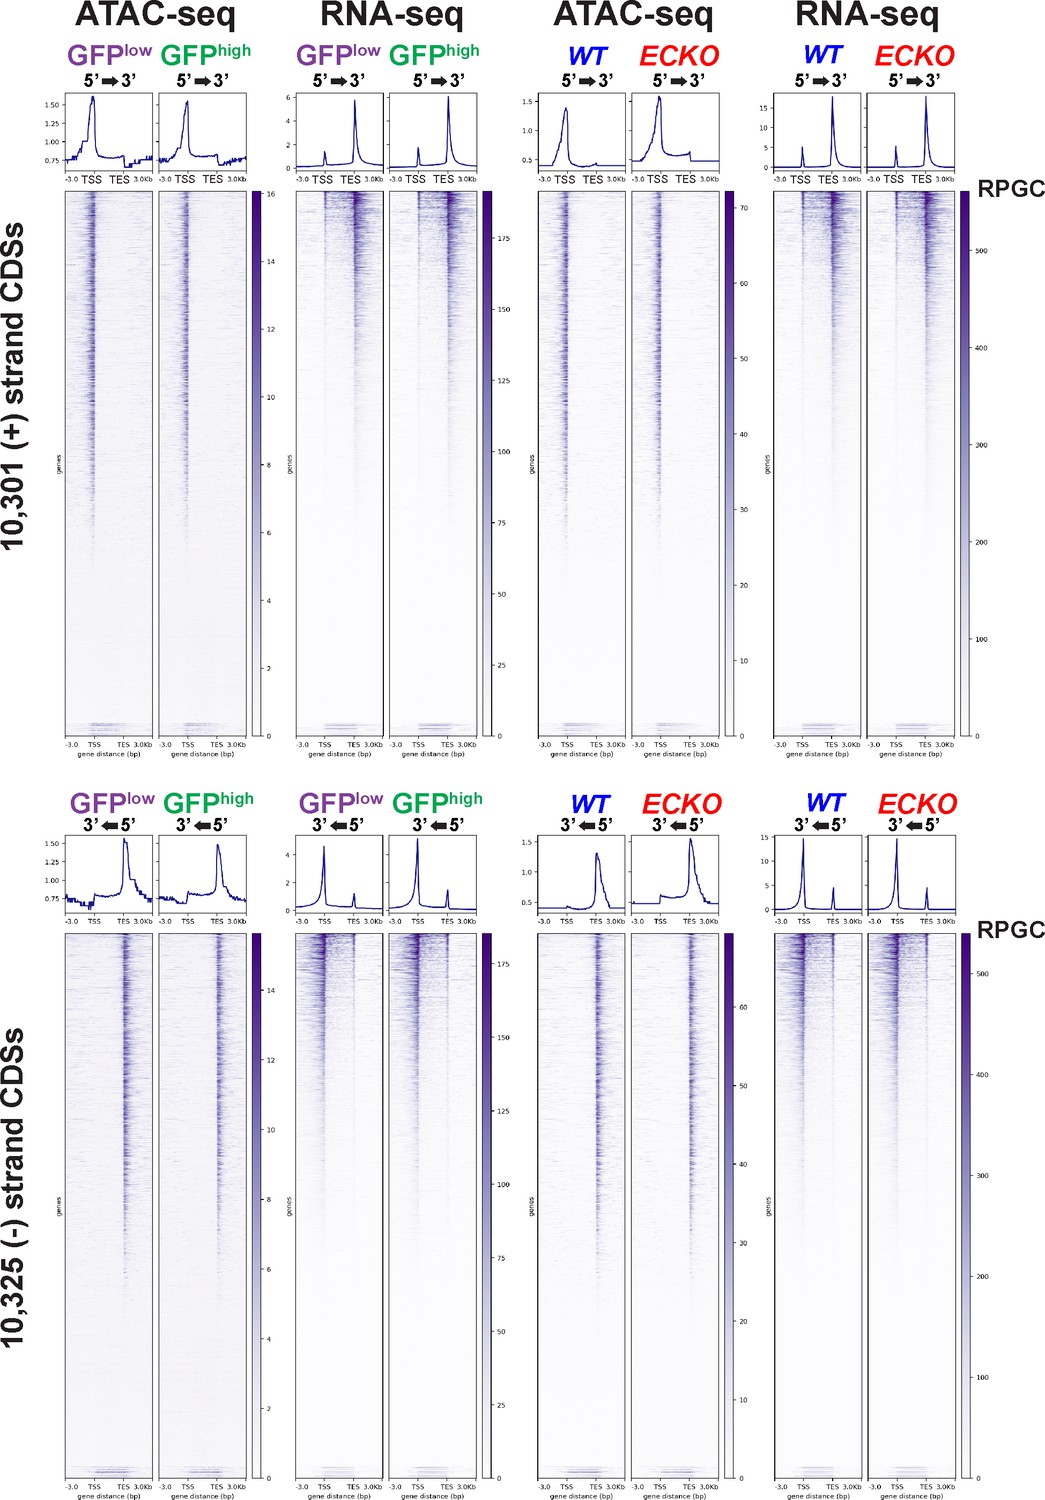
Genome-wide concordance between promoter-proximal chromatin accessibility and mRNA expression in sorted MAEC populations.
ATAC-seq and RNA-seq reads (RPGC-normalized) were examined from 3 kb upstream and 3 kb downstream of all UCSC-annotated CDS’s using the DeepTools ComputeMatrix function. Signal was generated in bin sizes of 50 bp and 100 bp for ATAC-seq and RNA-seq, respectively.
Figure 2—figure supplement 3
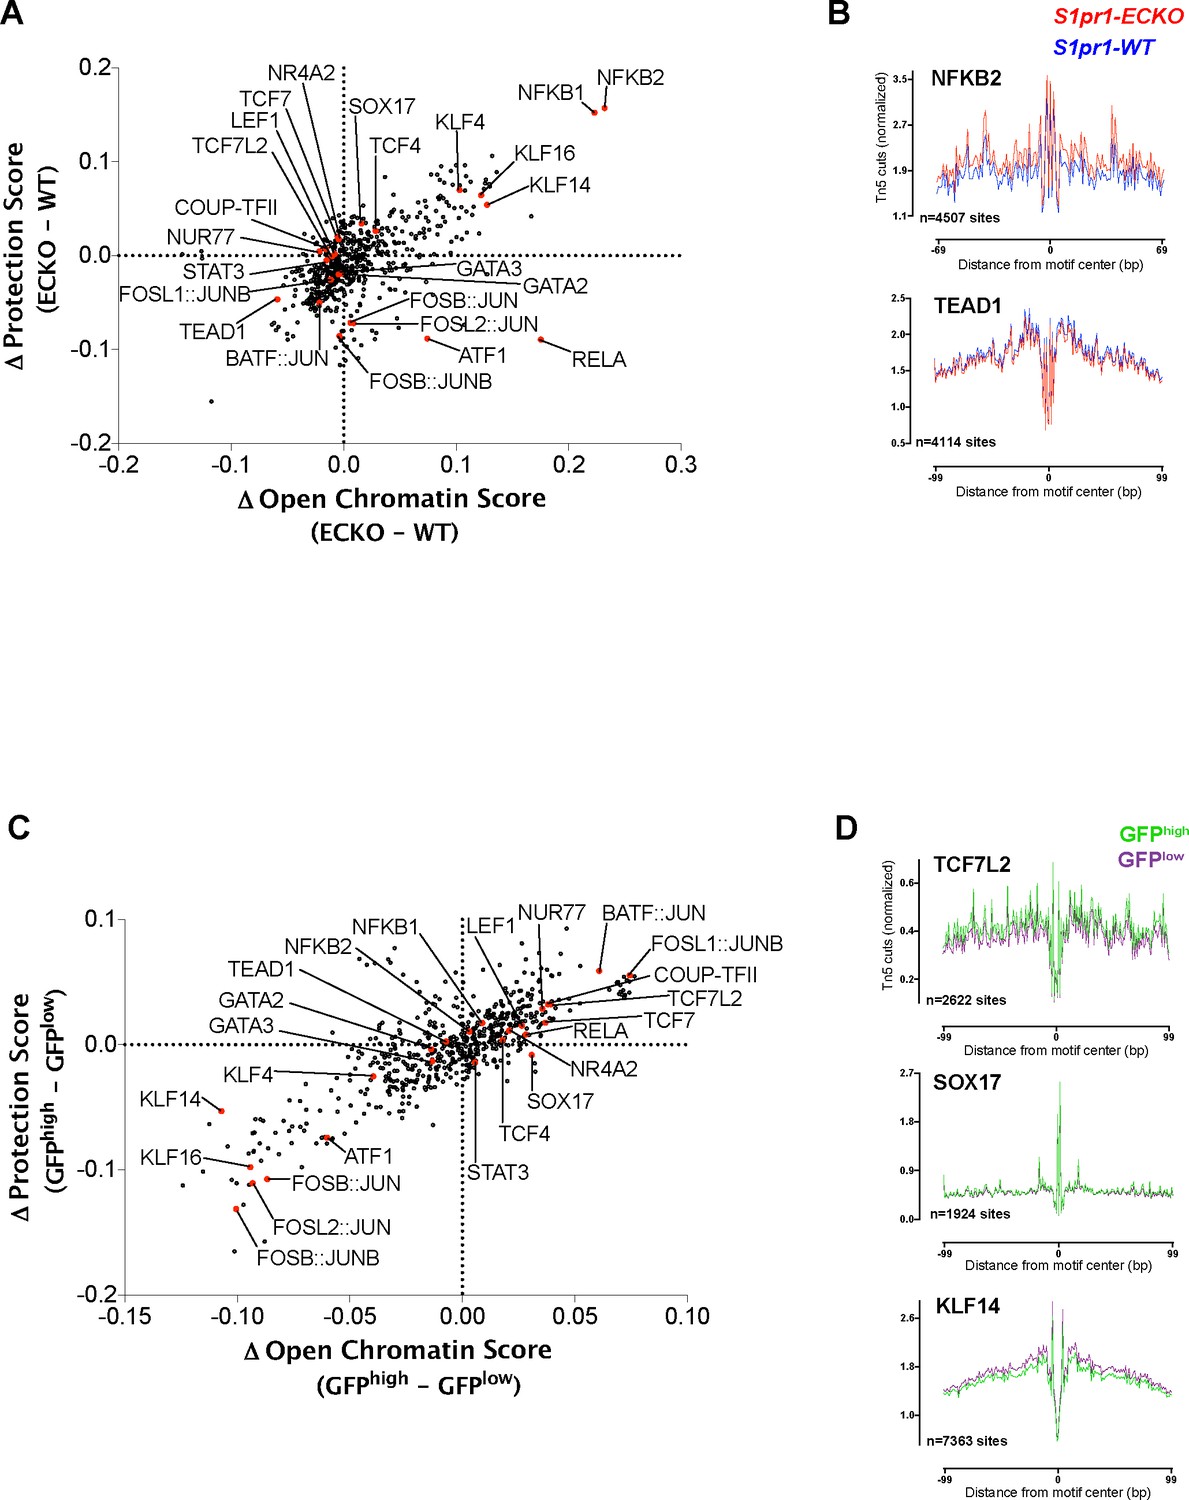
Genome-wide chromatin footprinting with HINT-ATAC.
(A) The change in chromatin accessibility scores between GFPhigh and GFPlow MAECs plotted against the change in protection scores for each of the 579 queried JASPAR motifs. (B) Lineplots of Tn5 cuts from GFPhigh and GFPlow MAECs averaged over the sites identified in (A) for TCF7L2, SOX17, and KLF14 motifs. (C) The same plot as (A) showing the differences between S1pr1 ECKO and S1pr1 WT MAECs. (D) Lineplots of Tn5 cuts from S1pr1 ECKO and S1pr1 WT MAECs averaged over the sites identified in (C) for NFKB2 and TEAD1 motifs.
Figure 3 with 4 supplements
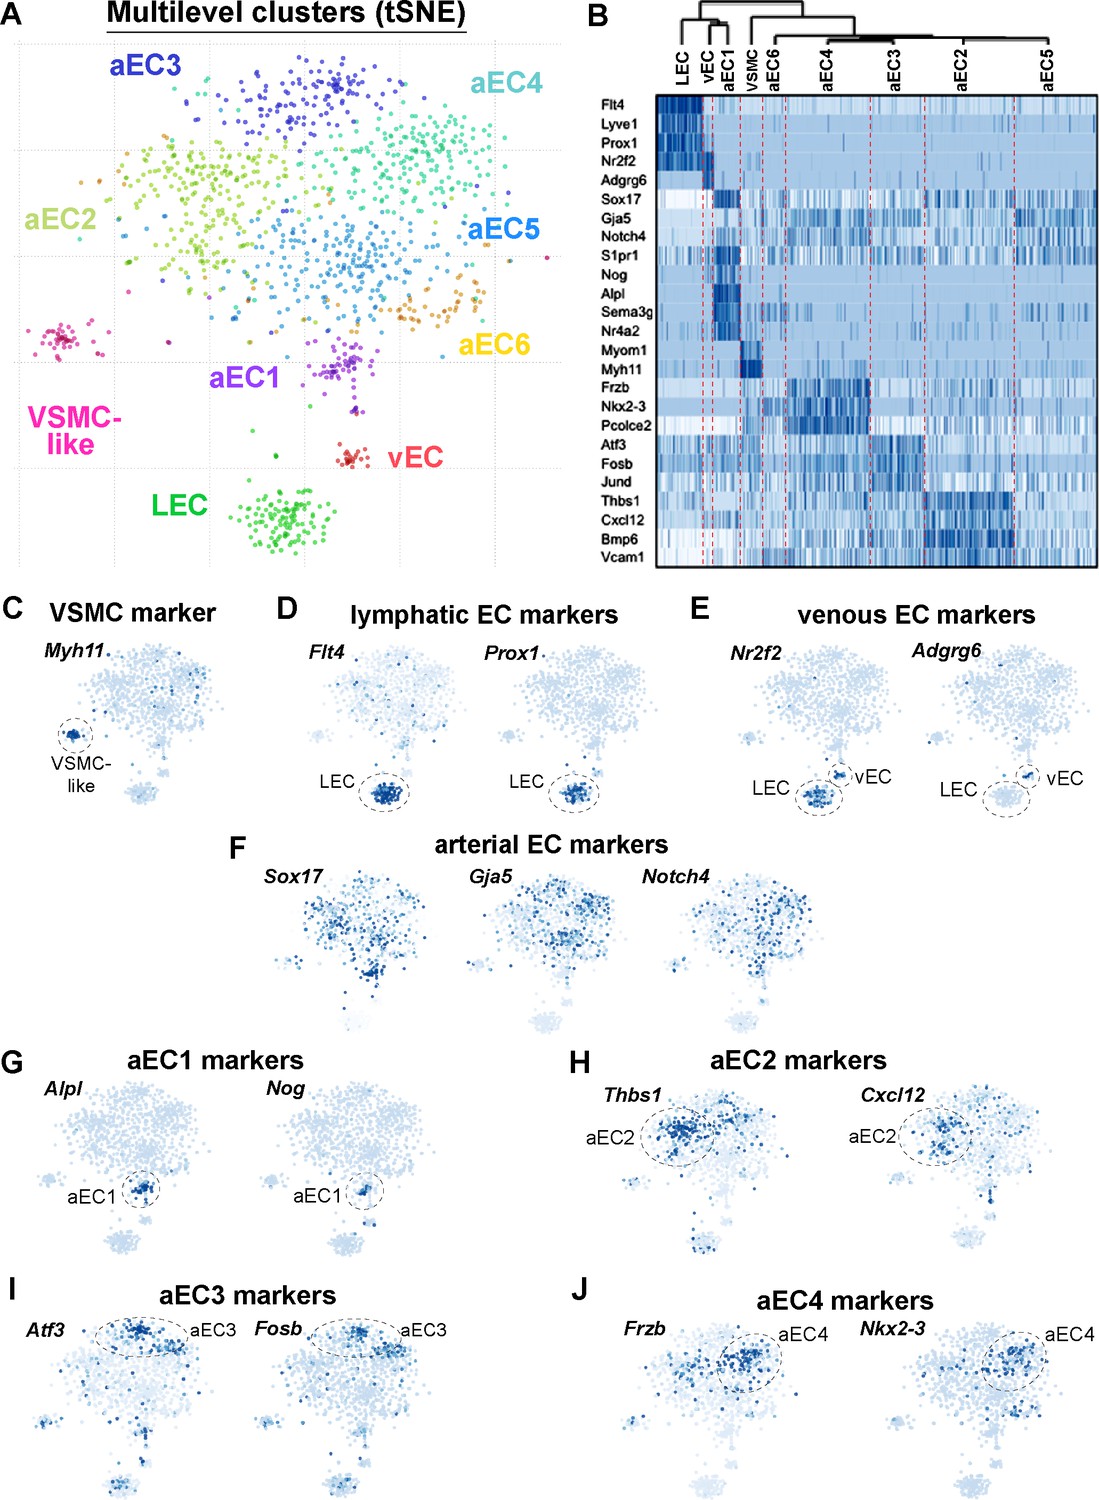
Single-cell RNA-sequencing of GFPhigh and GFPlow MAECs.
(A) t-SNE projection from Pagoda2 multilevel clustering of 767 GFPhigh and 384 GFPlow MAECs. Dash-line circles highlight each of the nine clusters identified. Cells and cluster names are color-coded according to cluster assignment. (B) Dendrogram from hierarchical clustering and expression heatmap of selected genes. The dendrogram (top) reveals an upstream split between LEC, vEC, aEC1 and aEC2, aEC3, aEC4, aEC5, and aEC6 populations. The heatmap shows the gradient of expression, from low (white) to high (dark blue), for a selection of transcripts with distinctive expression patterns. (C–F) Expression of transcripts specific to VSMCs (C) lymphatic ECs (D), venous ECs (E) and arterial ECs (F) are shown on the t-SNE embedding. (G–J) Representative transcripts enriched in arterial EC (aEC) clusters 1 (G), 2 (H), 3 (I) and 4 (J) are shown on the t-SNE embedding. MAECs used for scRNA-seq were isolated from two independent cohorts of S1PR1-GS mice.
Figure 3—figure supplement 1
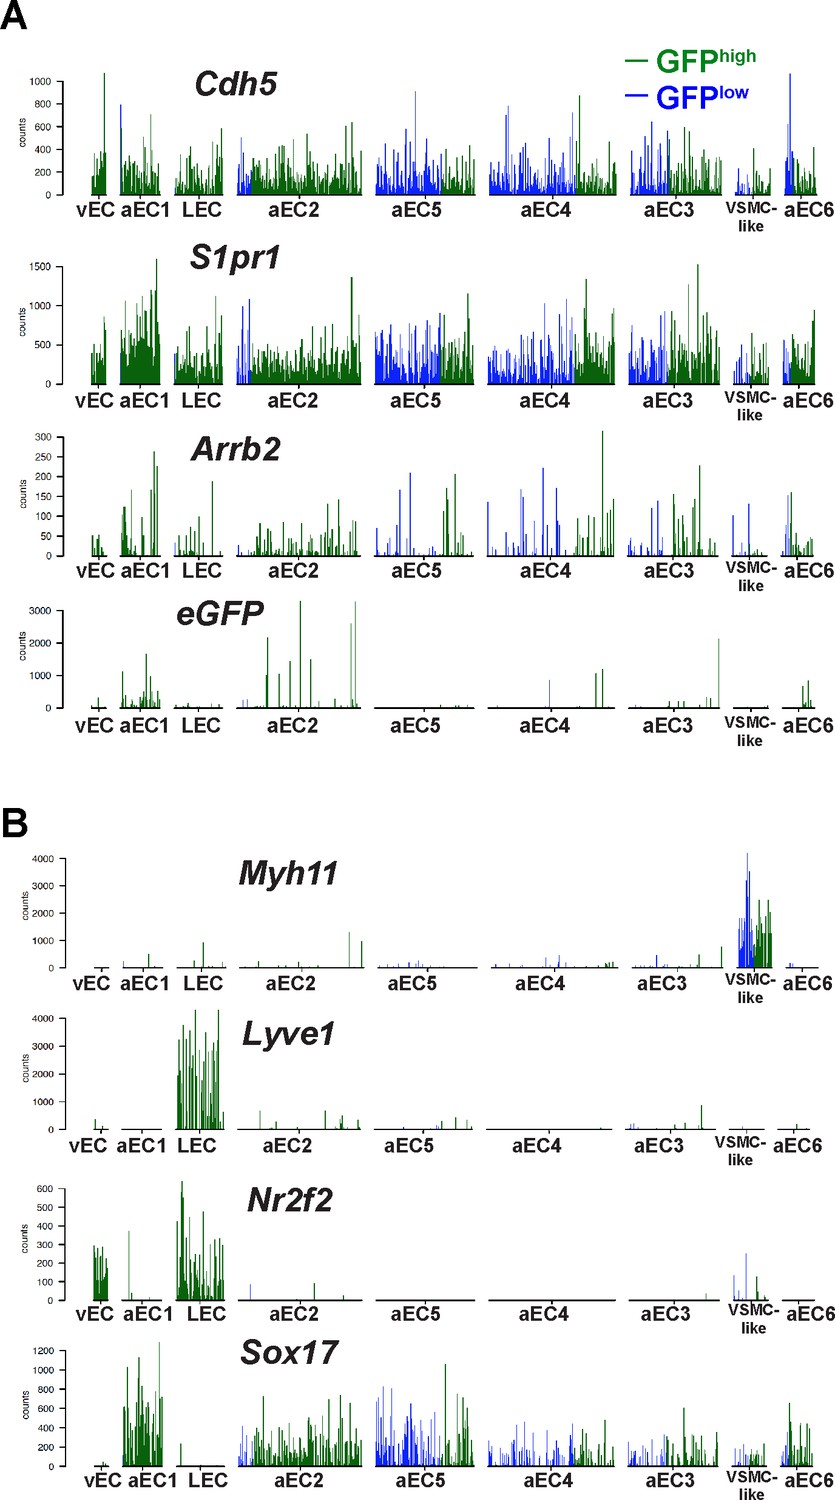
Expression of cluster-defining transcripts in single GFPhigh and GFPlow MAECs.
(A–B) Barplots of transcript counts for selected genes in individual GFPhigh and GFPlow MAECs cells. Each bar represents a single cell, either GFPhigh (green) or GFPlow (blue).
Figure 3—figure supplement 2
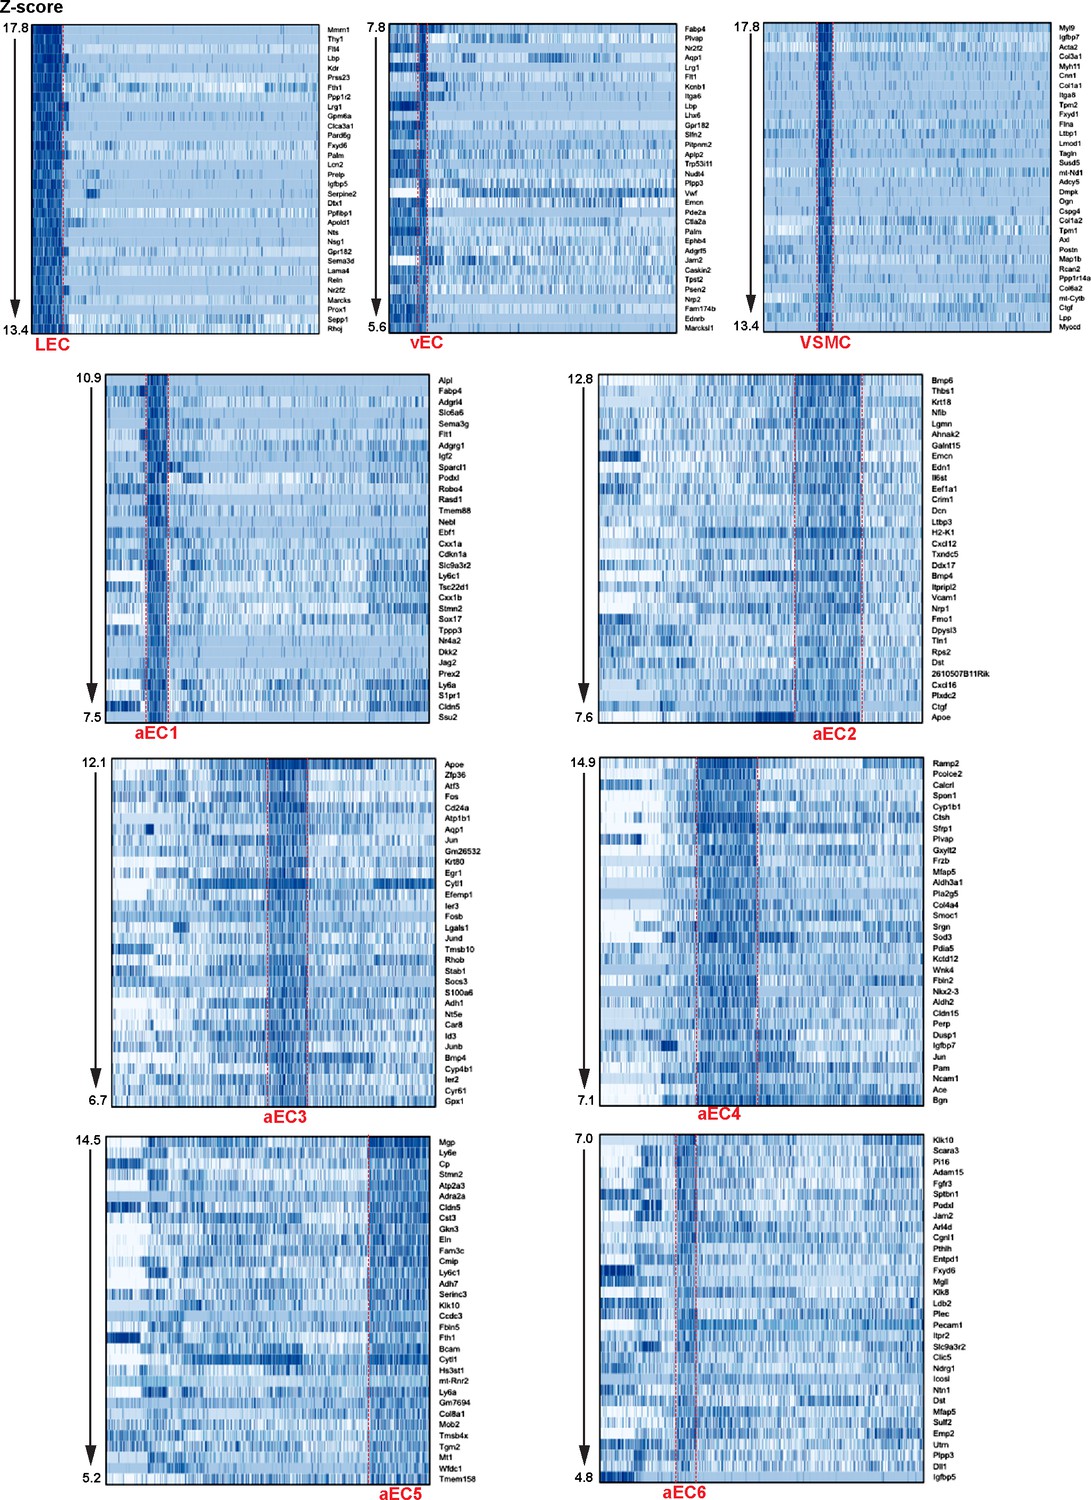
Top marker transcripts for each of the nine clusters defined by scRNA-seq analysis of GFPhigh and GFPlow MAECs.
Heatmaps (cells are clustered as shown in Figure 3B) illustrate expression of the top 32 most enriched transcripts in each cluster, according to Z-score.
Figure 3—figure supplement 3
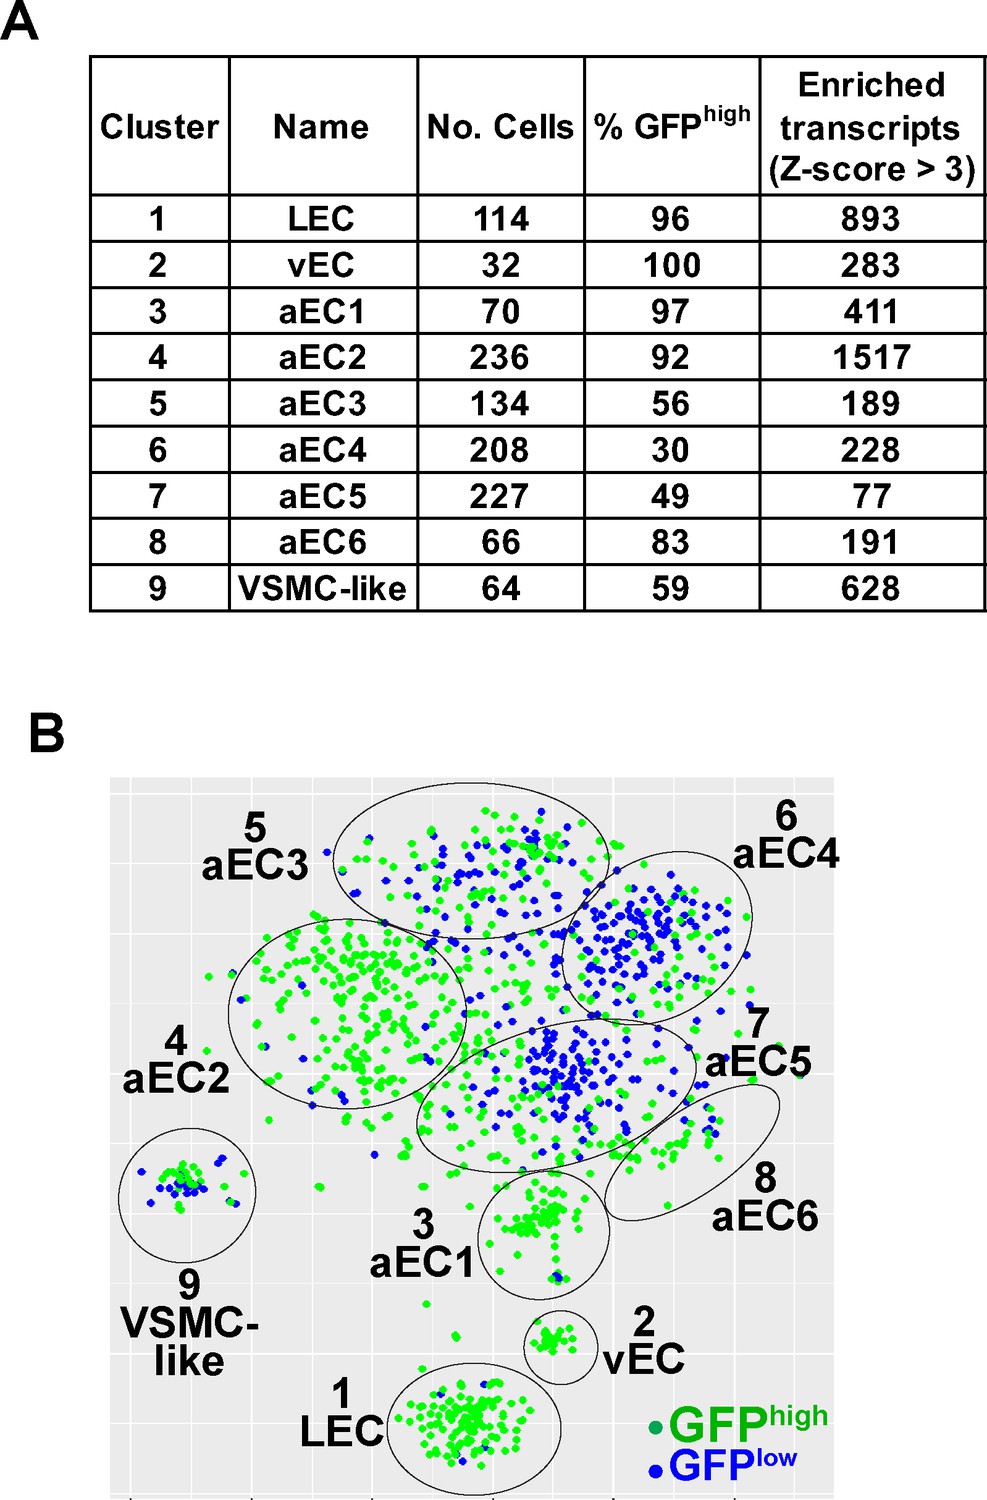
General features and nomenclature of the nine clusters defined by scRNA-seq analysis of GFPhigh and GFPlow MAECs.
(A) Table summarizing characteristics of the nine clusters (see Supplementary file 4). (B) tSNE projection of the embedding shown in Figure 1A with cells color-coded according to GFP expression.
Figure 3—figure supplement 4
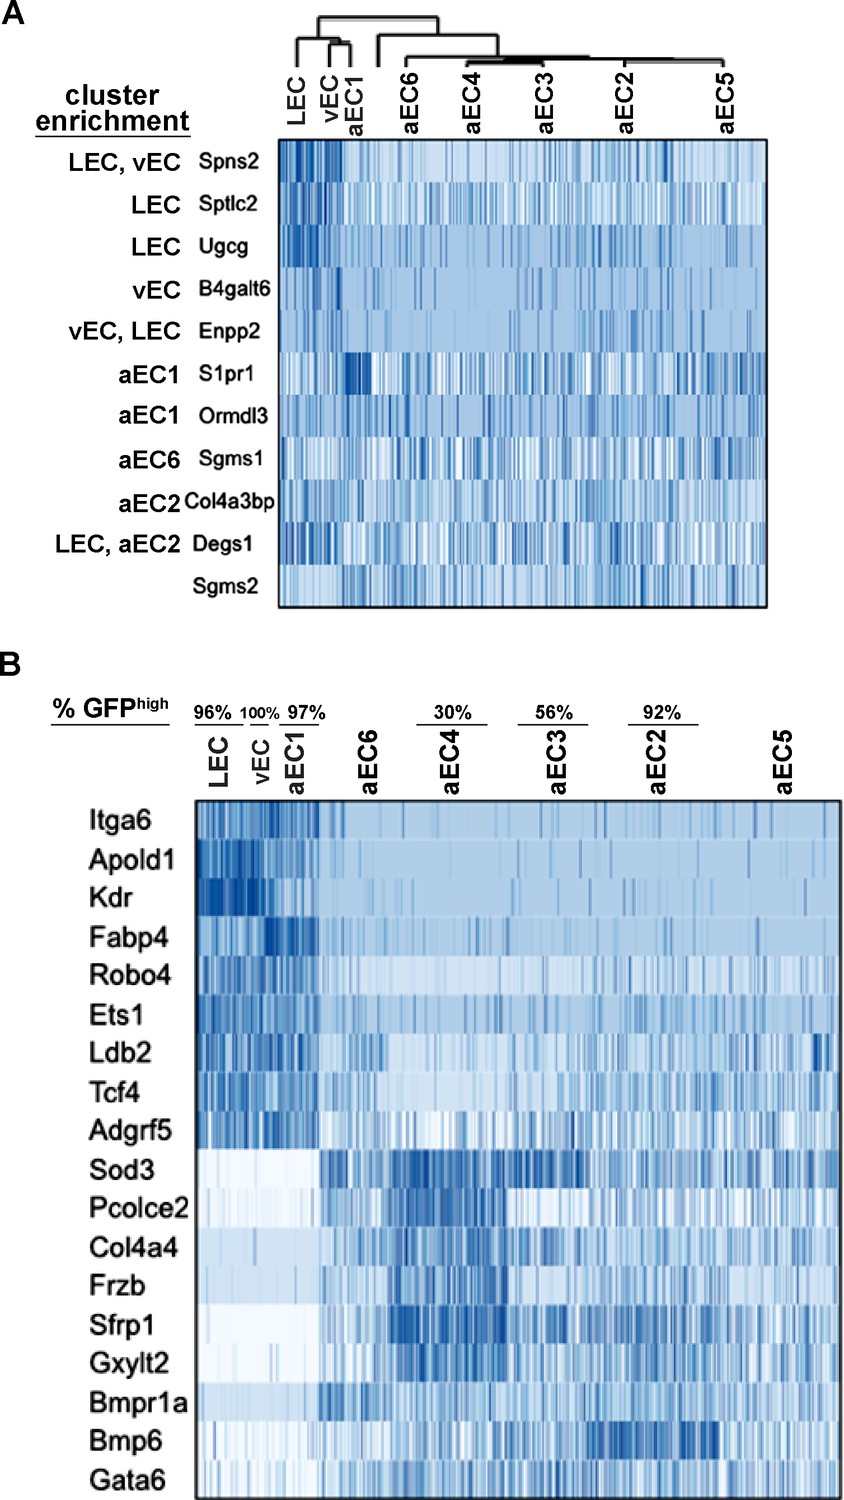
Transcripts co-enriched in LEC, vEC, and aEC1.
(A) Heatmaps of sphingolipid-related transcripts showing enrichment in one or multiple EC clusters. (B) Heatmaps of examples of transcripts co-enriched and co-depleted in LEC, vEC, and aEC1 versus aEC2-6. Genes enriched or depleted in each individual comparison were used for this analysis (See Supplementary file 4). Cell clustering is as shown in Figure 3B.
Figure 4 with 1 supplement
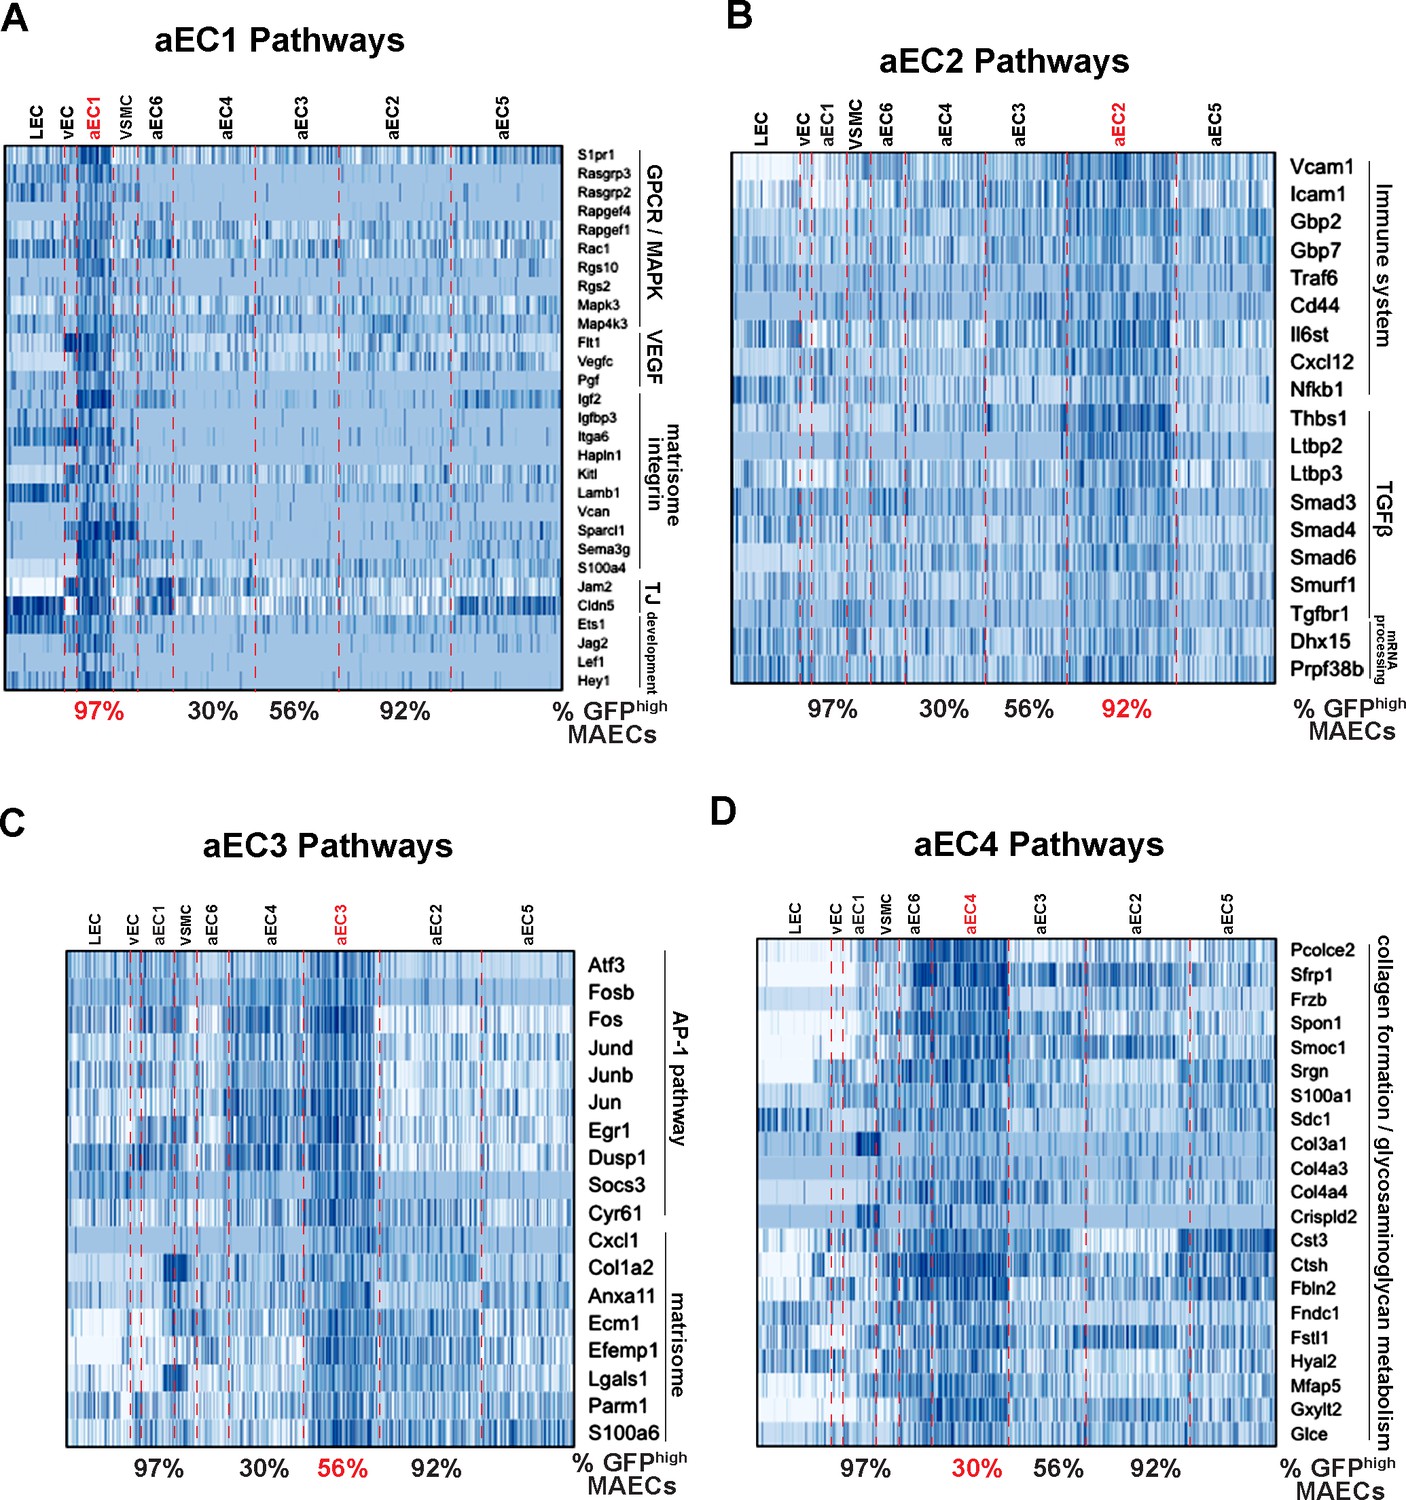
Functional annotation of arterial MAECs clusters aEC1, aEC2, aEC3, and aEC4.
(A–D) Selected pathways from GSEA analysis of cluster-enriched transcripts. Pathways enriched in aEC1 (A), aEC2 (B), aEC3 (C), and aEC4 (D) are shown with representeative transcripts identified in each pathway (see Supplementary file 5). The percent of GFPhigh cells in each of the four analyzed clusters are indicated at the bottom each heatmap.
Figure 4—figure supplement 1
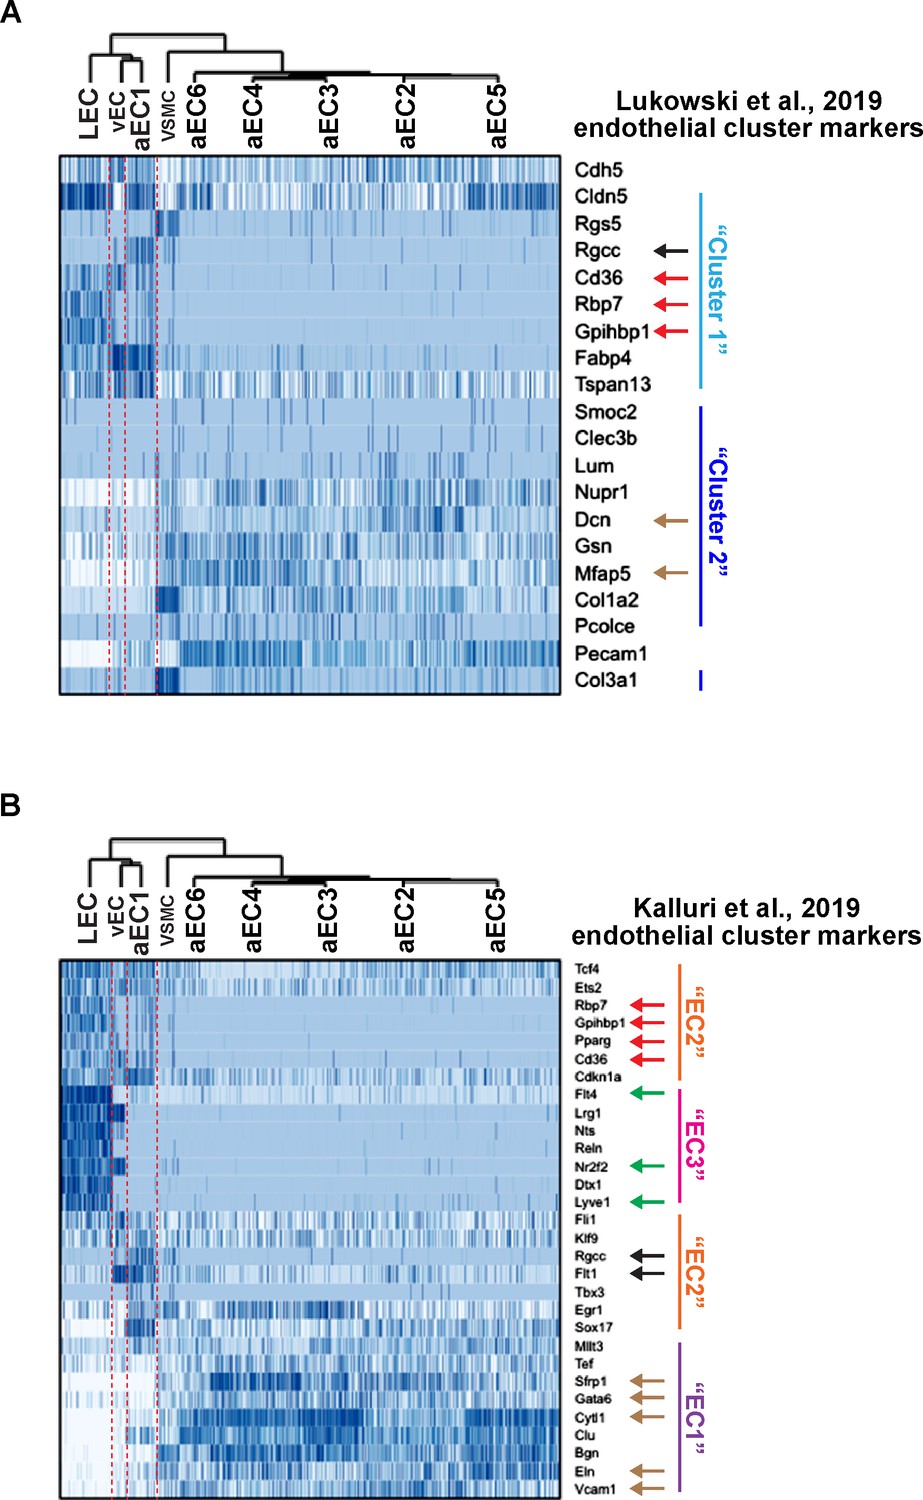
Expression of aortic EC cluster markers from Lukowski et al. (2019) and Kalluri et al. (2019) in LEC, vEC, and aEC1-6.
(A) Expression of ‘Cluster 1’ and ‘Cluster 2’ marker genes (Lukowski et al., 2019) in LEC, vEC, and aEC1-6. (B) Expression of ‘EC1’, ‘EC2’, and ‘EC3’ marker genes (Kalluri et al., 2019) in LEC, vEC, and aEC1-6. Black arrows indicate enrichment in aEC1, red arrows indicate enrichment in both LEC and aEC1, green arrows indicate enrichment in LEC, beige arrows indicate enrichment in aEC2-6 and depletion from LEC, vEC, and aEC1.
Figure 5 with 2 supplements
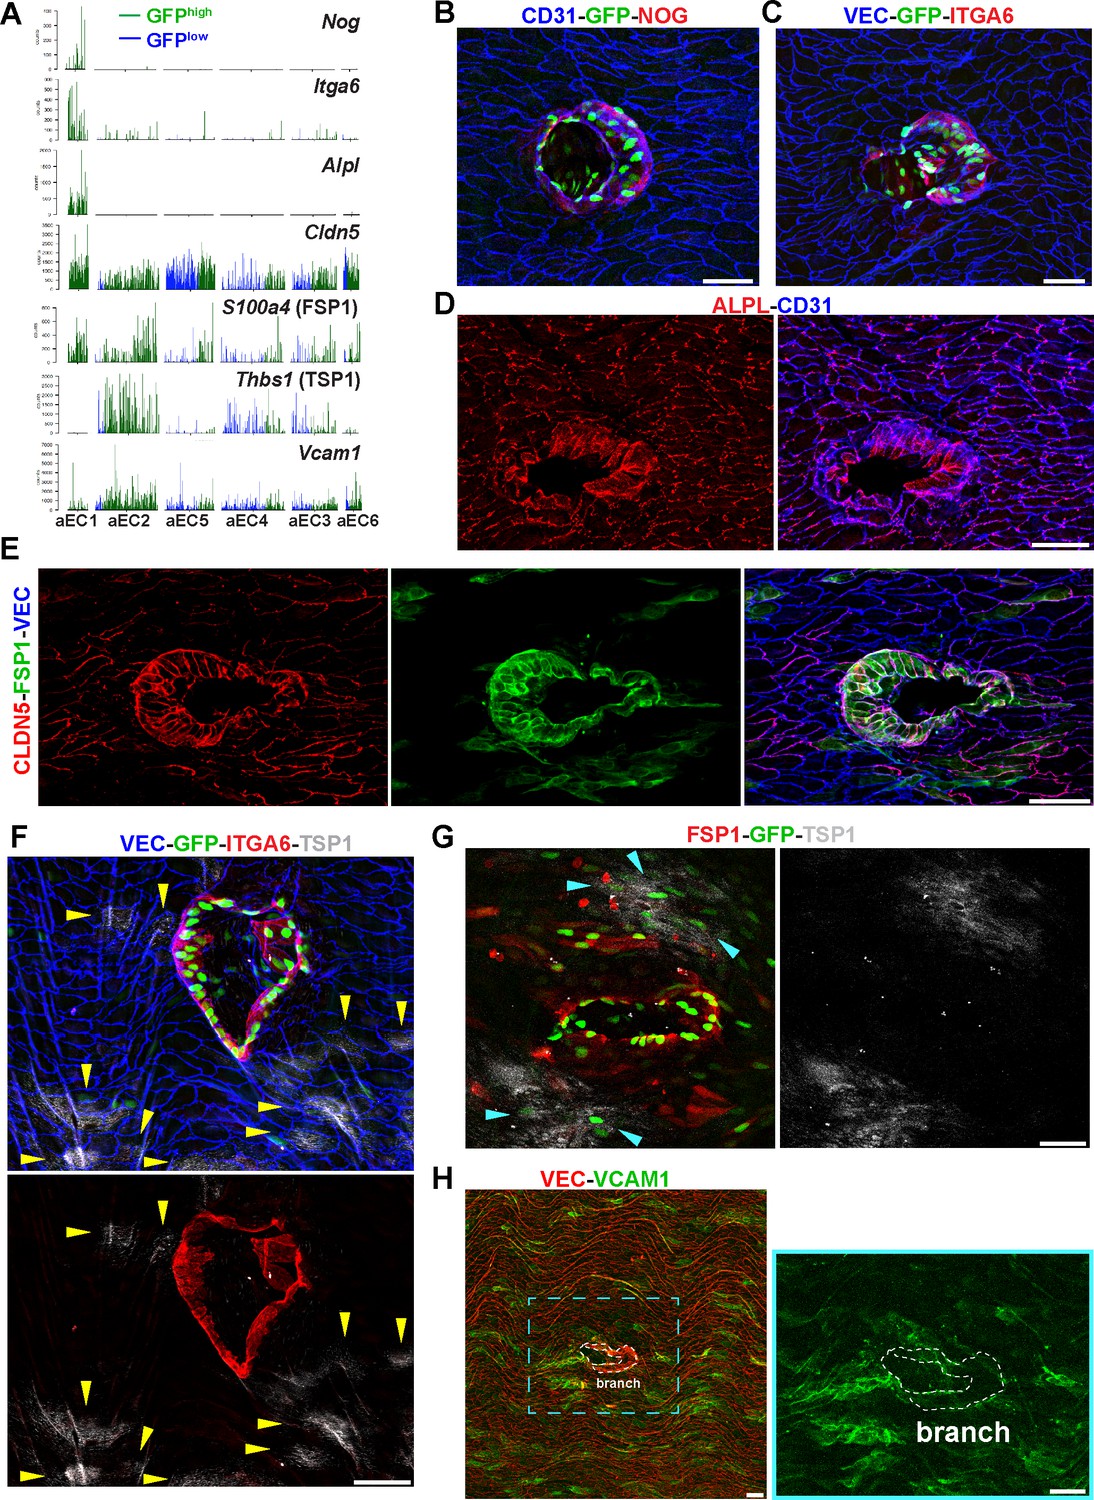
Identification of aEC1 as arterial ECs around the circumference of branch point orifices.
(A) Barplots of scRNA-seq read counts for Nog, Itga6, Alpl, Cldn5, S100a4, Thbs1, and Vcam1 in arterial EC clusters (aEC1-6). Each bar represents a single cell, either GFPhigh (green) or GFPlow (blue). (B–H) Confocal images of whole-mount en face preparations of mouse thoracic aortae centered on intercostal branch points. Immunostaining of S1PR1-GS mouse aortae for noggin (NOG) and CD31 (B), or integrin alpha-6 (ITGA6) and VE-Cadherin (VEC) (C). Immunostaining of C57BL/6J mouse aortae for CD31 and alkaline phosphatase, tissue-nonspecific isozyme (ALPL) (D) or claudin-5 (CLDN5), FSP1 (S100A4), and VEC (E). (F) Immunostaining of S1PR1-GS mouse aorta for ITGA6, thrombospondin 1 (TSP1), and VEC. Yellow arrows indicate TSP1+ ECs. (G) Immunostaining of an S1PR1-GS mouse aorta for FSP1 and TSP1. The circumference of an intercostal branch point harbors FSP1+GFP+ cells, wereas TSP1+GFP+ cells (cyan arrows) are distal from the circumference of the branch point orifice. (H) Immunostaining of a mouse aorta for vascular cell adhesion molecule 1 (VCAM1) and VEC. Two rows of cells exhibiting the morphology and VEC-localization of cells around branch point orifices are outlined. Images are representative of observations from 3 (B, C, E–H) and 2 (D) mice. Scale bars are 50 µM.
Figure 5—figure supplement 1
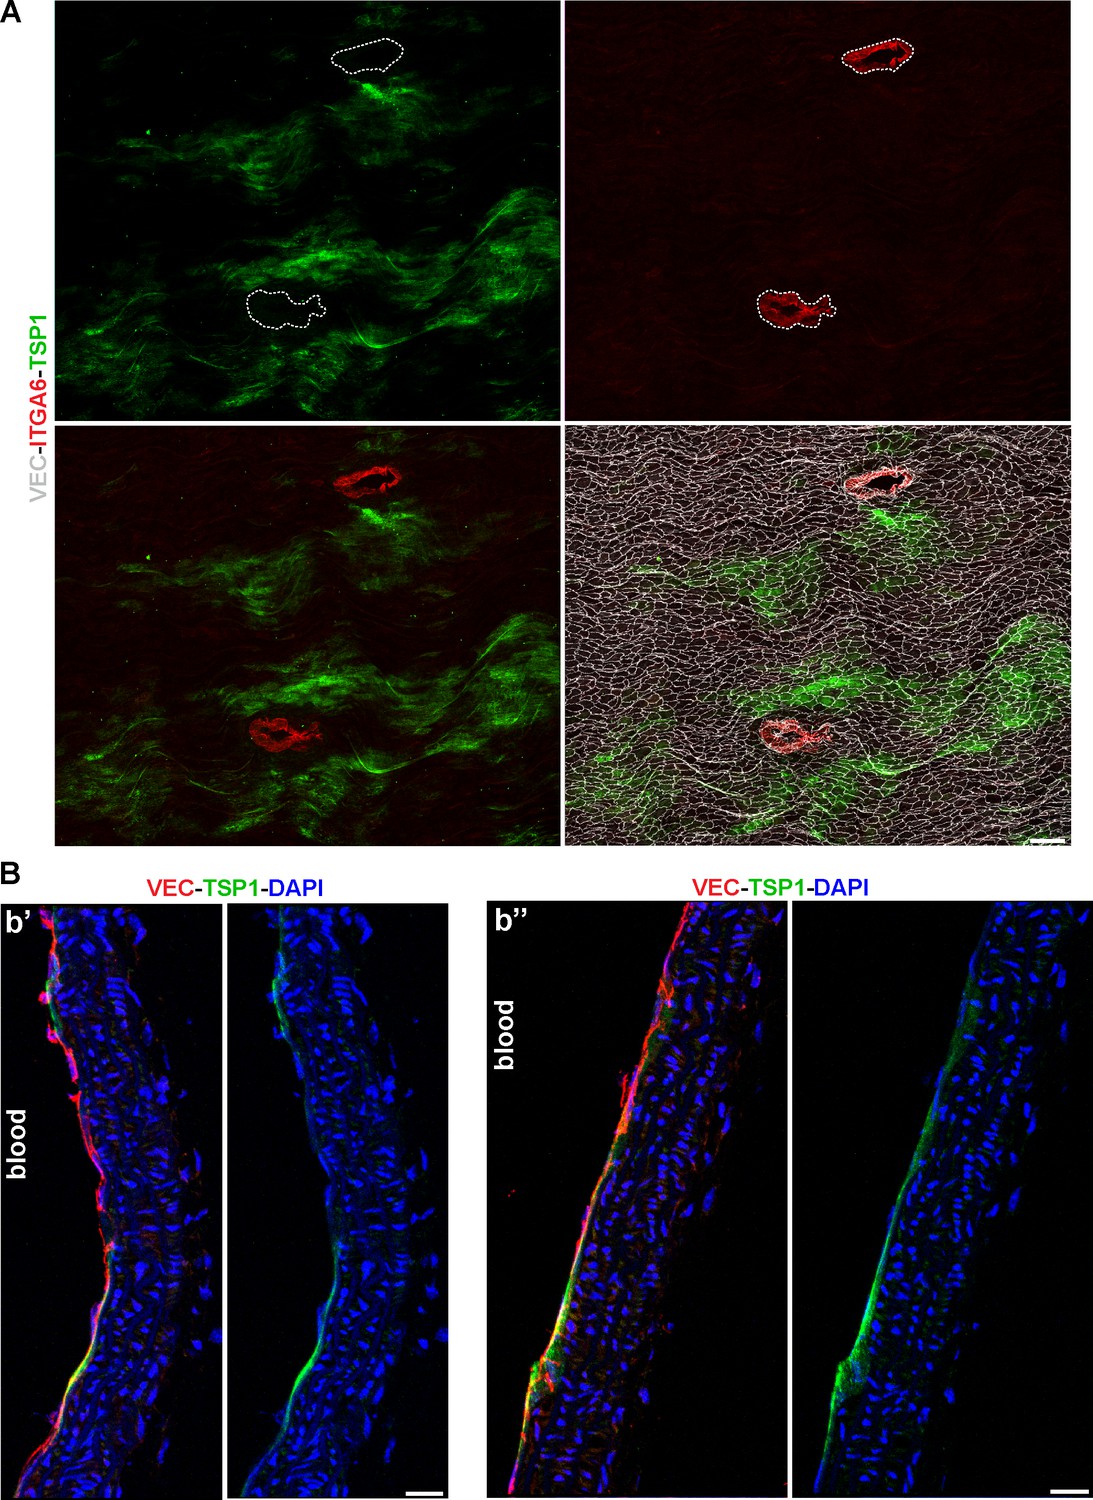
Patchy TSP1 immunoreactivity is endothelial and excluded from thoracic branch point orifices.
(A) Whole-mount en face preparation of a mouse thoracic aorta immunostained for ITGA6, TSP1, and VEC. Scale bar is 200 µM. (B) Two sagittal sections (b’ and b’’) of a mouse thoracic aorta demonstrate TSP1 expression in VEC+ arterial ECs. Sections were counterstained with DAPI to image nuclei. Scale bars are 20 µM.
Figure 5—figure supplement 2
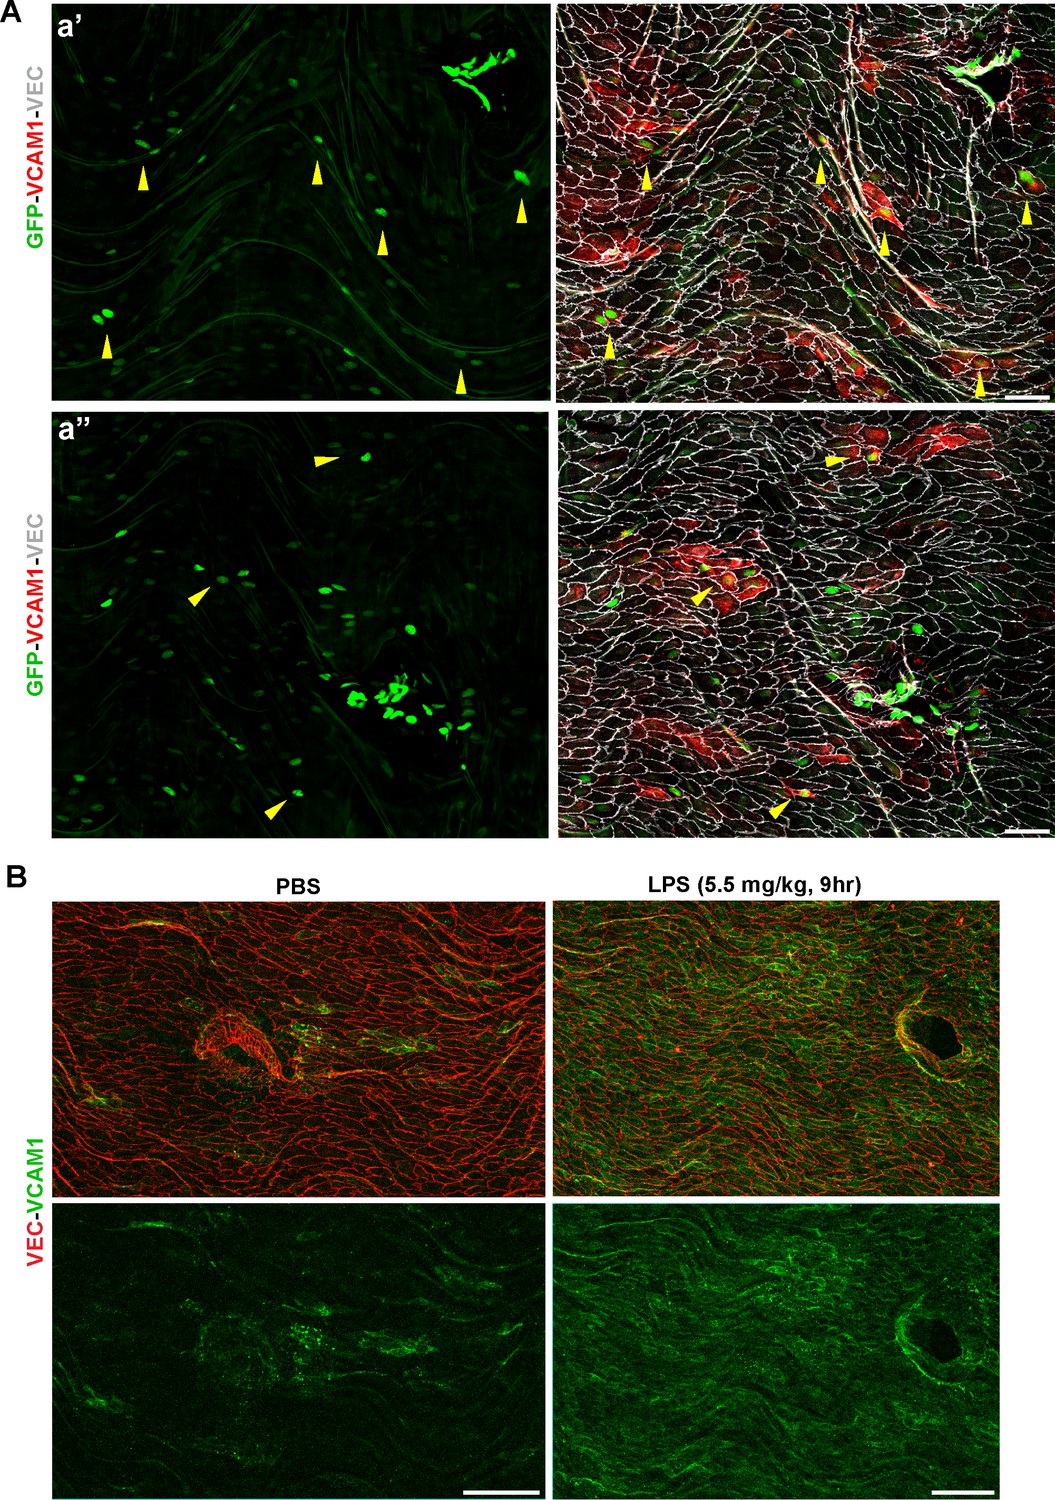
VCAM1 is LPS-inducible and expression is observed in GFP+ ECs distal from thoracic branch point orifices.
(A) Two fields (a’ and a’’) of whole-mount en face preparations from S1PR1-GS mouse thoracic aortae immunostained for VCAM1 and VEC. Yellow arrows indicate VCAM1+ GFP+ ECs distal from the branch point orifice. Scale bars are 50 µM. (B) Intraperitoneal administration of LPS (5.5 mg/kg, 9 hr) results in uniform VCAM1 induction in aortic ECs, visualized by VCAM1 and VEC immunostaining of thoracic aorta whole-mount en face preparations. Scale bars are 100 µM. Images are representative of observations from three mice (A) and 2 pairs of mice (B).
Figure 6
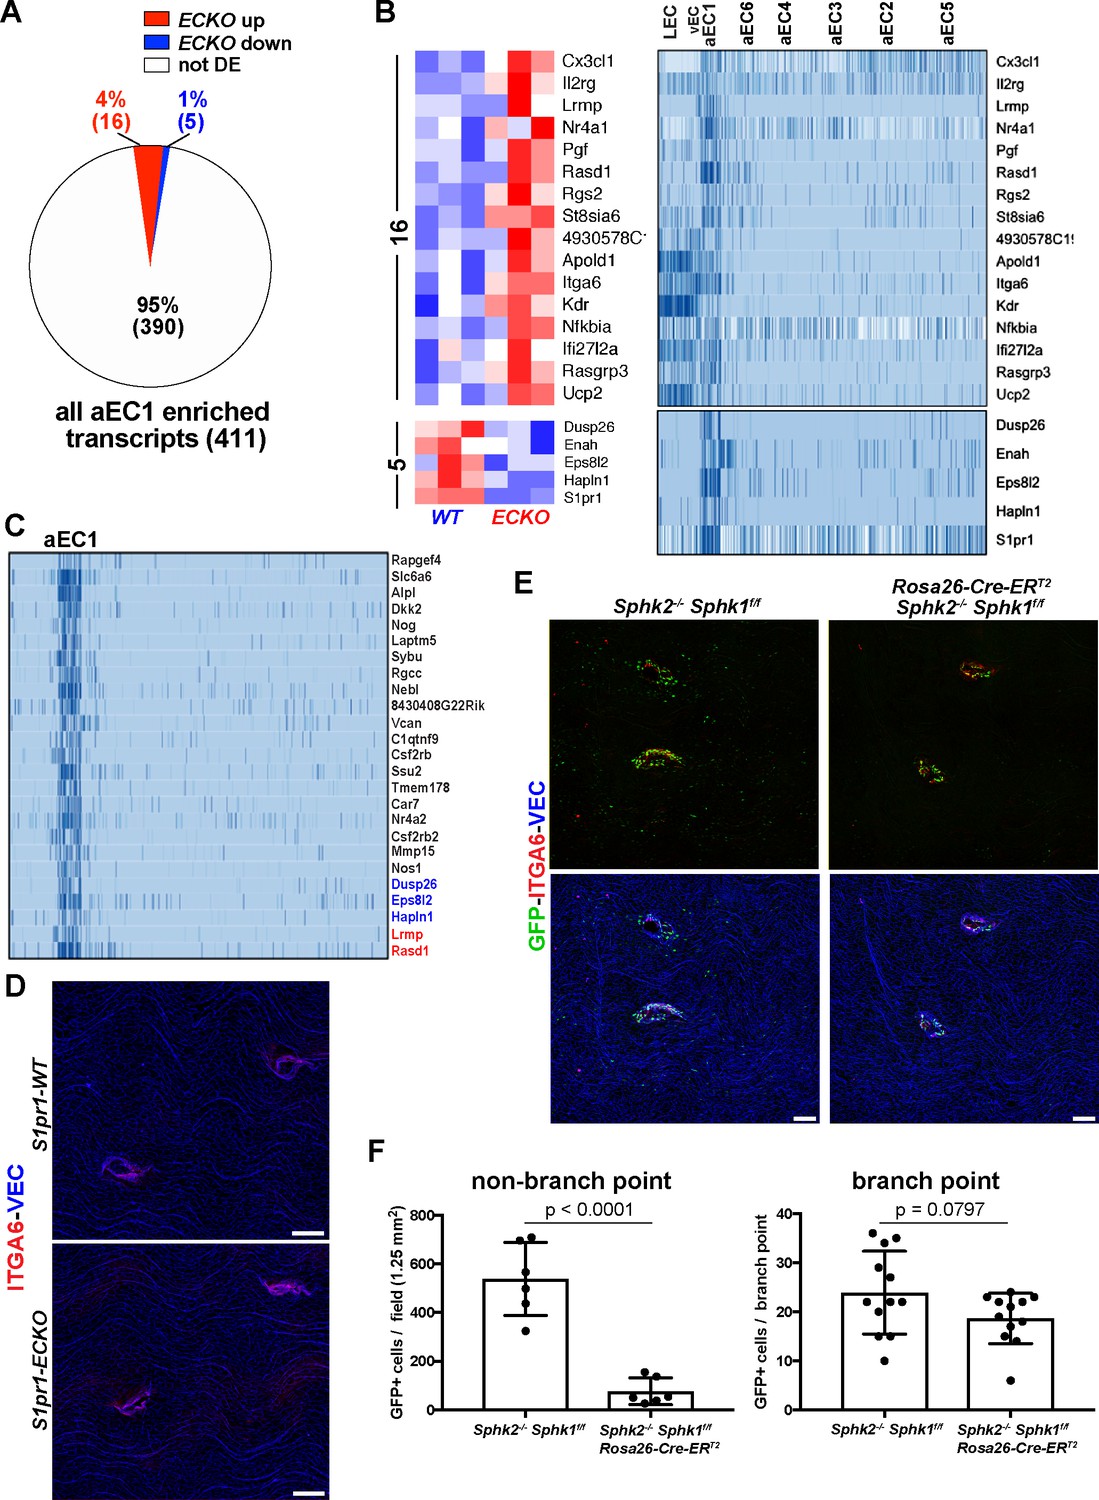
Gene expression in aEC1 cells is largely independent of S1P/S1PR1 signaling.
(A) Pie chart of all aEC1-enriched transcripts (versus aEC2-6) indicating those which were also differentially expressed in S1pr1 ECKO MAECs. (B) Heatmap (row Z-scores) of the 20 transcripts that were both S1PR1-regulated and aEC1-enriched (left). Expression of these transcripts in each cluster from scRNA-seq analysis is shown (right). (C) Gene expression in aEC1 was compared to all ECs (LEC, vEC, and aEC2-6 collectively). All transcripts expressed greater than 16-fold higher in aEC1 are shown (25 transcripts total). Red, blue and black transcript names indicate up-regulated, down-regulated or similar levels of expression in S1pr1 ECKO MAECs, respectively. (D) Immunostaining of S1pr1 ECKO and WT aortae whole-mount en face preparations for ITGA6 and VEC. Images are representative of observations from 2 pairs of animals (N = 2). (E) ITGA6 and VEC immunostaining of whole-mount en face preparations of thoracic aortae from S1PR1-GS mice bearing Sphk2-/- Sphk1f/f or Sphk2-/-Sphk1 f/fRosa26-Cre-ERT2 alleles. (F) Quantification and statistical analyses (unpaired t-test) of GFP+ EC at branch point (12 branches) and non-branch point (six fields) locations from 2 pairs of mice (N = 2). Quantified fields are as shown in (E). Branch point EC were defined as cells included in the first three rows around the edge of orifices. Only GFP+ EC in the same Z-plane as surrounding arterial EC were counted (GFP+ EC of intercostal arteries were in a different Z-plane and therefore were not counted as branch point EC). Scale bars are 100 µM.
Figure 7 with 5 supplements
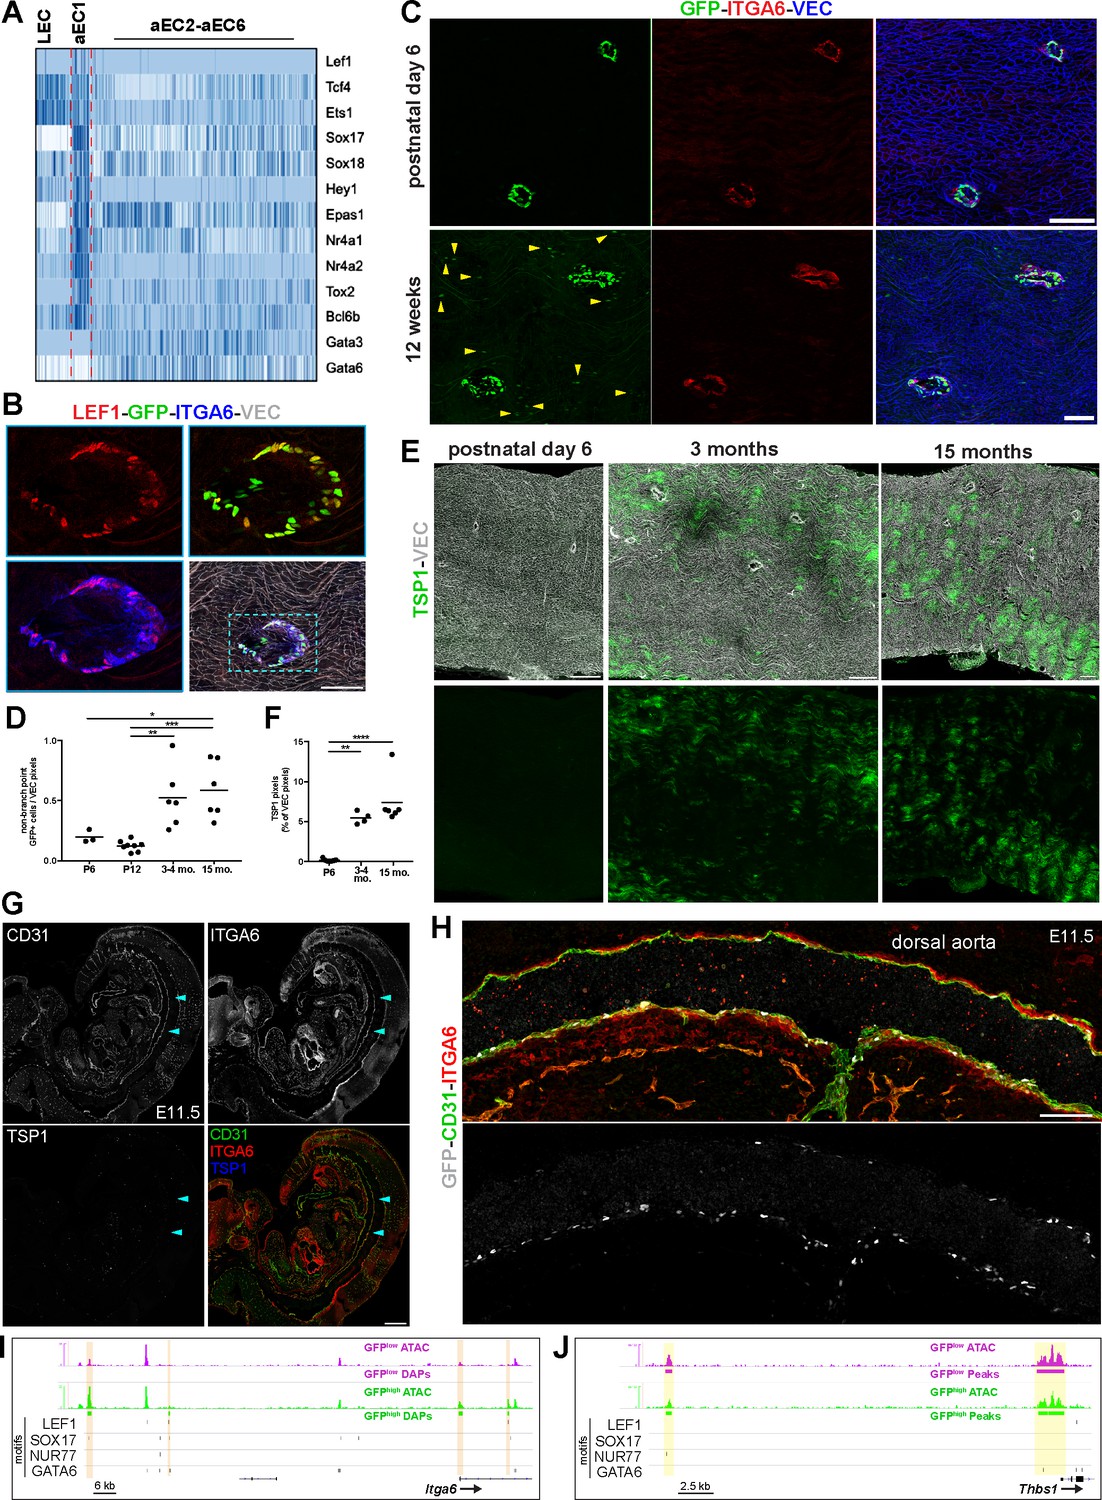
Spatio-temporal and molecular differences between branch point-specific arterial EC cluster aEC1 and non-branch point ECs.
(A) Heatmap of selected transcription factors enriched and depleted in aEC1 cells (see also Figure 7—figure supplement 1A). (B) Immunostaining of an S1PR1-GS mouse thoracic aorta for lymphoid enhancer-binding factor 1 (LEF1), ITGA6, and VEC. Image is representative of observations from two mice. Scale bar is 100 µM. (C) Immunostaining of postnatal day 6 (P6) (n = 2) and 12 week (n = 3) S1PR1-GS mice thoracic aortae for ITGA6 and VEC. Arrows indicate non-branch point GFP+ EC. Scale bars are 100 µM. (D) Quantification of non-branch point GFP+ EC in thoracic aorta en face preparations from P6 (n = 2), P12 (n = 3), 3–4 month-old (n = 3), and 15 month old (n = 2) mice. Each dot is a field. Representative fields are shown in Figure 7—figure supplement 2. Non-branch point GFP pixels were normalized to total VEC pixels per field. One-way ANOVA followed by Bonferroni’s post hoc test, *P = 0.04; **P = 0.04; ***P = 0.0008. (E) Representative images of TSP1 and VEC immunostaining of thoracic aorta en face preparations from P6, 3 month old, 15 month old mice. Scale bars are 200 µM. (F) Quantification of TSP1 pixels normalized to total VEC pixels per field from P6 (n = 3), 3 month old (n = 2), and 15 month old (n = 2) mice. One-way ANOVA followed by Bonferroni’s post hoc test, **P = 0.001; ****P < 0.0001. (G) Sagittal cryosection (14 µM) of an E11.5 S1PR1-GS mouse embryo immunostained for CD31, ITGA6, and TSP1. Arrows indicate the dorsal aorta. Scale bar is 500 µM. (H) The dorsal aorta at higher magnification with CD31, ITGA6, and GFP channels shown. Scale bar is 100 µM. (G) and (H) are representative of observations from two embryos. (I–J) Genome browser image of GFPhigh and GFPlow MAECs ATAC-seq signal (RPGC normalized) at Itga6 and Thbs1 (TSP1) loci. Peaks with increased accessibility in GFPhigh MAECs (GFPhigh DAPs) are indicated in (I). All GFPhigh and GFPlow MAECs peaks are shown in (J). All LEF1, nuclear receptor subfamily four group A member 1 (NUR77), transcription factor SOX-17 (SOX17), and transcription factor GATA-6 (GATA6) motifs identified in consensus peaks (Figure 2A) are also shown. Orange bars in (I) highlight GFPhigh MAECs DAPs containing LEF1, SOX17, and/or NUR77 motifs. Yellow bars in (J) highlight peaks containing GATA6 motifs.
Figure 7—figure supplement 1
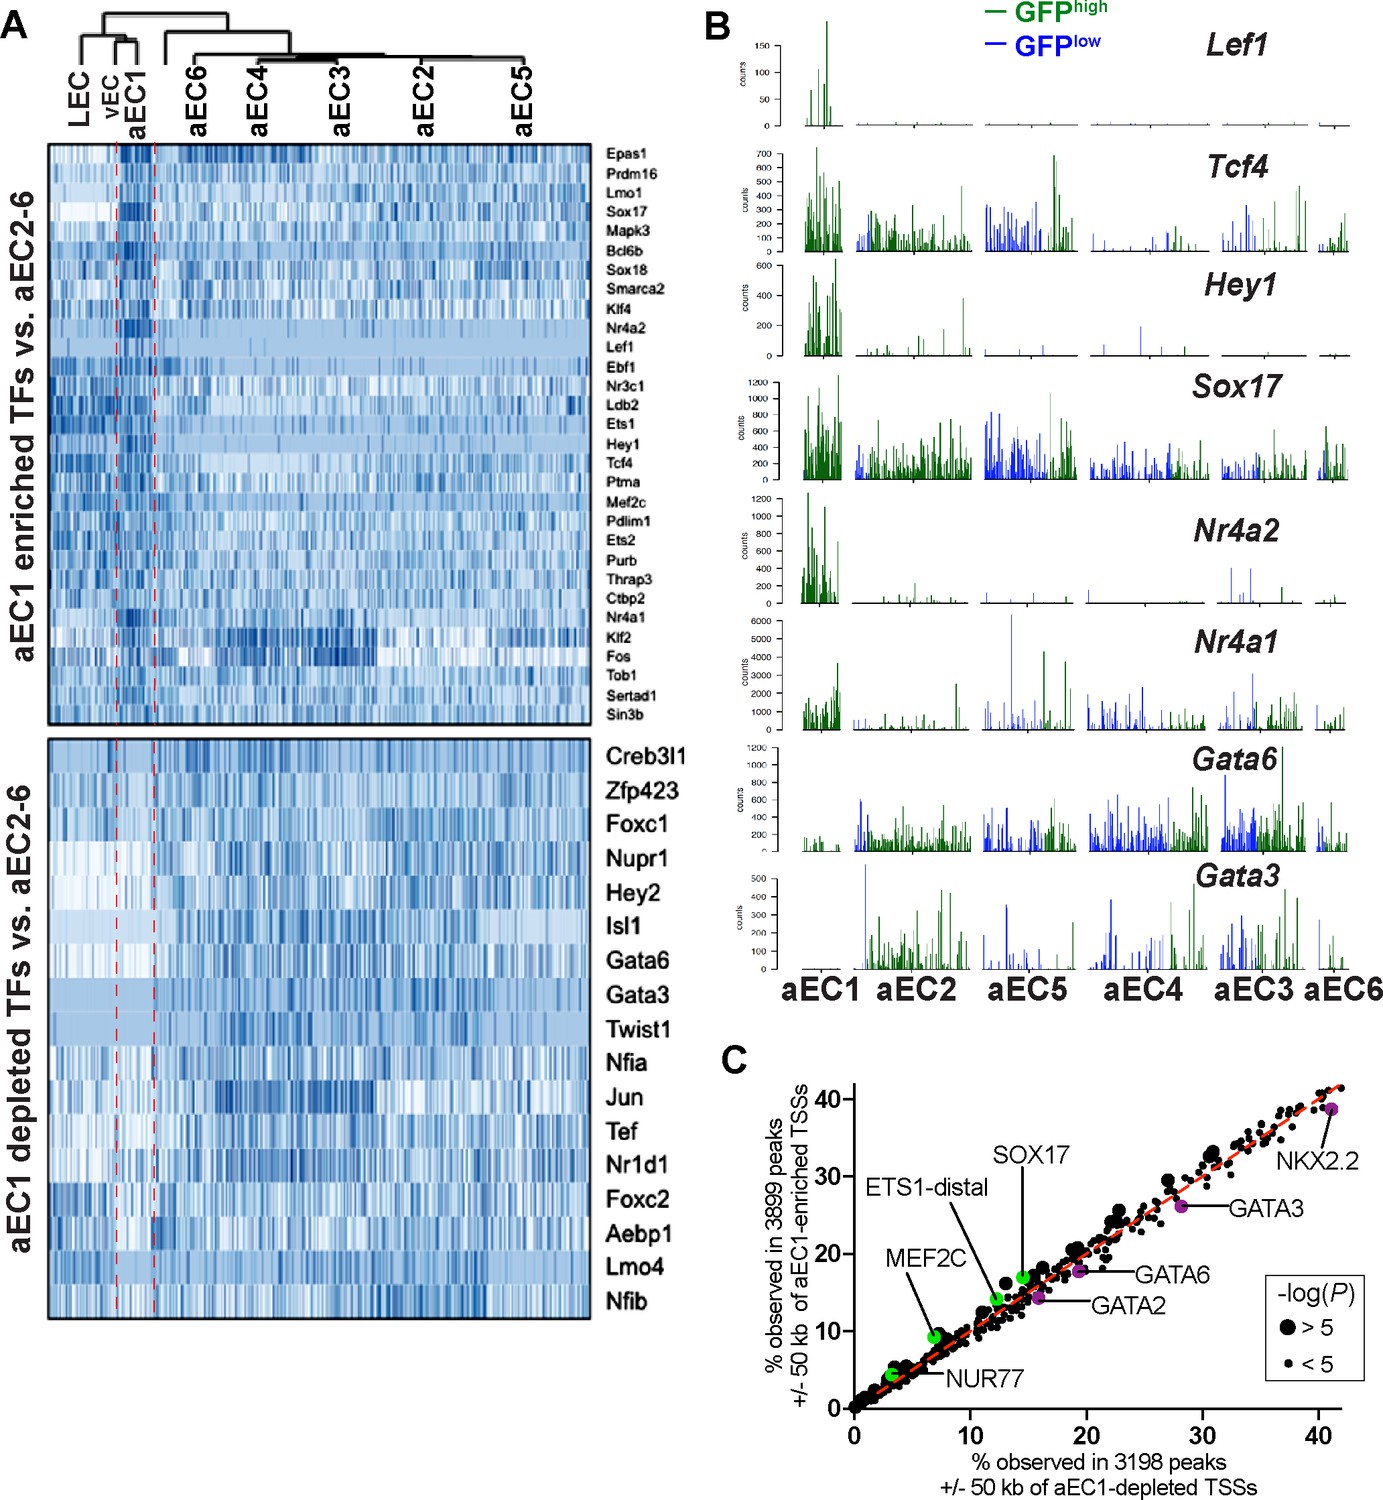
Transcription factors enriched and depleted in aEC1 cells.
(A) Heatmaps (cells are clustered as shown in Figure 3B) illustrate expression of transcription factors (TFs) enriched or depleted from aEC1 relative to aEC2-6. (B) Barplots illustrate transcript counts of selected TFs from (A) in arterial EC clusters aEC1-6. Each bar represents a single cell, either GFPhigh (green) or GFPlow (blue). (C) Transcription factor bonding motif enrichment analysis of genomic regions near aEC1 genes. The HOMER script ‘findmotifsgenome.pl’ was used for motif enrichment analysis of merged GFPhigh and GFPlow peaks that intsersected a 100 kb window centered on aEC1-enrichd (Z-score >3) and depleted (Z-score < −3) TSSs.
Figure 7—figure supplement 2
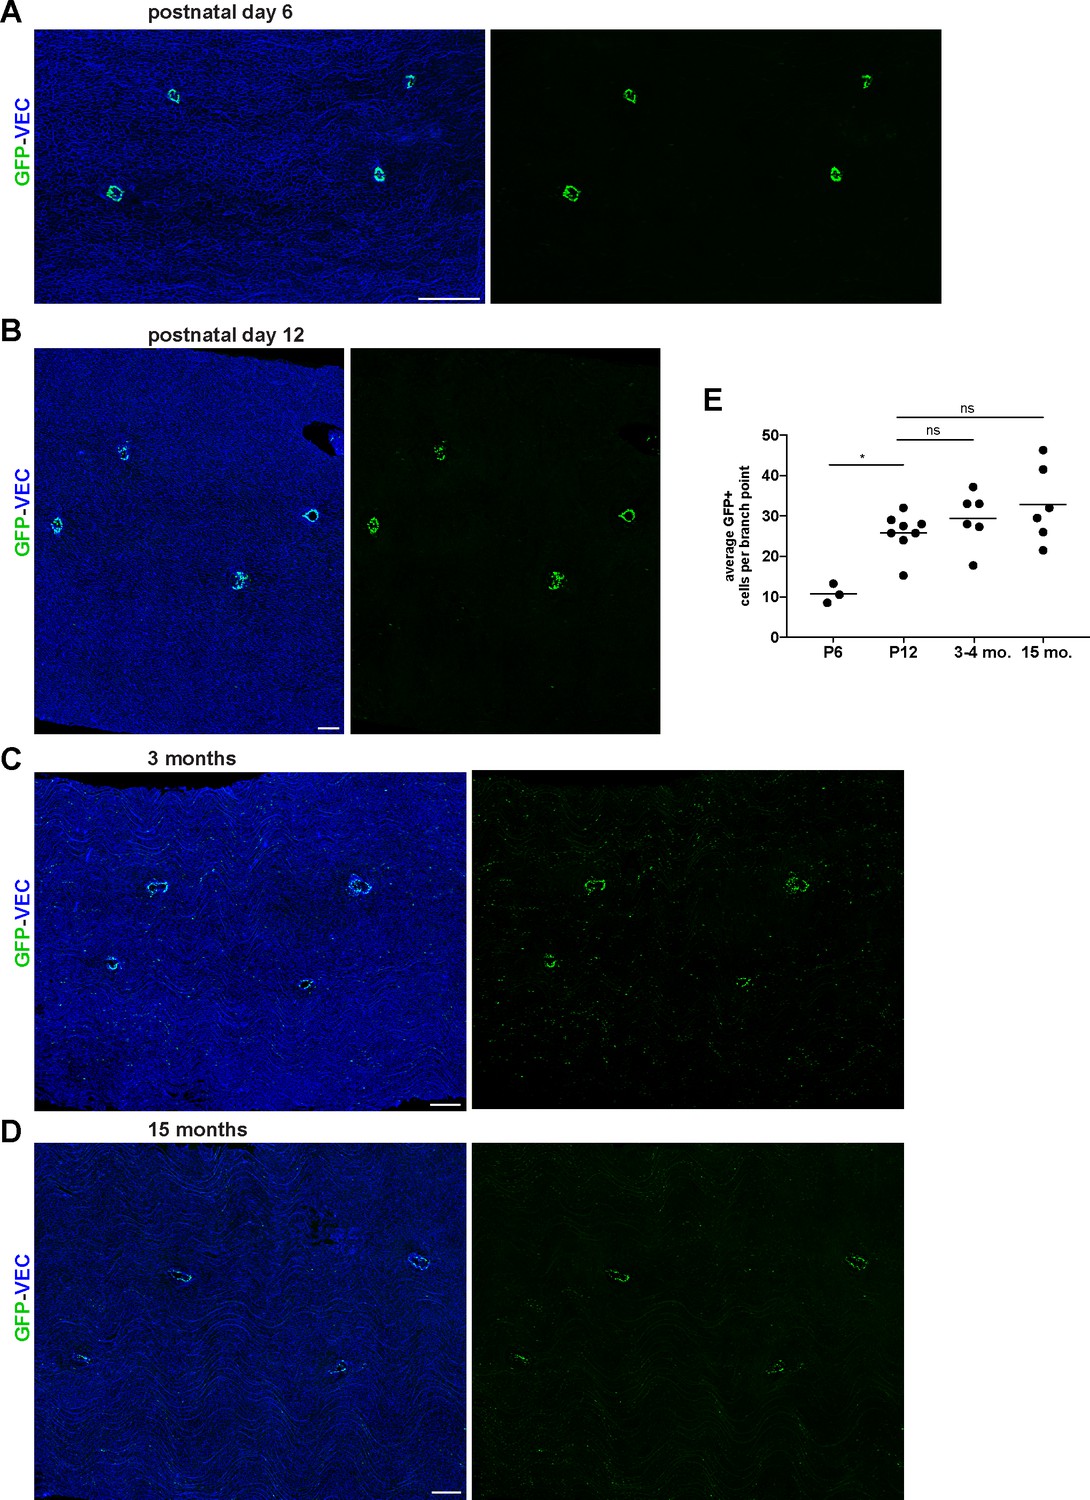
Early postnatal, young adult, and aged S1PR1-GS mouse thoracic aortae.
(A–D) Representative images of aorta en face preparations from P6 (A), P12 (B), 3 month old (C), and 15 month old (D) S1PR1-GS mice immunostained for VEC. Scale bars are 200 µM. (E) Quantification of GFP+ cells comprising the branch points of P6 (n = 2), P12 (n = 3), 3–4 month-old (n = 3), and 15 month old (n = 2) mice. Each dot is a field. One-way ANOVA followed by Bonferroni’s post hoc test, *P = 0.02.
Figure 7—figure supplement 3
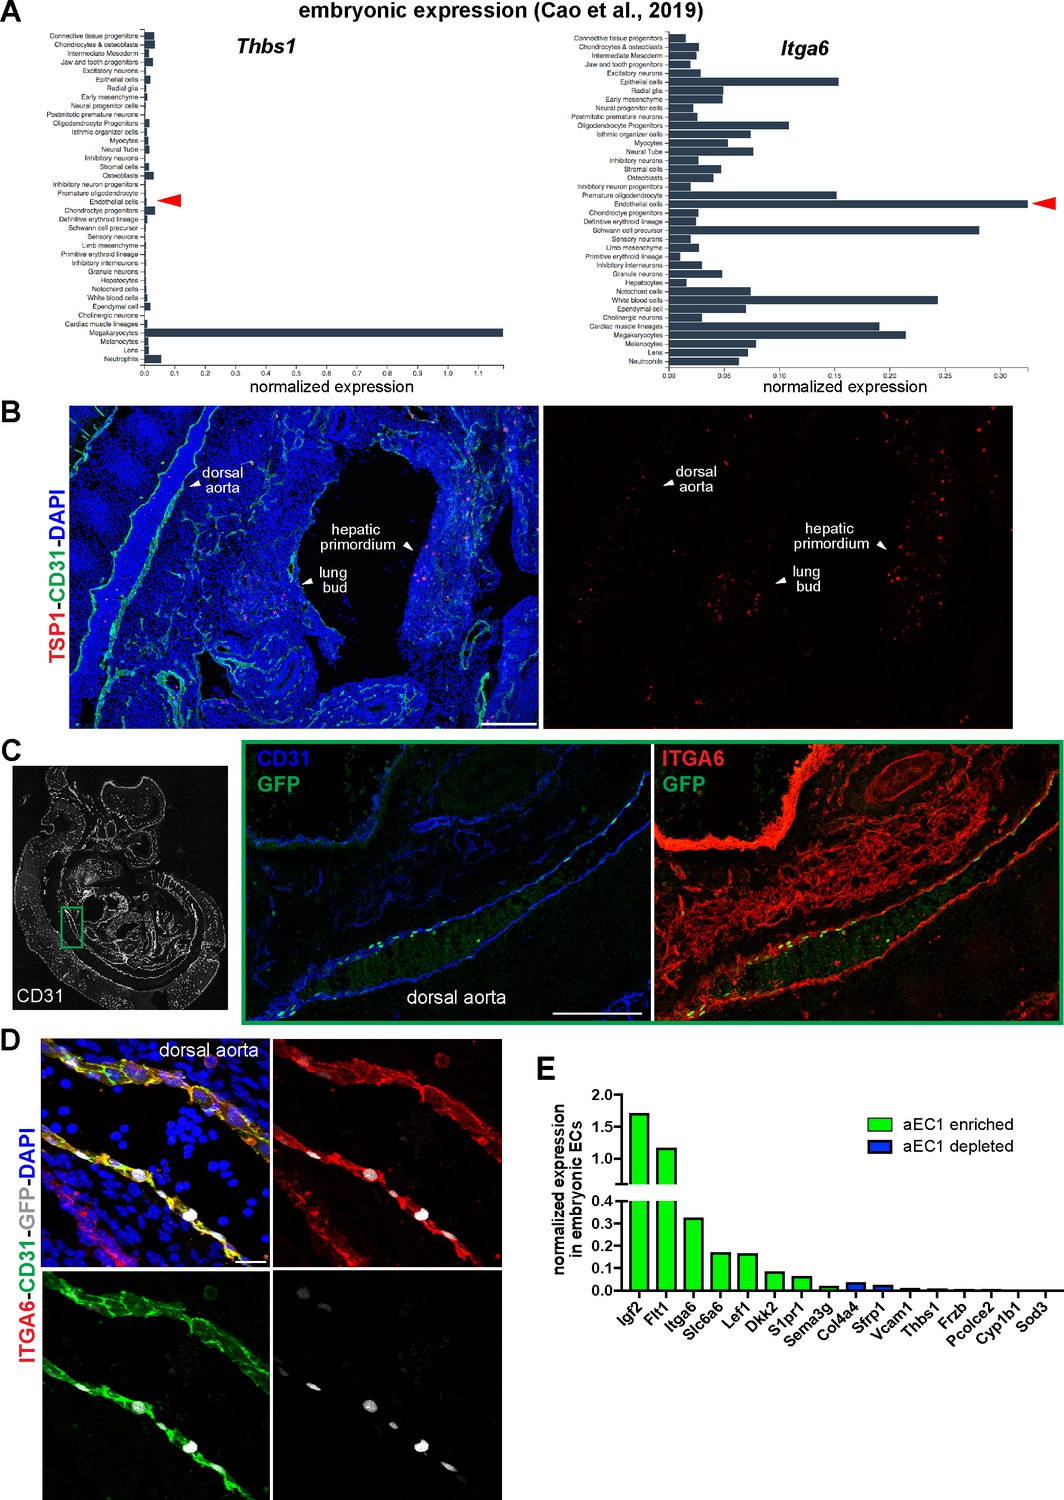
Embryonic expression of ITGA6, TSP1, and aEC1-enriched and –depleted transcripts.
(A) Aggregated E9.5 to E13.5 scRNA-seq data from Cao et al. (2019) is shown for Itga6 and Thbs1. Red arrows indicate normalized gene expression in endothelial cells. (B–D) Sagittal cryosections (14 µM) of an E11.5 S1PR1-GS mouse embryo immunostained for CD31, TSP1 and ITGA6 and counterstained with DAPI, as labeled on each panel. The dorsal aorta, lung bud, and hepatic primordium are indicated in (B). (C) The boxed region of the dorsal aorta is shown at higher magnification with CD31, ITGA6, and GFP channels. Scale bars are 200 µM. (D) High power (40x) image of the dorsal aorta. Scale bar is 20 µM. (E) Expression of selected aEC1-enriched and –depleted transcripts in aggregated E9.5-E13.5 mouse embryonic endothelial cells (data from Cao et al., 2019).
Figure 7—figure supplement 4
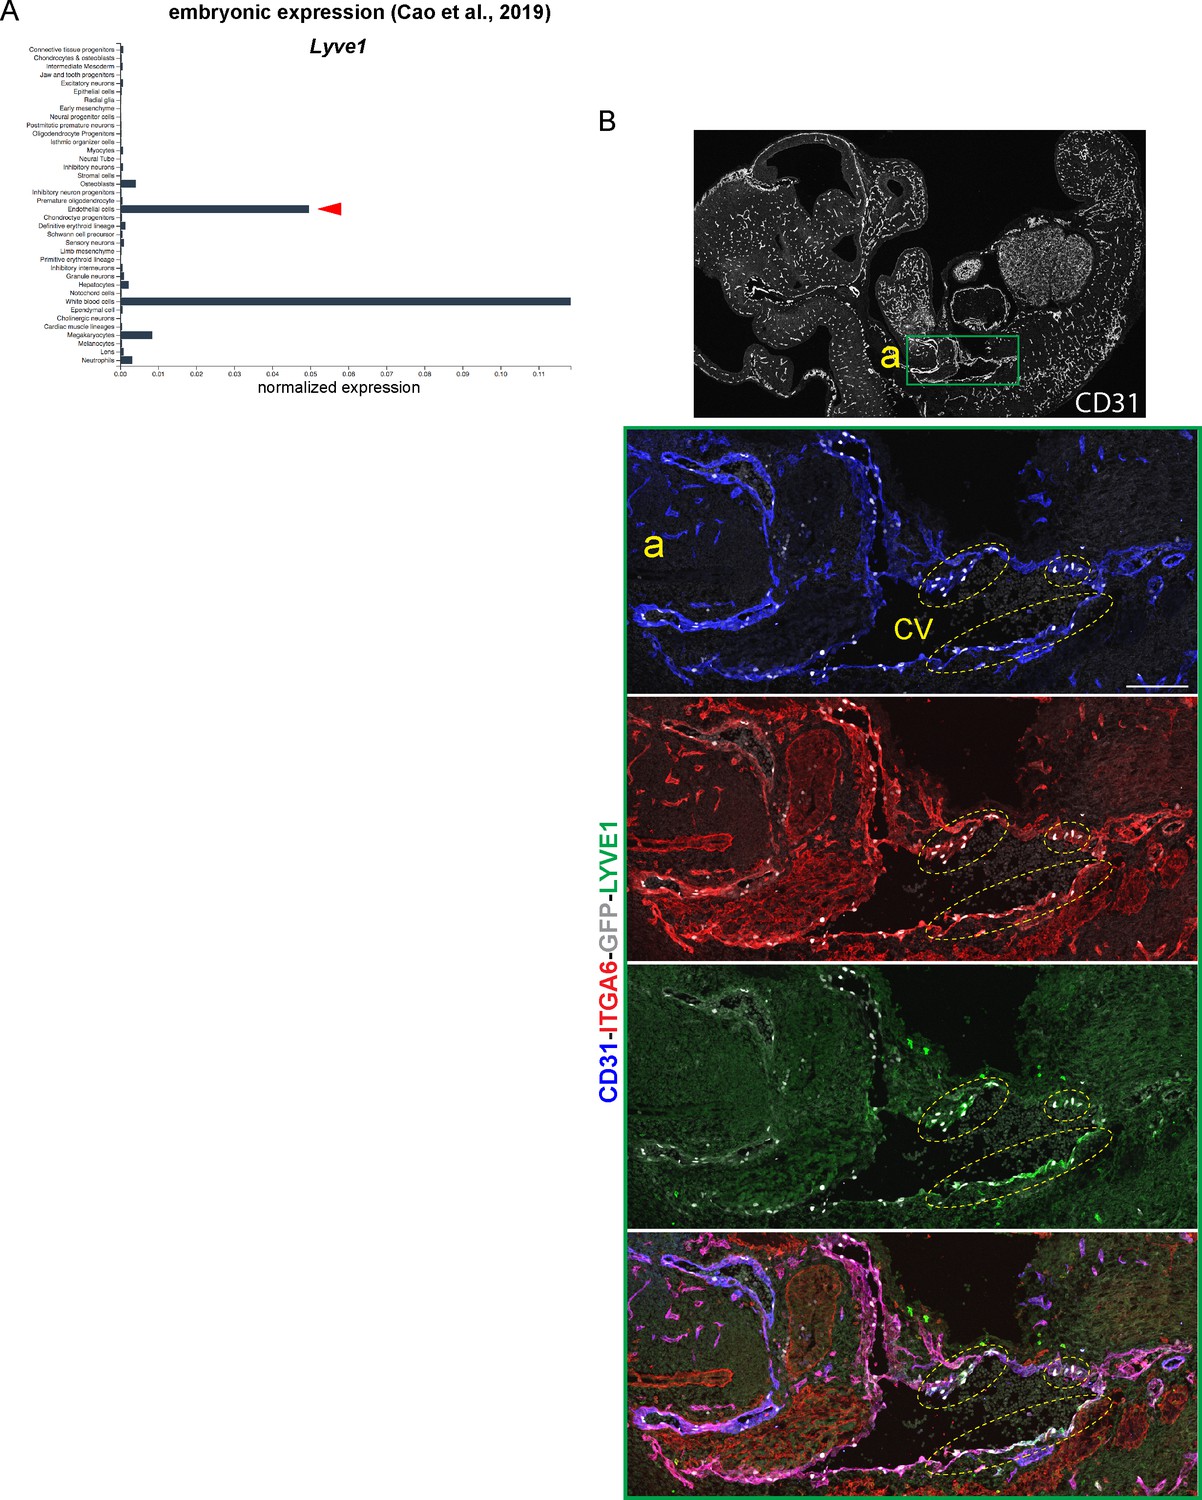
Identification of embryonic lymphatic ECs with S1PR1/ß-arrestin coupling.
(A) Aggregated E9.5 to E13.5 scRNA-seq data from Cao et al. (2019) is shown for Lyve1. Red arrow indicates normalized expression in endothelial cells. (B) Sagittal cryosection (14 µM) of an E11.5 S1PR1-GS mouse embryo immunostained for LYVE1, CD31, and ITGA6. The boxed region is shown at higher magnification. Scale bar is 200 µM; CV – cardinal vein.
Figure 7—figure supplement 5
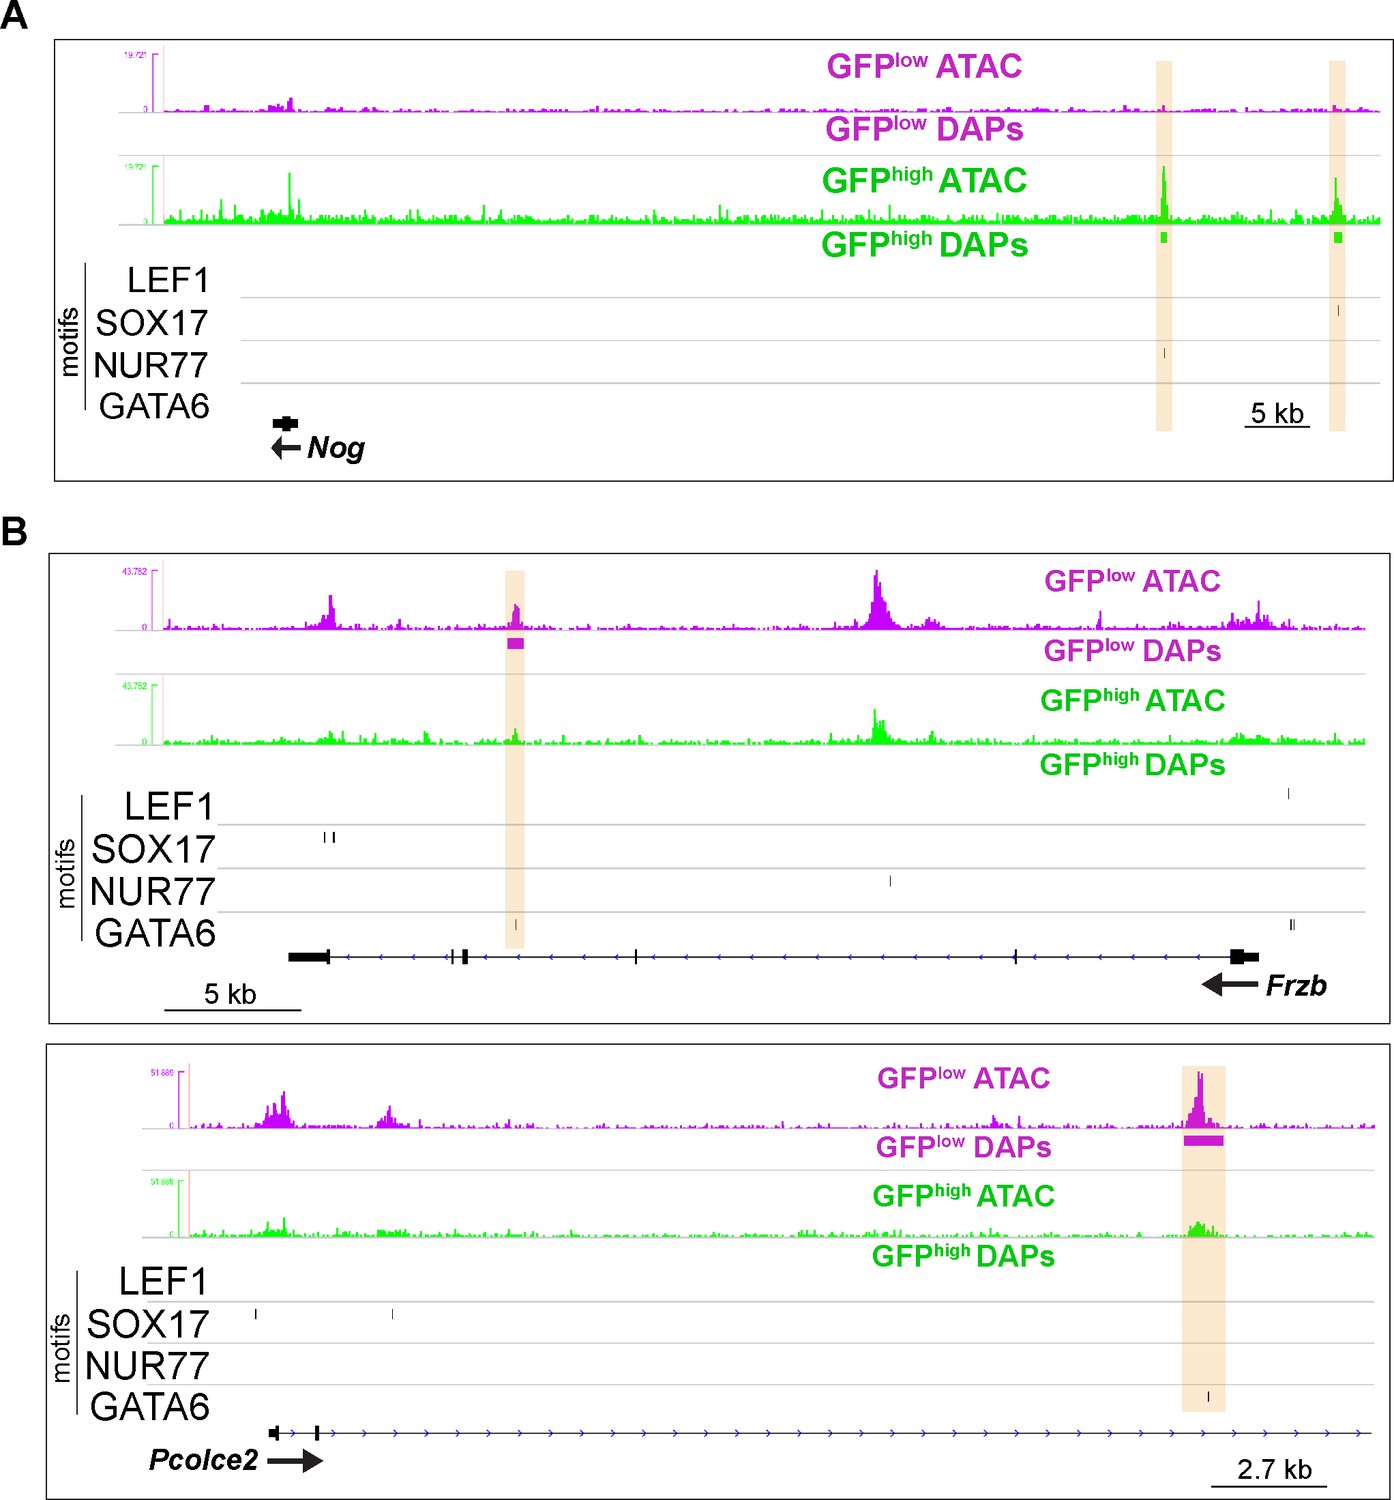
Differential chromatin accessibility near aEC1- and aEC4-enriched genes is coincident with specific DNA motifs.
(A–B) Genome browser images of Nog, Frzb, and Pcolce2 loci. Peaks with increased accessibility in GFPhigh and GFPlow MAECs are indicated, as well as LEF1, SOX17, NUR77, and GATA6 motifs in consensus peaks (see Figure 2A). Orange bars highlight co-incidence of motifs with differential accessibility.
Figure 8 with 1 supplement
S1PR1/ß-arrestin coupling in aorta-associated lymphatic vessels and S1P-dependent signaling in LECs.
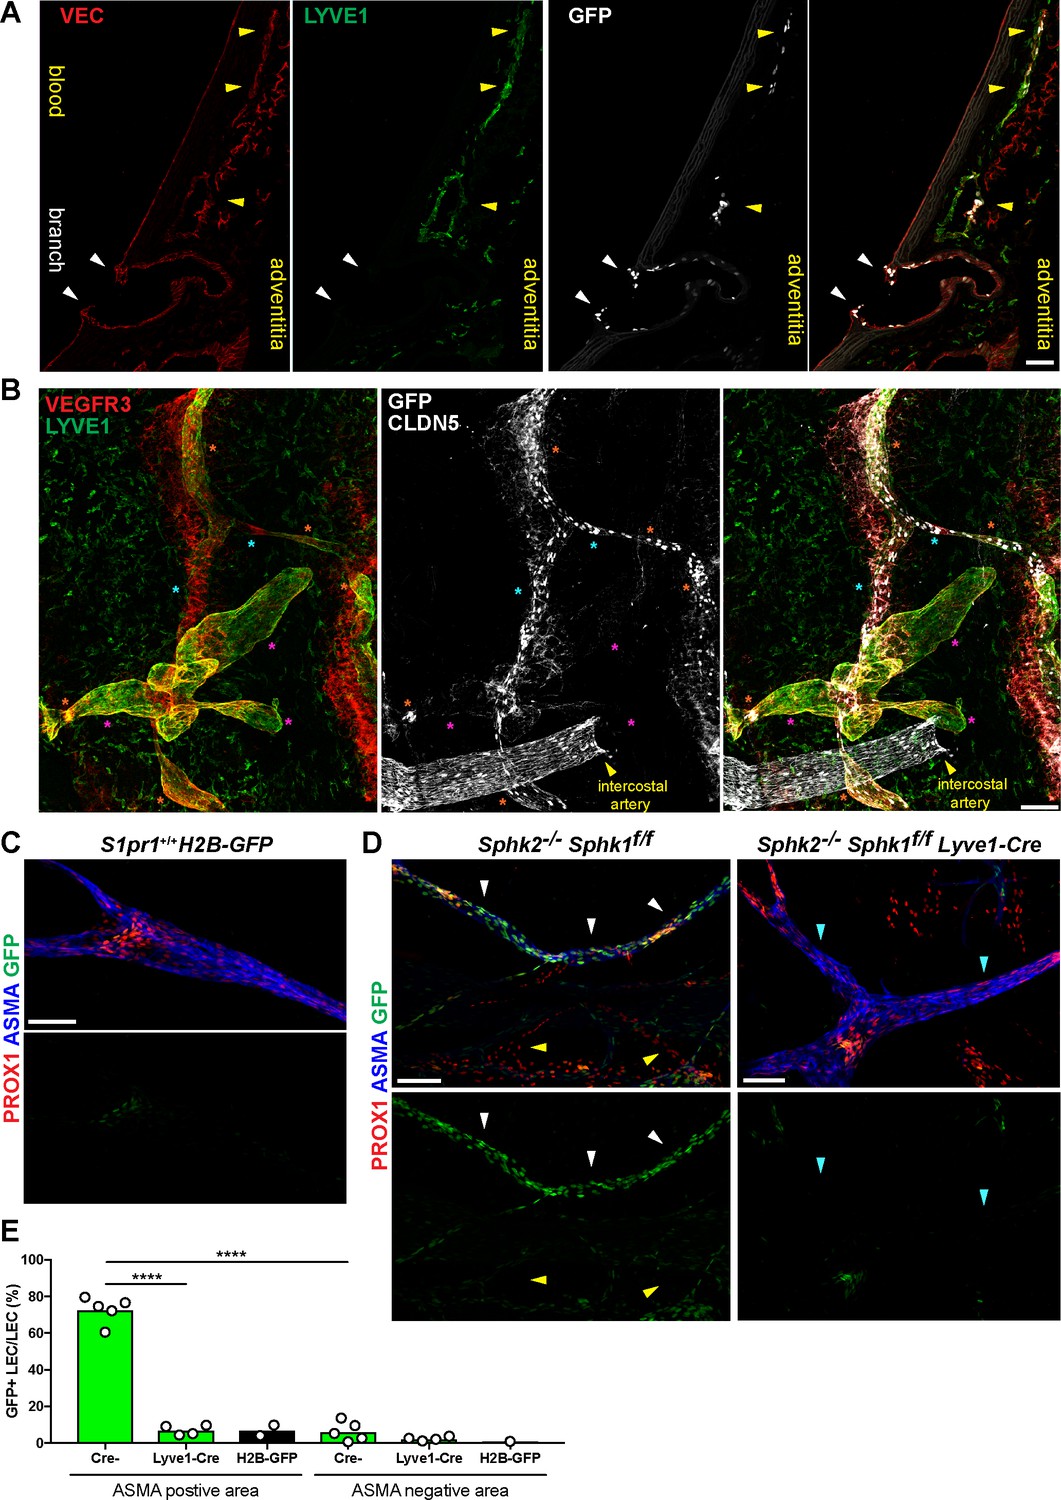
(A) Representative confocal image of a sagittal cryosection (14 µM) of a S1RP1-GS mouse aorta immunostained for VEC and lymphatic vessel endothelial hyaluronic acid receptor 1 (LYVE1) (N = 2). White arrows indicate GFP+ arterial ECs at a branch point orifices and yellow arrows indicate adventitia-associated GFP+ LECs. Scale bar is 50 µM. (B) Confocal image of a S1RP1-GS mouse thoracic aorta whole-mount preparation immunostained for vascular endothelial growth factor receptor 3 (VEGFR3; Flt4), LYVE1, and CLDN5 with the tunica intima in contact with coverslip. Orange stars indicate VEGFR3+LYVE1+GFP+ areas, cyan stars indicate VEGFR3+LYVE1lowGFP+ areas, and magenta stars indicate VEGFR3+LYVE1+GFP- areas. Image is representative of observations from three mice (see also Figure 8—figure supplement 1B). Scale bar is 100 µM. (C–D) Representative confocal images of mesenteric lymphatics from H2B-GFP control (C) and S1PR1-GS mice bearing Sphk2-/-:Sphk1f/f (Cre-) or Sphk2-/-:Sphk1f/f:Lyve1-Cre (Lyve1-Cre+) alleles whole-mounted and immunostained for PROX1 and ASMA. White arrows indicate ASMA+PROX1+GFP+, yellow arrows indicate PROX1+GFP-, cyan arrows indicate ASMA+PROX1+GFP-. Scale bars are 100 µM. (E) Quantification of GFP+ signal over ASMA+PROX1+ and ASMA-PROX1+ areas from Cre- (n = 5), Lyve1-Cre (n = 4), and H2B-GFP control (n = 2) mice. One-way ANOVA followed by Bonferroni’s post hoc test, ****P < 0.0001.
Figure 8—figure supplement 1
Expression of LEC transcripts and localization of ITGA6+ LEC and branch point arterial EC in close proximity.
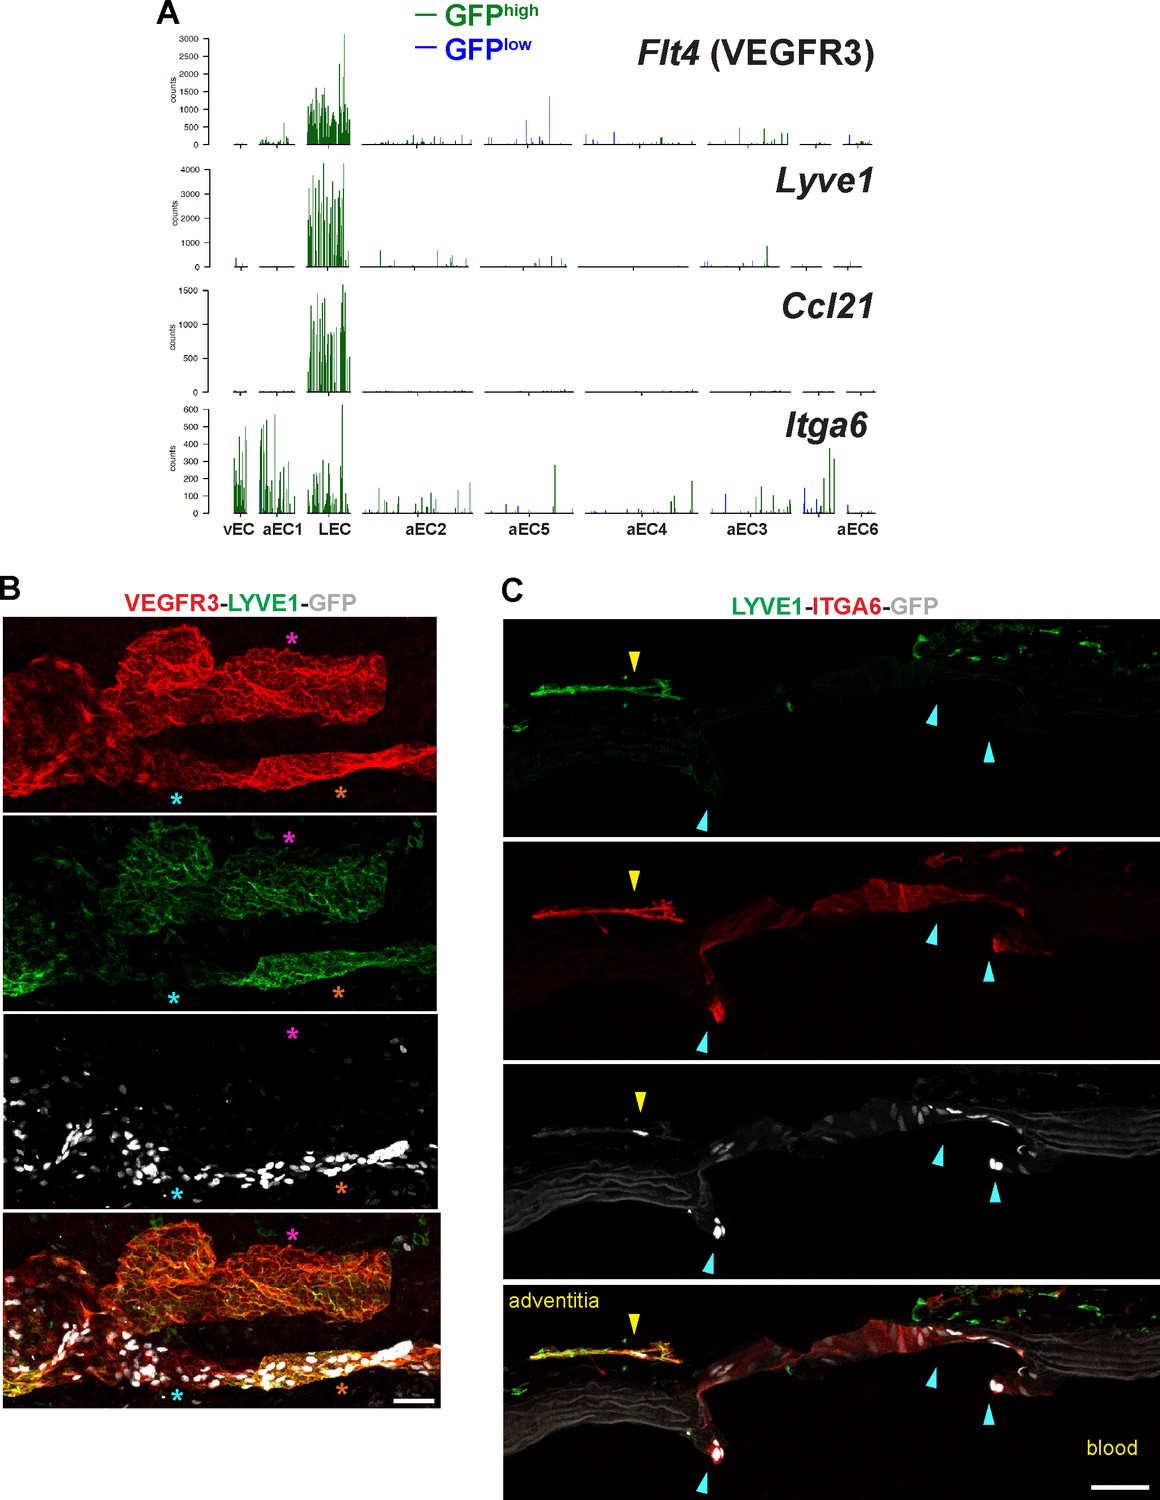
(A) Barplots illustrate transcript counts of Flt4 (VEGFR3), Lyve1, Ccl21, and Itga6 in each of the nine clusters identified by scRNA-seq analysis. Each bar represents a single cell, either GFPhigh (green) or GFPlow (blue). (B) Confocal image of a S1RP1-GS mouse thoracic aorta whole-mount preparation immunostained for VEGFR3 and LYVE1 with the tunica adventitia in contact with coverslip. Orange stars indicate VEGFR3+LYVE1+GFP+ areas, cyan stars indicate VEGFR3+LYVE1lowGFP+ areas, and magenta stars indicate VEGFR3+LYVE1+GFP- areas. (C) Immunostaining of a sagittal section of a S1PR1-GS mouse thoracic aorta for ITGA6 and LYVE1. White arrows indicate GFP+ITGA6+LYVE1- arterial ECs of the branch point orifice. The yellow arrow indicates a GFP+ ECs associated with an adventitial LYVE1+ITGA6+ structure. Scale bars are 50 µM.
Figure 9 with 2 supplements

S1PR1 regulation of gene expression in aorta-associated LECs.
(A) Pie-chart distribution of S1pr1 ECKO MAECs up-regulated transcripts. The 258 transcripts were binned according to their cluster assignment from scRNA-seq analysis. The blue and cyan numbers indicate the total percentage of transcripts enriched in LEC and LEC plus at least one cluster, respectively. The numbers in parentheses are absolute transcripts numbers. (See Supplementary file 6) (B) Heatmap (row Z-scores) of all 78 S1pr1 ECKO MAECs up-regulated transcripts that are LEC-enriched. Selected GSEA pathways are identified in the top heatmap. (See Supplementary file 5) (C) Confocal images of two fields (c’ and c’’) of a whole-mounted S1RP1-GS mouse thoracic aorta immunostained for LYVE1 and C-C motif chemokine 21 (CCL21). The tunica adventitia was facing the coverslip. (D) Confocal images of a sagittal cryosection (14 µM) of an S1RP1-GS mouse thoracic aorta immunostained CCL21 and LYVE1. Yellow arrows indicate adventitia-associated CCL21+LYVE1+GFP+ cells and the white arrow indicate GFP+LYVE1- cells at a branch. Scale bars are 50 µM.
Figure 9—figure supplement 1
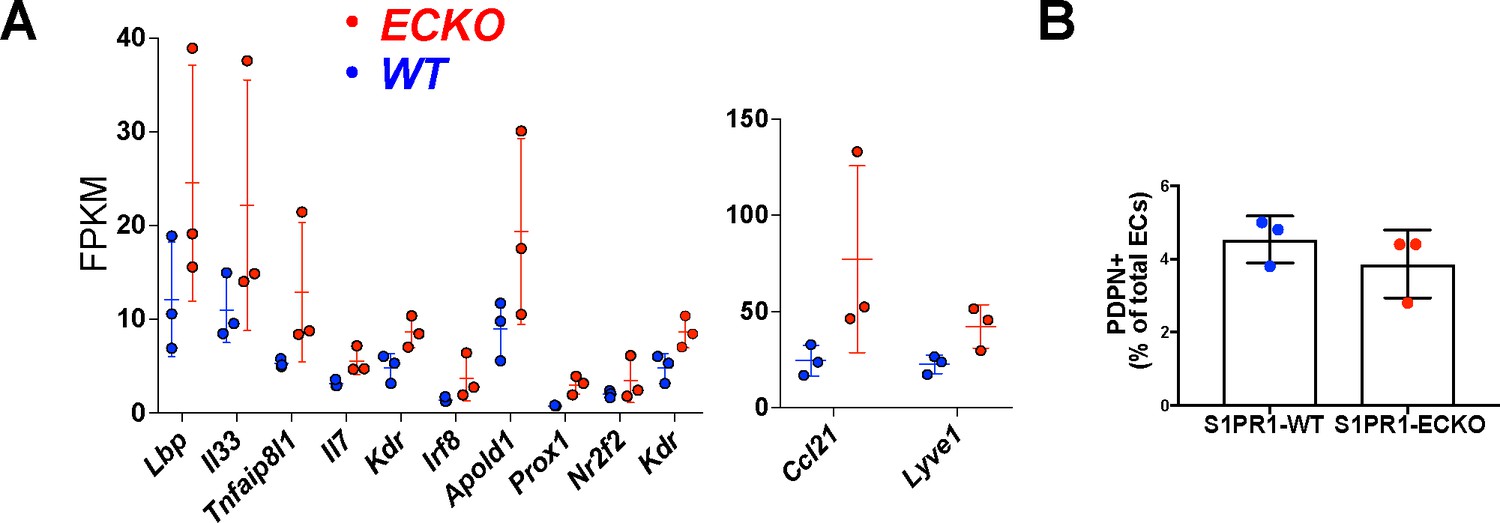
Up-regulation of LEC transcripts in S1pr1 ECKO MAECs is not associated with a change in the proportion of aorta-associated PDPN+ LECs.
Figure 9—figure supplement 2
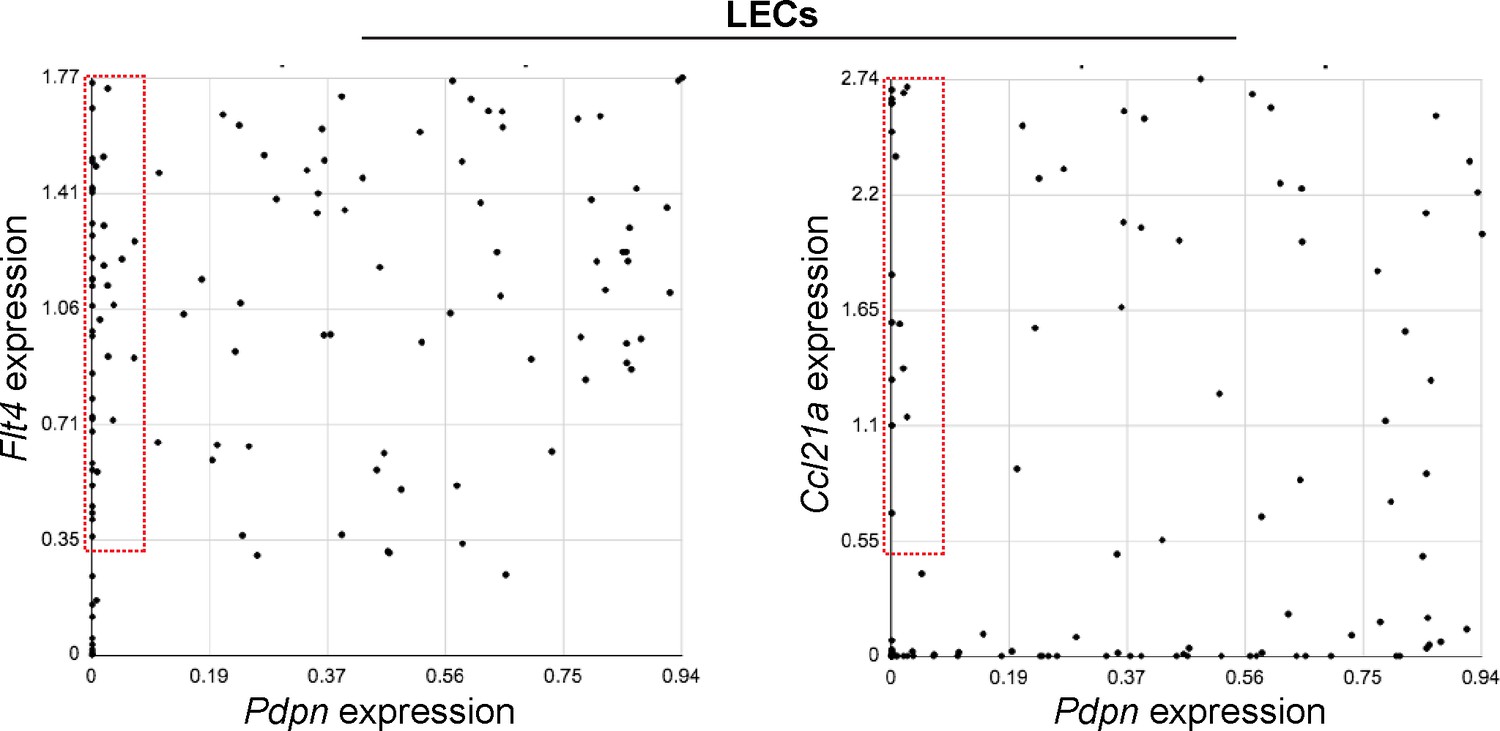
Heterogeneous LEC marker gene expression in aorta-associated LECs.
Expression of Flt4 vs Pdpn (left) or Ccl21a vs Pdpn (right) was compard in individual LECs. The red boxes indicate cell expressing Flt4 but not Pdpn (left) or Ccl21a but not Pdpn (right).
Tables
Key resources table
| Reagent type (species) or resource | Designation | Source or reference | Identifiers | Additional information | |
|---|---|---|---|---|---|
| Genetic reagent (M. musculus) | S1pr1flox/flox: S1pr1tm2Rlp | Allende et al. (2003) | RRID:MGI:2681963 | S1pr1 ECKO | |
| Genetic reagent (M. musculus) | B6N.129S6(FVB)-S1pr1tm3.1(tTA,-Arrb2)Rlp/J | The Jackson Laboratory, Kono et al. (2014) | RRID:IMSR_JAX:026275 | S1PR1-GS | |
| Genetic reagent (M. musculus) | Cdh5-CreERT2: Tg(Cdh5-cre/ERT2)1Rha | Sörensen et al., 2009 | RRID:MGI:3848984 | S1pr1 ECKO | |
| Genetic reagent (M. musculus) | Tg(tetO-HIST1H2BJ/GFP)47Efu/J | The Jackson Laboratory | RRID:IMSR_JAX:005104 | S1PR1-GS | |
| Genetic reagent (M. musculus) | B6;129P2-Lyve1tm1.1(EGFP/cre)Cys/J | The Jackson Laboratory, Pham et al., 2010 | RRID:IMSR_JAX:012601 | S1PR1-GS-Lymph-S1P-less | |
| Genetic reagent (M. musculus) | Sphk1tm2Cgh | Pham et al., 2010 | MGI:3707997 | S1PR1-GS-Lymph-S1P-less | |
| Genetic reagent (M. musculus) | Sphk2tm1.1Cgh | Pham et al., 2010 | MGI:3708000 | S1PR1-GS-Lymph-S1P-less | |
| Genetic reagent (M. musculus) | Rosa26-CreERT2: Gt(ROSA)26Sortm1(cre/ERT2)Alj | Takeda et al., 2007 | MGI:3778915 | S1PR1-GS-S1P-less | |
| Antibody | (PE)-conjugated anti-CD31, (MEC13.3, Rat Monoclonal) | Biolegend | Cat #: 102508 RRID:AB_312915 | ||
| Antibody | (APC)-conjugated anti-mouse CD45 (30-F11, Rat Monoclonal) | Biolegend | Cat #: 103112 RRID:AB_312977 | ||
| Antibody | (APC)-conjugated anti-mouse TER119/Erythroid Cells (Rat Monoclonal) | Biolegend | Cat #:116212 RRID:AB_313713 | ||
| Antibody | Anti-Mouse CD16/CD32 (Rat Monoclonal) | Thermo Fisher Scientific, eBioscience | Cat #: 14-0161-82 RRID:AB_467133 | ||
| Antibody | Anti-mouse VE-cadherin (goat polyclonal) | R and D Systems | Cat #: AF1002 RRID:AB_2077789 | ||
| Antibody | Anti-mouse Fibrinogen (goat polyclonal) | Accurate Chemical | Cat #: YNGMFBG | ||
| Antibody | Anti-Ki-67 (SolA15, rat monoclonal) | Thermo Fisher Scientific, eBioscience | Cat #: 14-5698-80 RRID:AB_10853185 | ||
| Antibody | Anti-mouse LYVE1 (rabbit Polyclonal) | ReliaTech | Cat #: 103-PA50AG RRID:AB_2783787 | 1:300 | |
| Antibody | Anti-mouse LYVE1 (goat polyclonal) | R and D systems | Cat #: AF2125 RRID:AB_2297188 | 1:300 | |
| Antibody | Anti-mouse VEGFR3/Flt-4 (goat polyclonal) | R and D systems | Cat #: AF743 RRID:AB_355563 | 1:200 | |
| Antibody | Anti-human/mouse CD49f (ITGA6) (GoH3, rat monoclonal) | BioLegend | Cat #: 313602 RRID:AB_345296 | 1:200 | |
| Antibody | Anti-mouse ALPL (goat polyclonal) | R and D systems | Cat #: AF2910 RRID:AB_664062 | 1:200 | |
| Antibody | Biotinylated anti-TSP1 (A6.1, mouse monoclonal) | Thermo Fisher Scientific | Cat #: MA5-13395 RRID:AB_10982819 | 1:200 | |
| Antibody | Alexa Fluor 488-conjugated anti-CLDN5 (4C3C2, mouse monoclonal) | Thermo Fisher Scientific, Invitrogen | Cat #: 352588 RRID:AB_2532189 | 1:100 | |
| Antibody | Anti-FSP1/S100A4 (rabbit polyclonal) | Millipore Sigma | Cat #: 07–2274 RRID:AB_10807552 | 1:300 | |
| Antibody | anti-mouse/rat CD31/PECAM-1 (goat polyclonal) | R and D systems | Cat #: AF3628 RRID:AB_2161028 | 1:300 | |
| Antibody | anti-CD31 (SZ31, rat monoclonal) | HistoBiotec | Cat #: DIA-310 RRID:AB_2631039 | 1:100 | |
| Antibody | anti-LEF1 (C12A5, rabbit monoclonal) | Cell Signaling Technologies | Cat #: 2230 RRID:AB_823558 | 1:200 | |
| Antibody | anti-mouse VCAM1 (M/K, rat monoclonal) | Millipore Sigma | Cat #: CBL1300 RRID:AB_2214062 | 1:200 | |
| Antibody | anti-mouse NOGGIN (goat polyclonal) | R and D systems | Cat #: AF719 RRID:AB_2151669 | 1:200 | |
| Antibody | anti-mouse CCL21/6Ckine (goat polyclonal) | R and D systems | Cat #: AF457 RRID:AB_2072083 | 1:200 | |
| Antibody | anti-human PROX1 (goat polyclonal) | R and D systems | Cat #: AF2727 RRID:AB_2170716 | 1:200 | |
| Antibody | anti-jellyfish GFP (chicken polyclonal) | ThermoFisher | Cat #: A10262 RRID:AB_2534023 | 1:500 | |
| Antibody | Cy3-conjugated anti-human alpha smooth muscle actin (1A4, mouse monoclonal) | Sigma-Aldrich | Cat #: C6198 RRID:AB_476856 | 1:300 | |
| Commercial assay or kit | RNeasy Micro Kit | Qiagen | Cat #: 74004 | ||
| Commercial assay or kit | SMART-Seq2 v4 Ultra Low RNA Kit for Sequencing | TakaraBio | Cat #: 634888 | ||
| Commercial assay or kit | High Sensitivity RNA ScreenTape | Agilent | Cat #: 5067–5579 | ||
| Commercial assay or kit | High Sensitivity D1000 ScreenTape | Agilent | Cat #: 5067–5584 | ||
| Commercial assay or kit | Nextera XT2 DNA Library Prep Kit for RNA-seq | Illumina | Cat #: FC-131–1024 | ||
| Commercial assay or kit | Nextera DNA Library Prep Kit for ATAC-seq (buffer TD and TDE1 enzyme) | Illumina | Cat #: FC-121–1030 | ||
| Commercial assay or kit | MinElute Reaction Cleanup Kit | Qiagen | Cat #: 28204 | ||
| Commercial assay or kit | MinElute PCR Purification Kit | Qiagen | Cat #: 28004 | ||
| Commercial assay or kit | NEBNext High-Fidelity 2X PCR Master Mix | New England Biolabs | Cat#: M0541S | ||
| Chemical compound or drug | Tamoxifen | Sigma-Aldrich | Cat #: T5648 | ||
| Chemical compound or drug | Corn oil | Sigma-Aldrich | Cat #: C8267 | ||
| Chemical compound or drug | Fluoromount-G slide mounting medium | SouthernBiotech | Cat #: 0100–01 | ||
| Chemical compound or drug | ProLong Gold | Thermo Fisher Scientific, Invitrogen | P36934 | ||
| Chemical compound or drug | Liberase TM | Sigma-Aldrich | Cat #: 5401127001 | ||
| Chemical compound or drug | deoxyribonuclease I from bovine pancreas, type 2 | Sigma-Aldrich | Cat #: D4527 | ||
| Chemical compound or drug | Bovine Serum Albumin lyophilized powder, essentially fatty acid free,≥96% (agarose gel electrophoresis) | Sigma-Aldrich | Cat #: A6003 | ||
| Chemical compound or drug | 2-MercaptoEthanol | Sigma-Aldrich | Cat #: M3148 | ||
| Chemical compound or drug | Digitonin (20 mg/ml) | Promega | Cat #: G9441 | ||
| Chemical compound or drug | Donkey Serum | Sigma-Aldrich | Cat #: D9663 | ||
| Chemical compound or drug | RNase inhibitor | Takara Bio | Cat #: 2313B | ||
| Chemical compound or drug | Sphingosine-1-Phosphate (d18:1) | Avanti lipids | Cat #: 860492P | ||
| Sequence-based reagent | Smart-dT30VN | Sigma-Aldrich | |||
| Sequence-based reagent | ERCC RNA Spike-In Mix | Thermo Fisher Scientific, Ambion | Cat #: 4456740 | ||
| Software, algorithm | Fiji | NIH | https://imagej.net/Fiji RRID:SCR_002285 | ||
| Software, algorithm | Graphpad Prism 8.0 | Graphpad Software | https://www.graphpad.com/scientific-software/prism/ RRID:SCR_002798 | ||
| Software, algorithm | STAR | PMID: 23104886 | https://github.com/alexdobin/STAR RRID:SCR_015899 | ||
| Software, algorithm | Rsubread | PMID: 23558742 | https://bioconductor.org/packages/release/bioc/html/Rsubread.html RRID:SCR_016945 | ||
| Software, algorithm | edgeR | PMID: 19910308 | https://bioconductor.org/packages/release/bioc/html/edgeR.html RRID:SCR_012802 | ||
| Software, algorithm | RSEM | PMID: 21816040 | https://deweylab.github.io/RSEM/ RRID:SCR_013027 | ||
| Software, algorithm | bowtie2 | PMID: 22388286 | http://bowtie-bio.sourceforge.net/bowtie2/index.shtml RRID:SCR_005476 | ||
| Software, algorithm | Picard | Broad Institute | https://broadinstitute.github.io/picard/ RRID:SCR_006525 | ||
| Software, algorithm | MACS2 | PMID: 18798982 | https://github.com/taoliu/MACS RRID:SCR_013291 | ||
| Software, algorithm | Bedtools | PMID: 20110278 | https://bedtools.readthedocs.io/en/latest/ RRID:SCR_006646 | ||
| Software, algorithm | bedops | PMID: 22576172 | https://bedops.readthedocs.io/en/latest/ RRID:SCR_012865 | ||
| Software, algorithm | Hypergeometric Optimization of Motif EnRichment (HOMER) | PMID: 20513432 | http://homer.ucsd.edu/homer/ RRID:SCR_010881 | ||
| Software, algorithm | DeepTools | PMID: 27079975 | https://deeptools.readthedocs.io/en/develop/ RRID:SCR_016366 | ||
| Software, algorithm | Integrative Genomics Viewer | PMID: 21221095 | http://software.broadinstitute.org/software/igv/ RRID:SCR_011793 | ||
| Software, algorithm | Samtools | PMID: 19505943 | http://www.htslib.org/ RRID:SCR_002105 | ||
| Software, algorithm | velocyto | PMID: 30089906 | http://velocyto.org/velocyto.py/ | ||
| Software, algorithm | Pagoda2 | PMID: 26780092 PMID: 30089906 | https://github.com/hms-dbmi/pagoda2 http://pklab.med.harvard.edu/nikolas/pagoda2/frontend/current/pagodaLocal/ RRID:SCR_017094 | Binary (.bin) file in Supplementary file 7 was generated as instructed here: https://github.com/hms-dbmi/pagoda2/blob/master/vignettes/pagoda2.walkthrough.oct2018.md |
Additional files
-
Source code 1
These files include scripts used to center ATAC-seq paired-end reads on Tn5 cut sites.
- https://cdn.elifesciences.org/articles/52690/elife-52690-code1-v2.shift.sh
-
Source code 2
STAR code used for mapping of scRNA-seq.
fastq files.
- https://cdn.elifesciences.org/articles/52690/elife-52690-code2-v2.alignment.sh
-
Source code 3
Pagoda2 R code used for scRNA-seq analysis.
- https://cdn.elifesciences.org/articles/52690/elife-52690-code3-v2.loom.r
-
Supplementary file 1
edgeR results from bulk RNA-seq differential gene expression analysis for GFPhigh vs. GFPlow and S1pr1 ECKO vs. S1pr1 WT MAEC comparisons.
RSEM-generated FPKM values for all annotated transcripts are also included for each biological replicate.
- https://cdn.elifesciences.org/articles/52690/elife-52690-supp1-v2.xlsx
-
Supplementary file 2
Ingenuity Pathway Analysis results from bulk RNA-seq comparisons of GFPhigh vs. GFPlow and S1pr1 ECKO vs. S1pr1 WT MAECs.
- https://cdn.elifesciences.org/articles/52690/elife-52690-supp2-v2.xlsx
-
Supplementary file 3
Bulk ATAC-seq of GFPhigh vs. GFPlow and S1pr1 ECKO vs. S1pr1 WT MAECs.
edgeR results from differential accessibility analysis are included, as well as the genomics coordinates of differentially accessible peaks and the motif analyses (HOMER) results shown in Figure 2C–F.
- https://cdn.elifesciences.org/articles/52690/elife-52690-supp3-v2.xlsx
-
Supplementary file 4
scRNA-seq of GFPhigh and GFPlow MAECs.
Tabs include transcripts enriched and depleted in each cluster with details at the top of each page. Also included are 2 tabs of transcripts that are commonly enriched or depleted in LEC/vEC/aEC1 (referred to in Figure 3—figure supplement 4), as well as a tab detailing the intersection of aEC1-enriched transcripts and those differentially expressed in the S1pr1 ECKO dataset (Figure 6A and B).
- https://cdn.elifesciences.org/articles/52690/elife-52690-supp4-v2.clusters.xlsx
-
Supplementary file 5
Tabs include Gene Set Enrichment Analysis (GSEA) results using transcripts enriched in each cluster as inputs.
Also included is the complete list of sphingolipid-related genes queried (referred to in Figure 3—figure supplement 4A). The list of transcription factors is limited to those identified as aEC1-enriched and –depleted that also had minimal count thresholds after Pagoda2 filtering during hierarchical differential expression analysis.
- https://cdn.elifesciences.org/articles/52690/elife-52690-supp5-v2.xlsx
-
Supplementary file 6
Detailed intersections of S1pr1 ECKO up- and down-regulated transcripts according to their cluster assignments from scRNA-seq.
- https://cdn.elifesciences.org/articles/52690/elife-52690-supp6-v2.xlsx
-
Supplementary file 7
Binary ‘.bin’ file that can be uploaded to the graphical user interface: http://pklab.med.harvard.edu/nikolas/pagoda2/frontend/current/pagodaLocal/ for examination of our GFPhigh and GFPlow MAEC scRNA-seq data.
- https://cdn.elifesciences.org/articles/52690/elife-52690-supp7-v2.aorta.bin
-
Supplementary file 8
The labels for each scRNA-seq cluster, which can also be uploaded at: http://pklab.med.harvard.edu/nikolas/pagoda2/frontend/current/pagodaLocal/.
- https://cdn.elifesciences.org/articles/52690/elife-52690-supp8-v2.aorta
-
Transparent reporting form
- https://cdn.elifesciences.org/articles/52690/elife-52690-transrepform-v2.docx
Download links
A two-part list of links to download the article, or parts of the article, in various formats.
Downloads (link to download the article as PDF)
Open citations (links to open the citations from this article in various online reference manager services)
Cite this article (links to download the citations from this article in formats compatible with various reference manager tools)
Sphingosine 1-phosphate-regulated transcriptomes in heterogenous arterial and lymphatic endothelium of the aorta
eLife 9:e52690.
https://doi.org/10.7554/eLife.52690


