Opioids depress breathing through two small brainstem sites
- Department of Physiology, University of California-San Francisco, United States
- Neuroscience Graduate Program, University of California-San Francisco, United States
- Biomedical Sciences Graduate Program, University of California-San Francisco, United States
Figures
Figure 1 with 2 supplements
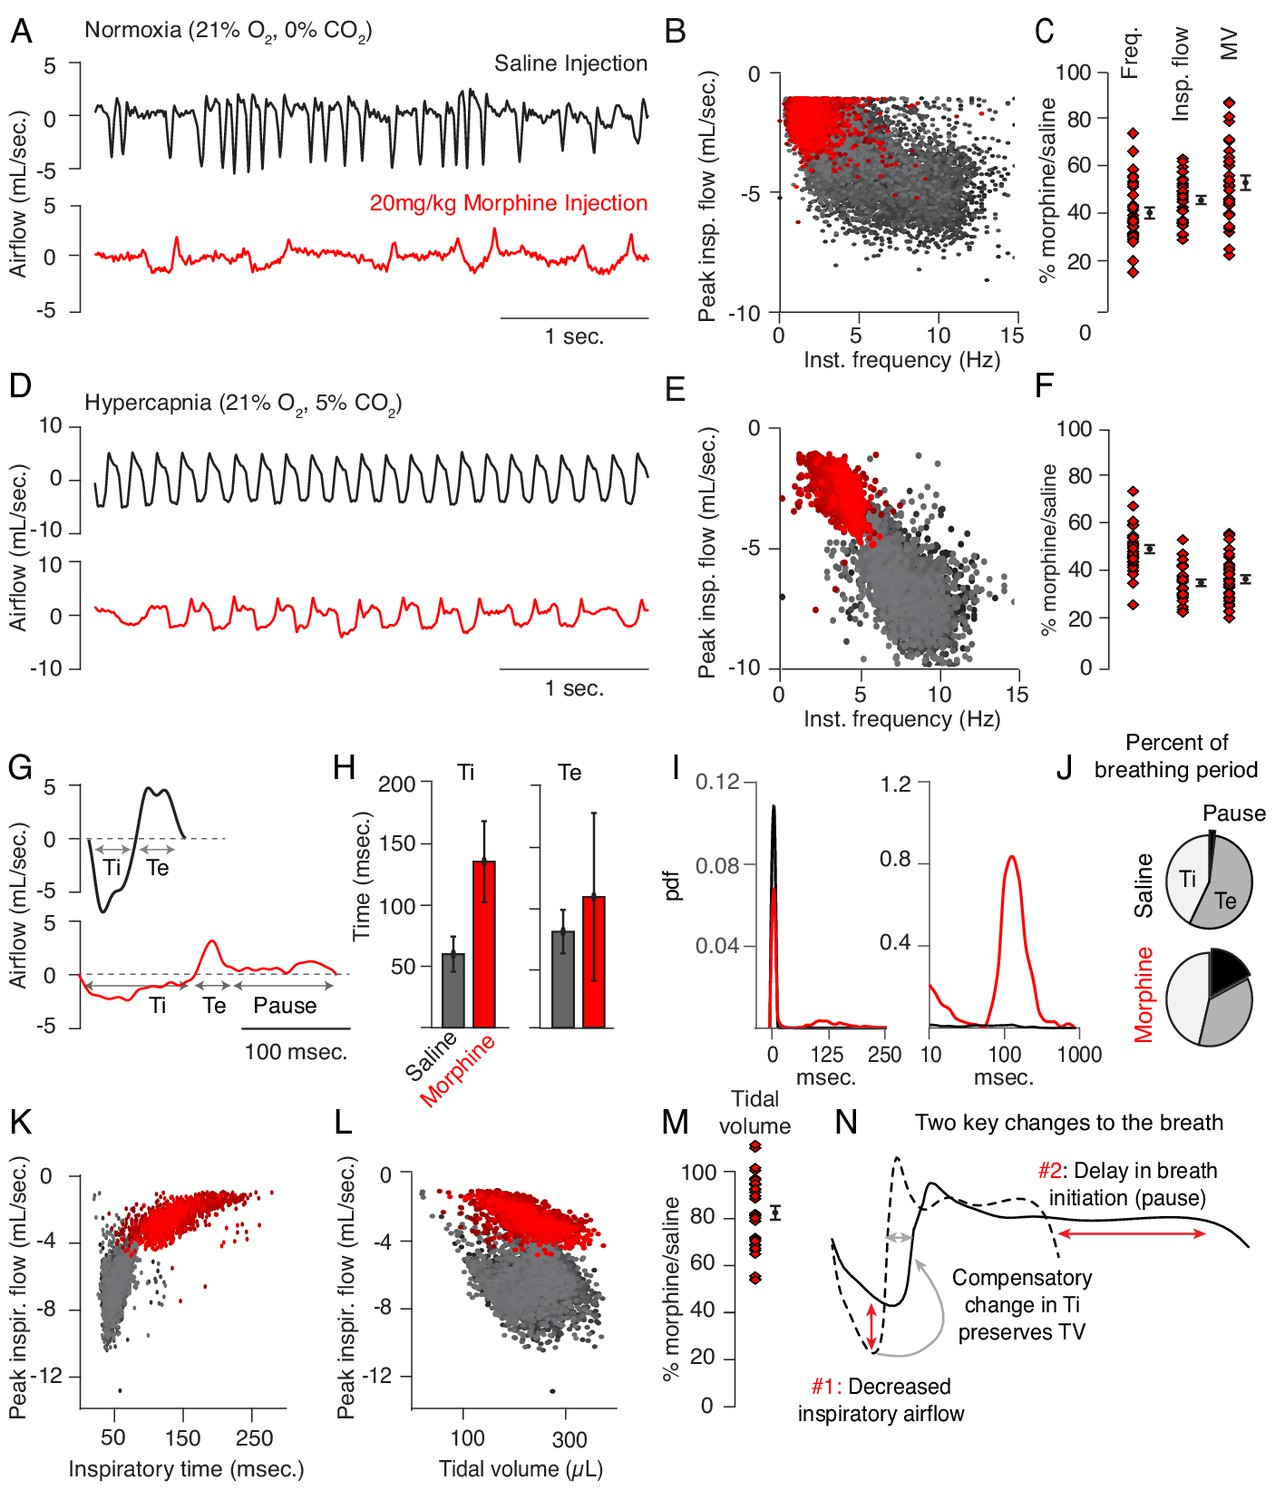
Changes to breathing during opioid-induced respiratory depression.
(A) Representative examples of the breathing airflow (mL/sec.) in normoxia (21% O2) measured by whole body plethysmography. 15 min before recordings, animals are intraperitoneally (IP) injected with either saline (black) or 20 mg/kg morphine (red). Morphine recordings are captured 1–7 days after saline. (B) Scatterplot of instantaneous breathing rate (Hz) versus airflow (mL/sec.) for each breath (dot) taken during the 40 min recordings. Morphine causes breathing to become slow and less forceful. (C) Ratio of average breathing parameters after IP injection of morphine-to-saline. Respiratory rate, peak inspiratory airflow, and minute ventilation (MV = approximated tidal volume*rate) for n = 29 animals in normoxia. Red diamond, single animal average. Black diamond, average of all animals. Error bar, standard error of mean (SEM). (D–E) Representative example of breathing airflow and instantaneous scatter plot (rate vs. airflow) from a 10 min whole body plethysmography recording of breathing in hypercapnia (21% O2, 5% CO2) to minimize changes in breathing due to differences in behavior after morphine injection. (F) Ratio of respiratory rate (p-value=1×10⁻¹⁹, Cohen’s d = 5.96), peak inspiratory airflow (p-value=1×10⁻²², Cohen’s d = 6.18), and minute ventilation (p-value=1×10⁻²⁰, Cohen’s d = 5.31) after IP injection of morphine-to-saline for n = 29 animals in hypercapnia. (G) Representative single breath airflow trace for breaths in hypercapnia after saline (black) or morphine (red) IP injection. Hypercapnic saline breaths can be divided into two phases whose durations (msec.) can be measured: inspiration (Ti) and expiration (Te). Hypercapnic morphine breaths have a third phase after expiration where airflow is nearly 0 mL/sec., which we call a pause. (H) Bar graph of the average length ± standard deviation of Ti and Te for a single representative animal. (I) Probability density function plot of the pause length in breathing during hypercapnia after saline (black) or morphine (red) IP injection on a numerical (left) and logarithmic scale (right). Note, morphine selectively increases Ti and pause length. (J) Percent of the average breath period spent in inspiration, expiration, or pause for hypercapnic breaths after saline or morphine injection. (K) Scatterplot of inspiratory time (msec.) vs. peak inspiratory airflow (mL/sec.) for 10 min of hypercapnic breaths after saline (black) or morphine (red) IP injection. As inspiratory time increases, peak inspiratory flow decreases. (L) Scatterplot of tidal volume (µL.) vs. peak inspiratory airflow (mL/sec.) for 10 min of hypercapnic breaths after saline (black) or morphine (red) IP injection. Even though peak inspiratory airflow decreases after morphine, tidal volume is preserved due to prolonged Ti. (M) Ratio of tidal volume after IP injection of morphine-to-saline for n = 29 animals in hypercapnia (p-value=3×10⁻⁶, Cohen’s d = 1.13). (N) Schematic of the two key morphine induced changes to the breath: decreased inspiratory airflow and pause. Decreased inspiratory airflow prolongs Ti since negative feedback from the lung reflecting breath volume is slower. We interpret the pause as a delay in initiation of the subsequent inspiration.
-
Figure 1—source data 1
Average frequency, peak flow, minute ventilation, tidal volume and pause duration for 31 animals after intraperitoneal saline or morphine in normoxia and hypercapnia.
- https://cdn.elifesciences.org/articles/52694/elife-52694-fig1-data1-v2.xlsx
Figure 1—figure supplement 1
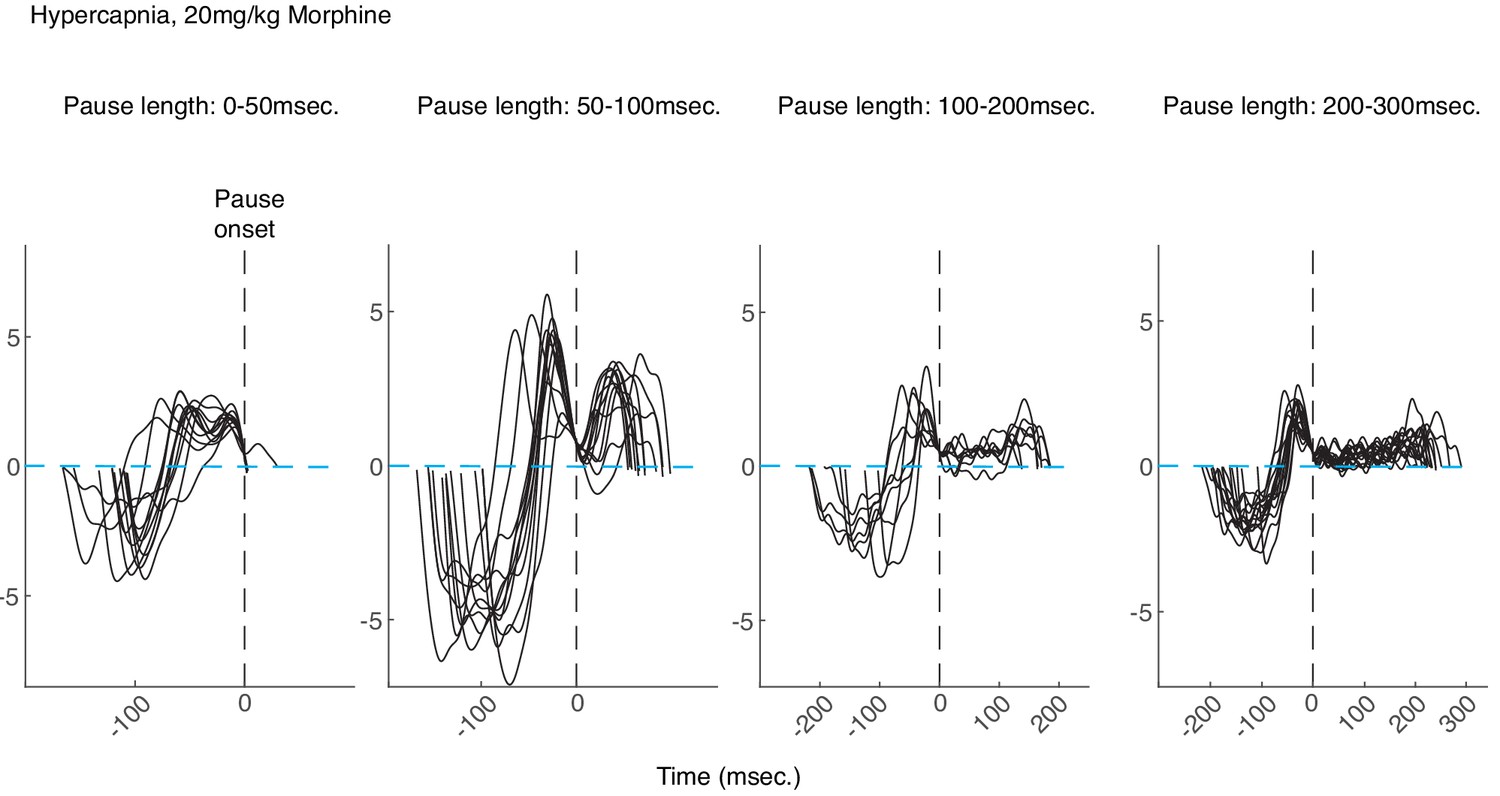
Examples of morphine breaths in hypercapnia binned by pause length.
Example breaths binned by pause length (from left to right: 0–50, 50–100, 100–200, and 200-300msec.) from a control animal breathing in hypercapnia after intraperitoneal injection of 20 mg/kg morphine. All breaths are aligned at the onset of the pause (vertical dashed black lines). Note that for longer pauses, the airflow is nearly 0 (dashed blue line) for tens to hundreds of milliseconds and then ends in an increased expiratory airflow, likely active expiration induced by hypercapnia.
Figure 1—figure supplement 2
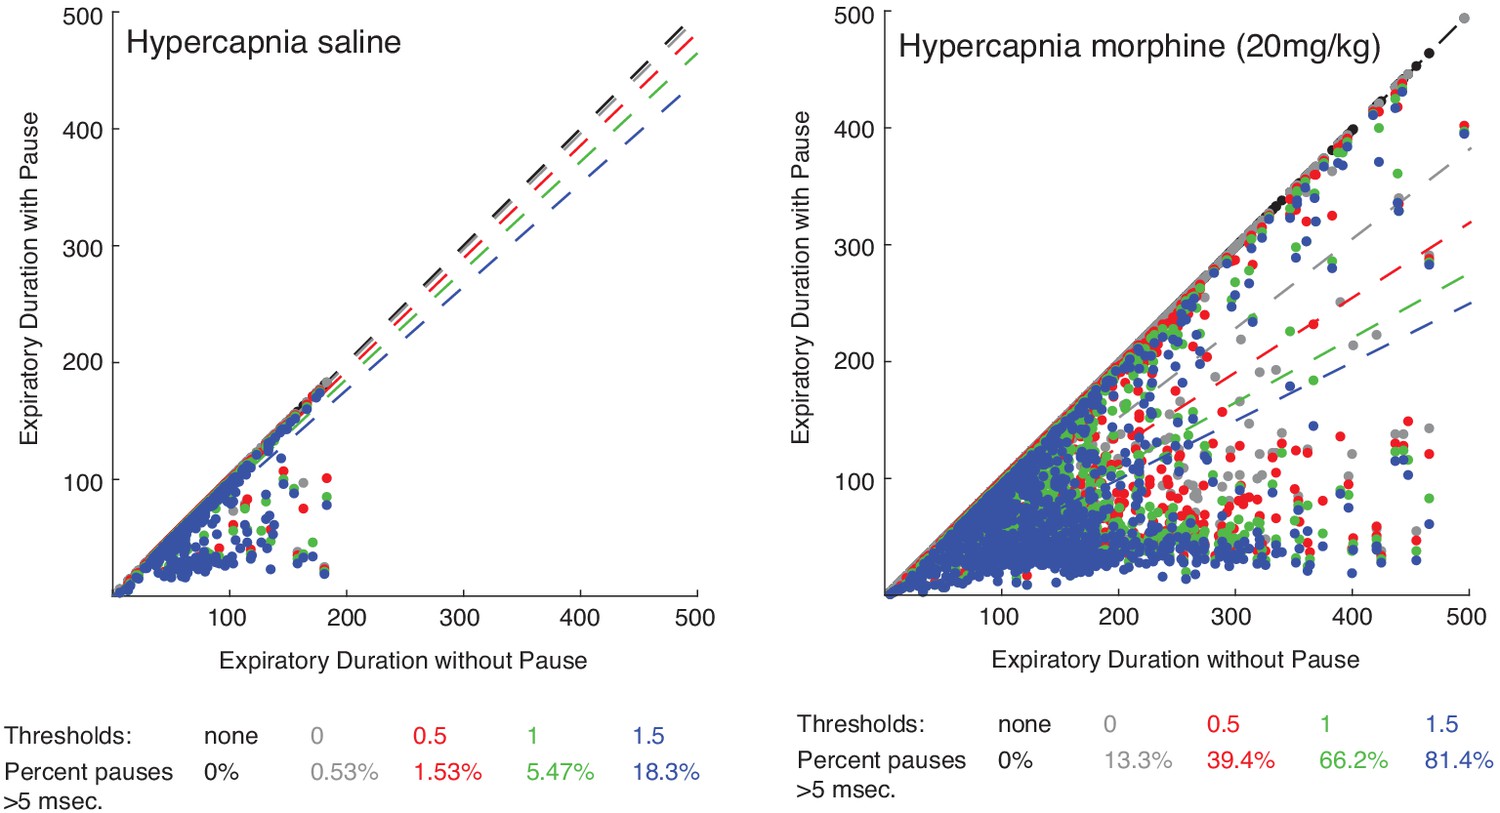
Scatter plot of expiratory duration with and without the pause to identify an effective airflow threshold.
Scatterplots of 100 individual breaths (dots) from n = 15 animals and the line of best fit (dashed line) where the expiratory length (msec.) of breaths is calculated with or without a pause. The different colors represent various airflow thresholds (mL/sec.) where the pause is initiated (black: no threshold, gray: 0 mL/sec., red: 0.5 mL/sec., green: 1 mL/sec., blue: 1.5 mL/sec.). Under hypercapnia conditions after intraperitoneal saline injection (left), at a pause threshold of 0.5 mL/sec. less than 2% of all breaths had a pause defined greater than 5msec. However, after 20 mg/kg morphine in hypercapnia, 40% of breaths had a pause greater than 5msec. At a threshold of 0.5 mL/sec., since most breaths (>98%) under baseline conditions do not have any pause, this threshold was conservatively chosen for our analysis.
Figure 2 with 3 supplements
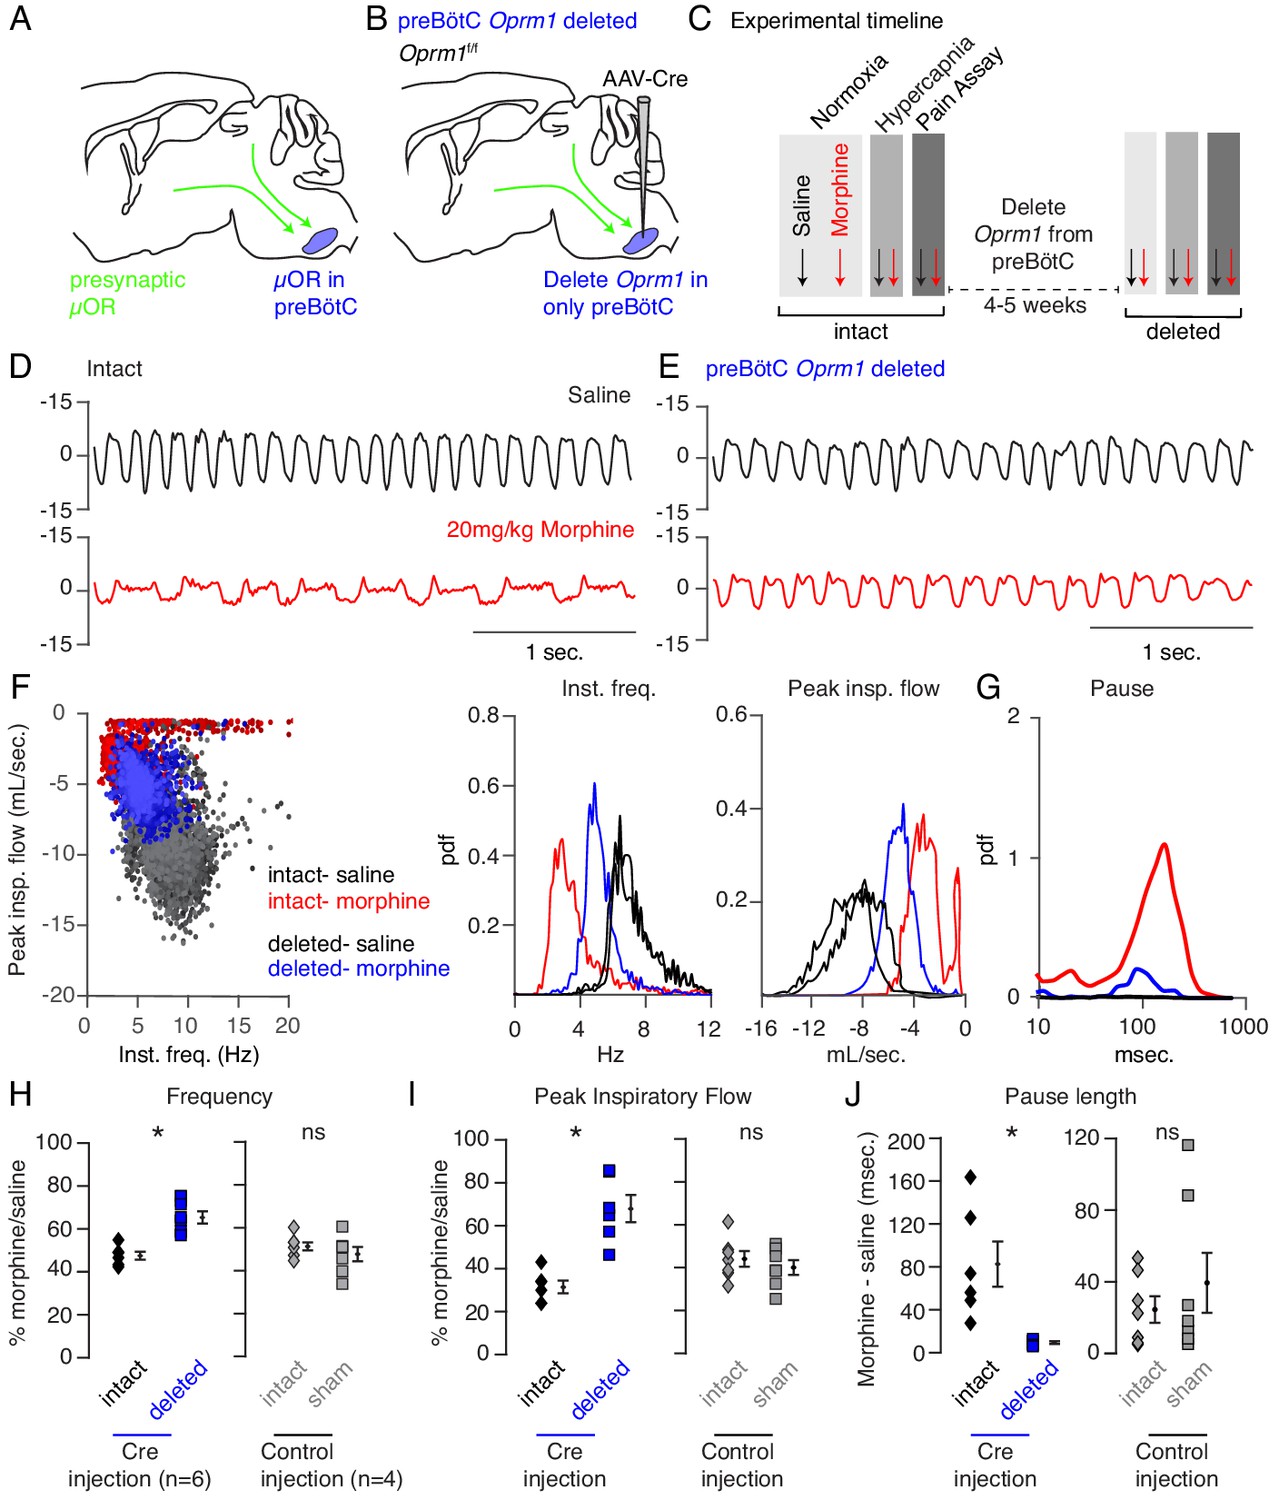
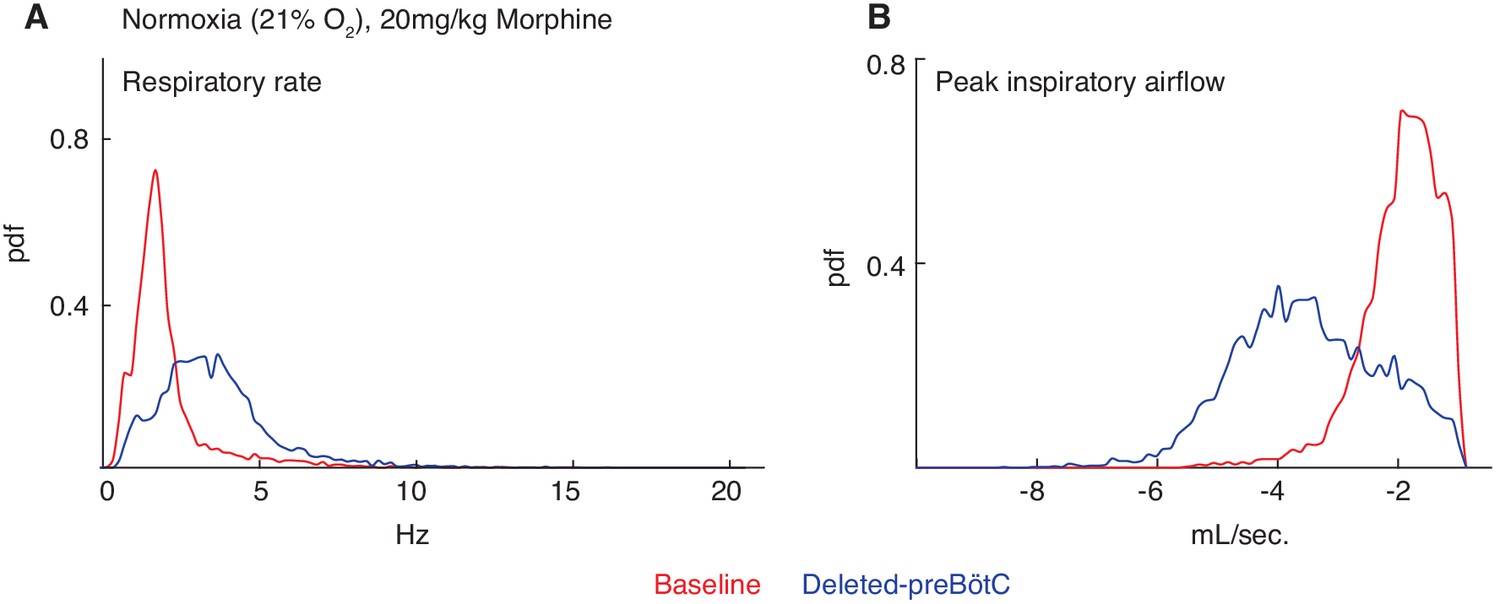
Necessity of preBötC ventrolateral brainstem in opioid-induced respiratory depression.
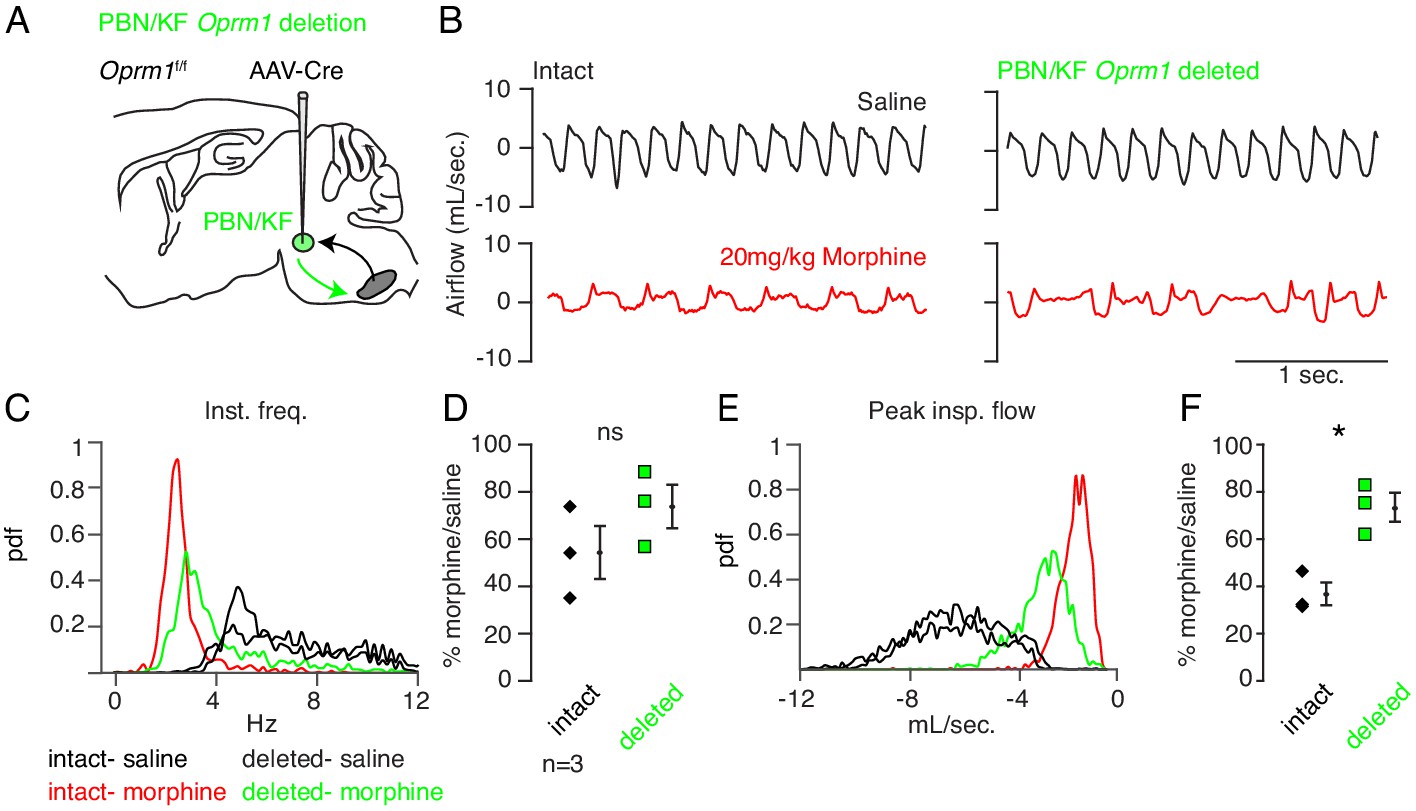
(A) Schematic of a sagittal section through the adult mouse brain. The µ-Opioid receptor (Oprm1) is expressed by a subset of preBötC neurons and is also expressed on presynaptic terminals of some neurons projecting to the preBötC. This confounds the effects observed after localized preBötC injection of opioid or naloxone to investigate its role in OIRD. (B) To overcome this, we eliminate Oprm1 only from the preBötC, and not the presynaptic inputs, to define the role of preBötC neurons in OIRD. (C) Experimental time-course. Breathing is measured 15 min after IP injection of saline or 20 mg/kg morphine in both normoxia and hypercapnia. Then Oprm1f/f animals are injected with a constitutive-Cre AAV into the preBötC bilaterally. After several weeks breathing is assayed again as above. In this way, each animal’s breathing before viral injection can serve as its own control breathing. Response to pain is also measured with a tail-flick assay before and after viral injection to ensure that analgesic response is unaffected. (D–E) Representative examples of the breathing airflow (mL/sec.) in hypercapnia after saline (black) or morphine (red) before (D) and after (E) Cre-virus injection. (F) Scatter plot of instantaneous respiratory frequency vs. airflow (ml/sec), as well as probability density function plots of both parameters for a representative animal during hypercapnia after saline (black) or morphine (red, blue) IP injection, before (red) and after (blue) Cre-injection. (G) Probability density function plot of pause length (msec.) for a representative animal during hypercapnia after IP morphine before (red) and after (blue) Cre-injection, log scale. Prevalence of long duration pauses is greatly reduced. (H–J) Ratio of average breathing parameters after IP injection of morphine-to-saline. Respiratory rate (H) p-value=0.003, Cohen’s d = 3.0), peak inspiratory airflow (I) p-value=0.0005, Cohen’s d = 3.01), and pause length (J) p-value=0.04, Cohen’s d = 2.0) for 6 Oprm1f/f animals with Cre-virus injected into the preBötC or 7 control animals with reporter-virus injected into the preBötC. All sham p-values were not significant (>0.09) and Cohen’s D < 0.6. For each experiment ‘intact’ values are before viral injection, with ‘deleted’ and ‘sham’ values representing post viral injection conditions in experimental and control animals, respectively. Diamond and square, single animal average. Mixed repeated two-way ANOVA comparing Cre vs. Sham injected was statistically significant for respiratory rate (F(1,11)=5.5, p-value=0.04) and pause (F(1,11)=6.2, p-value=0.03), but not for peak inspiratory airflow (F(1,11)=2.1, p-value=0.17) Black diamond, average of all animals. Error bar, standard error of mean (SEM). * indicates p-value<0.05. ns indicates p-value>0.05.
-
Figure 2—source data 1
Average frequency, peak flow and pause duration after intraperitoneal saline or morphine in hypercapnia at baseline or after Oprm1 deletion from the preBötC.
- https://cdn.elifesciences.org/articles/52694/elife-52694-fig2-data1-v2.xlsx
-
Figure 2—source data 2
Average frequency, peak flow and pause duration after intraperitoneal saline or morphine in hypercapnia at baseline or after sham viral injection into the preBötC.
- https://cdn.elifesciences.org/articles/52694/elife-52694-fig2-data2-v2.xlsx
Figure 2—figure supplement 1
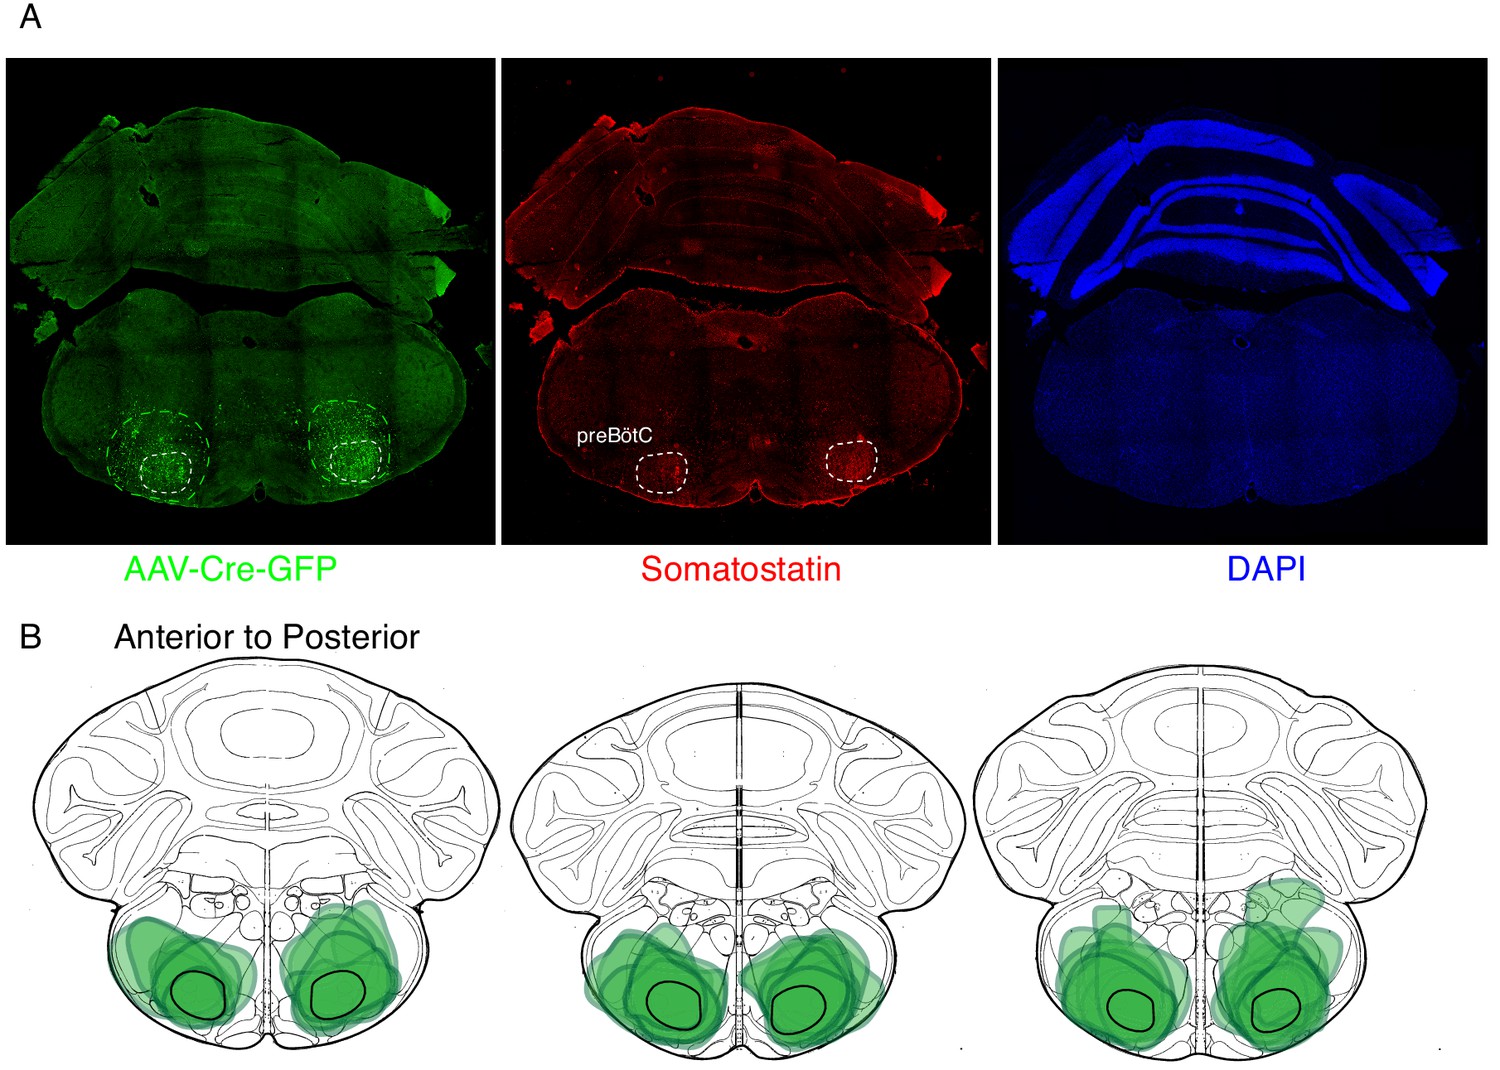
Expression of GFP protein from AAV-Cre-GFP after bilateral preBötC injection.
(A) GFP protein (green) and Somatostatin neuropeptide (red) expression in a 25 µM coronal section of the brainstem from an adult Oprm1f/f mouse injected bilaterally with AAV-Cre-GFP into the preBötC. Somatostatin expression demarcates the preBötC (dashed white circles, 43). This validates the specific targeting of AAV-Cre, and thus Oprm1 deletion, to the preBötC. (B) Schematic of three serial coronal sections of the mouse brain from most anterior (left) to posterior (right) that cover the preBötC injection sites visualized by AAV-Cre-GFP expression (example in A). The extend of GFP expression for each injection site is highlighted by the green annotations in B) and the representative example in A) (green dashed line). Note that overlap of all injection sites colocalizes with the preBötC (black solid line).
Figure 2—figure supplement 2
Necessity of the preBötC for complete opioid induced respiratory depression in normoxia.
The same animals in Figure 2 were also assayed for OIRD under normoxic instead of hypercapnic conditions. Briefly, breathing is measured 15 min after IP injection of 20 mg/kg morphine in normoxia, animals are injected with a constitutive-Cre AAV into the preBötC bilaterally, and after several weeks re-assayed as above. (A–B) A representative probability density function of respiratory rate (A) and peak inspiratory airflow (ml/sec, (B) of all breaths taken during the 40 min assay while in normoxia after intraperitoneal injection of 20 mg/kg morphine before (red) and after (blue) AAV-Cre injection. The increased respiratory rate and peak inspiratory airflow after bilateral preBötC AAV-Cre injection indicates that the rescue of OIRD observed in hypercapnia also occurs in normoxia.
Figure 2—figure supplement 3
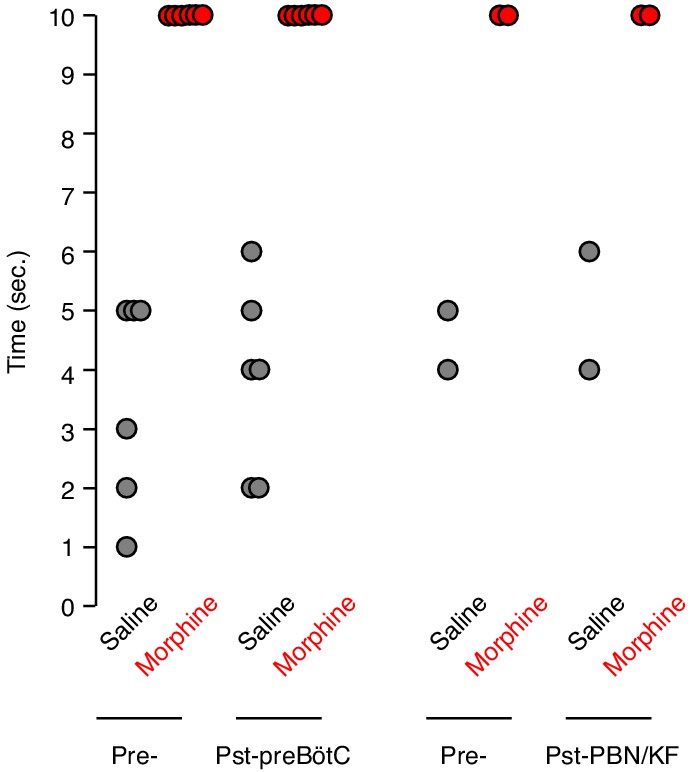
Tail flick response before and after bilateral preBötC or PBN/KF injection.
The tail flick response time was measured 15 min after IP saline (gray) or 20 mg/kg morphine (red) injection. Each animal was assayed twice before (Pre-) and twice after (Pst-) bilateral AAV-Cre-GFP injection into either the preBötC or PBN/KF of adult Oprm1f/f mice. Dot, time for single assay of one animal. Note, Oprm1 in the preBötC and PBN/KF is not required for morphine’s ability to blunt the tail flick response.
Figure 3 with 4 supplements

Necessity of Parabrachial/Kolliker Fuse nuclei and preBötC in opioid-induced respiratory depression.
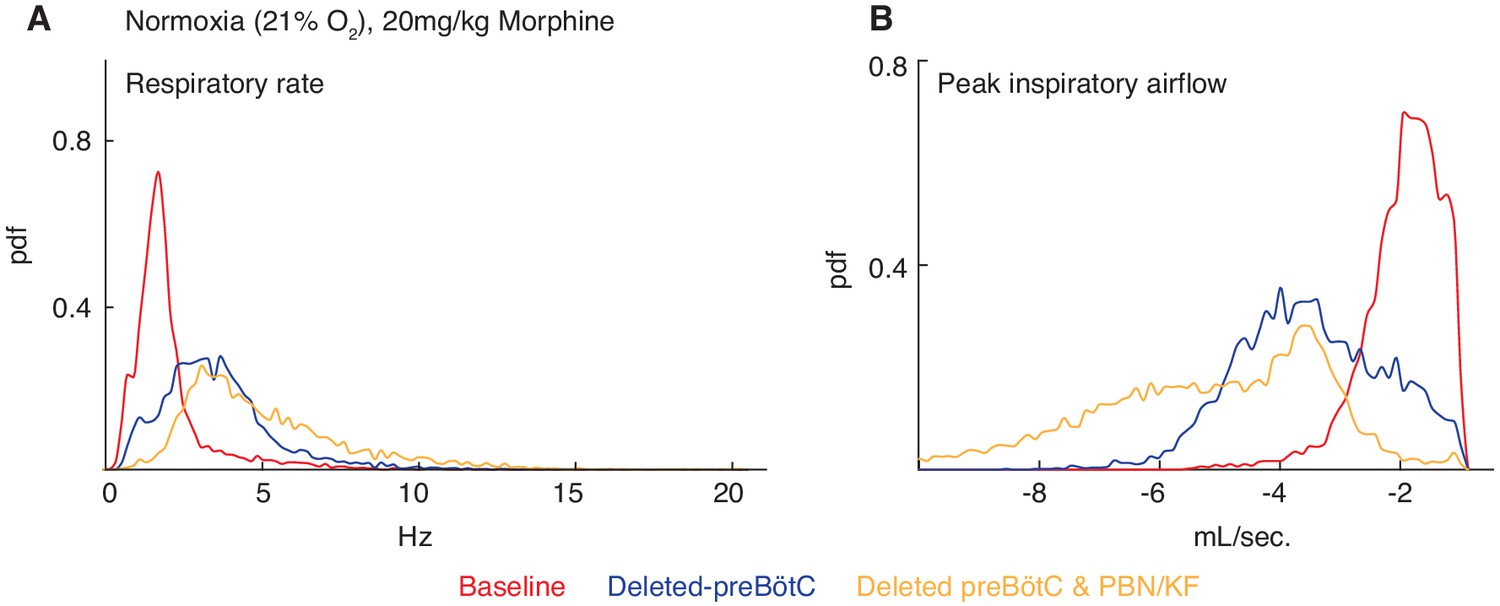
(A) Schematic of a sagittal section through the adult mouse brain showing Cre-viral injection into the preBötC and PBN/KF to measure their individual and combined contribution to OIRD. (B) Like Figure 2, breathing was assayed before and after each time Cre-virus was injected into Oprm1f/f mice. In cohort 1, Cre-virus was first injected into the preBötC and then the PBN/KF and in cohort 2, Cre-virus was injected into the PBN/KF and then preBötC. (C) Representative examples of the breathing airflow (mL/sec.) in hypercapnia for an animal in cohort 1 after saline (black) or morphine (red) before either viral injection and after both preBötC and PBN/KF Cre-virus injections. (D–E) Probability density function plot of the instantaneous respiratory frequency for a representative animal from cohorts 1 and 2 (D) and ratio of average rate (E) after IP injection of morphine-to-saline for 6 animals in cohort 1 and 4 animals in cohort 2 before (pre) and after each Cre-virus injection into the preBötC (blue) or PBN/KF (green). Among the 2 cohorts, n = 6 PBN/KF injections were bilateral and n = 4 mostly unilateral. Cohort 1: preBötC vs. double p-value=0.07, Cohen’s d = 0.70. Cohort 2: PBN/KF vs. double p-value=0.1, Cohen’s d = 0.76. (F–G) Probability density function plot of the peak inspiratory airflow for a representative animal from cohorts 1 and 2 (F) and ratio of average peak inspiratory airflow (G) after IP injection of morphine-to-saline before (pre) and after each Cre-virus injection into the preBötC (blue) or PBN/KF (green). preBötC Cre-injection has a larger magnitude rescue and after preBötC and PBN/KF injections animals barely have any OIRD phenotype. Cohort 1: preBötC vs. double p-value=0.85, Cohen’s d = 0.10. Cohort 2: PBN/KF vs. double p-value=0.03, Cohen’s d = 1.32. (H–I) Representative plethysmography traces in normoxia from a control Oprm1f/f mouse (N) or a double Cre-injected Oprm1f/f mouse (preBötC and PBN/KF, (O) after IP injection of 150 mg/kg fentanyl. * indicates p-value<0.05. ns indicates p-value>0.05.
-
Figure 3—source data 1
Average frequency, peak flow and pause duration after intraperitoneal saline or morphine in hypercapnia at baseline or after Oprm1 deletion from the preBötC or PBN/KF and then the preBötC and PBN/KF.
- https://cdn.elifesciences.org/articles/52694/elife-52694-fig3-data1-v2.xlsx
Figure 3—figure supplement 1
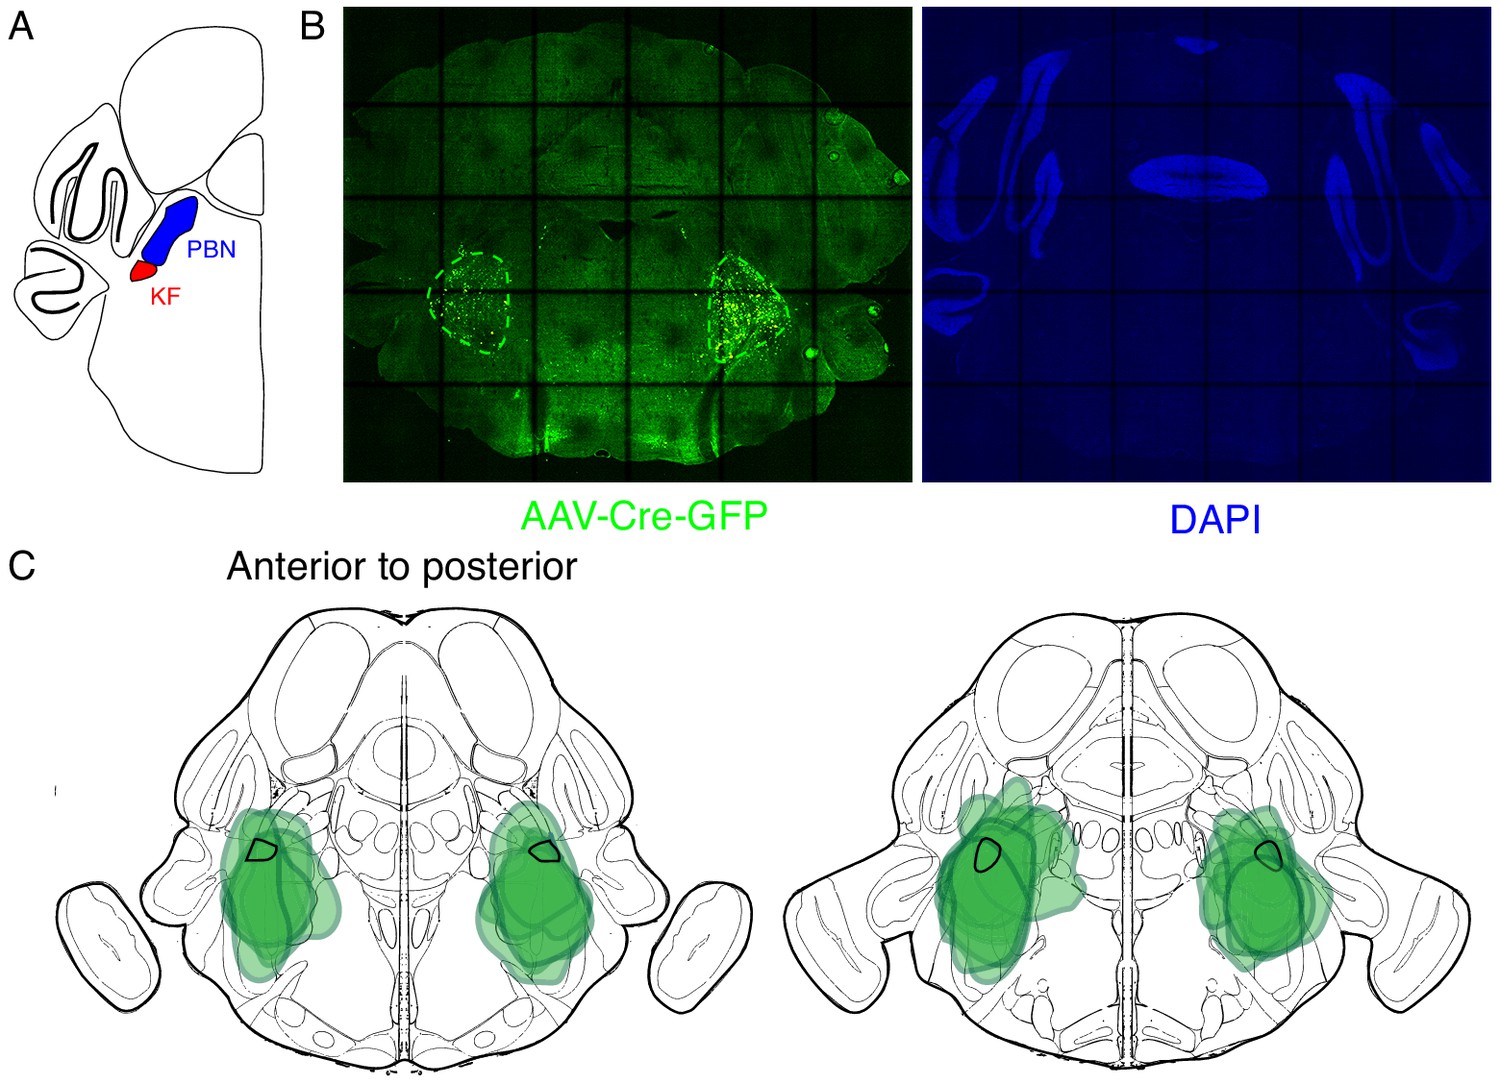
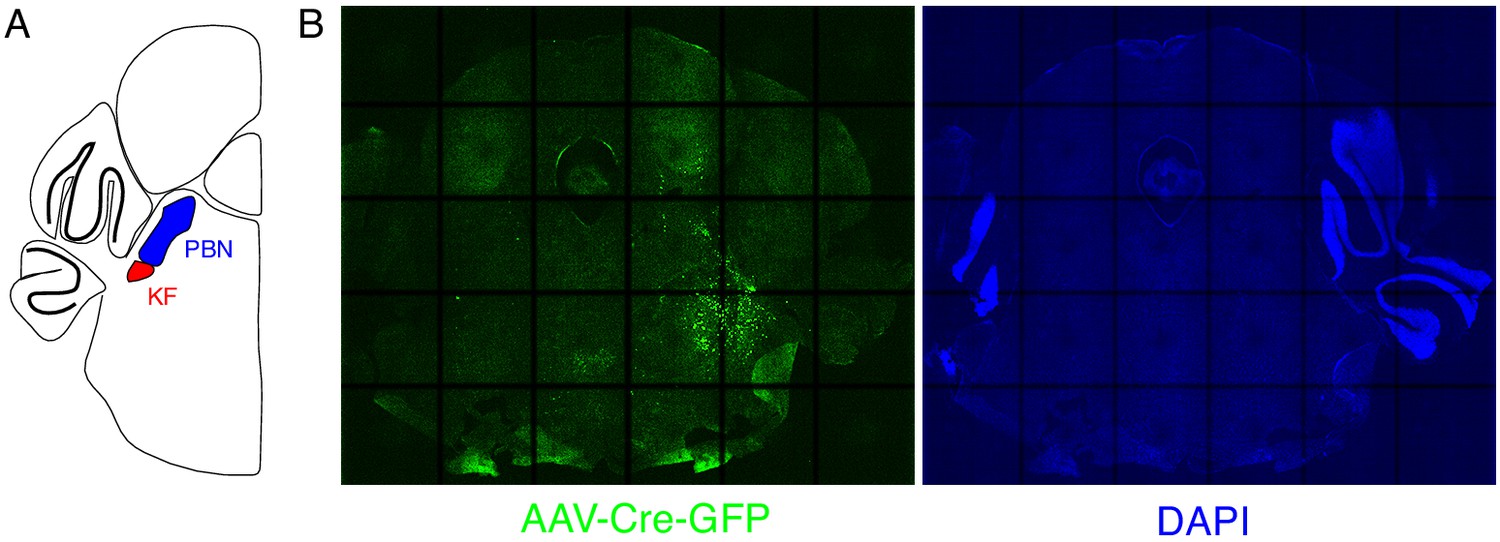
Expression of GFP protein from AAV-Cre-GFP after bilateral PBN/KF injection.
(A) Schematic of a coronal section through the brainstem at the position of the PBN/KF. The PBN/KF is in the dorsal brainstem near the cerebellar peduncle. Half the brain is represented here. (B) GFP protein (green) expression in a 25 µM coronal section of the brainstem from an adult Oprm1f/f mouse injected bilaterally with AAV-Cre-GFP into the PBN/KF. This anatomical localization of GFP validates the specific targeting of AAV-Cre, and thus Oprm1 deletion, to the PBN/KF. (C) Schematic of two serial coronal sections of the mouse brain from most anterior (left) to posterior (right) that cover the PBN/KF injection sites visualized by AAV-Cre-GFP expression (example in B). The extend of GFP expression for each injection site is highlighted by the green annotations in C), and the representative example in B) (green dashed line). Note that overlap of all injection sites contains the KF (black solid line).
Figure 3—figure supplement 2
Necessity of Parabrachial/Kolliker Fuse nuclei in opioid-induced respiratory depression.
(A) Schematic of a sagittal section through the adult mouse brain. Oprm1 is expressed by neurons within the pontine Parabrachial/Kolliker Fuse (PBN/KF) which has modulatory input into the preBötC (Chamberlin and Saper, 1994; Alheid et al., 2004) and is a proposed region for respiratory depression during OIRD (Smith et al., 1991; Feldman et al., 2013). As in Figure 2, breathing was assayed before and after Cre-virus injection into the PBN/KF of Oprm1f/f mice. (B) Representative examples of the breathing airflow (mL/sec.) in hypercapnia after saline (black) or morphine (red) before and after Cre-virus injection. (C–D) Probability density function plot of the instantaneous respiratory frequency for a representative animal (C) and ratio of average rate (D) p-value=0.4, Cohen’s d = 0.62) after IP injection of morphine-to-saline for 3 animals before (pre) and after (post) Cre-virus injection into the PBN/KF. (E–F) Probability density function plot of the peak inspiratory airflow for a representative animal (E) and ratio of average peak inspiratory airflow (F) p-value=0.02, Cohen’s d = 1.68) after IP injection of morphine-to-saline for 3 animals before (pre) and after (post) Cre-virus injection into the PBN/KF. * indicates p-value<0.05. ns indicates p-value>0.05.
-
Figure 3—figure supplement 2—source data 1
Average frequency, peak flow and pause duration after intraperitoneal saline or morphine in hypercapnia at baseline or after Oprm1 deletion from the PBN/KF.
- https://cdn.elifesciences.org/articles/52694/elife-52694-fig3-figsupp2-data1-v2.xlsx
Figure 3—figure supplement 3
Necessity of the preBötC and PBN/KF for complete opioid induced respiratory depression in normoxia.
The same animals in Figure 3 were also assayed for OIRD under normoxic instead of hypercapnic conditions. Breathing is measured 15 min after IP injection of 20 mg/kg morphine in normoxia before, several weeks after animals are injected with a constitutive-Cre AAV into the preBötC or PBN/KF bilaterally, and then after the complementary brain site is injected. (A–B) A representative probability density function of respiratory rate (A) and peak inspiratory airflow (ml/sec, (B) of all breaths taken during the 40 min assay while in normoxia after intraperitoneal injection of 20 mg/kg morphine before (red), after AAV-Cre injection into the preBötC (blue), and after AAV-Cre injection into the PBN/KF (yellow). Note the slight increase in respiratory rate and peak inspiratory airflow after bilateral PBN/KF AAV-Cre injection is consistent with data collected in hypercapnia and indicates that the preBötC is the dominant site.
Figure 3—figure supplement 4
Expression of GFP protein from AAV-Cre-GFP after mostly unilateral PBN/KF injection.
(A) Schematic of a coronal section through the brainstem at the position of the PBN/KF. The PBN/KF is in the dorsal brainstem near the cerebellar peduncle. Half the brain is represented here. (B) GFP protein (green) expression in a 25 µM coronal section of the brainstem from an adult Oprm1f/f mouse injected bilaterally with AAV-Cre-GFP into the PBN/KF. In this instance, GFP expression is robustly seen on right side and few cells are labeled on the left. This localization of GFP suggests targeting of AAV-Cre, and thus Oprm1 deletion, is only in to one PBN/KF.
Figure 4 with 3 supplements

Deletion of µ-Opioid receptor from neural subtypes to define their contribution to opioid depression of preBötC burst rhythm and amplitude.
(A) Schematic of single-cell mRNA sequencing paradigm. Postnatal day 0 (P0) medullary brainstem slices containing the preBötC bilaterally (circled in red) were dissected and isolated for sequencing. (B), Single cell transcriptome profiling of cells isolated from P0 preBötC. Of 1817 cells isolated, only 267 were presumed preBötC neurons of which only 21 expressed Oprm1 mRNA. (C), Heatmap of scaled transcript abundance for Oprm1 and markers of glutamatergic, gabaergic, and glycinergic preBötC neurons. Oprm1 expressing cells are both excitatory and inhibitory. (D), Schematic of extracellular recordings of the preBötC rhythm in P0-4 medullary brainstem slices. The preBötC has input to the hypoglossal motor neurons which form the CN12 rootlet, relaying an inspiratory motor command to the tongue in intact animals. Due to its input from the preBötC, extracellular recording from this rootlet display autonomous rhythmic activity corresponding to in vitro respiration (Mansour et al., 1994). (E), Representative recording of bursting activity after application of 50 nM DAMGO and 100 nM Naloxone. Top: in control (Oprm1f/f) slices bath application of 50 nM DAMGO quickly slowed and decreased the amplitude from baseline bursting. After rhythm cessation, bath application of Naloxone restored the rhythm. Bottom: in Slc17a6-cre;Oprm1f/f mice 50 nM DAMGO did not stop, or even slow rhythmic activity. (F), Percent of slices from each genotype with rhythm cessation after 50 nM DAMGO application. Control (n = 11), Gad2-Cre;Oprm1f/f (n = 6), Slc32a1-Cre;Oprm1f/f (n = 2), Slc6a5-Cre;Oprm1f/f (n = 4), and Slc17a6-Cre;Oprm1f/f (n = 3). (G), Schematic showing three subpopulations of glutamatergic lineages delineated by transcription factors Dbx1 and Foxp2. Foxp2 neurons represents a smaller, and overlapping, population of Dbx1 neurons. (H,) Identification of molecular subtypes of Oprm1 preBötC excitatory neurons. Sagittal section of the preBötC from a P0 Oprm1-mCherry;Dbx1-Cre;Rosa-LSL-YFP mouse immunostained for mCherry (OPRM1 fused to mCherry, red), YFP (Green) and FOXP2 (Blue). About ~50% of Oprm1 preBötC neurons are glutamatergic/Dbx1 derived (arrowhead) and of those,~35% express FOXP2 (asterisk). Scale bar, 50 µM. (I,) Quantification of the number of preBötC for each molecular subtype identified in H. J), Dose response curve for the bursting rate and amplitude after bath application of 0, 50, 100, and 500 nM DAMGO applied to Slc17a6-Cre;Oprm1f/f (gray, n = 3), Dbx1-Cre;Oprm1f/f (green, n = 3), Foxp2-Cre;Oprm1f/f (blue, n = 4) and control (black, n = 11) P0-4 preBötC slices. Rate and amplitude for each slice are normalized to baseline. (K), Schematic summary showing that the key node for opioids to suppress breathing is the preBötC and within this site, elimination of Oprm1 from just a small subset of those neurons,~70–140 excitatory neurons, prevents opioid respiratory suppression.
Figure 4—figure supplement 1
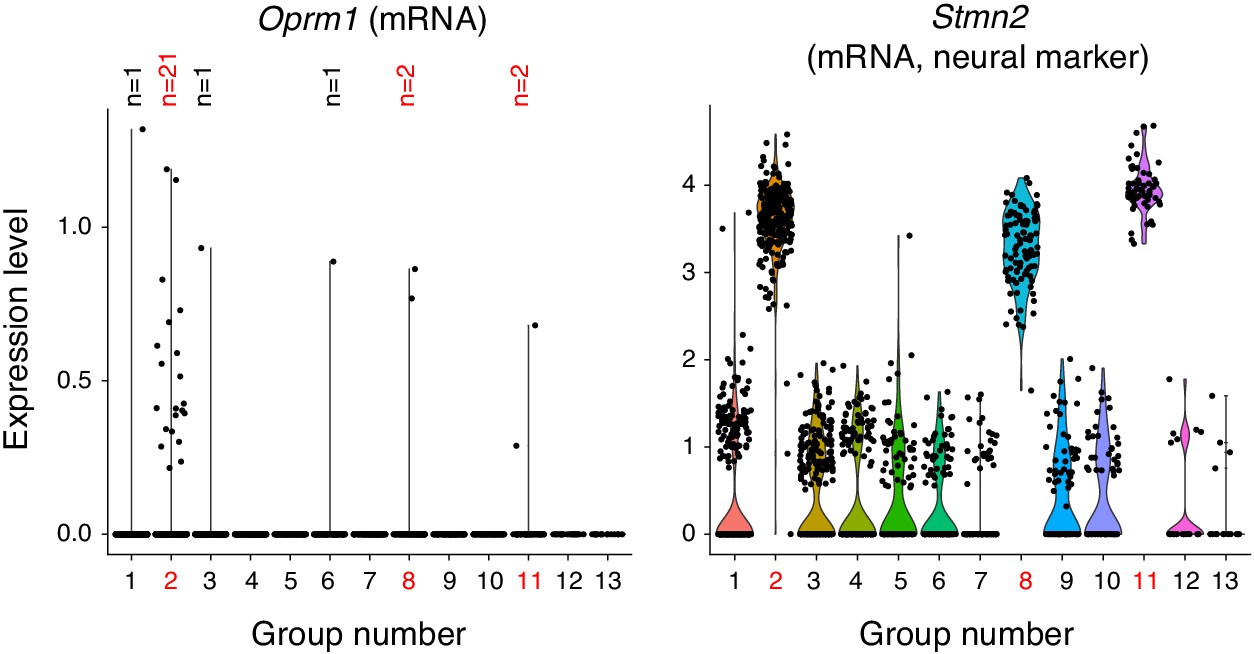
Single cell transcriptome profiling of ventrolateral brainstem neurons.
1817 single cells were isolated from the ventrolateral medulla of the P0 mouse. The transcriptome was sequenced with 10X genomics technology and cells were clustered by principle components analysis into 13 groups. three groups (2, 8, and 11, red numbers) expressed neural markers like Stmn2 (mRNA) shown here. Group two was a mixture of excitatory and inhibitory neurons and is the presumed preBötC cluster due to expression of Sst, Tacr1, and Cdh9 (mRNA, not shown). Group eight is a BötC cluster based on expression of Gad1 and Neurod6 (mRNA, not shown). Group 11 is a lateral reticular nucleus cluster based on expression of Zic1 and Barhl1 (mRNA, not shown). All other groups were oligodendrocytes, oligodendrocyte precursor cells, astrocytes, microglia and endothelial cells. The only group with enriched Oprm1 (mRNA) expression is the preBötC group 2. Within this group only 21/267 neurons express Oprm1 (mRNA). The single cell in group 1, 3, 6 (which are non-neural) that express Oprm1 (mRNA) are presumed contaminants.
Figure 4—figure supplement 2
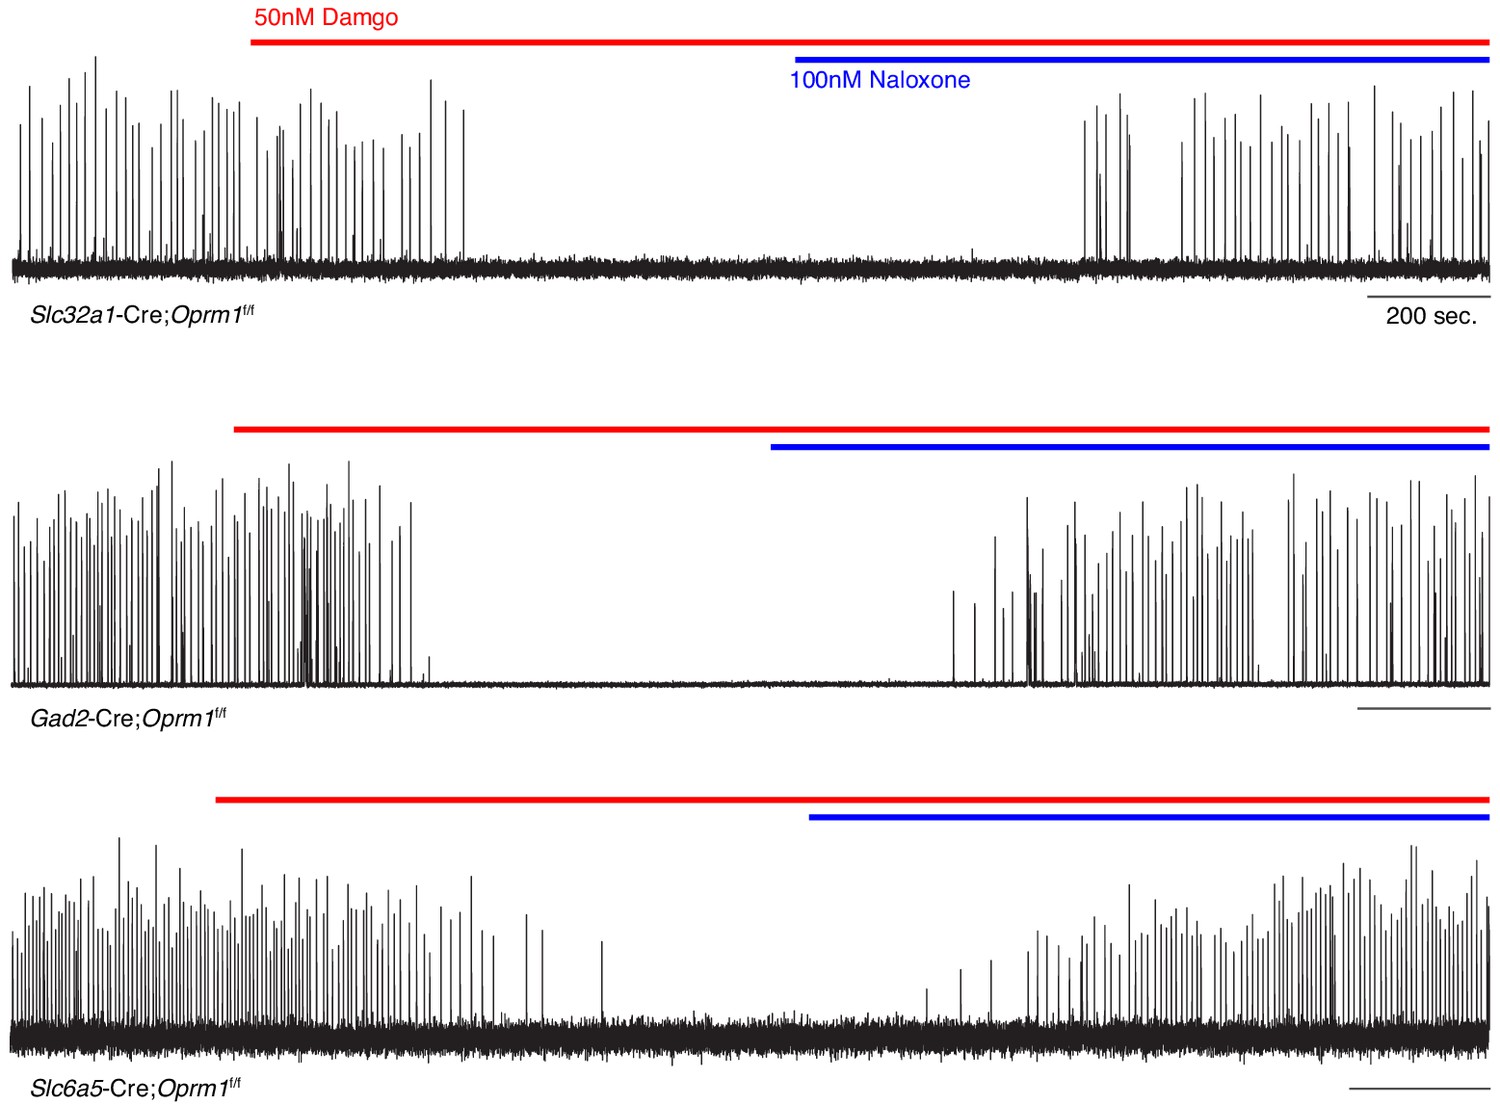
preBötC slice activity in 50 nM DAMGO after deletion of Oprm1 from inhibitory neural types.
Representative recording of bursting activity at baseline, after application of 50 nM DAMGO (red line), and 100 nM Naloxone (blue line). Top: Slc32a1-Cre;Oprm1f/f targeting GABAergic neurons (n = 2). Middle: Gad2-Cre;Oprm1f/f targeting GABAergic neurons (n = 6). Bottom: Slc6a5-Cre;Oprm1f/f targeting Glycinergic neurons (n = 4).
Figure 4—figure supplement 3
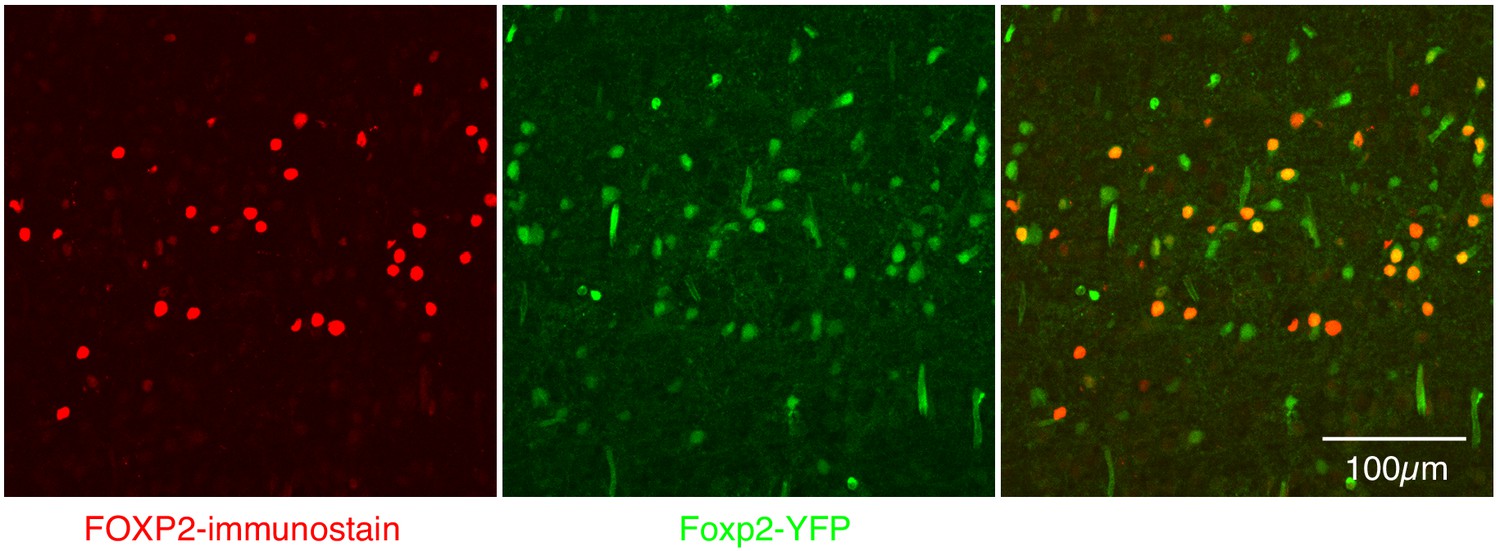
Expression of FOXP2 protein and in Foxp2-derived cells within the preBötC.
Nearly perfect colocalization of FOXP2 protein (red) and YFP (green) in a 25 µM sagittal section of the preBötC from a P0 Foxp2-Cre;Rosa-LSL-YFP mouse. This validates the use of Foxp2-Cre to remove Oprm1 from Foxp2-derived neurons. Scale bar, 100 µM.
Author response image 1
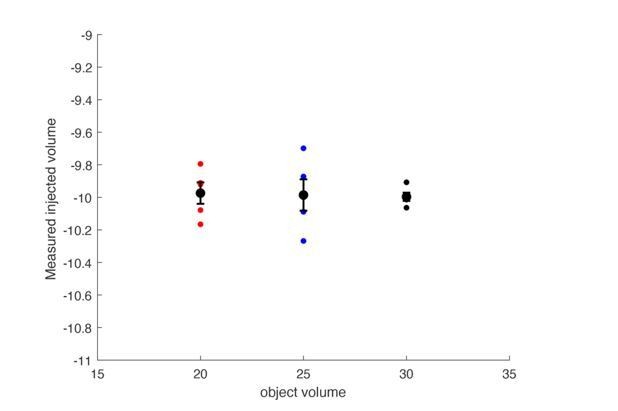
The plethysmograph was filled with either a 20, 25 or 30mL object to approximate a 20, 25, or 30 gram mouse.
The plethysmograph was injected with 10mL of air and the change in pressure was integrated to calculate a tidal volume. The calculated tidal volumes were all centered at 10mL’s and the size of the object did not impact the calculated volume.
Author response image 2
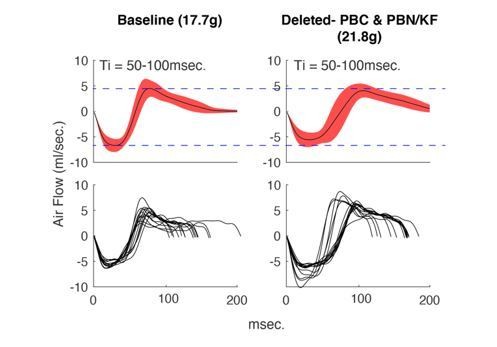
Average +/- SD (top) and example breaths (bottom) that have Ti between 50-100msec.
from the same animal during control hypercapnia recordings from the beginning of our protocol (left) versus the end (right). Notice that although the mouse has gained weight, the airflow of these breaths has not changed.
Tables
Key resources table
| Reagent type (species) or resource | Source or reference | Identifiers | Additional information | |
|---|---|---|---|---|
| Genetic reagent (Mus musculus) | Oprm1f/f | The Jackson Laboratory | 030074 | RRID:IMSR_JAX:030074 |
| Genetic reagent (Mus musculus) | Oprm1-mCherry | The Jackson Laboratory | 029013 | RRID:IMSR_JAX:29013 |
| Genetic reagent (Mus musculus) | Slc17a6-Cre | The Jackson Laboratory | 016963 | RRID:IMSR_JAX:016963 |
| Genetic reagent (Mus musculus) | Gad2-Cre | The Jackson Laboratory | 0101802 | RRID:IMSR_JAX:0101802 |
| Genetic reagent (Mus musculus) | Slc32a1-Cre | The Jackson Laboratory | 028862 | RRID:IMSR_JAX:028862 |
| Genetic reagent (Mus musculus) | Slc6a5-Cre | PMID:25643296 | ||
| Genetic reagent (Mus musculus) | Dbx1-Cre | PMID:16041369 | ||
| Genetic reagent (Mus musculus) | Foxp2-Cre | PMID:27210758 | ||
| Genetic reagent (Mus musculus) | Rosa-LSL-YFP | The Jackson Laboratory | 006148 | RRID:IMSR_JAX:006148 |
| Adenovirus | AAV5-CMV-Cre-GFP | UNC Vector Core | AAV5 | |
| Adenovirus | AAV5-CAG-GFP | UNC Vector Core | AAV5 | |
| Adenovirus | AAV5-CAG-tdtomato | UNC Vector Core | AAV5 | |
| Antibody | rabbit anti-SST | Peninsula | T-4103 | 1:500 |
| Antibody | rabbit anti-FOXP2 | Abcam | ab16046 | 1:500 |
| Antibody | chicken anti-GFP | Abcam | ab13970 | 1:500 |
| Antibody | rat anti-mCherry | Lifetech | M11217 | 1:500 |
| Antibody | goat anti-rat 555 | Lifetech | A21434 | 1:200 |
| Antibody | goat anti-chicken 488 | Lifetech | A11039 | 1:200 |
| Antibody | goat anti-rabbit 633 | Lifetech | 35562 | 1:200 |
| Chemical compound | Morphine sulfate | Henry Schein | 057202 | 20 mg/kg |
| Chemical compound | Fentanyl citrate | Sigma | F3886 | 150 mg/kg |
| Peptide | DAMGO | Abcam | ab120674 | 20–500 nM |
Additional files
-
Supplementary file 1
Animal behavior during recordings of breathing in normoxia and hypercapnia.
- https://cdn.elifesciences.org/articles/52694/elife-52694-supp1-v2.zip
-
Transparent reporting form
- https://cdn.elifesciences.org/articles/52694/elife-52694-transrepform-v2.pdf
Download links
A two-part list of links to download the article, or parts of the article, in various formats.
Downloads (link to download the article as PDF)
Open citations (links to open the citations from this article in various online reference manager services)
Cite this article (links to download the citations from this article in formats compatible with various reference manager tools)
Opioids depress breathing through two small brainstem sites
eLife 9:e52694.
https://doi.org/10.7554/eLife.52694


