Layered roles of fruitless isoforms in specification and function of male aggression-promoting neurons in Drosophila
- Molecular Neurobiology Laboratory, The Salk Institute for Biological Studies, United States
- Neuroscience Graduate Program, University of California, United States
Figures
Figure 1 with 3 supplements
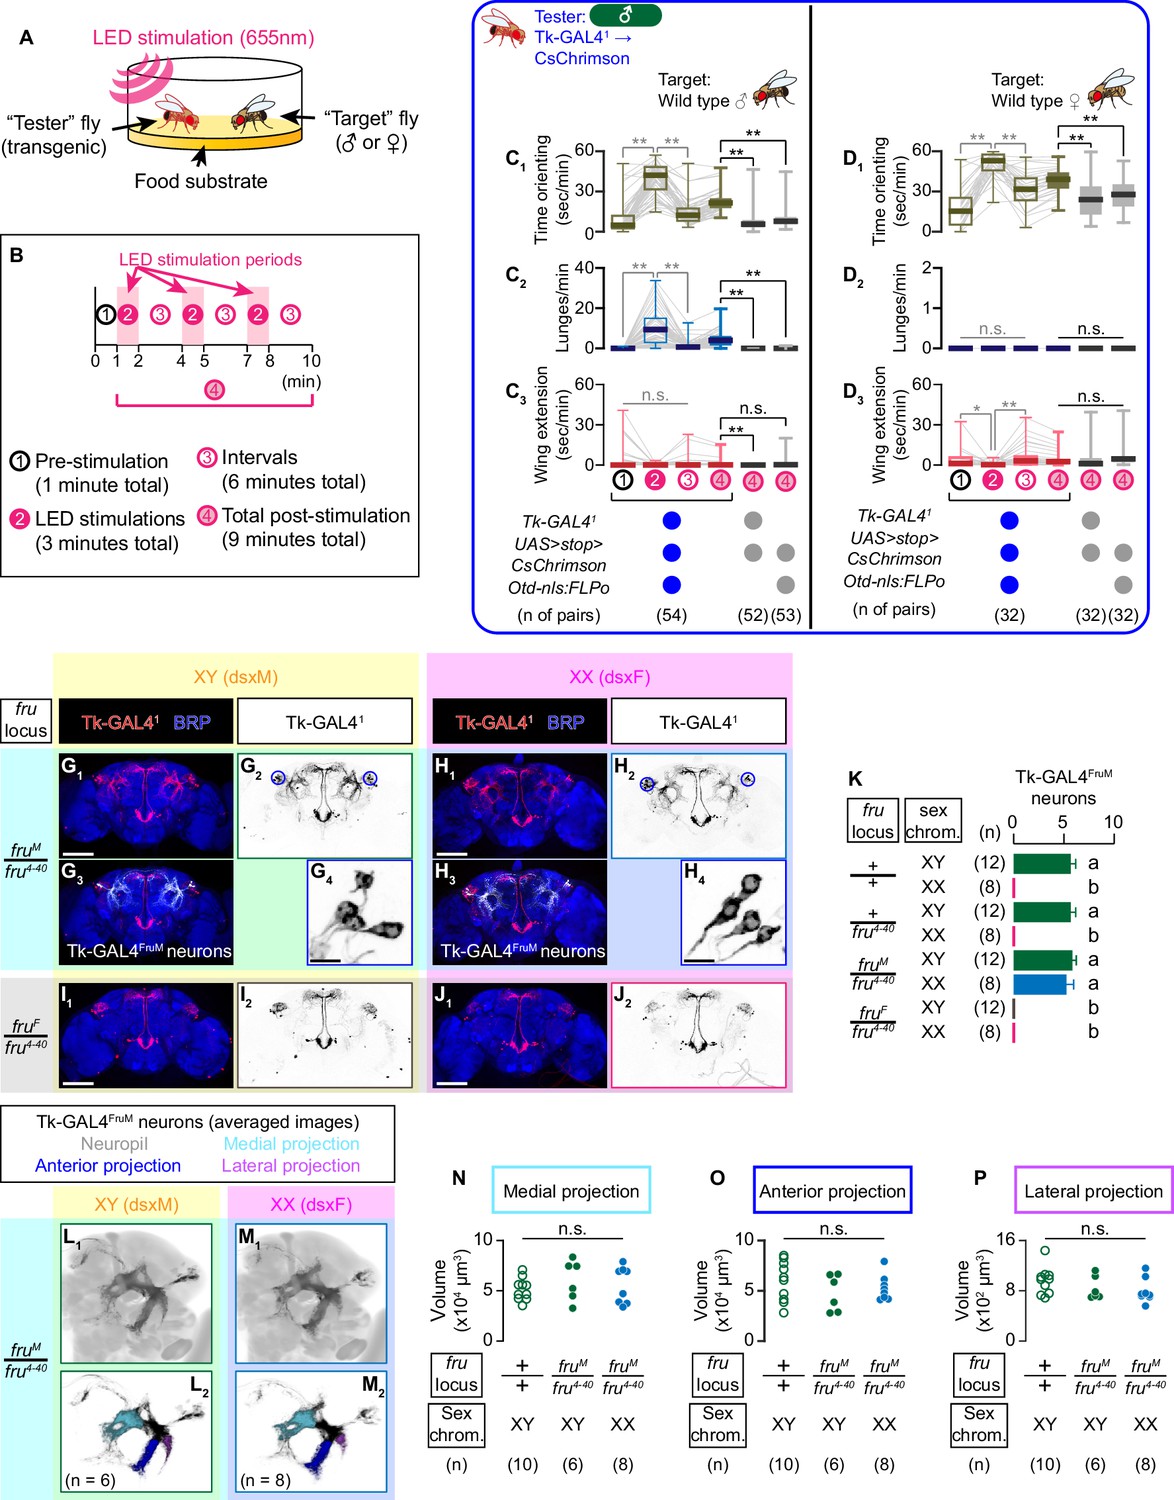
Tk-GAL4FruM neurons are specified by fru.
(A) Schematic of the design of behavioral assays. (B) Schematic of the optogenetic stimulation paradigm. Time windows 1–4 represent periods in which behavioral parameters are pooled and calculated in subsequent panels. (C, D) Boxplots of time orienting (C1, D1), lunges (C2, D2), and wing extensions (C3, D3) by the tester flies during the time windows 1–4 (see B). Their genotypes and pair numbers are indicated below the plots. Gray lines represent single testers. Target flies are either group-housed wild-type males (C) or mated females (D). In gray: **p<0.01, *p<0.05, n.s. p>0.05 (Kruskal-Wallis one-way ANOVA and post-hoc Wilcoxon signed rank test). In black: **p<0.01, n.s. p>0.05 (Kruskal-Wallis one-way ANOVA and post-hoc Mann-Whitney U-test). (E) Schematics of the sex-determination pathway in Drosophila. (F) Schematic of the four sex genotypes defined by dsx and fru splicing. (G–J) Expression of CsChrimson:tdTomato under the control of Tk-GAL41 and Otd-nls:FLPo (red in G1–J1), black in G2,3-J2,3) in brains of a male (G), fruM female (H), fruF male (I), and female (J) flies is visualized together with a neuropil marker BRP (blue) by immunohistochemistry. Traced Tk-GAL4FruM neurons in a male (G3) and a fruM female (H3) are shown in white. Circle: soma (right cluster is enlarged in G4 and H4). Scale bar: 100 μm (G1–J1), 10 μm (G4, H4). (K) Mean number of cell bodies per hemibrain visualized by anti-DsRed antibody in each genotype represented in G–J) and Figure 1—figure supplement 2J–M. Error bars: S.D. Genotypes and number of hemibrains examined are indicated to the left. Lowercase letters denote significance group (p<0.01, one-way ANOVA with post-hoc Tukey’s honestly significant difference test). (L, M) Z-projection of segmented, registered, and averaged images of CsChrimson:tdTomato expression under the control of Tk-GAL41 and Otd-nls:FLPo (black) in the standard Drosophila brain (gray in L1, (M1). Number of used hemibrains are indicated in L2, M2. N-P: Volumes of medial projection (N), anterior projection (O), and lateral projection (P) of Tk-GAL4FruM neurons in males with genotypes indicated below. Their genotypes and pair numbers are indicated below the plots. n.s. p>0.05 (Kruskal-Wallis one-way ANOVA).
Figure 1—figure supplement 1
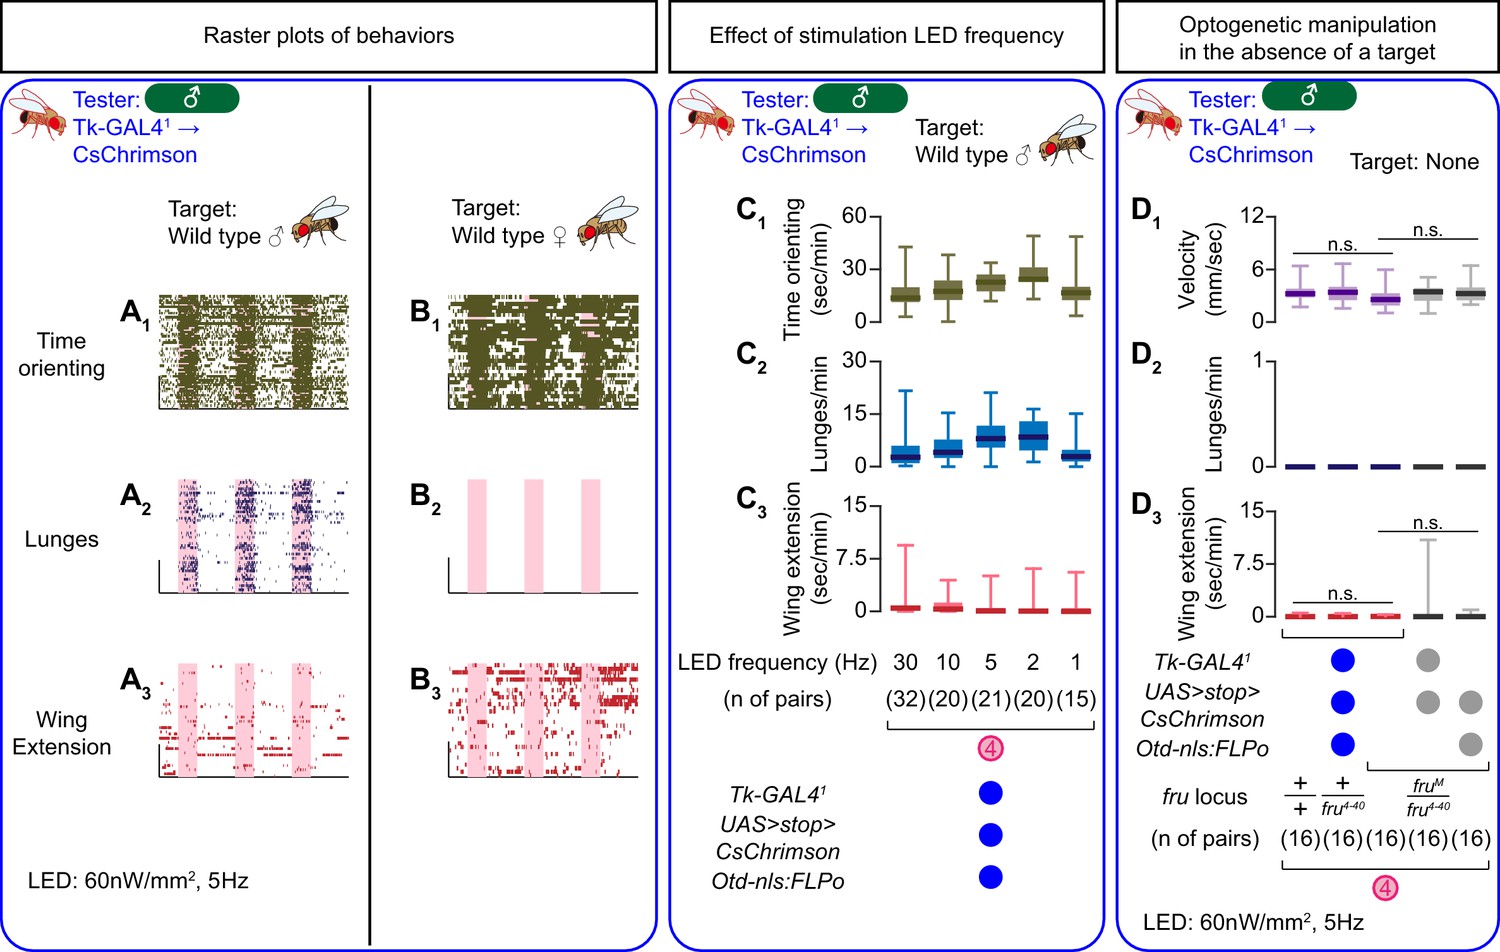
Effects of fru locus genotypes on the specification and function of Tk-GAL4FruM neurons.
(A, B) Rasters of time orienting (A1, B1), lunges (A2, B2), and wing extensions (A3, B3) performed by male tester flies that express CsChrimson:tdTomato under the control of Tk-GAL41 and Otd-nls:FLPo (the same datasets as used in Figure 1C, D. Pink bar: LED-on periods, horizontal bar: 10 min, vertical bar: 10 flies. LED stimulation condition is indicated at the bottom. (C) Boxplots of time orienting (C1), lunges (C2), and wing extension (C3) by the tester flies during the time windows 2 (left) and 4 (right) (see Figure 1D). Tester’s genotype (indicated below) is the same as testers in A and B. LED frequencies were varied as indicated below the plot. Target flies are wild-type group-housed males. (D) Boxplots of velocity (D1), lunges (D2), and wing extensions (D3) performed by male tester flies that express CsChrimson:tdTomato under the control of Tk-GAL41 and Otd-nls:FLPo in the absence of a target fly.
Figure 1—figure supplement 2
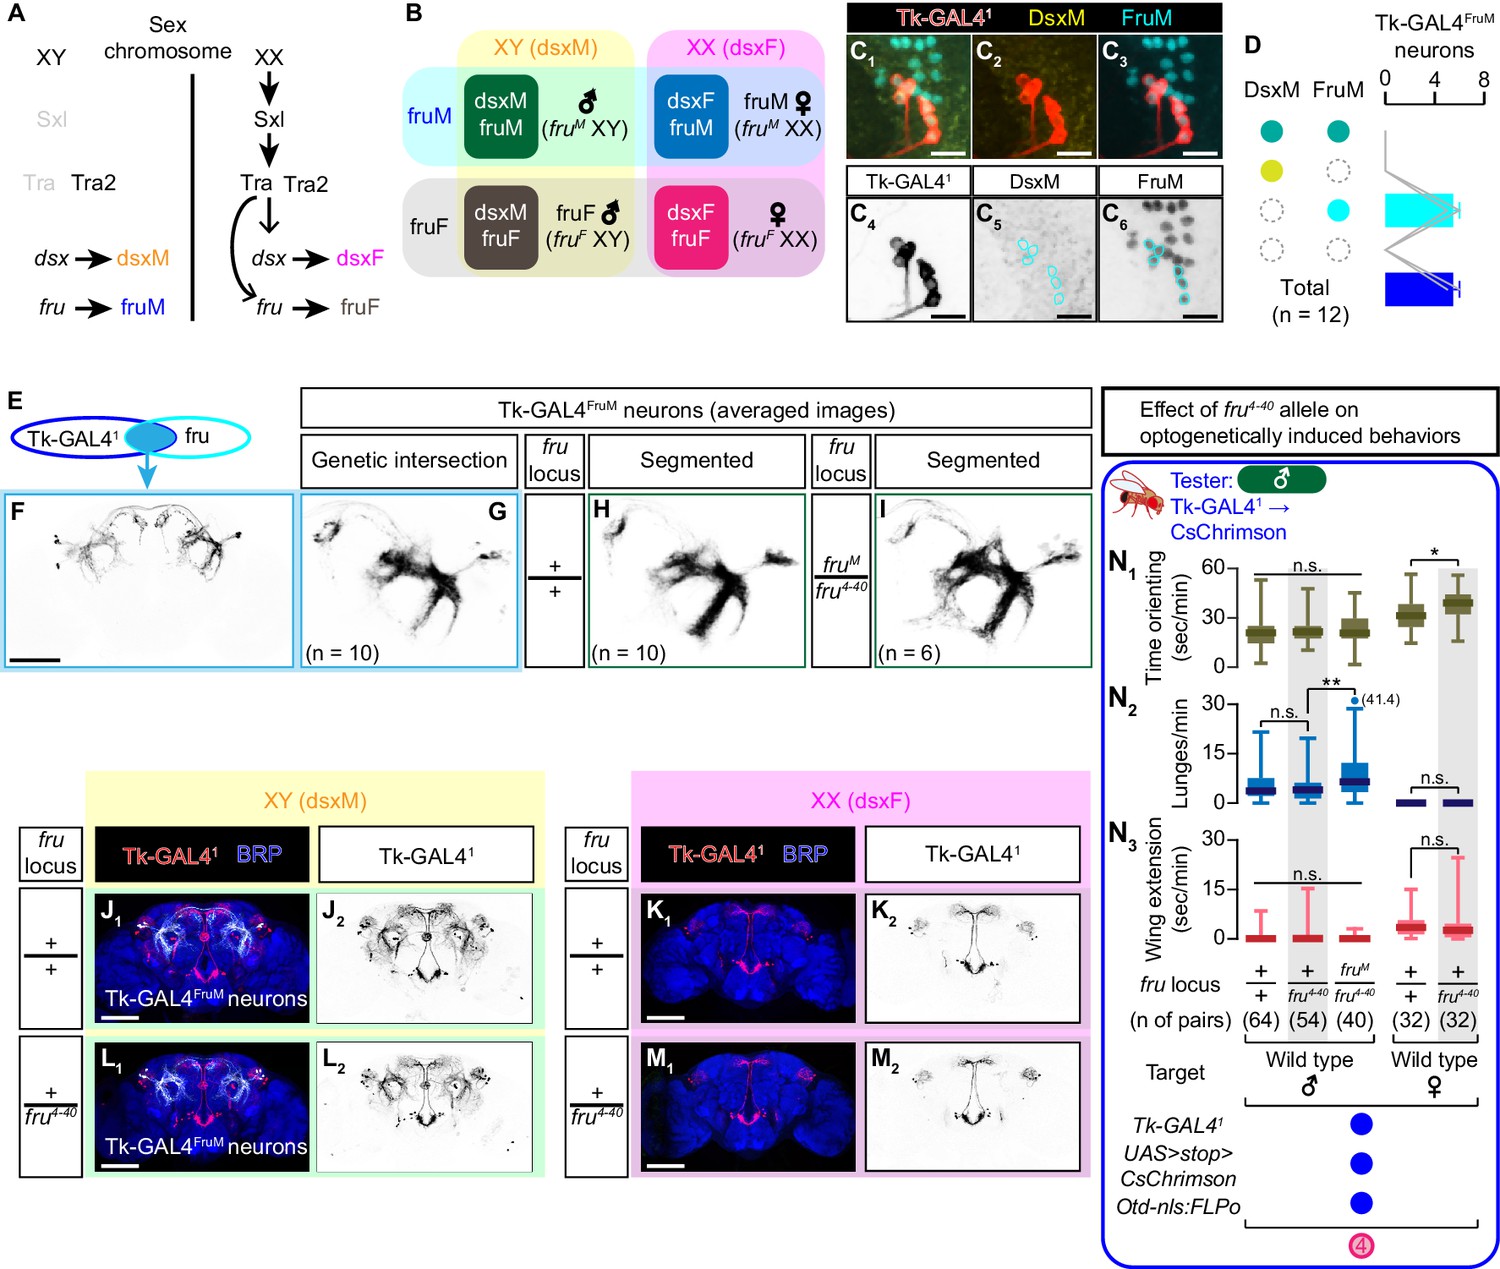
Detailed characterization of Tk-GAL4FruM neurons.
(A) Schematic of the sex-determination pathway in Drosophila. (B) Schematic of the four sex genotypes defined by dsx and fru splicing. (C) Representative image of Tk-GAL4FruM neurons (red in C1–C3), black in C4) visualized by immunohistochemistry against tdTomato along with immunoreactivity against DsxM (yellow in C1, C2, black in C5) and FruM (cyan in C1), (C3), black in C6) (scale bar: 10 µm). All 6 cells express FruM, but not DsxM (cyan circles in C5,6). (D) Mean number of Tk-GAL4FruM neuronal cell bodies per hemibrain, categorized by immunoreactivity against DsxM and FruM. Gray lines represent single hemibrains. Error bars: S.D. (E) A schematic representation of Tk-GAL4FruM neurons (light blue). (F) Expression of CsChrimson:tdTomato in a representative male brain under the control of Tk-GAL41 and fruFLP is visualized by immunohistochemistry (scale bar: 100 µm). (G–I) Z-projection of segmented (H and I), registered, and averaged images of CsChrimson:tdTomato expression under the control of the genetic intersection of Tk-GAL41 and fru (G) (see Materials and methods for the complete genotypes), and of Tk-GAL41 and Otd-nls:FLPo in fru wild-type male (H) and fruM/fru4-40 male (I) (black). Number of used hemibrains are indicated. (J–M) Expression of CsChrimson:tdTomato (red in J1–M1), black in J2–M2) under the control of Tk-GAL41 and Otd-nls:FLPo in representative brains of flies with the fru locus genotype indicated on the left is visualized together with a neuropil marker BRP (blue in J1–M1) by immunohistochemistry. Traced Tk-GAL4FruM neurons in males (J1, L1) are shown in white. Scale bar: 100 μm. Arrows: soma. (N) Boxplots of time orienting (N1), lunges (N2), and wing extensions (N3) performed by male tester flies that express CsChrimson:tdTomato under the control of Tk-GAL41 and Otd-nls:FLPo. Testers’ fru locus genotypes are indicated below the plots. Target flies are either group-housed wild-type males or mated females, as indicated. Plots with gray shades are replots of the data sets shown in Figure 1C and D. Only values during the time window 4 are shown (see Figure 1B). Testers’ genotypes and sample numbers are indicated below the plots. **p<0.01, *p<0.05, n.s. p>0.05 (Kruskal-Wallis one-way ANOVA and/or post-hoc Mann-Whitney U-test).
Figure 1—figure supplement 3
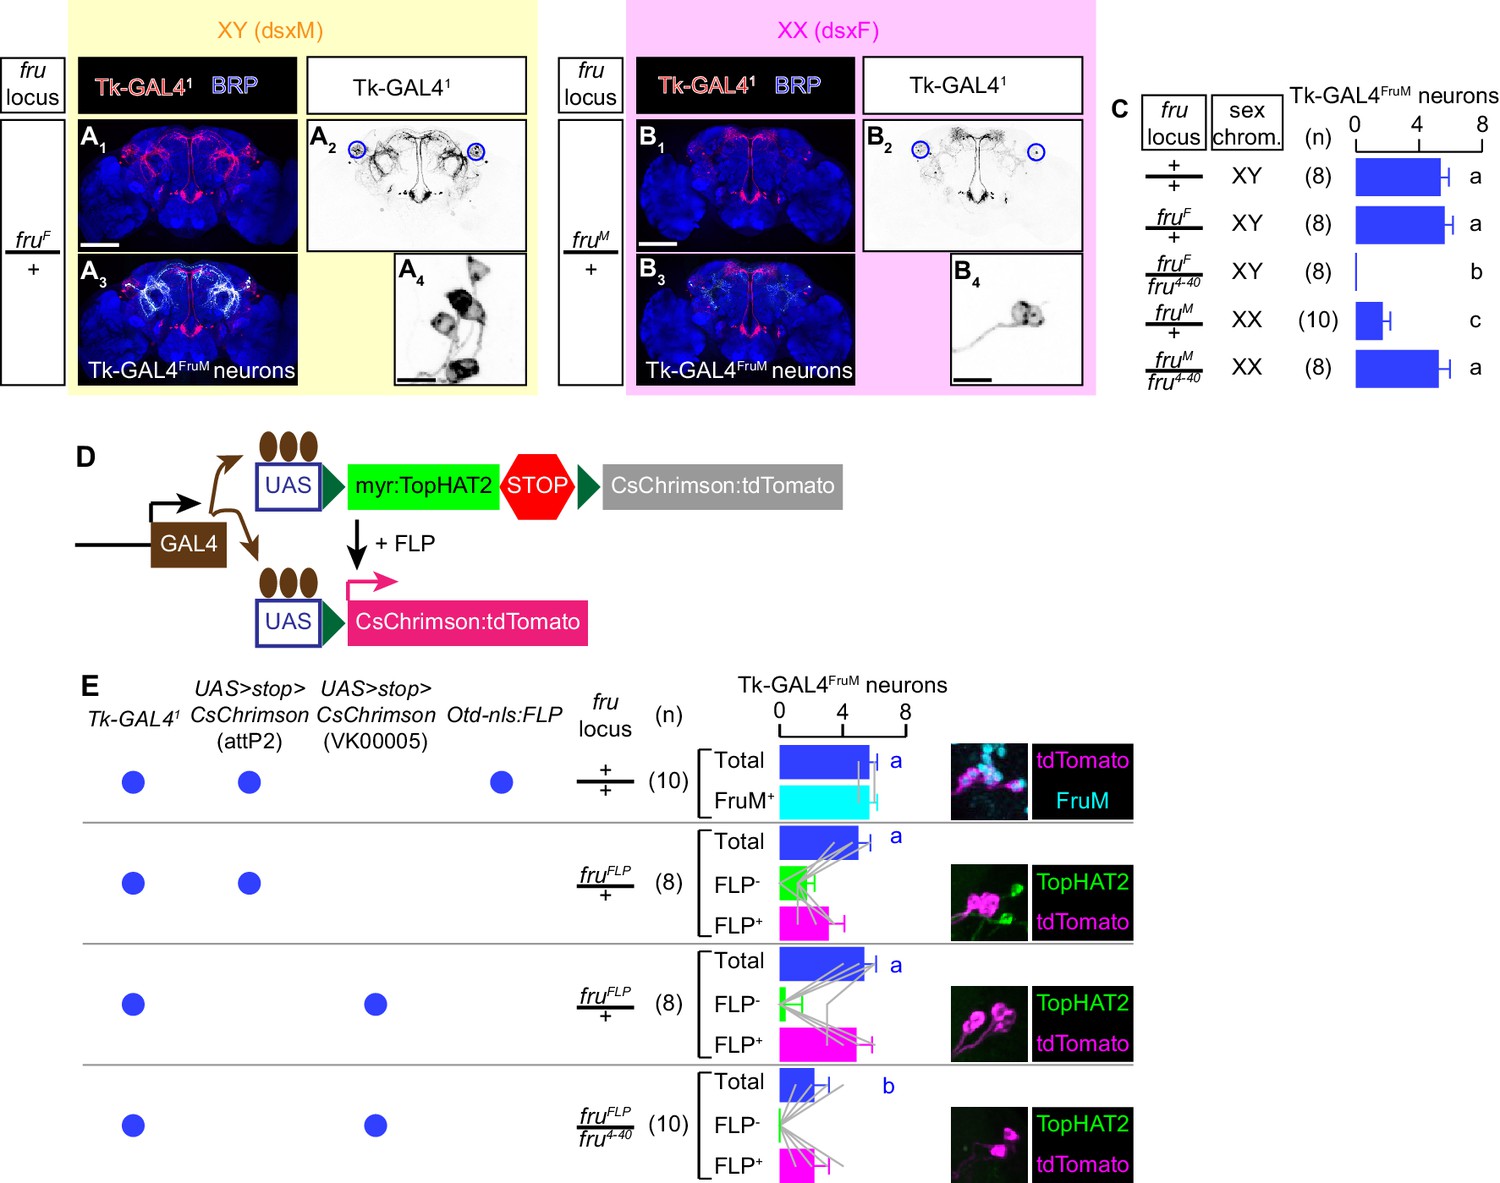
Effects of fru alleles on the specification of Tk-GAL4FruM neurons.
(A, B) Expression of CsChrimson:tdTomato (red in A1,3, B1,3, black in A2,4, B2,4) under the control of Tk-GAL41 and Otd-nls:FLPo in representative brains of flies with the fru locus genotype indicated on the left is visualized together with a neuropil marker BRP (blue in A1,3, B1,3) by immunohistochemistry. Traced Tk-GAL4FruM neurons are shown in white (A3, B3). Circle: soma (right cluster is enlarged in A4 and B4). Scale bar: 100 μm (E1–H1), 10 μm (E4, F4). (C) Mean number of Tk-GAL4FruM neurons per hemibrain in each genotype indicated to the left. Error bars: S.D. Number of hemibrains examined are indicated to the left. Lowercase letters denote significance group (p<0.01, one-way ANOVA with post-hoc Tukey’s honestly significant differences test). (D) Schematics of the genetic intersection strategy between a GAL4 line and a FLP allele to express CsChrimson:tdTomato used in this study. (E) Mean number of Tk-GAL4FruM cell bodies visualized by anti-DsRed antibody in each genotype shown in left. Error bars: S.D. Brains from the top genotype were also co-immunostained by anti-FruM antibody, and the breakdown of FruM-expressing cells and FruM-negative cells is shown. Brains from other genotypes were also co-immunostained by anti-HA antibody to visualize the expression of myr:TopHAT2 (see D), and the breakdown of tdTomato-expressing cells and TopHAT2-expressing cells is shown (gray lines represent single hemibrains). Lowercase letters denote significance group (p<0.01, one-way ANOVA with post-hoc Tukey’s honestly significant differences test). Expression of each antigen in the cell bodies of representative brains of flies from each genotype is shown on the right.
Figure 2 with 3 supplements
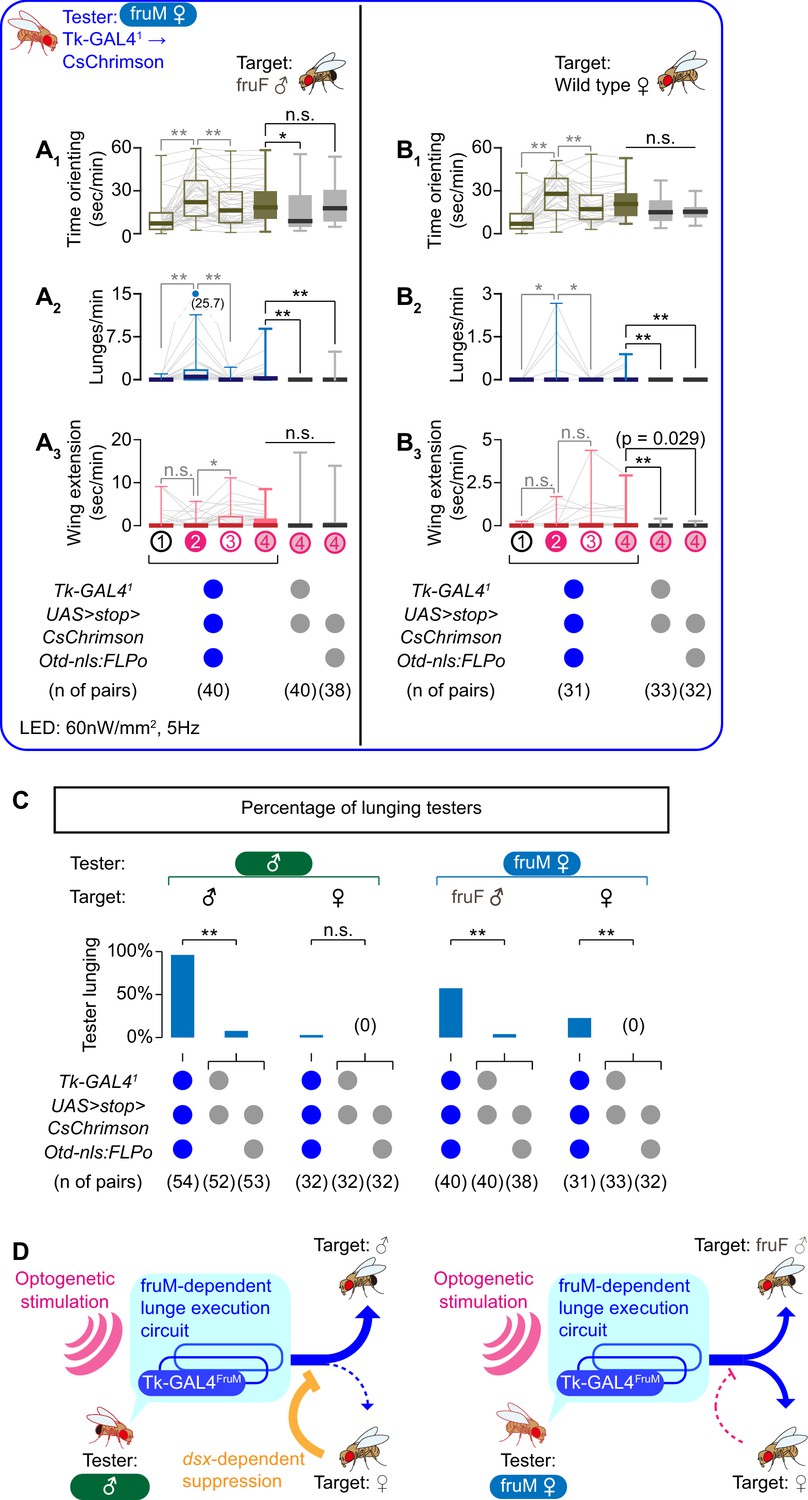
Tk-GAL4FruM neurons in fruM females promote male-type aggressive behaviors.
(A, B) Boxplots of time orienting (A1, B1), lunges (A2, B2), and wing extensions (A3, B3) by the tester flies during the time windows 1–4 (see Figure 1B). Their genotypes and pair numbers are indicated below the plots. Gray lines represent single testers. Target flies are either group-housed fruF males (A) or wild-type mated females (B). In gray: **p<0.01, *p<0.05, n.s. p>0.05 (Kruskal-Wallis one-way ANOVA and post-hoc Wilcoxon signed rank test). In black: **p<0.01, *p<0.05, n.s. p>0.05 (Kruskal-Wallis one-way ANOVA and post-hoc Mann-Whitney U-test). (C) Ratio of male (dataset from Figure 1C, D) and fruM female (dataset from A), (B) tester flies that lunged toward each of the two target sexes (above) in the time window 4. Testers’ genotypes and pair numbers are indicated below the plots. **p<0.01, n.s. p>0.05 (Fisher’s exact test, two genetic controls are pooled). (D) Schematic summary of the roles of sex-determining genes for Tk-GAL4FruM neurons and male-type aggressive behavior.
Figure 2—figure supplement 1
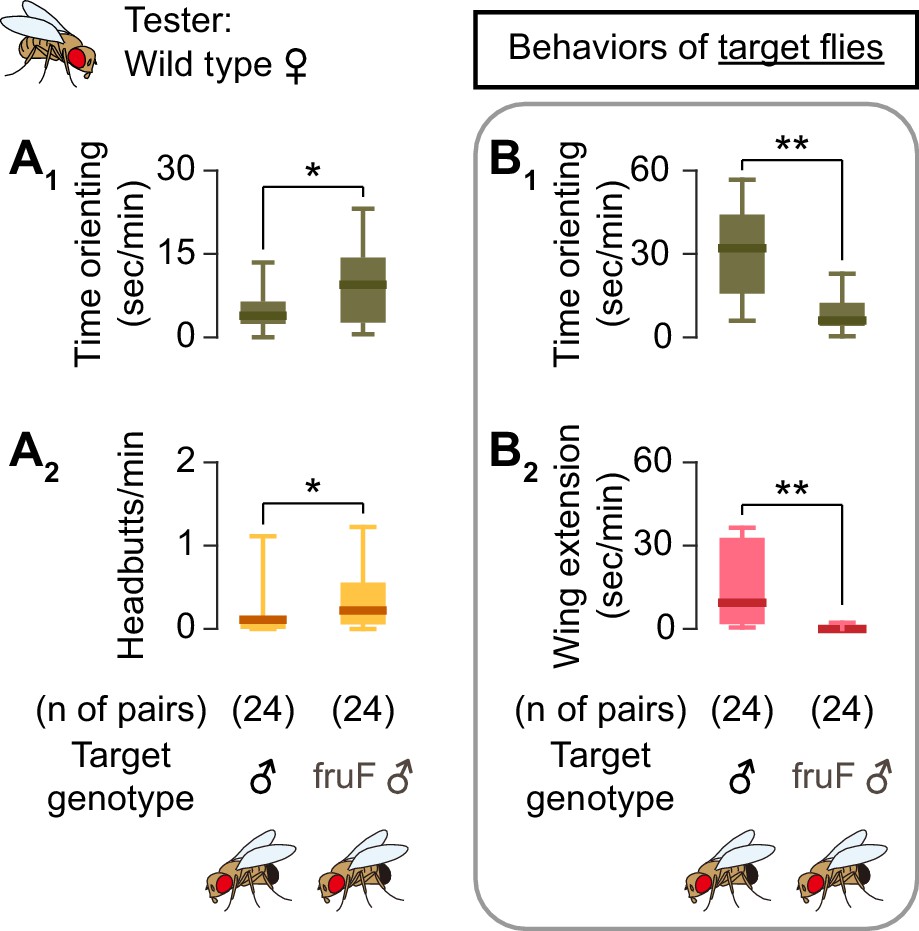
Male target flies interfere with female tester flies’ behaviors.
(A) Boxplot of time orienting (A1) and headbutts (A2) by wild-type female tester flies toward wild-type male (left) or fruF male (right) target flies. (B) Boxplot of time orienting (B1) and wing extensions (B2) by wild-type male (left) or fruF male (right) target flies toward female tester flies shown in A). Target genotypes and pair numbers are indicated below the plot. **p<0.01, *p<0.05 (Mann-Whitney U-test).
Figure 2—figure supplement 2
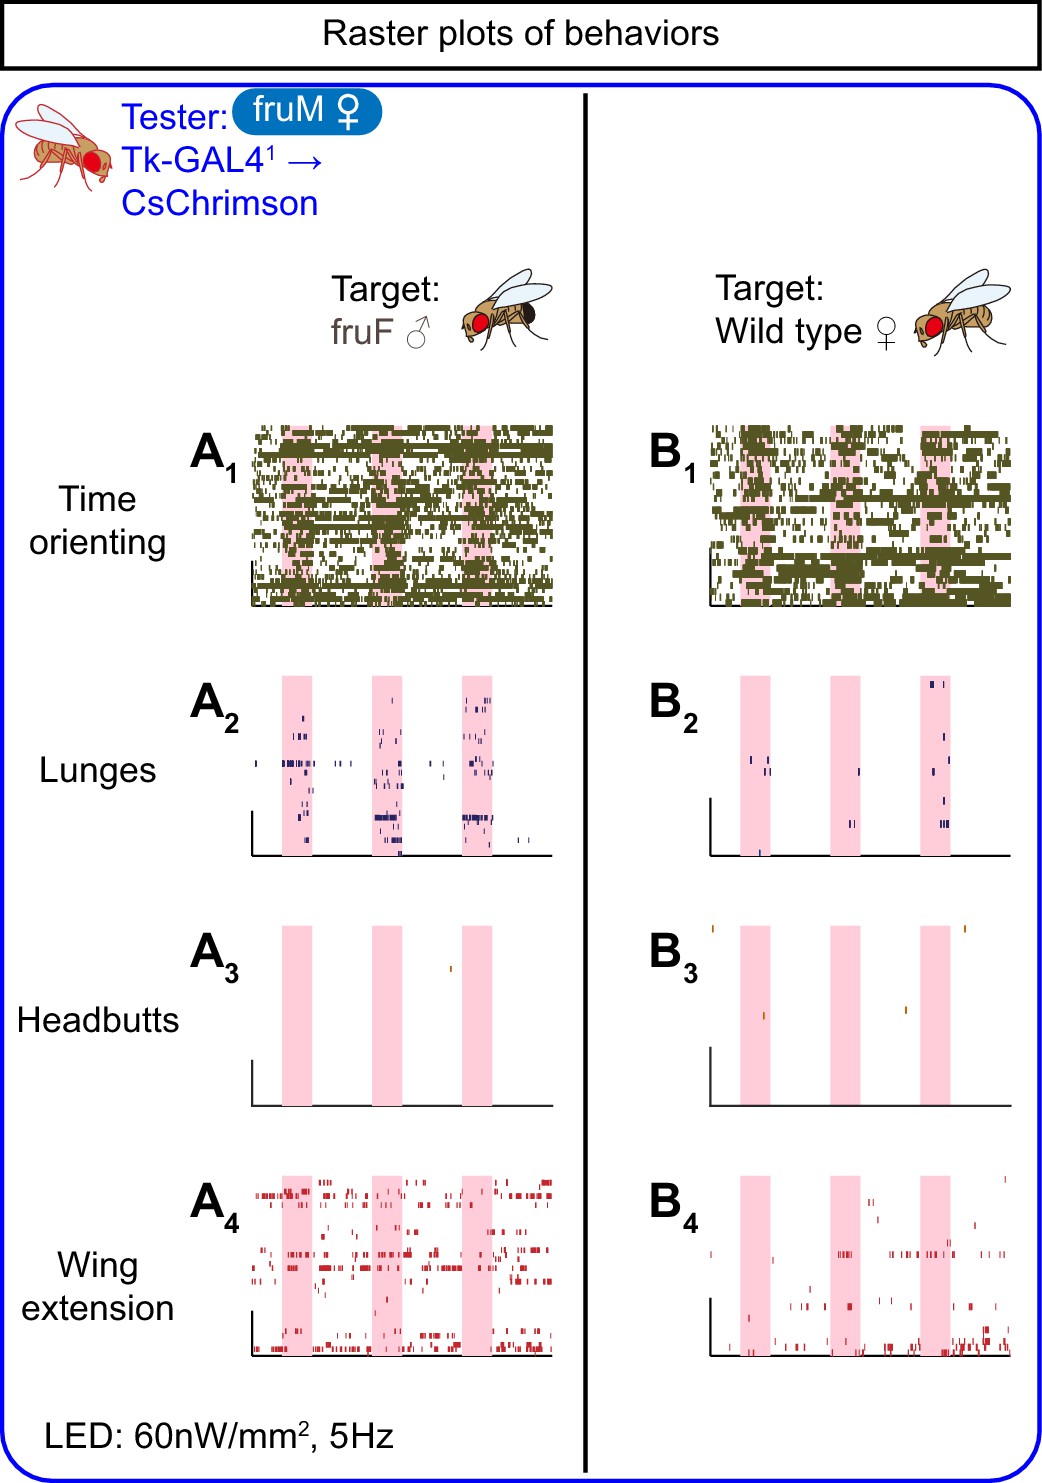
Behaviors induced by optogenetic stimulation of Tk-GAL4FruM neurons in fruM females.
(A, B) Rasters of time orienting (A1, B1), lunges (A2, B2), and wing extensions (A3, B3) performed by fruM female tester flies that express CsChrimson:tdTomato under the control of Tk-GAL41 and Otd-nls:FLPo (the same datasets as used in Figure 2A, B). Pink bar: LED-on periods, horizontal bar: 10 min, vertical bar: 10 animals. LED stimulation condition is indicated at the bottom.
Figure 2—figure supplement 3
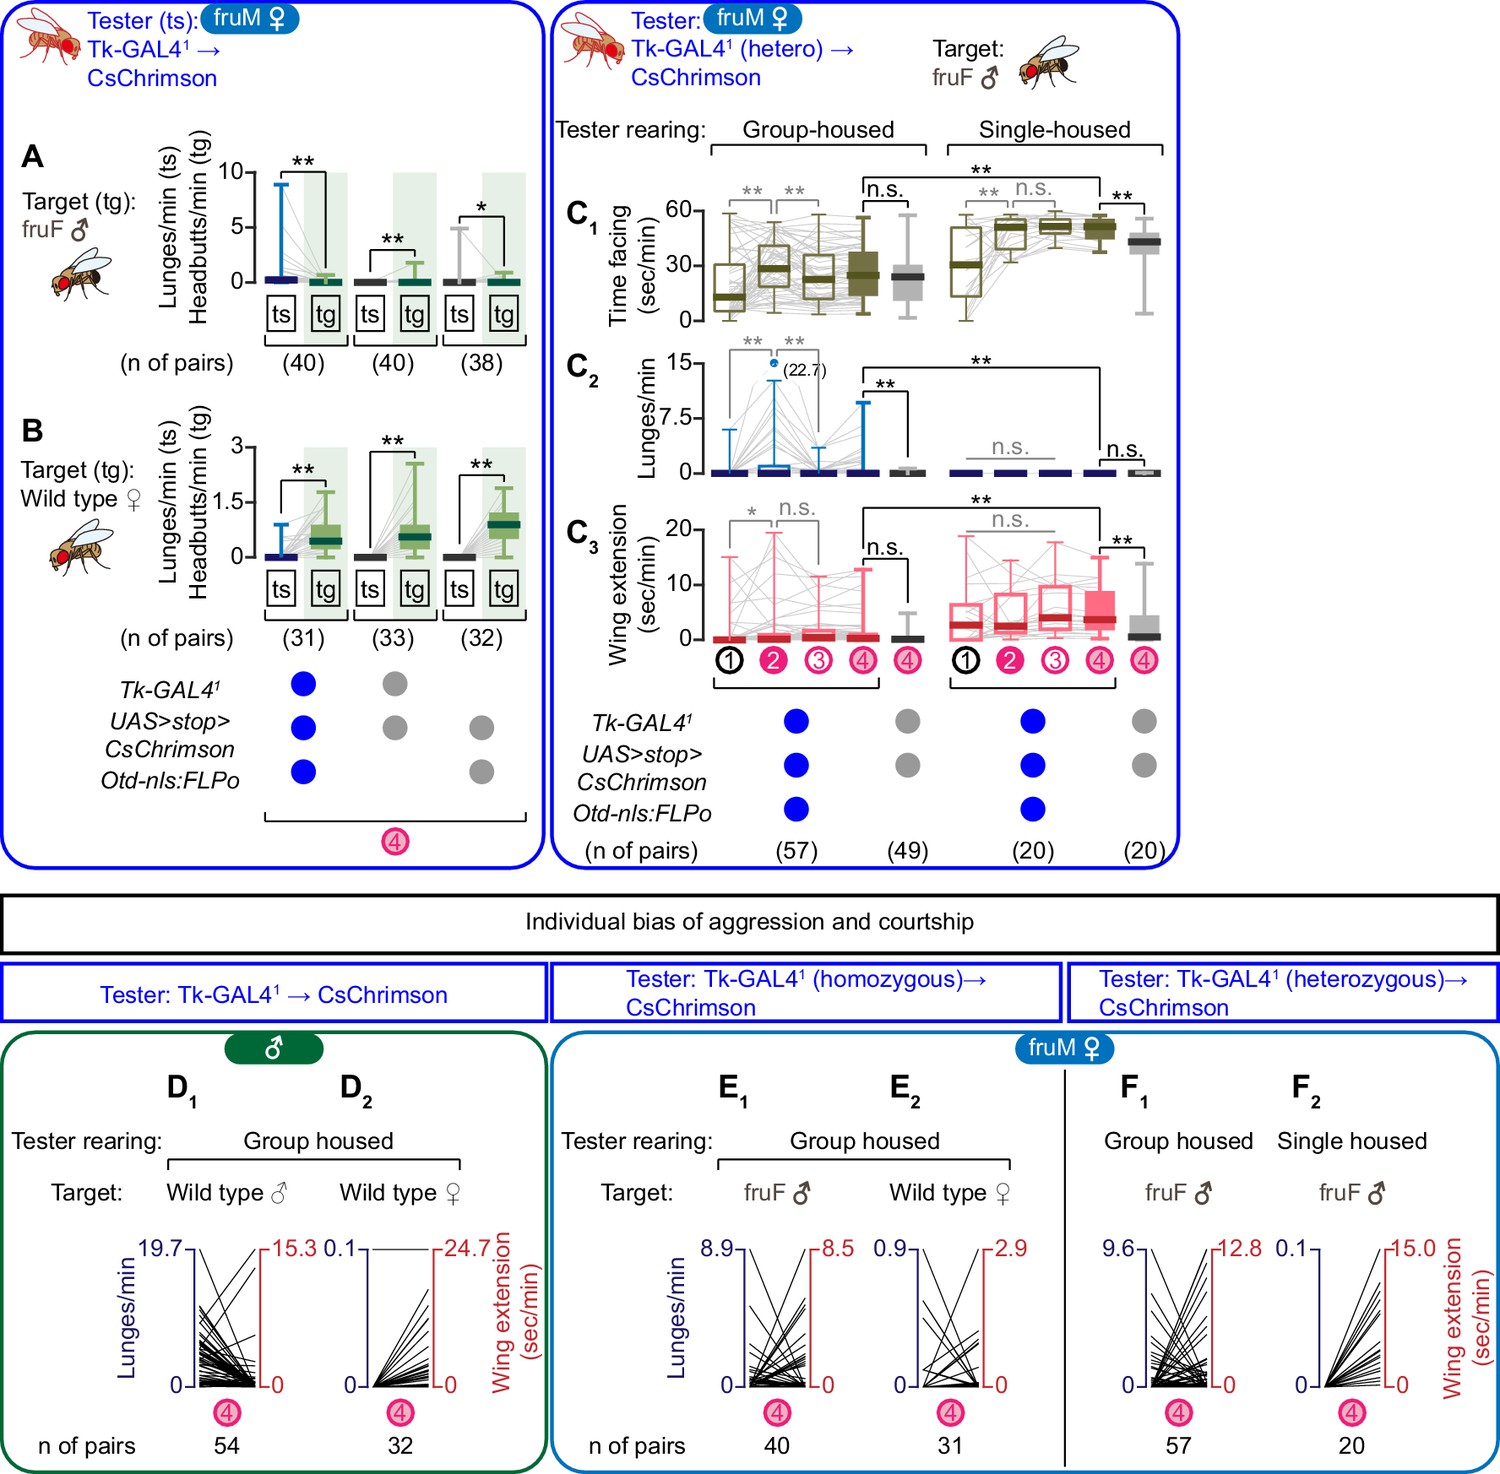
Additional characterization of the function of Tk-GAL4FruM neurons in fruM females.
(A, B) Boxplots of lunges performed by the tester flies (‘ts’, genotypes are indicated below the plots: replots of data shown in Figure 2A2 (A) and Figure 2B2 (B)) along with boxplots of headbutts performed by the corresponding target flies (‘tg’, fruF males for A), wild-type mated females for B) during the time window 4. Numbers of pairs are indicated below the plot. **p<0.01, *p<0.05, n.s. p>0.05 (Wilcoxon signed rank test). (C) Boxplots of time orienting (C1), lunges (C2), and wing extensions (C3) performed by fruM female tester flies that express CsChrimson:tdTomato under the control of Tk-GAL41 and Otd-nls:FLPo (blue) or by the genetic control flies (gray) during the time windows 1–4 (see Figure 1B). Their genotypes and numbers are indicated below the plots. Tester flies were either group-housed (left) or single-housed (right) prior to the assay. Target flies were group-housed fruF males. LED stimulation condition is indicated at the bottom left. Gray lines represent single testers. In gray: **p<0.01, n.s. p>0.05 (Kruskal-Wallis one-way ANOVA and post-hoc Wilcoxon signed rank test). In black: **p<0.01, n.s. p>0.05 (Kruskal-Wallis one-way ANOVA and post-hoc Mann-Whitney U-test). (D–F) Bias between lunges and wing extension performed by tester flies that express CsChrimson under the control of Tk-GAL41 and Otd-nls:FLPo in males (D) data from Figure 1C, D) or in fruM females (E) data from Figure 2A,B and F): data from C), during the time window 4. Each line represents one tester fly. Axis ranges are standardized to the maximum value of each genotype dataset except F2), in which the maximum for lunge axis was set to 0.1. Genotypes of target flies are indicated above the panels. Number of pairs tested is indicated below the panels.
Figure 3 with 1 supplement
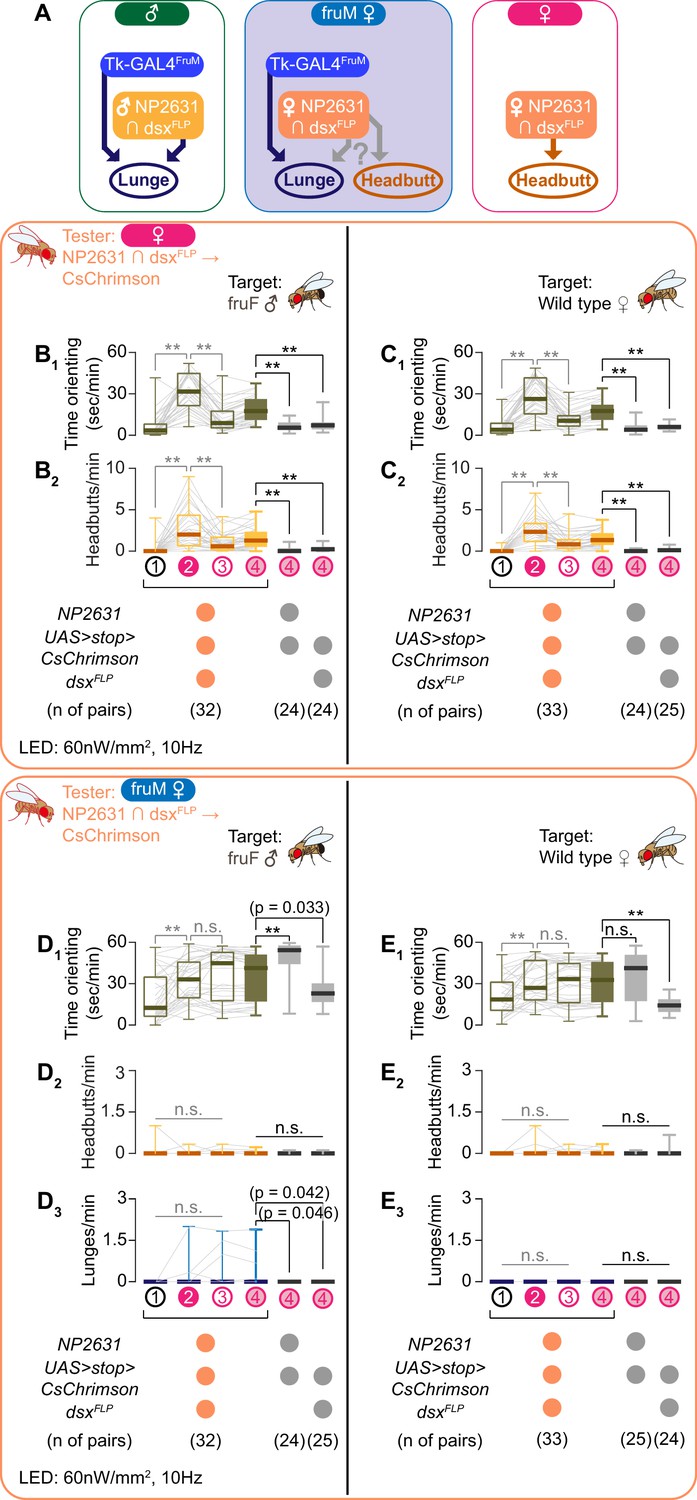
NP2631 ∩ dsxFLP neurons do not promote either male- or female-type aggressive behavior in fruM females.
(A) Schematics of how Tk-GAL4FruM and NP2631 ∩ dsxFLP neurons (see Ishii et al., 2020 for details) are specified in each genotype. Female-type NP2631 ∩ dsxFLP neurons are specified in fruM females, raising a question about how they contribute to aggression in this genotype. (B–E) Boxplots of time orienting (B1–E1), headbutts (B2–E2), and lunges (D3, E3) by the female (B, C) or fruM female (D, E) tester flies during the time windows 1–4 (see Figure 1B). Their genotypes and pair numbers are indicated below the plots. Gray lines represent single testers. Target flies are either group-housed fruF males (B, D) or mated females (C, E). In gray: **p<0.01, n.s. p>0.05 (Kruskal-Wallis one-way ANOVA and post-hoc Wilcoxon signed rank test), In black: **p<0.01, *p<0.05, n.s. p>0.05 (Kruskal-Wallis one-way ANOVA and post-hoc Mann-Whitney U-test).
Figure 3—figure supplement 1
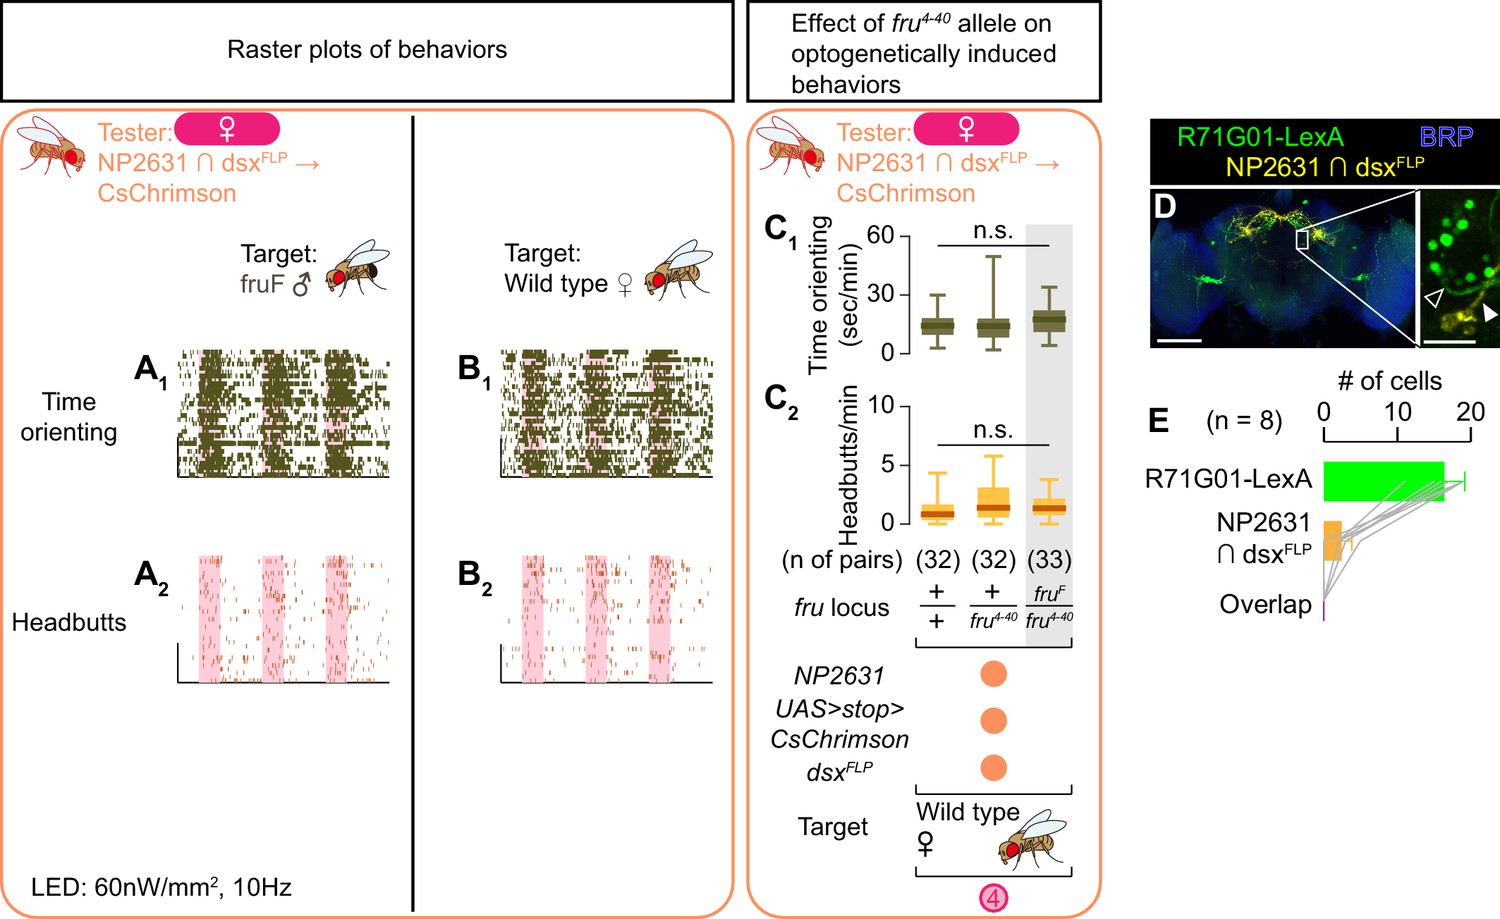
Behaviors induced by optogenetic activation of NP2631 ∩ dsxFLP neurons in females.
(A, B) Rasters of time orienting (A1, B1) and headbutts (A2, B2) performed by female tester flies that express CsChrimson:tdTomato under the control of NP2631 and dsxFLP (the same datasets as used in Figure 3B, C). Pink bar: LED-on periods, horizontal bar: 10 min, vertical bar: 10 animals. LED stimulation condition is indicated at the bottom. (C) Boxplots of time orienting (C1) and headbutts (C2) performed by female tester flies that express CsChrimson:tdTomato under the control of NP2631 and dsxFLP. Only values during the time window 4 are shown. Testers’ fru locus genotypes and pair numbers are indicated below the plots. Target flies are wild-type mated females. Plots with gray shades are replots of the data sets shown in Figure 3D. n.s. p>0.05 (Kruskal-Wallis one-way ANOVA). (D) Expression of CsChrimson:tdTomato under the control of NP2631 and dsxFLP (yellow), GCaMP6f under the control of R71G01-LexA (green), and a neuropil marker BRP (blue) in a representative female brain are visualized by immunohistochemistry. Scale bar: 100 μm. An inset represents a magnified view of the posterior cell body cluster in the white rectangle (scale bar: 10 μm). An open arrowhead in D) indicates a LexA-expressing neuronal cluster that does not share the neural tract with neurons labeled by NP2631 and dsxFLP (white arrowhead). (E) Mean number of cell bodies per hemibrain with immunohistochemical signal by anti-DsRed antibody (orange), anti-GFP antibody (green), and both antibodies (purple) in brains of the genotype represented in D). Error bars: S.D. Gray lines represent single hemibrains. All LexA-expressing neurons located near NP2631 and dsxFLP neurons are included, although some may belong to different neuronal clusters.
Figure 4 with 1 supplement
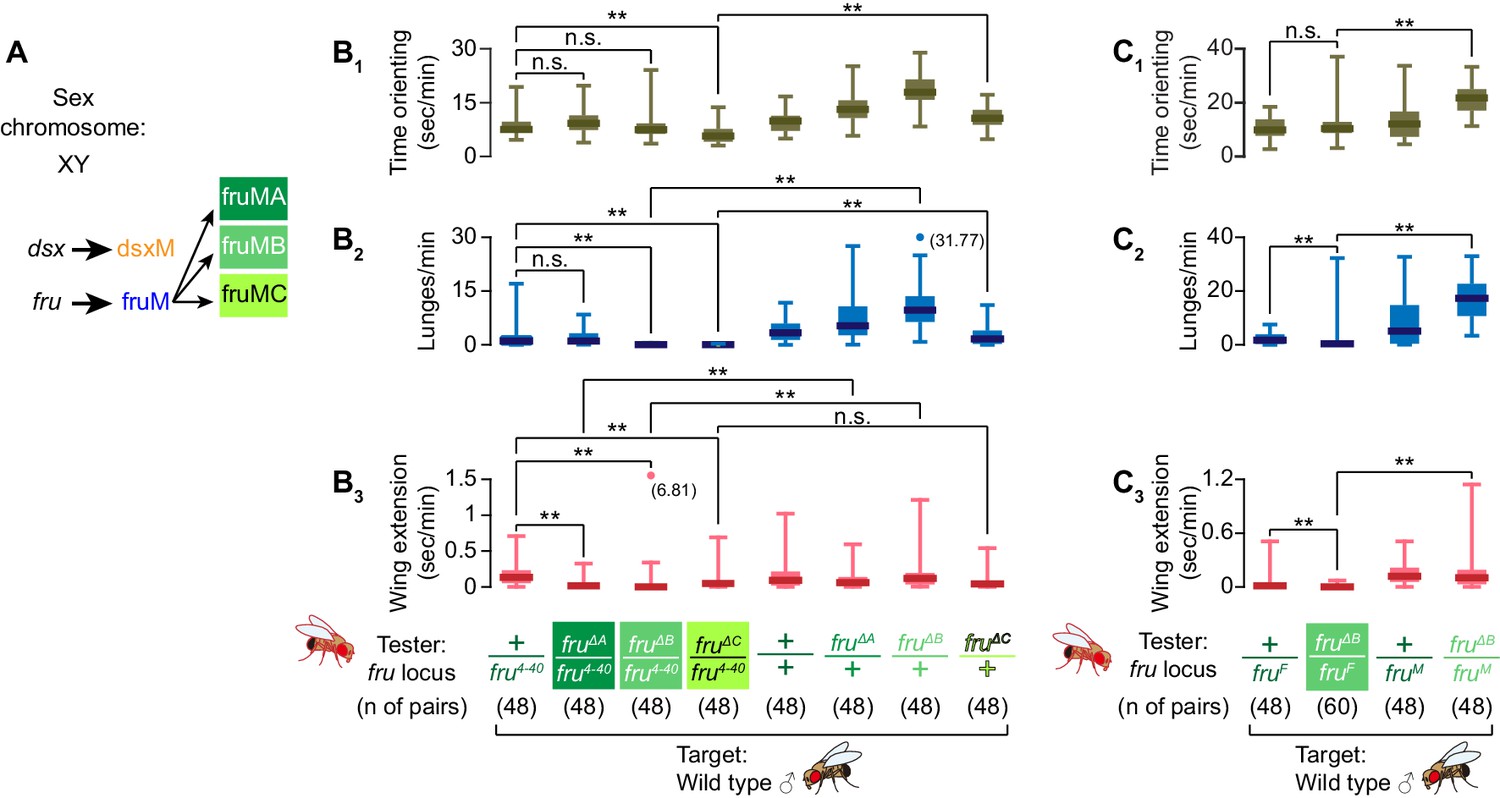
fruMB and fruMC are necessary for male aggression.
(A) Schematics of dsx and fru splicing patterns in a male. (B, C) Boxplots of time orienting (B1, C1), lunges (B2,C2), and wing extensions (B3, C3) by the fru isoform-specific tester mutants (B) or fruMB tester mutants created in trans with the fruF allele (C), along with their genetic controls (single-housed for 6 days), toward group-housed wild-type target males during 30 min assays. Testers’ genotypes of the fru locus and pair numbers are indicated below the plots. Data points that exceed the range (indicated left) are represented by dots, with exact values in parentheses. **p<0.01 (Mann-Whitney U-test with Bonferroni multiple comparison corrections).
Figure 4—figure supplement 1
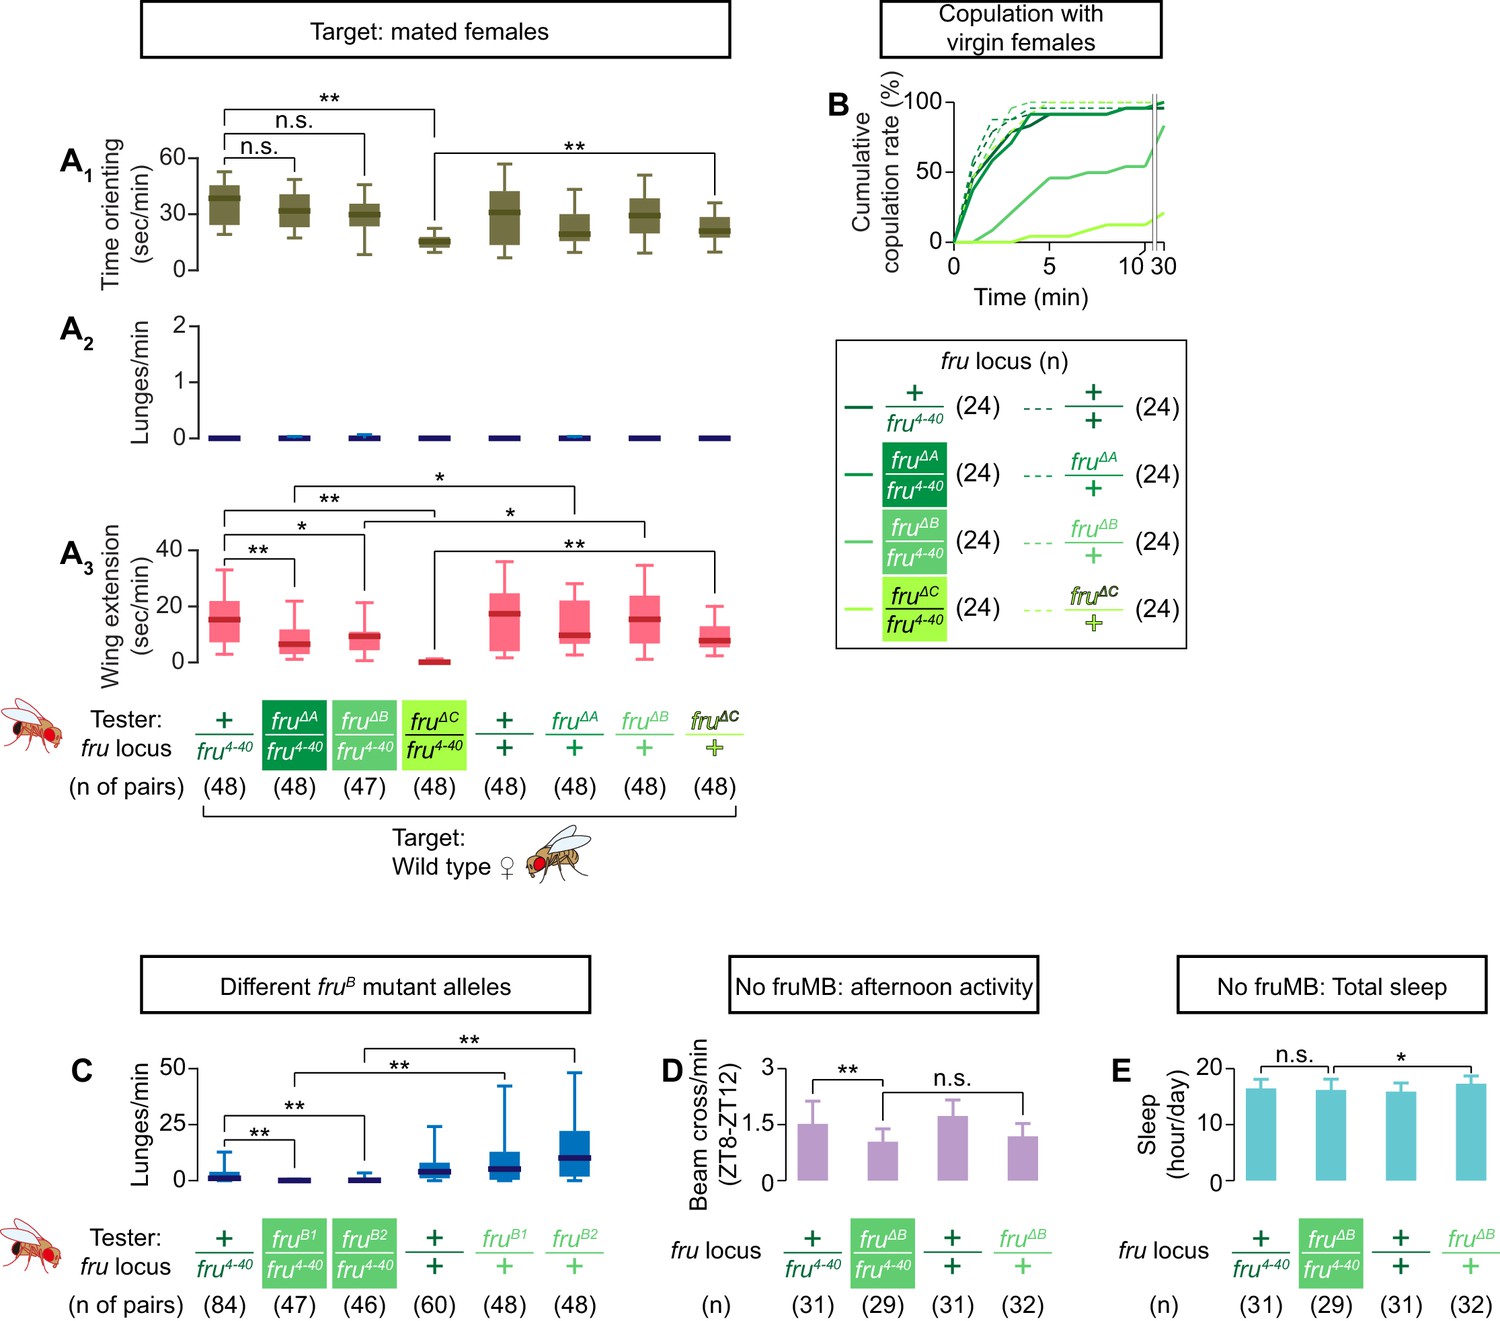
Additional characterization of the isoform-specific fru mutations.
(A) Boxplots of time orienting (A1), lunges (A2), and wing extensions (A3) by the tester males (single-housed for 6 days) toward wild-type mated female targets during 30 min assays. Testers’ genotypes at the fru locus and pair numbers are indicated below the plots. **p<0.01, *p<0.05, n.s. p>0.05 (Kruskal-Wallis one-way ANOVA and post-hoc Mann-Whitney U-test). (B) Cumulative copulation rate of the tester males with wild-type virgin females. Testers’ genotypes at the fru locus and pair numbers are indicated below the plots. (C) Boxplots of lunges by the tester males (single housed for 6 days) toward group-housed wild-type target males during 30 min assays. Testers’ genotypes at the fru locus and pair numbers are indicated below the plots. **p<0.01 (Kruskal-Wallis one-way ANOVA and post-hoc Mann-Whitney U-test). (D, E) The amount of activity at ZT8-ZT12 (E) and total amount of sleep (E). Testers’ genotypes at the fru locus and sample numbers are indicated below the plots. For D and E, **p<0.01, *p<0.05, n.s. p>0.05 (one-way ANOVA and post-hoc Student’s t-test).
Figure 5 with 1 supplement
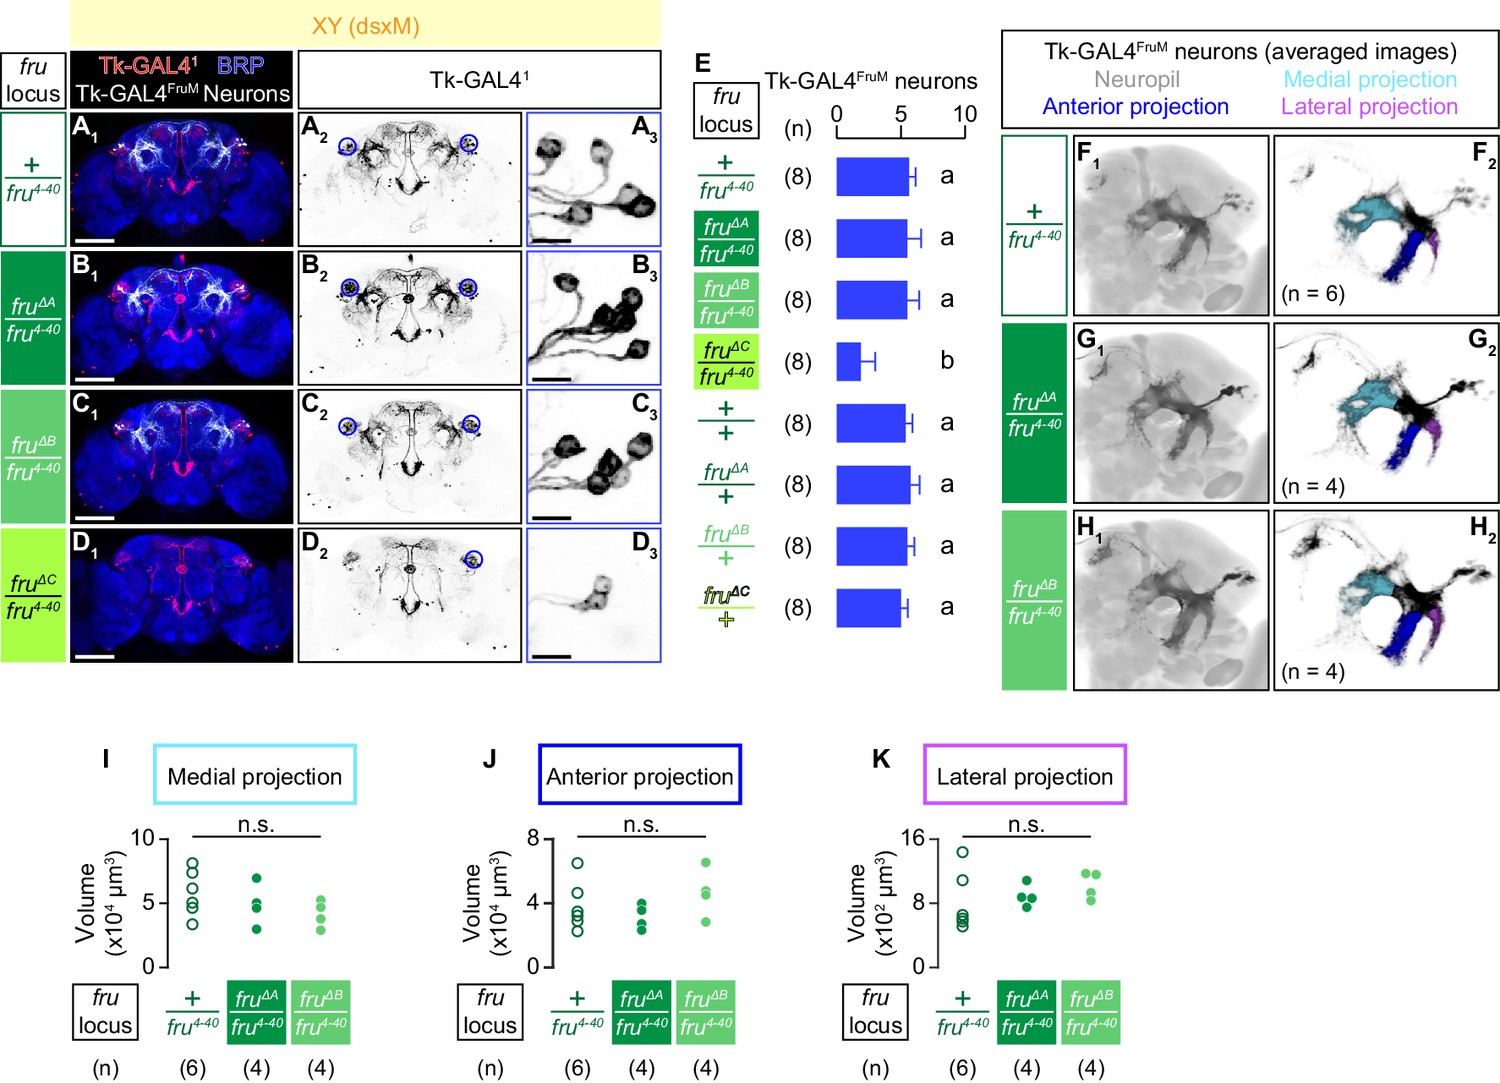
Only fruMC is necessary for the specification of Tk-GAL4FruM neurons.
(A–D): Expression of CsChrimson:tdTomato under the control of Tk-GAL41 and Otd-nls:FLPo (red in A1–D1), black in A2,3-D2,3) in male brains is visualized together with a neuropil marker BRP (blue in A1–D1) by immunohistochemistry. Traced Tk-GAL4FruM neurons are shown in white. Circle: soma (right cluster is enlarged in A3-D3). Scale bar: 100 μm (A1–D1), 10 μm (A3–D3). (E) Mean number of cell bodies of Tk-GAL4FruM neurons per hemibrain is visualized by anti-DsRed antibody in each genotype represented in A–D) and Figure 5—figure supplement 1A–D. Error bars, S.D. Lowercase letters denote significance group (p<0.01, one-way ANOVA with post-hoc Tukey’s honestly significant difference test). (F–H) Z-projection of segmented, registered, and averaged images of CsChrimson:tdTomato expression under the control of Tk-GAL41 and Otd-nls:FLPo (black) in the standard Drosophila brain (gray in F1–H1). Number of used hemibrains are indicated in F2–H2). Medial projection (cyan), anterior projection (blue), and lateral projection (purple) are segmented and overlaid in F2–H2). For panels A–H), genotypes of the fru locus are indicated on the left. (I–K) Volumes of medial projection (I), anterior projection (J), and lateral projection (K) of Tk-GAL4FruM neurons in males. Their genotypes of the fru locus and pair numbers are indicated below the plots. n.s. p>0.05 (Kruskal-Wallis one-way ANOVA).
Figure 5—figure supplement 1

Additional characterization of the isoform-specific fru mutations.
(A–D) Expression of CsChrimson:tdTomato under the control of Tk-GAL41 and Otd-nls:FLPo (red in A1–D1), black in A2,3-D2,3) in male brains with the fru locus genotype indicated on the left is visualized together with a neuropil marker BRP (blue in A1–D1) by immunohistochemistry. Traced Tk-GAL4FruM neurons are shown in white. Circle: soma (right cluster is enlarged in A3–D3). Scale bar: 100 μm (A1–D1), 10 μm (A3–D3).
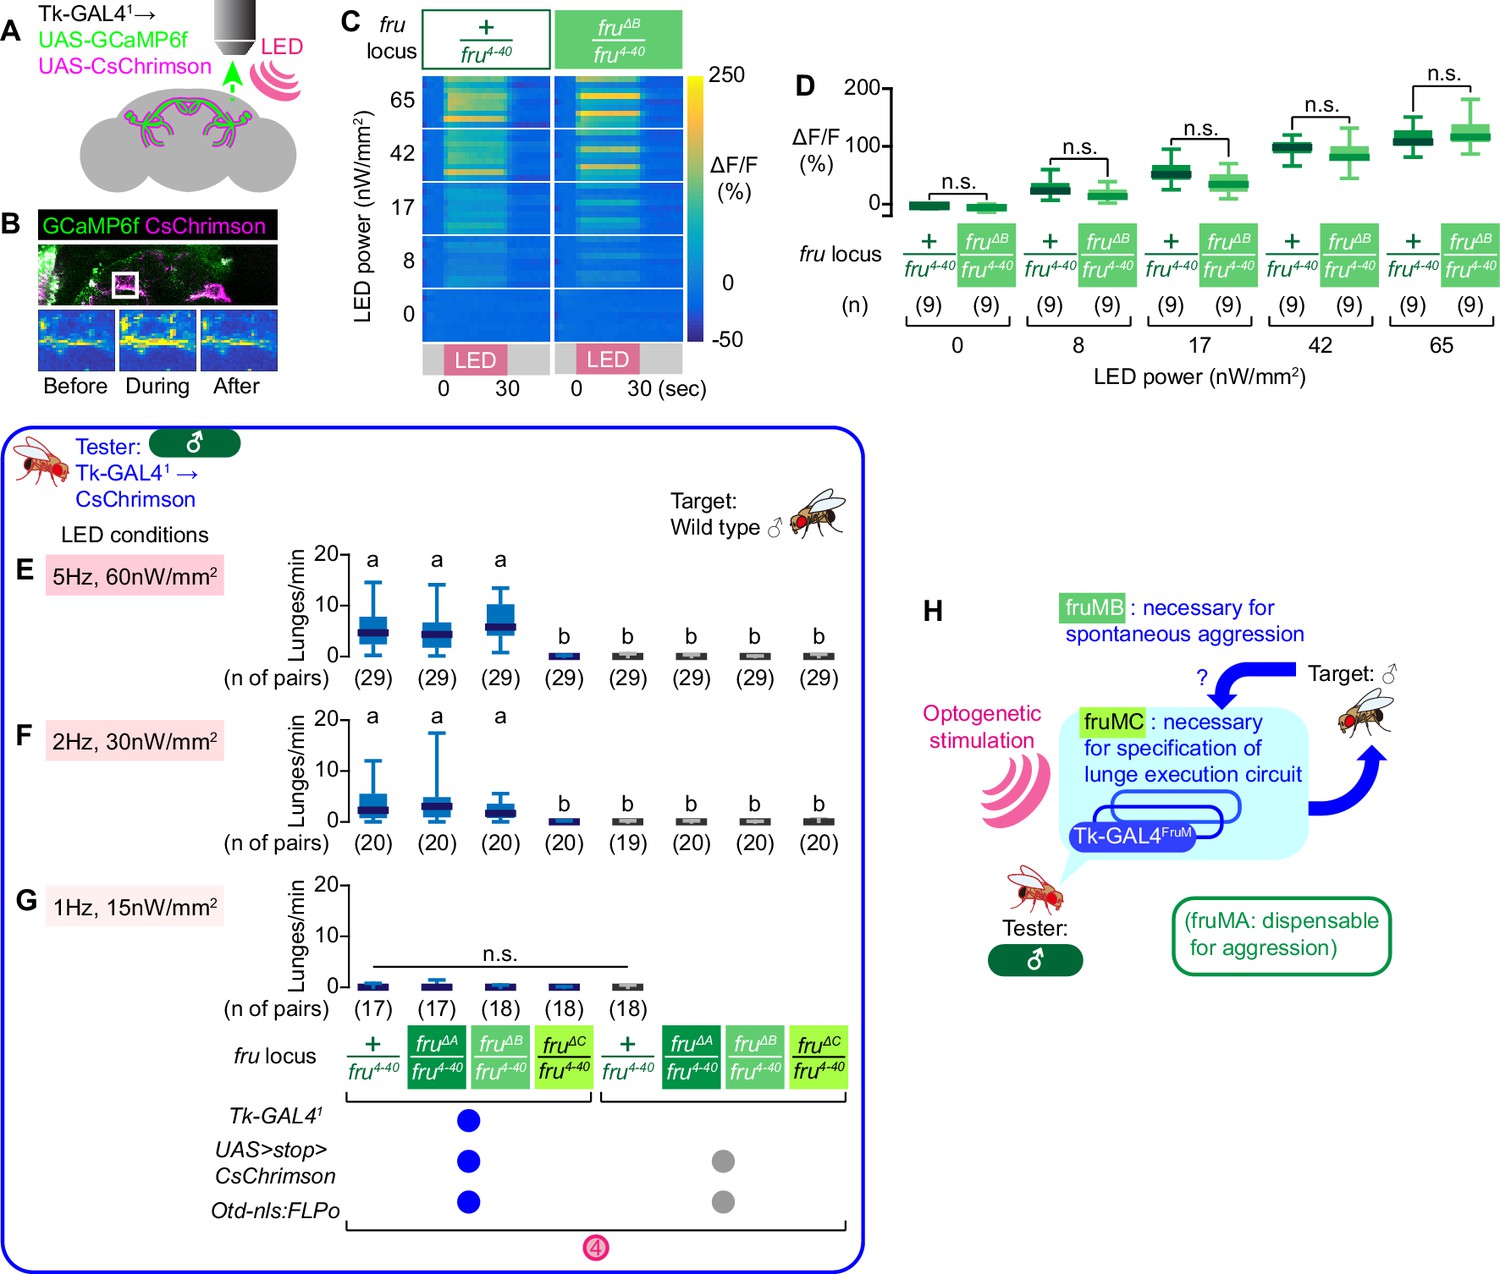
Figure 6 with 1 supplement
Tk-GAL4FruM neurons in fruMB mutants can promote male-type aggression.
(A) Schematics of the functional imaging strategy. (B) Fluorescence of GCaMP6f (green) and CsChrimson:tdTomato (magenta), both of which are driven by Tk-GAL41 (top) and pseudocolored intensity of GCaMP6f fluorescence (within the area indicated by the white square in the top panel) before (bottom left), during (bottom middle), and after (bottom right) the LED stimulation, visualized by 2-photon microscopy. (C) Time course of pseudocolored fluorescence intensity (reference: right side) in Tk-GAL41; UAS-GCaMP6f; UAS-CsChrimson male brains, with the fru locus of +/fru4-40 (left) or fruΔB/fru4-40 (right). LED stimulation (pink at the bottom) was for 30 s at 5 Hz. LED powers are indicated on the left. (D) Boxplots of GCaMP6f fluorescence intensity changes in Tk-GAL4FruM neurons (data shown in C). Genotypes at the fru locus, number of brains examined, and LED powers are indicated below. (F–G) Boxplots of lunges by the tester flies under strong (E), medium (F), or weak (G) LED stimulation conditions (indicated in shaded pink boxes) during the time windows 4. Their genotypes and numbers are indicated below the plots. Lowercase letters denote significance groups (p<0.01, Kruskal-Wallis one-way ANOVA and post-hoc Dunn’s multiple comparison test). (H): Schematic summary of the contributions of fru isoforms on male-type aggressive behavior.
Figure 6—figure supplement 1
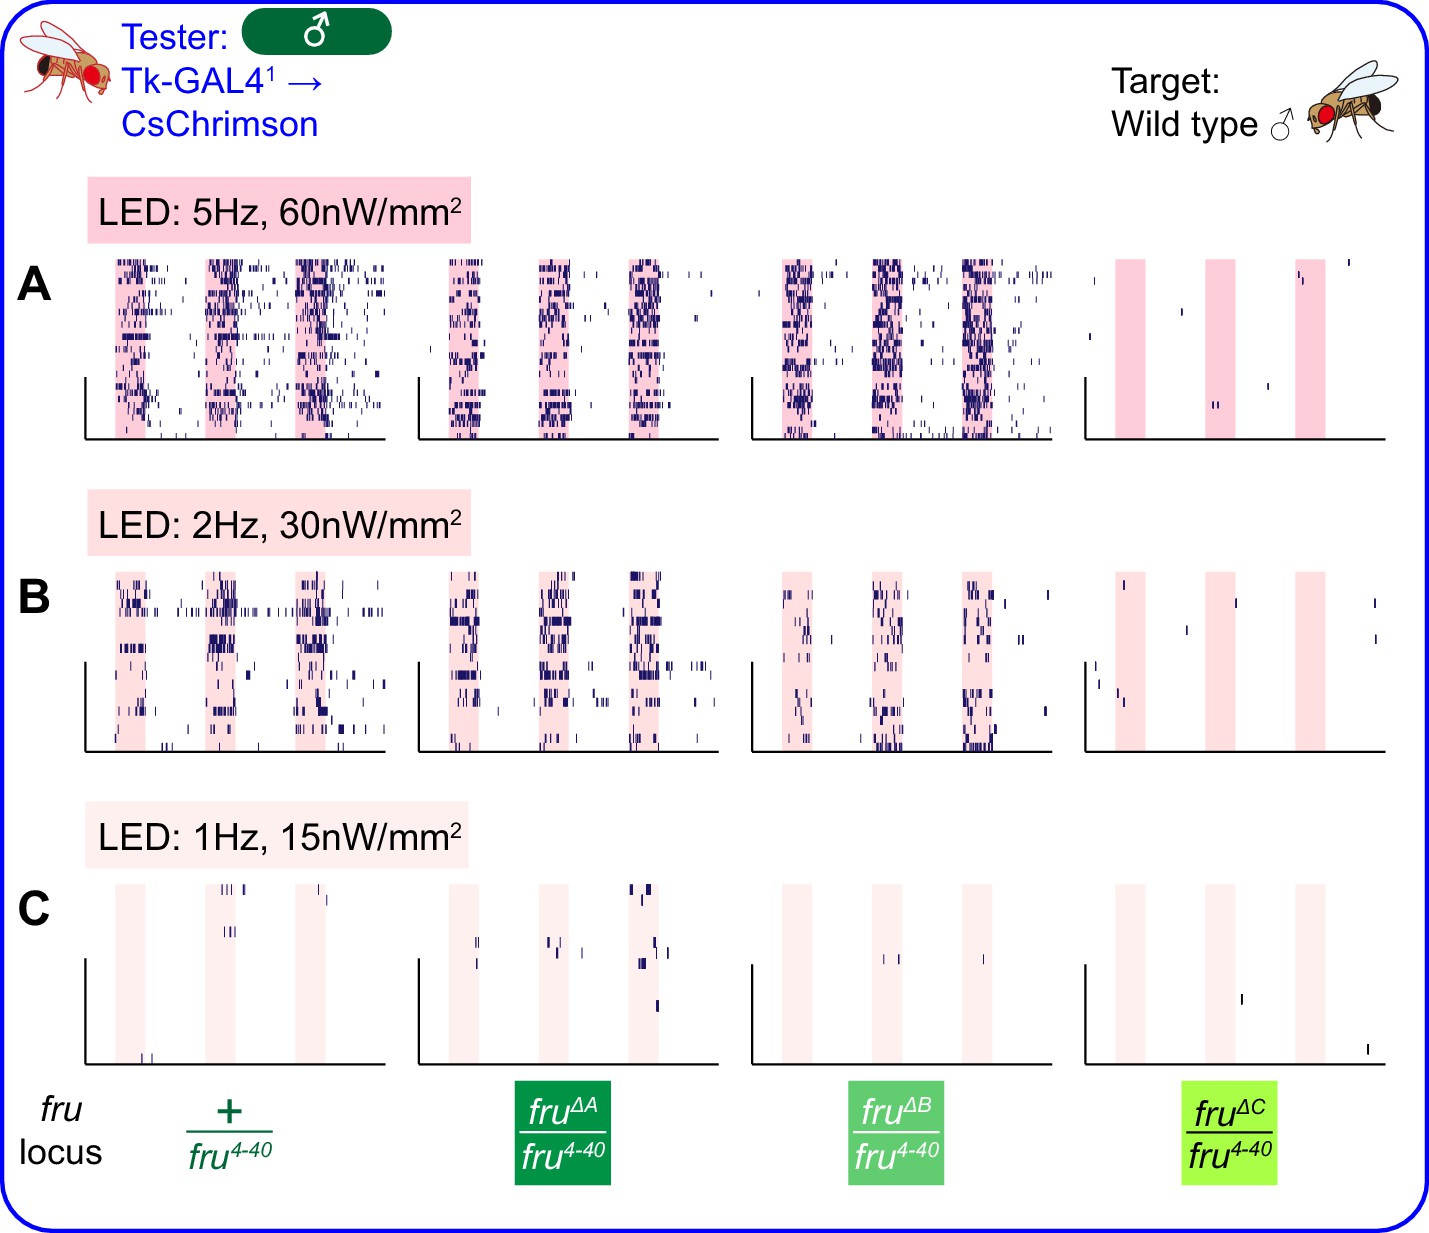
Behaviors induced by optogenetic stimulation of male Tk-GAL4FruM neurons across various LED conditions.
(A–C) Rasters of lunges performed by the tester male flies that express CsChrimson:tdTomato under the control of Tk-GAL41 and Otd-nls:FLPo (the same datasets as used in Figure 6E–G), under strong (A), medium (B), or weak (C) LED stimulation conditions (indicated in shaded pink boxes). Pink bar: LED-on periods, horizontal bar: 10 min, vertical bar: 10 animals. Target flies are wild-type group-housed males.
Videos
Video 1
Representative behavior of a male tester fly that expresses CsChrimson:tdTomato under the control of Tk-GAL41 and Otd-nls:FLPo toward a wild-type male (Part 1) or a wild-type female (Part 2) target fly, at the onset and offset of LED stimulation.
In Part 2, the tester male was not actively performing any behavior toward the target female when the LED turned on.
Video 2
3D-rendered average image of segmented and registered Tk-GAL4FruM neurons (green) and registered Tk-GAL4FruM neurons that are genetically isolated (blue).
Gray represents the standard unisex Drosophila brain (Bogovic et al., 2018).
Video 3
3D-rendered average image of registered Tk-GAL4FruM neurons in male (green) and in fruM female (blue).
Gray represents the standard unisex Drosophila brain (Bogovic et al., 2018).
Video 4
Representative behavior of a fruM female tester fly that expresses CsChrimson:tdTomato under the control of Tk-GAL41 and Otd-nls:FLPo toward a fruF male (Part 1) or a wild-type female (Part 2) target fly, at the onset and offset of LED stimulation.
Video 5
A slow-motion comparison of a lunge executed by a male (top left) and fruM female (right) tester fly that express CsChrimson:tdTomato under the control of Tk-GAL41 and Otd-nls:FLPo.
The target fly is a wild-type male (top left), a fruF male (top right), and a wild-type female (bottom right), respectively.
Video 6
Representative behavior of a female tester fly that expresses CsChrimson:tdTomato under the control of NP2631 and dsxFLP toward a wild-type female (Part 1) or a fruF male (Part 2) target fly, at the onset and offset of LED stimulation.
Video 7
3D-rendered average image of registered Tk-GAL4FruM neurons in fru4-40 heterozygous control male (dark green) and in fruMB mutant (fruΔB/fru4-40) male (bright green).
Gray represents the standard unisex Drosophila brain (Bogovic et al., 2018).
Tables
Table 1
Complete genotypes of Drosophila strains used in this study.
| FIGURE | PANEL | ABBREVIATED GENOTYPE | COMPLETE GENOTYPE (‘Y’ represents the Y chromosome) |
|---|---|---|---|
| Figure 1 | C, D | Tk-GAL41, UAS>stop>CsChrimson, Otd-nls:FLPo | w, Tk-GAL41/Y; Otd-nls:FLPo in attP40/+;20XUAS > myr:TopHAT2 > CsChrimson:tdTomato in attP2, fru4-40/+ |
| Figure 1—figure supplement 1 | A-C | ||
| Video 1 | |||
| Figure 1 | C, D | Tk-GAL41, UAS > stop > CsChrimson | w, Tk-GAL41/Y; +/+; 20XUAS > myr:TopHAT2 > CsChrimson:tdTomato in attP2, fru4-40/+ |
| Figure 1 | C, D | UAS > stop > CsChrimson, Otd-nls:FLPo | w/Y; Otd-nls:FLPo in attP40/+; 20XUAS > myr:TopHAT2 > CsChrimson:tdTomato in attP2, fru4-40/+ |
| Figure 1 | G, K, L, N-P | Tk-GAL41, XY, fru locus: fruM/fru4-40 | w, Tk-GAL41/Y; Otd-nls:FLPo in attP40/+; 20XUAS > myr:TopHAT2 > CsChrimson:tdTomato in attP2, fru4-40/fruM |
| Figure 1—figure supplement 2 | I | ||
| Figure 1—figure supplement 3 | C | ||
| Video 2, 3 | |||
| Figure 1 | H, K, M-P | Tk-GAL41, XX, frulocus: fruM/fru4-40 | w, Tk-GAL41/w, Tk-GAL41; Otd-nls:FLPoin attP40/+; 20XUAS > myr:TopHAT2 > CsChrimson:tdTomato in attP2, fru4-40/fruM |
| Figure 1—figure supplement 3 | C | ||
| Video 3 | |||
| Figure 1 | I, K | Tk-GAL41, XY, fru locus: fruF/fru4-40 | w, Tk-GAL41/Y; Otd-nls:FLPo in attP40/+; 20XUAS > myr:TopHAT2 > CsChrimson:tdTomato in attP2, fru4-40/fruF |
| Figure 1 | J, K | Tk-GAL41, XX, fru locus: fruF/fru4-40 | w, Tk-GAL41/w, Tk-GAL41; Otd-nls:FLPo in attP40/+; 20XUAS > myr:TopHAT2 > CsChrimson:tdTomato in attP2, fru4-40/fruF |
| Figure 1 | K, N-P | Tk-GAL41, XY, fru locus: +/+ | w, Tk-GAL41/Y; Otd-nls:FLPo in attP40/+; 20XUAS > myr:TopHAT2 > CsChrimson:tdTomato in attP2/+ |
| Figure 1—figure supplement 2 | C, D, H, J | ||
| Figure 1—figure supplement 3 | C | ||
| Figure 1 | K | Tk-GAL41, XX, fru locus: +/+ | w, Tk-GAL41/w, Tk-GAL41; Otd-nls:FLPo in attP40/+; 20XUAS > myr:TopHAT2 > CsChrimson:tdTomato in attP2/+ |
| Figure 1—figure supplement 2 | K | ||
| Figure 1 | K | Tk-GAL41, XY, fru locus: +/fru4-40 | w, Tk-GAL41/Y; Otd-nls:FLPo in attP40/+; 20XUAS > myr:TopHAT2 > CsChrimson:tdTomato in attP2, fru4-40/+ |
| Figure 1—figure supplement 2 | L | ||
| Figure 1 | K | Tk-GAL41, XX, fru locus: +/fru4-40 | w, Tk-GAL41/w, Tk-GAL41; Otd-nls:FLPo in attP40/+; 20XUAS > myr:TopHAT2 > CsChrimson:tdTomato in attP2, fru4-40/+ |
| Figure 1—figure supplement 2 | M | ||
| Figure 1—figure supplement 1 | D | Tk-GAL41, UAS > stop > CsChrimson, Otd-nls:FLPo, fru locus: +/+ | w, Tk-GAL41/Y; Otd-nls:FLPo in attP40/+; 20XUAS > myr:TopHAT2 > CsChrimson:tdTomato in attP2/+ |
| Figure 1—figure supplement 2 | N | ||
| Figure 1—figure supplement 1 | D | Tk-GAL41, UAS > stop > CsChrimson, Otd-nls:FLPo, fru locus: +/fru4-40 | w, Tk-GAL41/Y; Otd-nls:FLPo in attP40/+; 20XUAS > myr:TopHAT2 > CsChrimson:tdTomato in attP2, fru4-40/+ |
| Figure 1—figure supplement 2 | N | ||
| Figure 1—figure supplement 1 | D | Tk-GAL41, UAS > stop > CsChrimson, Otd-nls:FLPo, fru locus: fruM/fru4-40 | w, Tk-GAL41/Y; Otd-nls:FLPo in attP40/+; 20XUAS > myr:TopHAT2 > CsChrimson:tdTomato in attP2, fru4-40/fruM |
| Figure 1—figure supplement 2 | N | ||
| Figure 1—figure supplement 1 | D | Tk-GAL41, UAS > stop > CsChrimson, fru locus: fruM/fru4-40 | w, Tk-GAL41/Y; +/+; 20XUAS > myr:TopHAT2 > CsChrimson:tdTomato in attP2, fru4-40/fruM |
| Figure 1—figure supplement 1 | D | UAS > stop > CsChrimson, Otd-nls:FLPo, fru locus: fruM/fru4-40 | w/Y; Otd-nls:FLPo in attP40/+; 20XUAS > myr:TopHAT2 > CsChrimson:tdTomato in attP2, fru4-40/fruM |
| Figure 1—figure supplement 2 | F, G | Tk-GAL41 ∩ fru (genetic intersection) | w, Tk-GAL41/Y; +/+; 20XUAS > myr:TopHAT2 > CsChrimson:tdTomato in attP2/fruFLP (2 samples for averaged image in F) |
| Figure 1—figure supplement 2 | G | Tk-GAL41 ∩ fru (genetic intersection) | w, Tk-GAL41/Y; +/+; 20XUAS>myr:TopHAT2 > CsChrimson:tdTomato in VK00005/fruFLP (three samples) w, Tk-GAL41/Y; 8XLexAop2-FLPL in attP40/+; 20XUAS > myr:TopHAT2 > CsChrimson:tdTomato in attP2/fruP1.LexA (2 samples) |
| Video 2 | |||
| Figure 1—figure supplement 3 | A, C | Tk-GAL41, XY, fru locus: fruF/+ | w, Tk-GAL41/Y; Otd-nls:FLPo in attP40/+; 20XUAS > myr:TopHAT2 > CsChrimson:tdTomato in attP2, fruF/+ |
| Figure 1—figure supplement 3 | B, C | Tk-GAL41, XX, fru locus: fruM/+ | w, Tk-GAL41/w, Tk-GAL41; Otd-nls:FLPo in attP40/+; 20XUAS > myr:TopHAT2 > CsChrimson:tdTomato in attP2/fruM |
| Figure 1—figure supplement 3 | E | Tk-GAL41, UAS > stop > CsChrimson (attP2), Otd-nls:FLPo, fru locus: +/+ | w, Tk-GAL41/Y; Otd-nls:FLPo in attP40/+; 20XUAS > myr:TopHAT2 > CsChrimson:tdTomato in attP2/+ |
| Figure 1—figure supplement 3 | E | Tk-GAL41, UAS > stop > CsChrimson (attP2), fru locus: fruFLP/+ | w, Tk-GAL41/Y; +/+; 20XUAS > myr:TopHAT2 > CsChrimson:tdTomato in attP2/fruFLP |
| Figure 1—figure supplement 3 | E | Tk-GAL41, UAS > stop > CsChrimson (VK00005), fru locus: fruFLP/+ | w, Tk-GAL41/Y; +/+; 20XUAS > myr:TopHAT2 > CsChrimson:tdTomato in VK00005, fruFLP/+ |
| Figure 1—figure supplement 3 | E | Tk-GAL41, UAS>stop>CsChrimson (VK00005), fru locus:fruFLP/fru4-40 | w, Tk-GAL41/Y; +/+; 20XUAS > myr:TopHAT2 > CsChrimson:tdTomato in VK00005, fruFLP/fru4-40 |
| Figure 2 | A,-C | fruM, Tk-GAL41, UAS > stop > CsChrimson, Otd-nls:FLPo | w, Tk-GAL41/w, Tk-GAL41; Otd-nls:FLPo in attP40/+; 20XUAS > myr:TopHAT2 > CsChrimson:tdTomato in attP2, fru4-40/fruM |
| Figure 2—figure supplement 2 | A, B | ||
| Figure 2—figure supplement 3 | A, B, E | ||
| Video 4, 5 | |||
| Figure 2 | A-C | fruM, Tk-GAL41, UAS > stop > CsChrimson | w, Tk-GAL41/w, Tk-GAL41; +/+; 20XUAS > myr:TopHAT2 > CsChrimson:tdTomato in attP2, fru4-40/fruM |
| Figure 2—figure supplement 3 | A, B | ||
| Figure 2 | A-C | fruM, UAS > stop > CsChrimson, Otd-nls:FLPo | w/w; Otd-nls:FLPo in attP40/+; 20XUAS > myr:TopHAT2 > CsChrimson:tdTomato in attP2, fru4-40/fruM |
| Figure 2—figure supplement 3 | A, B | ||
| Figure 2 | C | Tk-GAL41, UAS > stop > CsChrimson, Otd-nls:FLPo | w, Tk-GAL41/Y; Otd-nls:FLPo in attP40/+; 20XUAS > myr:TopHAT2 > CsChrimson:tdTomato in attP2, fru4-40/+ |
| Figure 2—figure supplement 3 | D | ||
| Figure 2—figure supplement 1 | A, B | Wild type (tester) | +/+; +/+; +/+ (Canton-S) |
| (target) | w/Y; +/20XUAS > myr:TopHAT2 > CsChrimson:tdTomato in VK00022; dsxFLP, fru4-40/fruM | ||
| fruF (target) | w/Y; +/20XUAS > myr:TopHAT2 > CsChrimson:tdTomato in VK00022; dsxFLP, fru4-40/fruF | ||
| Figure 2—figure supplement 3 | C, F | fruM, Tk-GAL41 (hetero), UAS > stop > CsChrimson, Otd-nls:FLPo | w, Tk-GAL41/w; Otd-nls:FLPo in attP40/+; 20XUAS > myr:TopHAT2 > CsChrimson:tdTomato in attP2, fru4-40/fruM |
| Figure 2—figure supplement 3 | C | fruM, Tk-GAL41 (hetero), UAS > stop > CsChrimson | w, Tk-GAL41/w; +/+; 20XUAS > myr:TopHAT2 > CsChrimson:tdTomato in attP2, fru4-40/fruM |
| Figure 3 | B, C | NP2631, UAS > stop > CsChrimson, dsxFLP | w/w; NP2631/20XUAS > myr:TopHAT2 > CsChrimson:tdTomato in VK00022; dsxFLP, fru4-40/fruF |
| Figure 3—figure supplement 1 | A, B | ||
| Video 6 | |||
| Figure 3 | B, C | NP2631, UAS > stop > CsChrimson | w/w; NP2631/20XUAS > myr:TopHAT2 > CsChrimson:tdTomato in VK00022; fru4-40/fruF |
| Figure 3 | B, C | UAS > stop > CsChrimson, dsxFLP | w/w; +/20XUAS > myr:TopHAT2 > CsChrimson:tdTomato in VK00022; dsxFLP, fru4-40/fruF |
| Figure 3 | D, E | fruM, NP2631, UAS > stop > CsChrimson, dsxFLP | w/w; NP2631/20XUAS > myr:TopHAT2 > CsChrimson:tdTomato in VK00022; dsxFLP, fru4-40/fruM |
| Figure 3 | D, E | fruM, NP2631, UAS > stop > CsChrimson | w/w; NP2631/20XUAS > myr:TopHAT2 > CsChrimson:tdTomato in VK00022; fru4-40/fruM |
| Figure 3 | D, E | fruM, UAS > stop > CsChrimson, dsxFLP | w/w; +/20XUAS > myr:TopHAT2 > CsChrimson:tdTomato in VK00022; dsxFLP, fru4-40/fruM |
| Figure 3—figure supplement 1 | C | NP2631, UAS > stop > CsChrimson, dsxFLP fru locus: +/+ | w/w; NP2631/20XUAS > myr:TopHAT2 > CsChrimson:tdTomato in VK00022; dsxFLP/+ |
| Figure 3—figure supplement 1 | C | NP2631, UAS > stop > CsChrimson, dsxFLP fru locus: +/fru4-40 | w/w; NP2631/20XUAS > myr:TopHAT2 > CsChrimson:tdTomato in VK00022; dsxFLP, fru4-40/+ |
| Figure 3—figure supplement 1 | C | NP2631, UAS > stop > CsChrimson, dsxFLP fru locus: fruF/fru4-40 | w/w; NP2631/20XUAS > myr:TopHAT2 > CsChrimson:tdTomato in VK00022; dsxFLP, fru4-40/fruF |
| Figure 3—figure supplement 1 | D, E | NP2631 ∩ dsxFLP, R71G01-LexA | w/w; NP2631/13XLexAop2-IVS-GCaMP6f-p10 in su(Hw)attP5; 20XUAS > myr:TopHAT2 > CsChrimson:tdTomato in VK00005, dsxFLP/R71G01-LexA in attP2 |
| Figure 4 | B | fru locus: +/fru4-40 | +/Y; +/+; +/fru4-40 (F1 hybrid of +; +; fru4-40/TM6B and isogenic Canton-S) |
| Figure 4—figure supplement 1 | A-E | ||
| Figure 4 | B | fru locus: fruΔA/fru4-40 | +/Y; +/+; fruΔA/fru4-40 |
| Figure 4—figure supplement 1 | A, B | ||
| Figure 4 | B | fru locus: fruΔB/fru4-40 | +/Y; +/+; fruΔB/fru4-40 |
| Figure 4—figure supplement 1 | A, B, D, E | ||
| Figure 4 | B | fru locus: fruΔC/fru4-40 | +/Y; +/+; fruΔC/fru4-40 |
| Figure 4—figure supplement 1 | A, B | ||
| Figure 4 | B | fru locus: +/+ | +/Y; +/+; +/+ (F1 hybrid of Canton-S and isogenic Canton-S) |
| Figure 4—figure supplement 1 | A-E | ||
| Figure 4 | B | fru locus: fruΔA/+ | +/Y; +/+; fruΔA/+ |
| Figure 4—figure supplement 1 | A, B | ||
| Figure 4 | B | fru locus: fruΔB/+ | +/Y; +/+; fruΔB/+ |
| Figure 4—figure supplement 1 | A, B, D, E | ||
| Figure 4 | B | fru locus: fruΔC/+ | +/Y; +/+; fruΔC/+ |
| Figure 4—figure supplement 1 | A, B | ||
| Figure 4 | C | fru locus: +/fruF | +/Y; +/+; +/fruF |
| Figure 4 | C | fru locus: fruΔB/fruF | +/Y; +/+; fruΔB/fruF |
| Figure 4 | C | fru locus: +/fruM | +/Y; +/+; +/fruM |
| Figure 4 | C | fru locus: fruΔB/fruM | +/Y; +/+; fruΔB/fruM |
| Figure 4—figure supplement 1 | C | fru locus: fruB1/fru4-40 | +/Y; +/+; fruB1/fru4-40 |
| Figure 4—figure supplement 1 | C | fru locus: fruB2/fru4-40 | +/Y; +/+; fruB2/fru4-40 |
| Figure 4—figure supplement 1 | C | fru locus: fruB1/+ | +/Y; +/+; fruB1/+ |
| Figure 4—figure supplement 1 | C | fru locus: fruB2/+ | +/Y; +/+; fruB2/+ |
| Figure 5 | A, E, F, I-K | Tk-GAL41, XY, fru locus: +/fru4-40 | w, Tk-GAL41/Y; Otd-nls:FLPo in attP40/+; 20XUAS > myr:TopHAT2 > CsChrimson:tdTomato in attP2, fru4-40/+ |
| Video 7 | |||
| Figure 5 | B, E, G, I-K | Tk-GAL41, XY, fru locus: fruΔA/fru4-40 | w, Tk-GAL41/Y; Otd-nls:FLPo in attP40/+; 20XUAS > myr:TopHAT2 > CsChrimson:tdTomato in attP2, fru4-40/fruΔA |
| Figure 5 | C, E, H-K | Tk-GAL41, XY, fru locus: fruΔB/fru4-40 | w, Tk-GAL41/Y; Otd-nls:FLPo in attP40/+; 20XUAS > myr:TopHAT2 > CsChrimson:tdTomato in attP2, fru4-40/fruΔB |
| Figure 5 | D, E | Tk-GAL41, XY, fru locus: fruΔC/fru4-40 | w, Tk-GAL41/Y; Otd-nls:FLPo in attP40/+; 20XUAS > myr:TopHAT2 > CsChrimson:tdTomato in attP2, fru4-40/fruΔC |
| Figure 5 | E | Tk-GAL41, XY, fru locus: +/+ | w, Tk-GAL41/Y; Otd-nls:FLPo in attP40/+; 20XUAS > myr:TopHAT2 > CsChrimson:tdTomato in attP2/+ |
| Figure 5—figure supplement 1 | A | ||
| Figure 5 | E | Tk-GAL41, XY, fru locus: fruΔA/+ | w, Tk-GAL41/Y; Otd-nls:FLPo in attP40/+; 20XUAS > myr:TopHAT2 > CsChrimson:tdTomato in attP2/fruΔA |
| Figure 5—figure supplement 1 | B | ||
| Figure 5 | E | Tk-GAL41, XY, fru locus: fruΔB/+ | w, Tk-GAL41/Y; Otd-nls:FLPo in attP40/+; 20XUAS > myr:TopHAT2 > CsChrimson:tdTomato in attP2/fruΔB |
| Figure 5—figure supplement 1 | C | ||
| Figure 5 | E | Tk-GAL41, XY, fru locus: fruΔC/+ | w, Tk-GAL41/Y; Otd-nls:FLPo in attP40/+; 20XUAS > myr:TopHAT2 > CsChrimson:tdTomato in attP2/fruΔC |
| Figure 5—figure supplement 1 | D | ||
| Figure 6 | B-D | Tk-GAL41, UAS-GCaMP6f, UAS-CsChrimson, fru locus: +/fru4-40 | w, Tk-GAL41/Y; Otd-nls:FLPo in attP40/20XUAS-IVS-Syn21-GCaMP6f-p10 in su(Hw)attP5; 20XUAS > myr:TopHAT2 > CsChrimson:tdTomato in attP2, fru4-40/+ |
| Figure 6 | C, D | Tk-GAL41, UAS-GCaMP6f, UAS-CsChrimson, fru locus: fruΔB/fru4-40 | w, Tk-GAL41/Y; Otd-nls:FLPo in attP40/20XUAS-IVS-Syn21-GCaMP6f-p10 in su(Hw)attP5; 20XUAS > myr:TopHAT2 > CsChrimson:tdTomato in attP2, fru4-40/fruΔB |
| Figure 6 | E-G | Tk-GAL41, UAS > stop > CsChrimson, Otd-nls:FLPo, fru locus: +/fru4-40 | w, Tk-GAL41/Y; Otd-nls:FLPo in attP40/+; 20XUAS > myr:TopHAT2 > CsChrimson:tdTomato in attP2, fru4-40/+ |
| Figure 6—figure supplement 1 | A-C | ||
| Figure 6 | E-G | Tk-GAL41, UAS > stop > CsChrimson, Otd-nls:FLPo, fru locus: fruΔA/fru4-40 | w, Tk-GAL41/Y; Otd-nls:FLPo in attP40/+; 20XUAS > myr:TopHAT2 > CsChrimson:tdTomato in attP2, fru4-40/fruΔA |
| Figure 6—figure supplement 1 | A-C | ||
| Figure 6 | E-G | Tk-GAL41, UAS > stop > CsChrimson, Otd-nls:FLPo, fru locus: fruΔB/fru4-40 | w, Tk-GAL41/Y; Otd-nls:FLPo in attP40/+; 20XUAS > myr:TopHAT2 > CsChrimson:tdTomato in attP2, fru4-40/fruΔB |
| Figure 6—figure supplement 1 | A-C | ||
| Figure 6 | E-G | Tk-GAL41, UAS > stop > CsChrimson, Otd-nls:FLPo, fru locus: fruΔC/fru4-40 | w, Tk-GAL41/Y; Otd-nls:FLPo in attP40/+; 20XUAS > myr:TopHAT2 > CsChrimson:tdTomato in attP2, fru4-40/fruΔC |
| Figure 6—figure supplement 1 | A-C | ||
| Figure 6 | E-G | UAS > stop > CsChrimson, Otd-nls:FLPo, fru locus: +/fru4-40 | w/Y; Otd-nls:FLPo in attP40/+; 20XUAS > myr:TopHAT2 > CsChrimson:tdTomato in attP2, fru4-40/+ |
| Figure 6 | E-G | UAS > stop > CsChrimson, Otd-nls:FLPo, fru locus: fruΔA/fru4-40 | w/Y; Otd-nls:FLPo in attP40/+; 20XUAS > myr:TopHAT2 > CsChrimson:tdTomato in attP2, fru4-40/fruΔA |
| Figure 6 | E-G | UAS > stop > CsChrimson, Otd-nls:FLPo, fru locus: fruΔB/fru4-40 | w/Y; Otd-nls:FLPo in attP40/+; 20XUAS > myr:TopHAT2 > CsChrimson:tdTomato in attP2, fru4-40/fruΔB |
| Figure 6 | E-G | UAS > stop > CsChrimson, Otd-nls:FLPo, fru locus: fruΔB/fru4-40 | w/Y; Otd-nls:FLPo in attP40/+; 20XUAS > myr:TopHAT2 > CsChrimson:tdTomato in attP2, fru4-40/fruΔC |
Additional files
-
Source data 1
Data points represented in all figure panels, as well as p-values for all statistical tests shown in the figures.
- https://cdn.elifesciences.org/articles/52702/elife-52702-data1-v1.xlsx
-
Supplementary file 1
Key resources table.
- https://cdn.elifesciences.org/articles/52702/elife-52702-supp1-v1.docx
-
Transparent reporting form
- https://cdn.elifesciences.org/articles/52702/elife-52702-transrepform-v1.docx
Download links
A two-part list of links to download the article, or parts of the article, in various formats.
Downloads (link to download the article as PDF)
Open citations (links to open the citations from this article in various online reference manager services)
Cite this article (links to download the citations from this article in formats compatible with various reference manager tools)
Layered roles of fruitless isoforms in specification and function of male aggression-promoting neurons in Drosophila
eLife 9:e52702.
https://doi.org/10.7554/eLife.52702


