The transcriptomic response of cells to a drug combination is more than the sum of the responses to the monotherapies
- Department of Genetics and Genomics Sciences, Icahn School of Medicine at Mount Sinai, United States
- Department of Cell, Developmental, and Regenerative Biology, Icahn School of Medicine at Mount Sinai, United States
- IBM Computational Biology Center, IBM Research, United States
- Department of Business Administration, University of Illinois at Urbana-Champaign, United States
- Department of Systems Biology, Columbia University, United States
- Sulzberger Columbia Genome Center, High Throughput Screening Facility, Columbia University Medical Center, United States
- Department of Biomedical Informatics, Columbia University, United States
- Department of Biochemistry and Molecular Biophysics, Columbia University, United States
- Department of Medicine, Columbia University, United States
- Tisch Cancer Institute, Cancer Immunology, Icahn School of Medicine at Mount Sinai, United States
- Diabetes, Obesity and Metabolism Institute, Icahn School of Medicine at Mount Sinai, United States
- Icahn Institute for Data Science and Genomic Technology, Icahn School of Medicine at Mount Sinai, United States
Figures
Figure 1 with 2 supplements
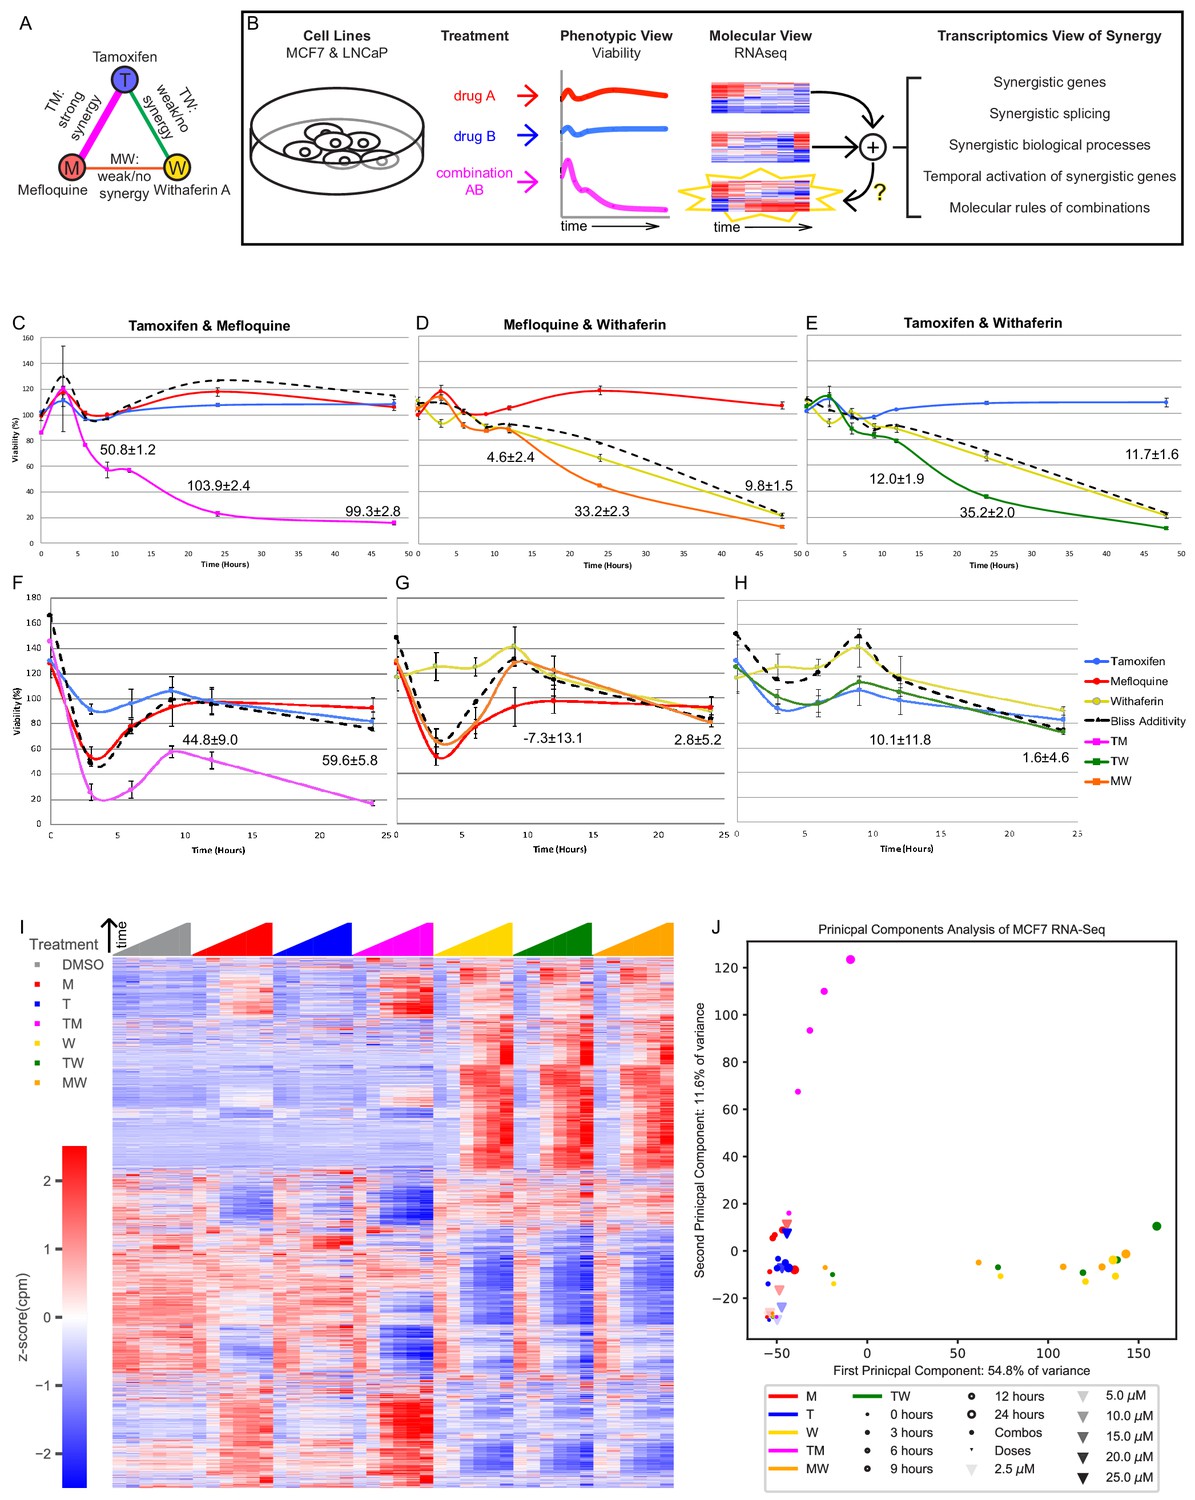
The transcriptomics of drug combinations mirror their phenotypic characteristics.
(A) Monotherapies and drug combinations used in the study. (B) Workflow of molecular analysis of synergy. Starburst highlights the novel component of RNAseq analysis. Question mark denotes the focus of the study. (C–H) Fold change over control of cell count for MCF7 cells (C–E) and LNCaP cells (F–H) treated with Tamoxifen and Mefloquine (C,F), Mefloquine and Withaferin (D,G), and Tamoxifen and Withaferin (E,H). Dashed line indicates predicted viability of the combination based on the Bliss model. Excess Over Bliss (EOB) ± ErrorEOB is given for the 12, 24, and 48 hr time points (see Materials and methods). (I) Average gene expression for each treatment and time point in the MCF7 combination experiments (covering 108 treatment and 18 DMSO samples). (J) Principal component analysis of log fold change in gene expression vs DMSO for the average over replicates at each treatment and time point in the MCF7 combination and dose experiments. (See also Supplementary files 3–9, and Source data 1).
Figure 1—figure supplement 1
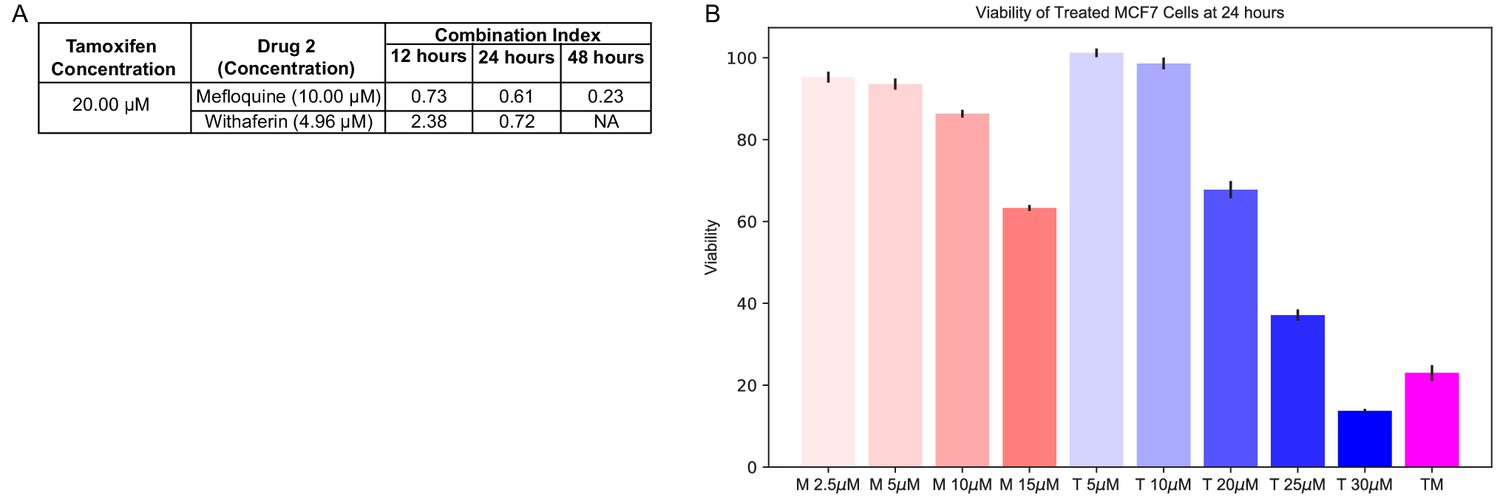
The response of MCF7 to TM is more synergistic than to TW.
(A) Combination Index for the combinations at the selected doses. Combination Index < 1 indicates synergy. (B) Viability of MCF7 cells treated with increasing doses of T and M performed alongside RNA collection at 24 hr, compared to TM (Figure 1). (See also Supplementary files 1–2).
Figure 1—figure supplement 2
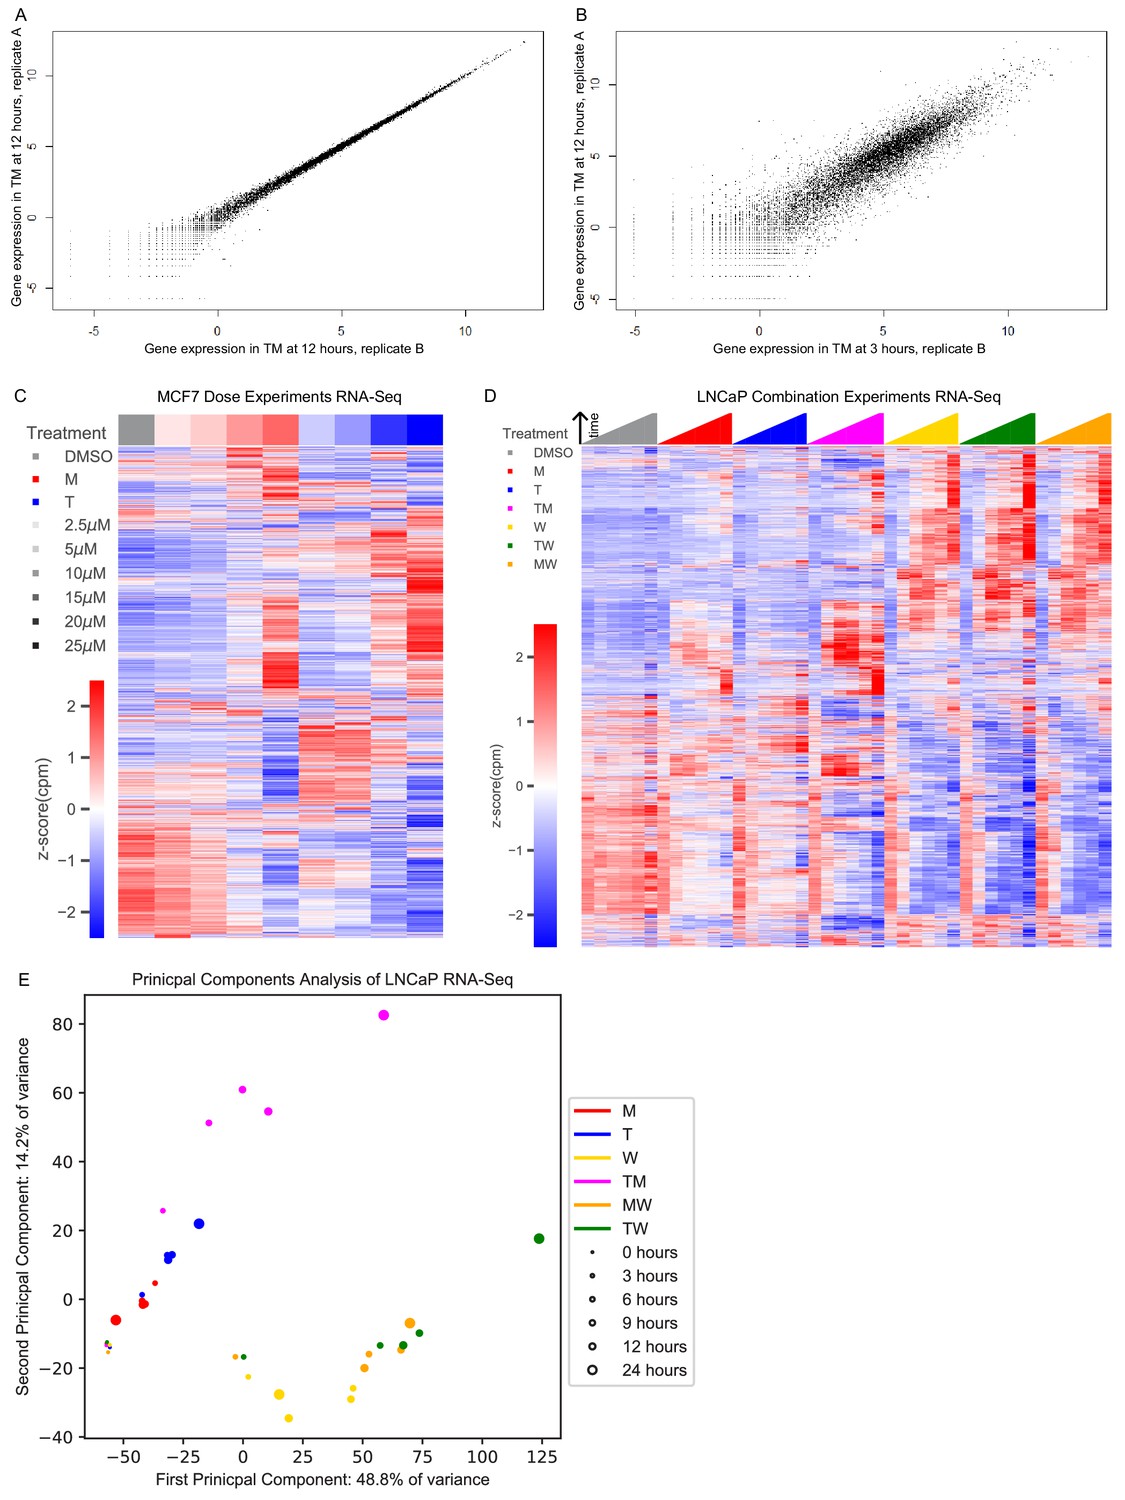
Transcriptomic profiles of MFC7 and LNCaP cells with combinations.
(A) Similarity between the gene expression data of two replicates treated with TM at 12 hr. (B) The gene expression of one replicate treated with TM at 12 hr and another replicate treated with TM at 3 hr shows differential expression beyond the replicates of (A). (C) Average gene expression for each treatment and time point in the MCF7 dose experiments. (D) Average gene expression for each treatment and time point in the LNCaP combination experiments (covering 108 treatment and 18 DMSO samples). (E) Principal component analysis of log fold change in gene expression vs DMSO for the average over replicates at each treatment and time point in the LNCaP combination experiments. (See also Source data 2, 3).
Figure 2 with 2 supplements
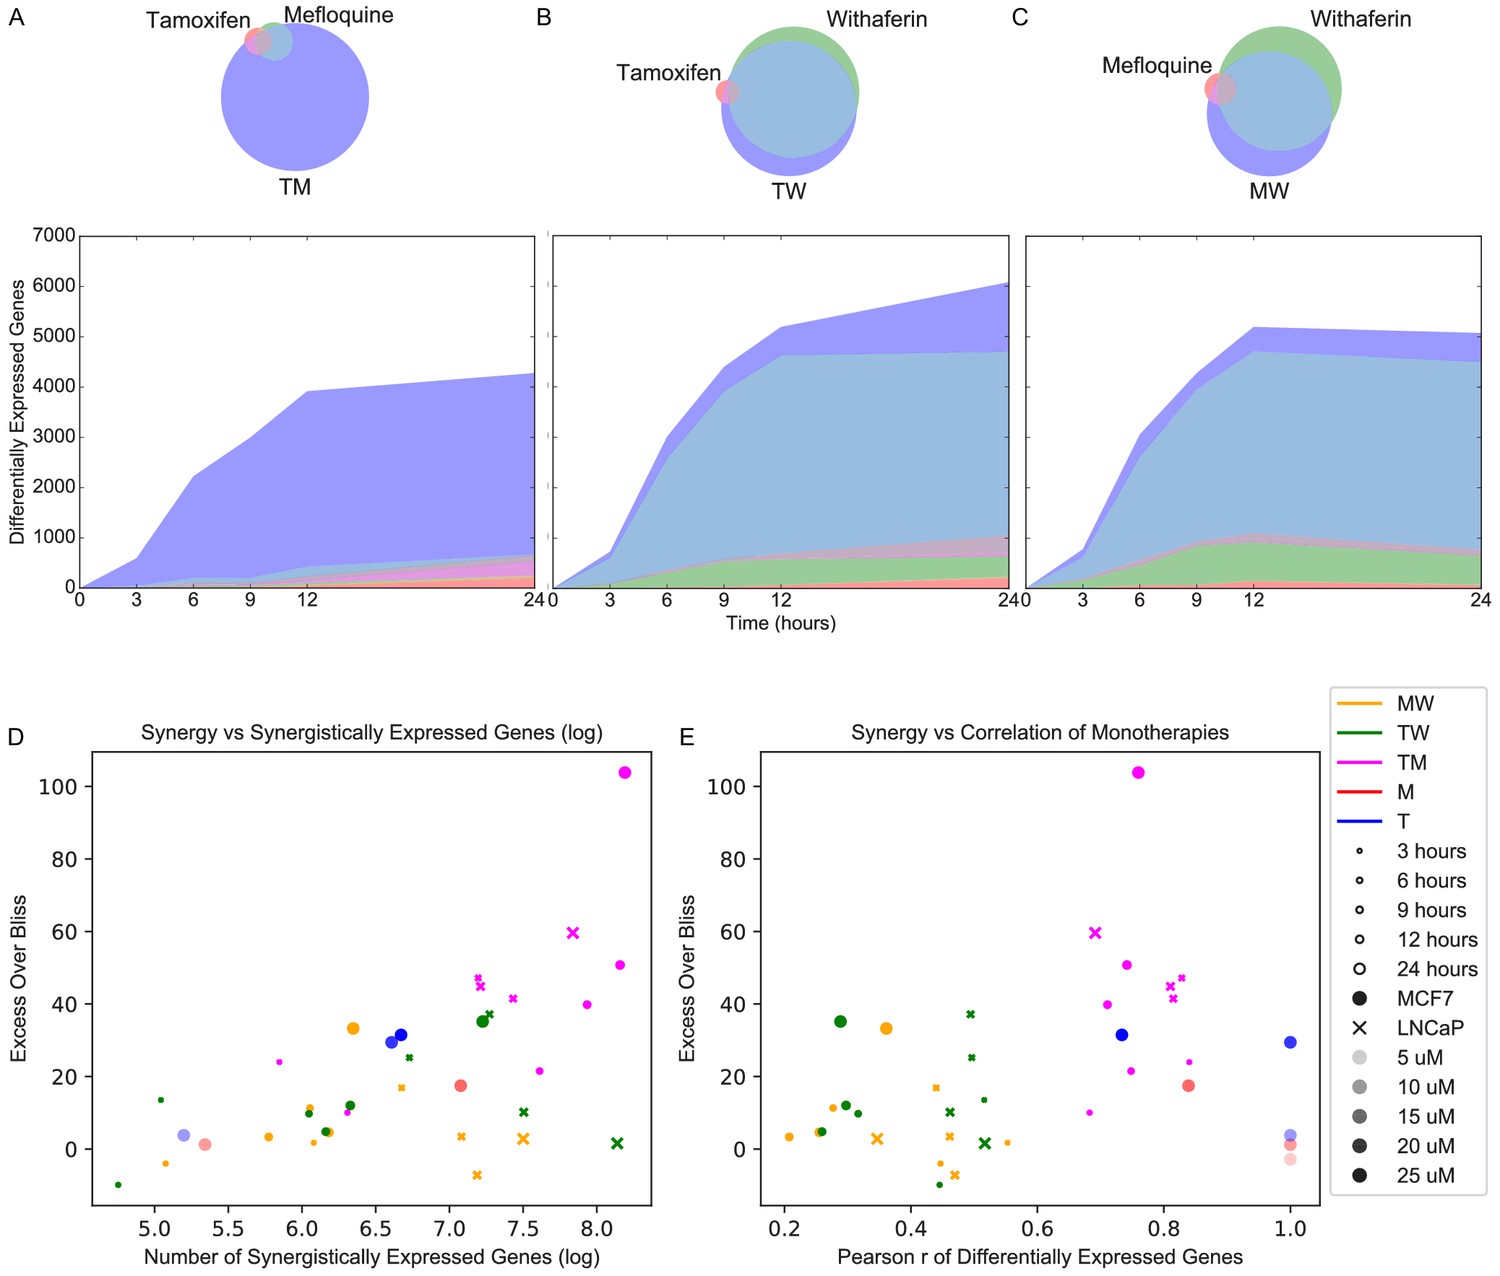
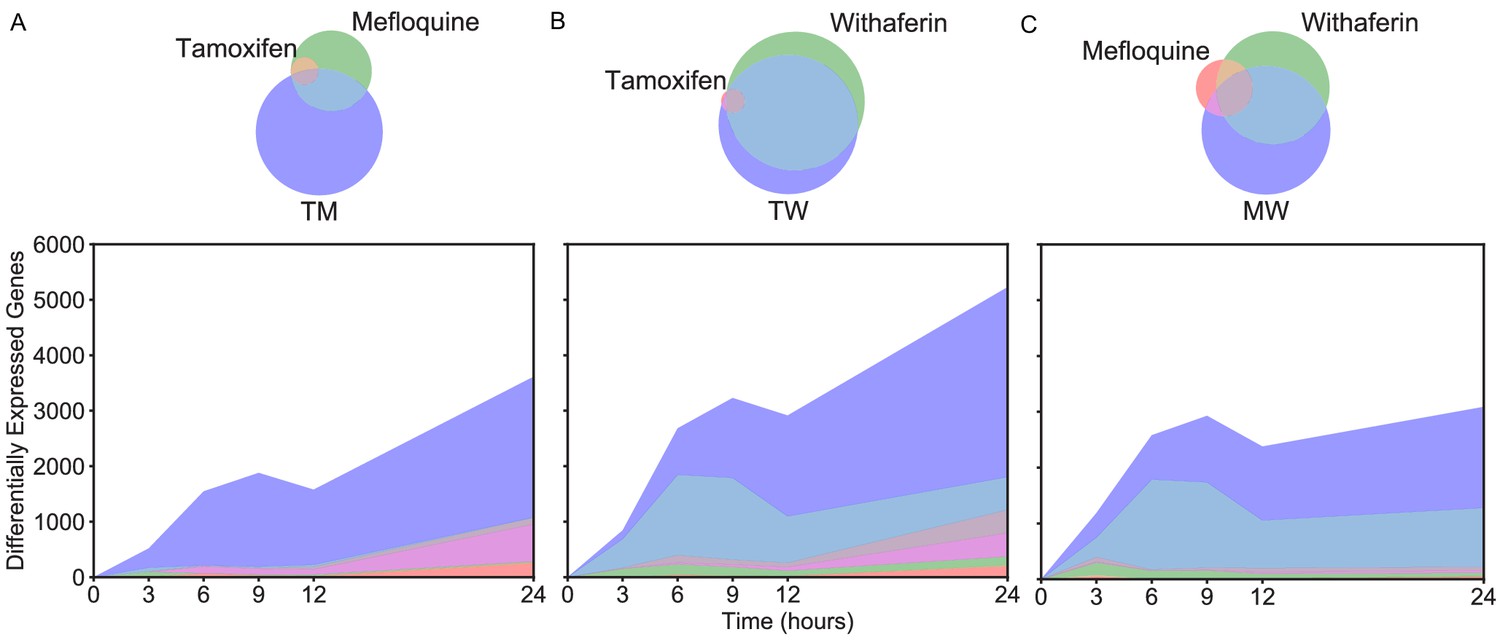
Synergistically expressed genes and correlated monotherapies are associated with synergy.
(A-C) Number of DEGs over time in MCF7. The Venn diagrams correspond to DEGs at 3 hr in (A) T, M, and TM; (B) T, W, and TW; and (C) M, W, and MW. The area represented in each color is in proportion to the number of genes in the corresponding color of the Venn diagram; blue areas represent SEGs. (D–E) Relationship of Excess Over Bliss score with (D) the number of SEGs, and (E) correlation in gene expression values between each pair of monotherapies. Note that some of the ‘pairs’ from the dose experiments represent the same dataset correlation with itself (i.e. T 10 μM with T 10 μM for the T 20 μM ‘combination’) and so have correlation = 1.0 as expected, and are shown for clarity. (See also Source data 4, 5, 6).
Figure 2—figure supplement 1
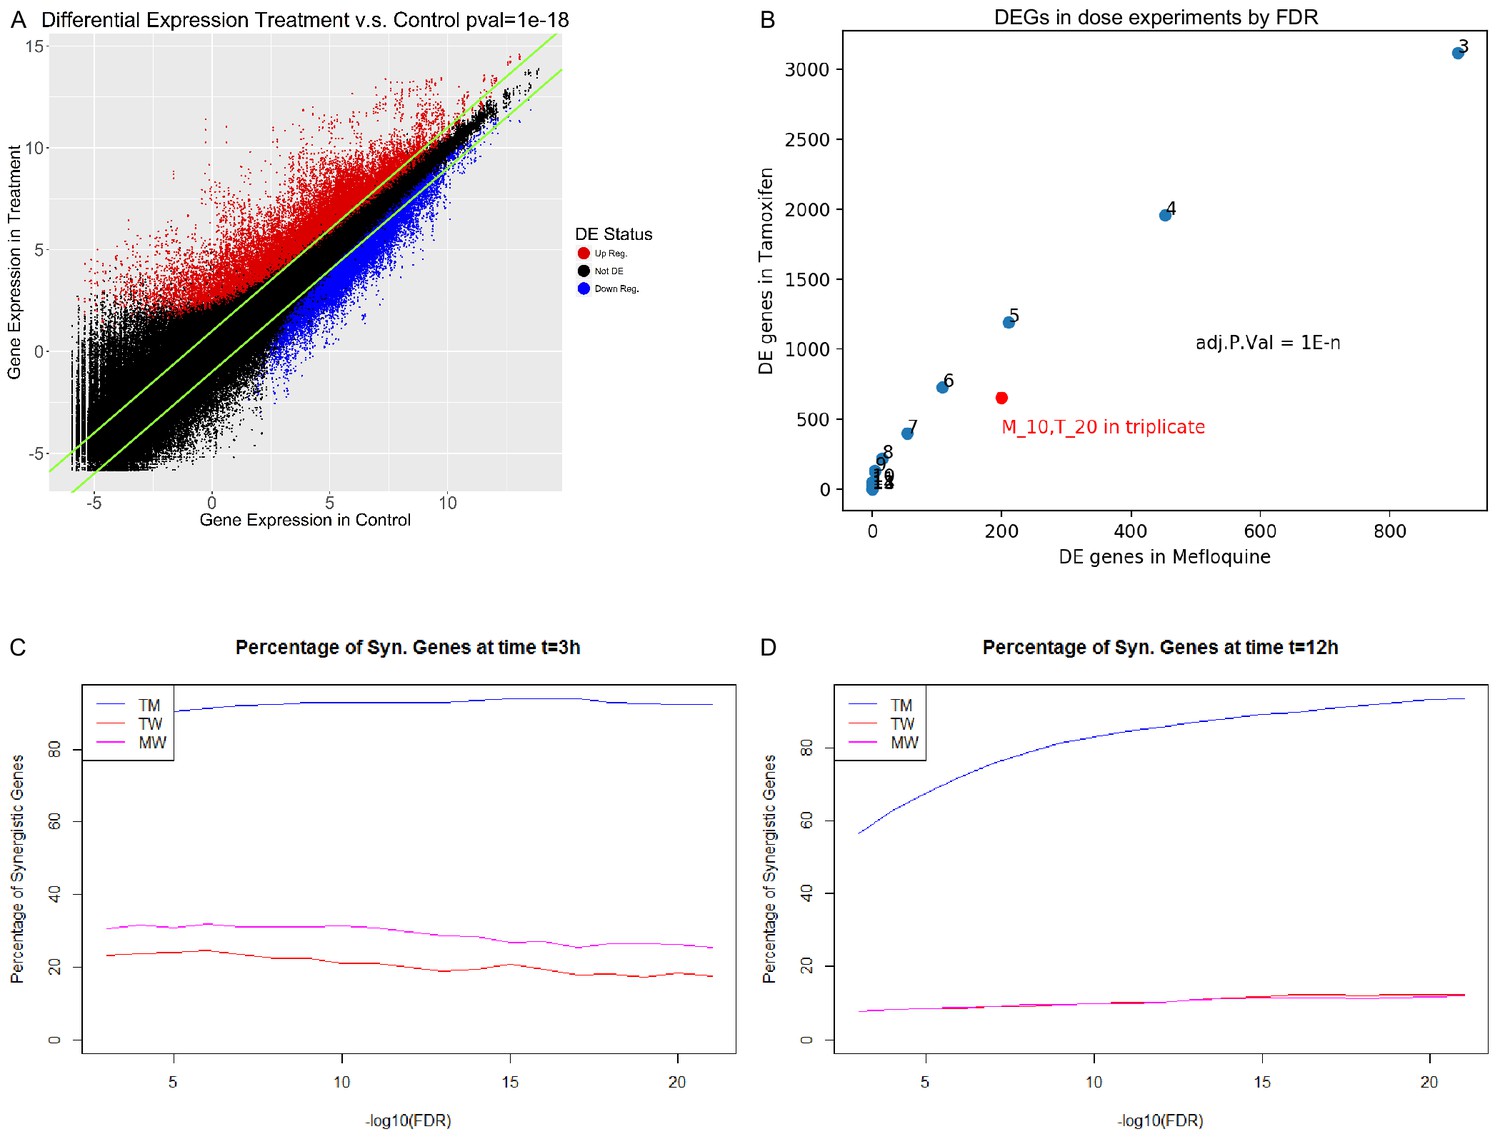
Gene expression characteristics of differential expression and synergy in MCF7.
(A) Comparison between gene expression in treatment (y-axis) and control (x-axis), for all genes over all treatments from the combination experiments in MCF7. Upregulated and downregulated genes as determined by Limma with Voom are in red and blue respectively corresponding to a FDR < 1E-18, and green lines represent fold change over control of 2. (B) Choice of FDR cutoff for the dose experiments. The FDR cutoff is represented as 1E-n, with n denoted next to each point. (C–D). Percentage of differentially expressed genes that are synergistic in each combination according to FDR corrected p-value at (C) 3 hr and (D) 12 hr in MCF7 cells. (See also Source data 4, 5).
Figure 2—figure supplement 2
Differential expression in LNCaP Number of DEGs over time in LNCaP.
The Venn diagrams correspond to DEGs at 3 hr in (A) T, M, and TM; (B) T, W, and TW; and (C) M, W, and MW. The area represented in each color is in proportion to the number of genes in the corresponding color of the Venn diagram; blue areas represent SEGs. (See also Source data 6).
Figure 3 with 2 supplements
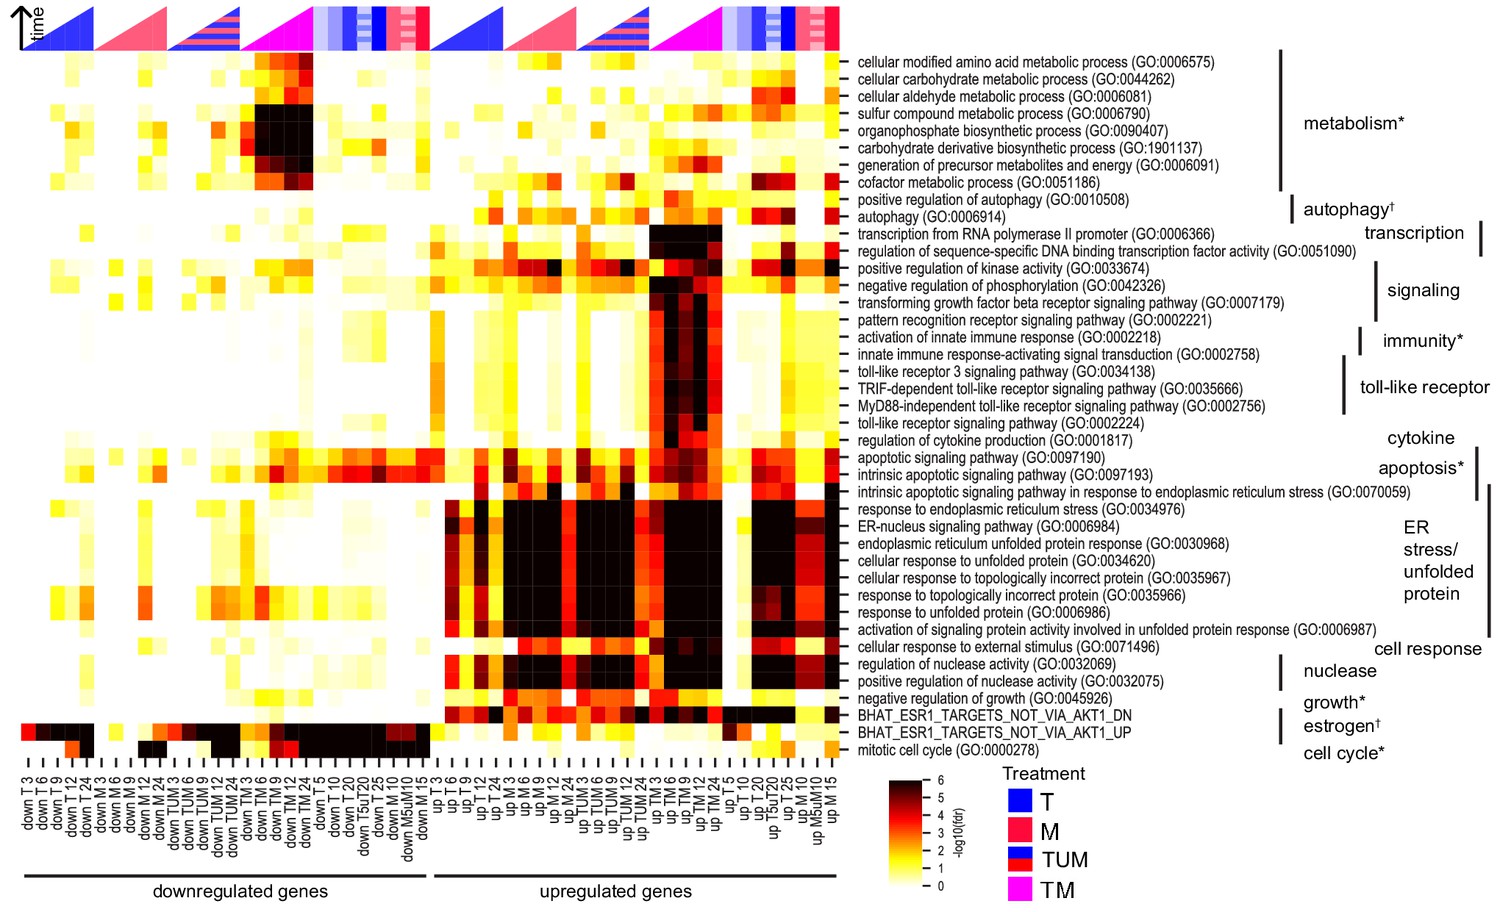
Key biological processes are associated with synergy.
Enrichment of DEGs in T, M, and TM with cancer-relevant gene sets. Only gene sets enriched in at least one condition (time point or treatment) are shown. ‘TUM’ indicates the union of DEGs either in T or M. Color intensity reflects degree of enrichment by Fisher’s Exact test. Color markers indicate treatment and color marker intensity indicates dose. *=hallmark of cancer, †=drug target (see Materials and methods).
Figure 3—figure supplement 1

Biological processes in MCF7 and LNCaP.
(A) Enrichment scores of differentially up and down regulated genes at different time points in W, M, T, TW, and MW, in MCF7 cells with the same cancer-relevant gene sets shown in Figure 3. (B) Hierarchical clustering of enrichment scores of differentially up- and down-regulated genes at different time points in the combination experiments in LNCaP cells with significant biological process gene sets (see Materials and methods). ‘U’ indicates the union of two genes sets, and represents the expected differentially expressed genes if the interaction between drugs was additive. Color intensity reflects the degree of enrichment by Fisher’s Exact test and is shown as –log10(FDR corrected p-value). Red: M, Blue: T, Yellow: W, Orange: MW, Green: TW, Magenta: TM.
Figure 3—figure supplement 2
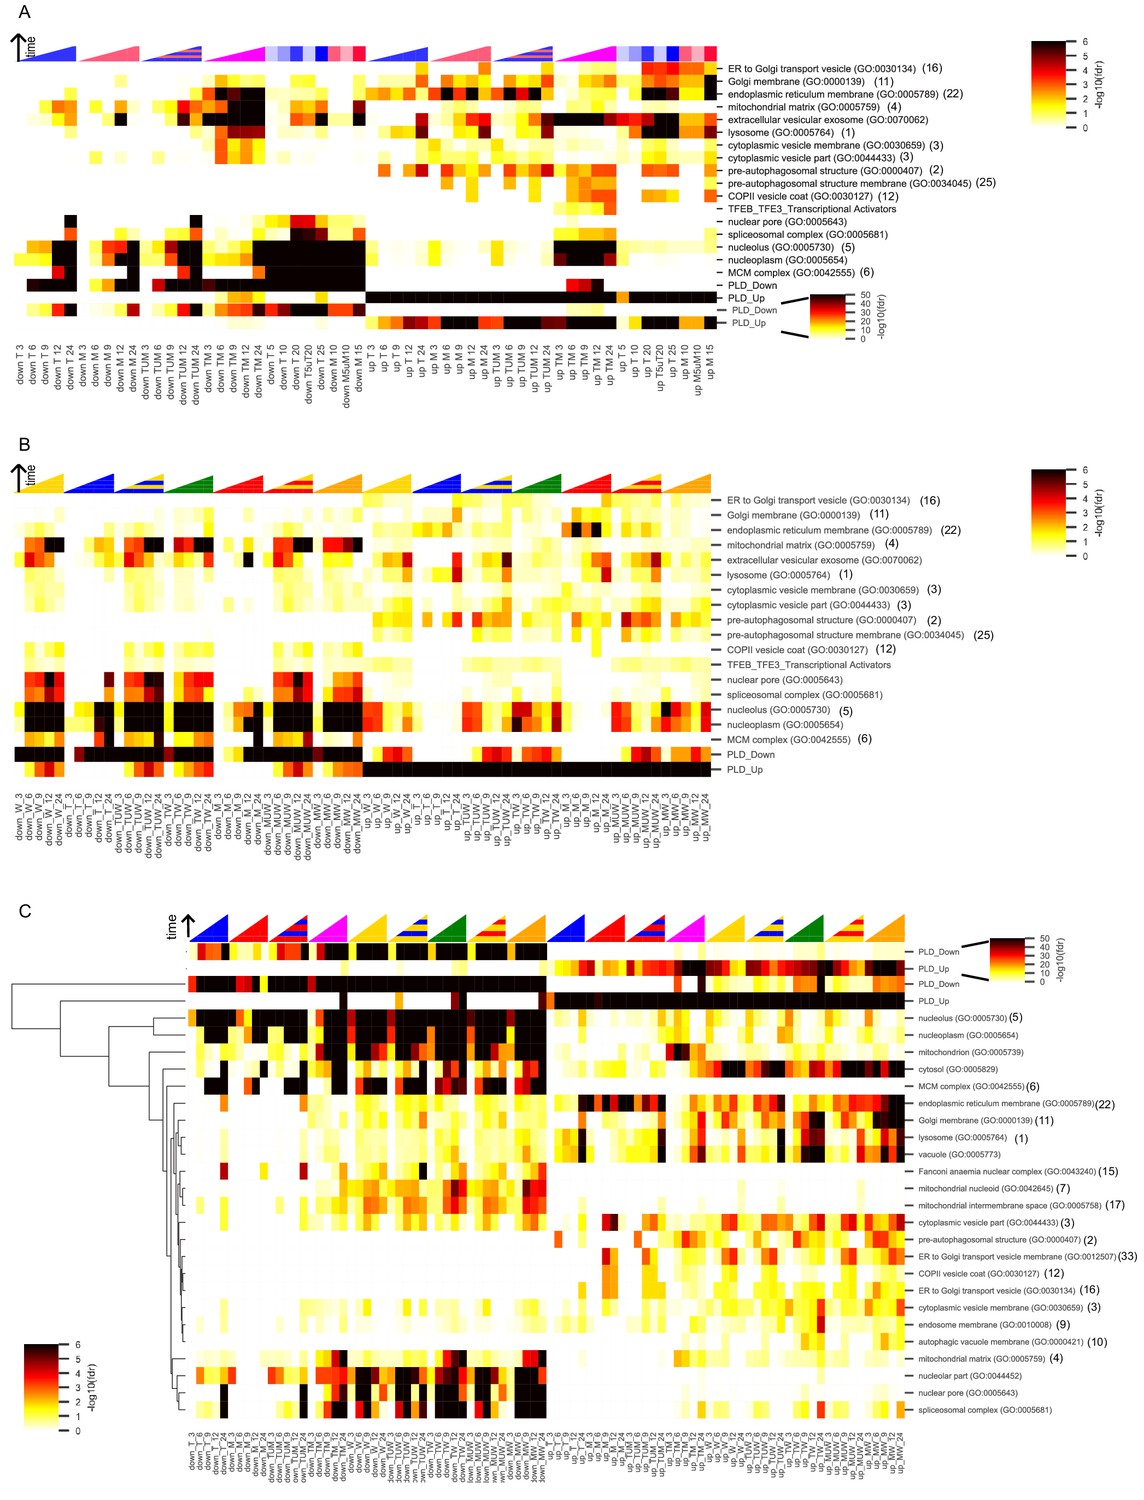
Enrichment in gene sets associated with phospholipidosis (PLD) in MCF7 and LNCaP.
Enrichment of DEGs with cellular component gene sets (see Materials and methods) in (A) MCF7 cells for T, M, and TM, (B) MCF7 cells for W, M, T, TW, and MW, and (C) all treatments in LNCaP cells, shown with hierarchical clustering (see Materials and methods). Only gene sets enriched in at least one condition (time point or treatment) are shown. For gene sets that also appeared in the top 40 gene sets associated with phospholipidosis (Supplementary Table 6 of Sirci et al.), the rank of the gene set in that list is shown in parentheses. ‘U’ indicates the union of two genes sets, and represents the expected differentially expressed genes if the interaction between drugs was additive. Color intensity reflects the degree of enrichment by Fisher’s Exact test and is shown as –log10(FDR corrected p-value). In A and C, the two PLD genes sets are also shown on a larger color scale (see inset colorbar) to illustrate subtle differences in enrichment. Red: M, Blue: T, Yellow: W, Orange: MW, Green: TW, Magenta: TM.
Figure 4
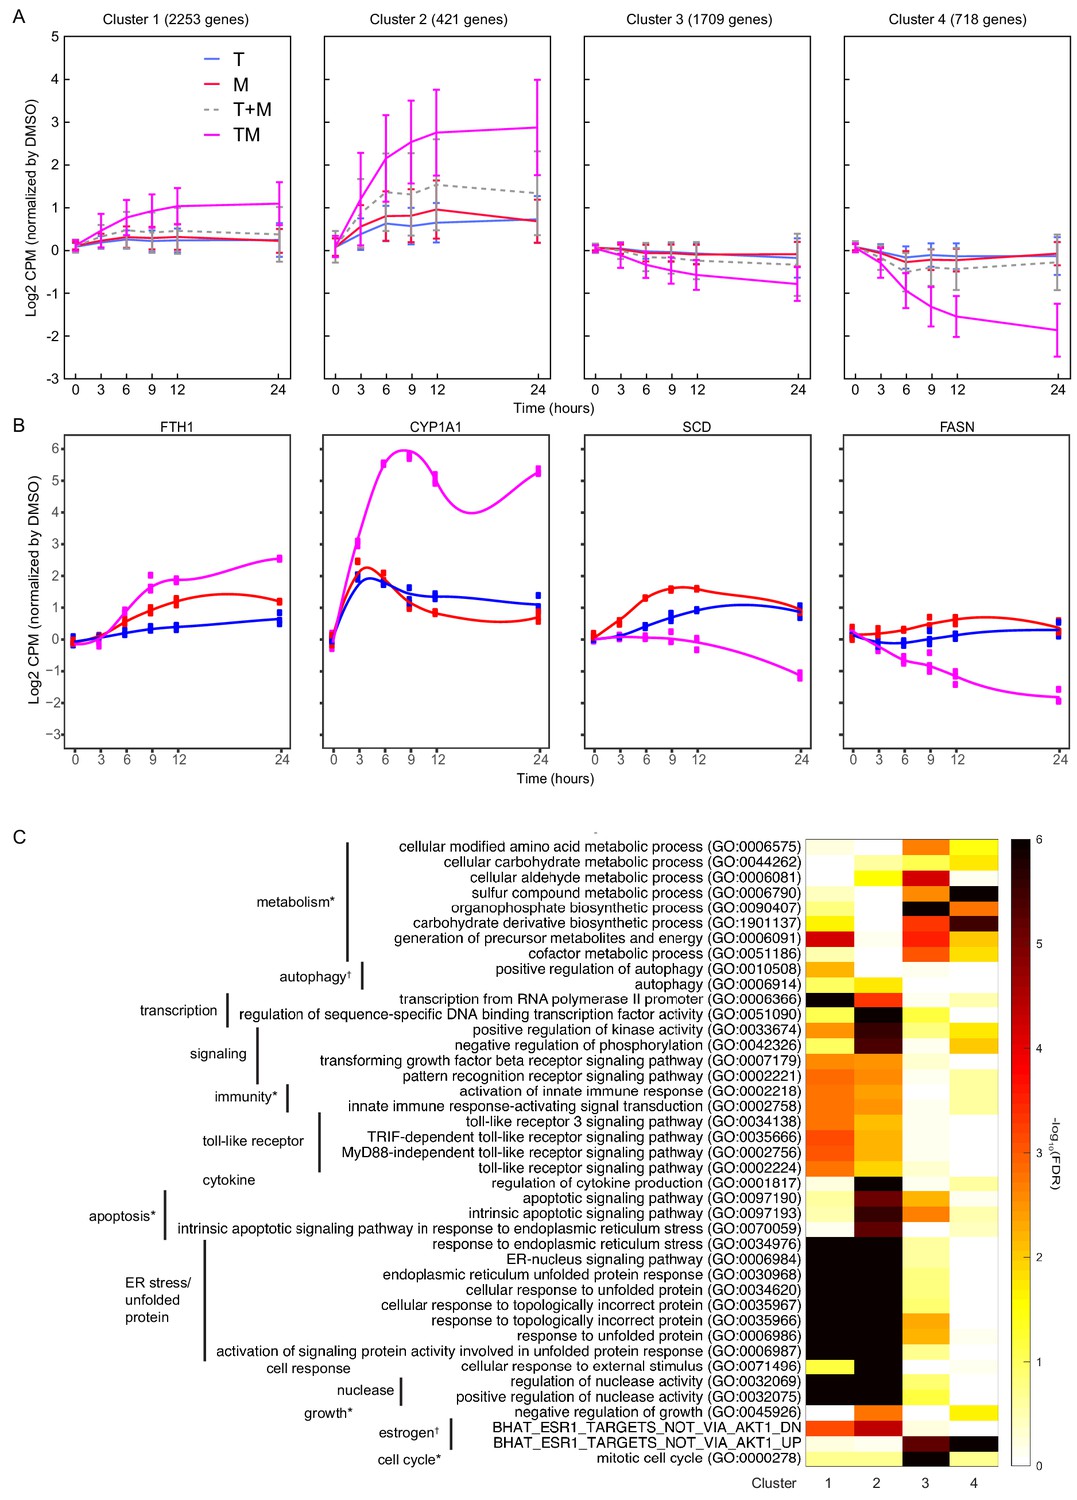
Differentially expressed genes have different time courses.
(A) Mean and standard deviation of gene expression in four clusters identified according to their similarity in expression in T, M, and TM in MCF7 cells. (B) Examples of genes in each cluster with significantly different trajectories in TM than the monotherapies. (C) Enrichment of the same biological processes as in Figure 2F in the clusters. (See also Source data 7).
Figure 5
New differential splicing emerges in drug combination TM.
Top 100 synergistically spliced exons in combination TM at 12 hr in MCF7 cells.
Figure 6 with 1 supplement
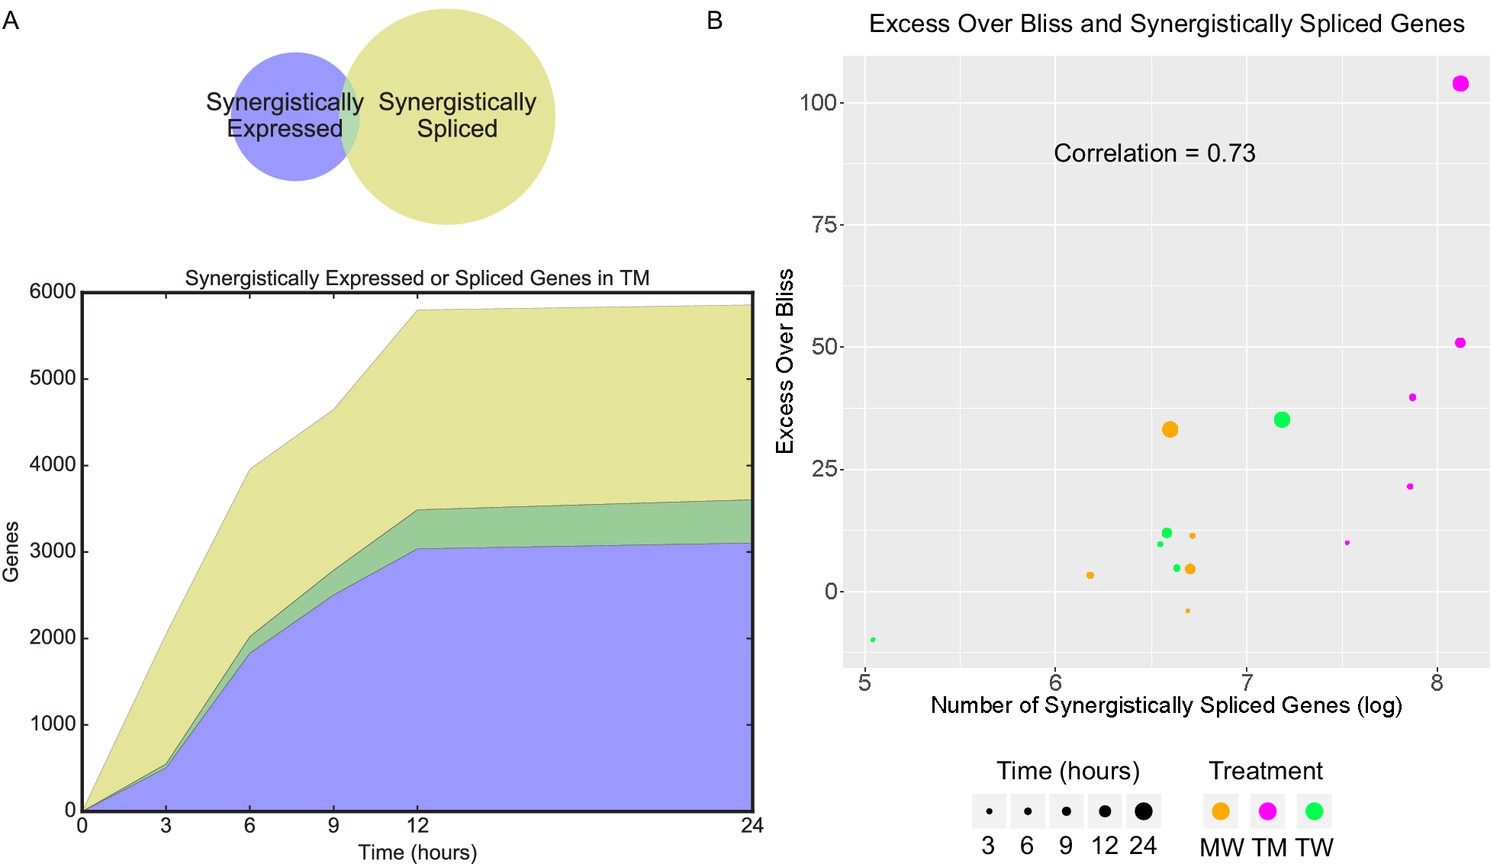
Synergistic splicing is distinct from differential expression and associated with synergy.
(A) Number of synergistically expressed and synergistically spliced genes in TM in MCF7 cells over time; shaded areas correspond to the Venn diagram for 3 hr. (B) Relationship of Excess Over Bliss score with the number of synergistically spliced genes in MCF7. (See also Supplementary file 9).
Figure 6—figure supplement 1
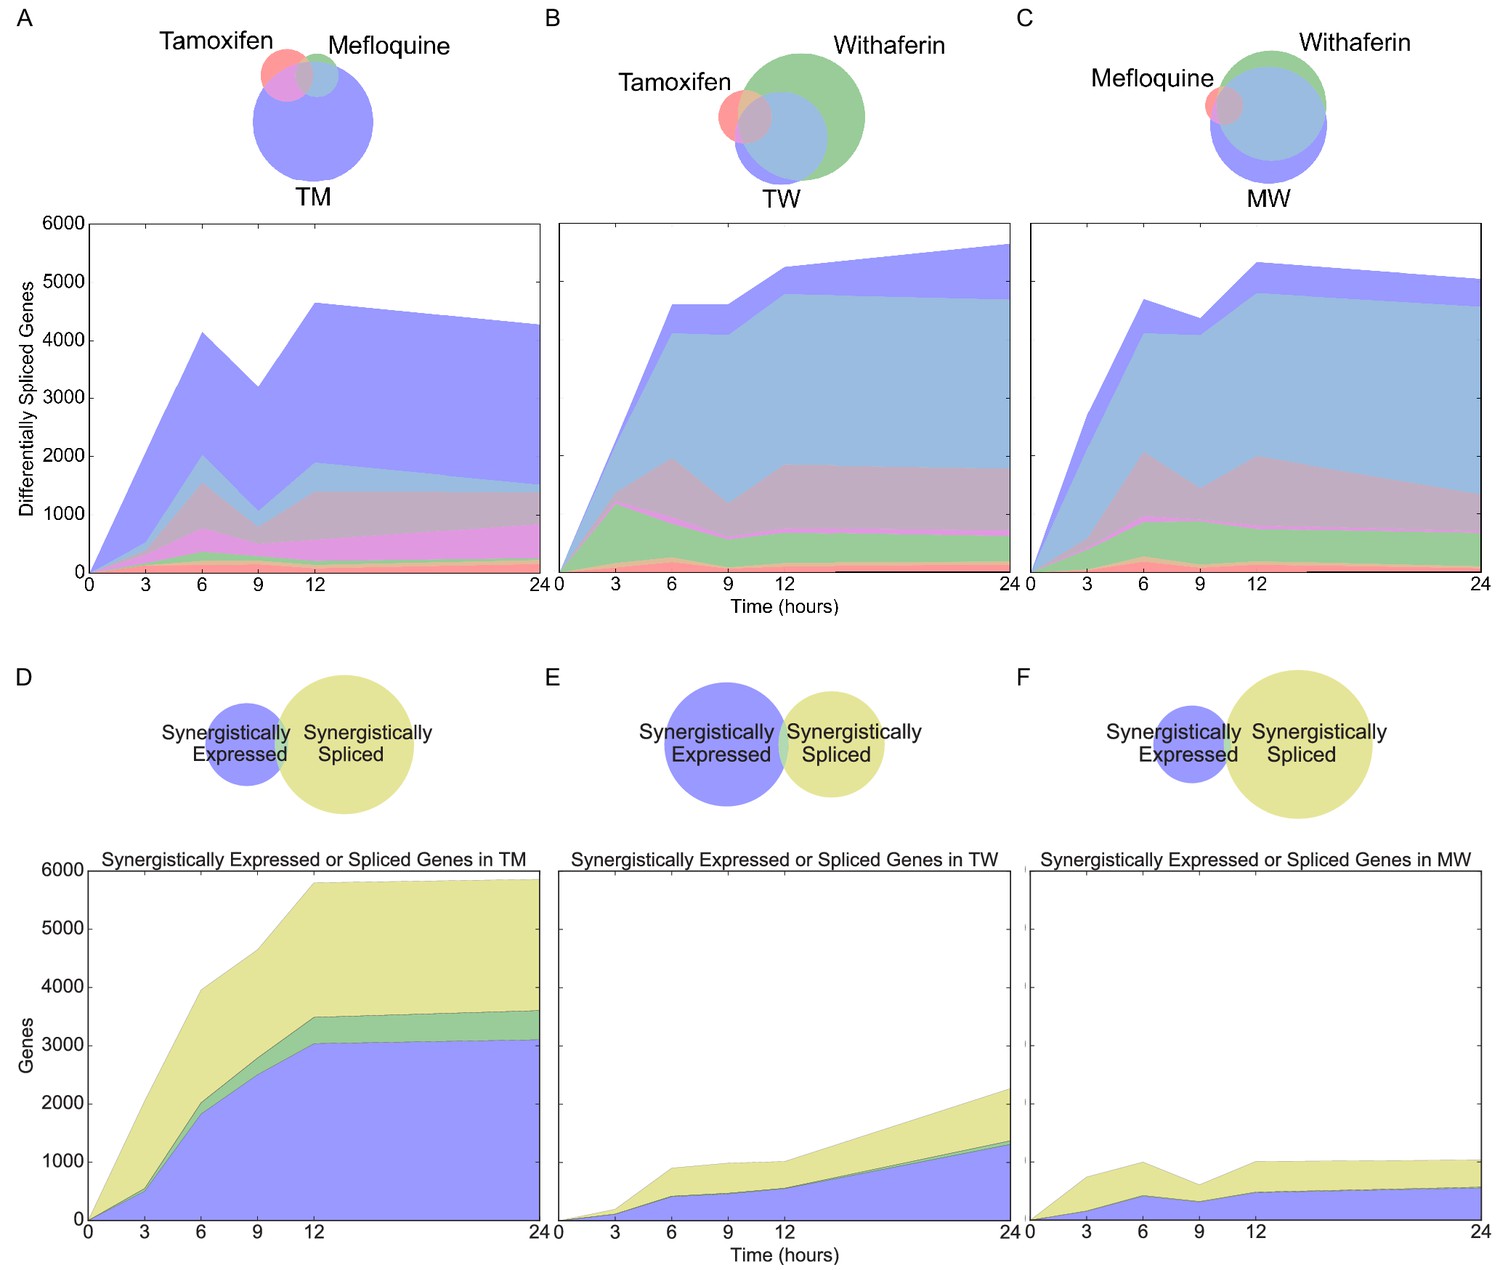
Differential and synergistic splicing in MCF7 cells.
(A-C) Number of differentially spliced genes over time with Venn diagrams of differentially spliced genes at 3 hr in (A) T, M, and TM; (B) T, W, and TW; and (C) M, W, and MW. The area represented in each color is in proportion to the number of genes in the corresponding color of the Venn diagram; blue areas represent synergistic genes. (D–F) Number of synergistically expressed and synergistically spliced genes in (D) TM, (E) TW, and (F) MW over time; shaded areas correspond to the Venn diagrams for 3 hr. (See also Source data 8).
Figure 7 with 2 supplements
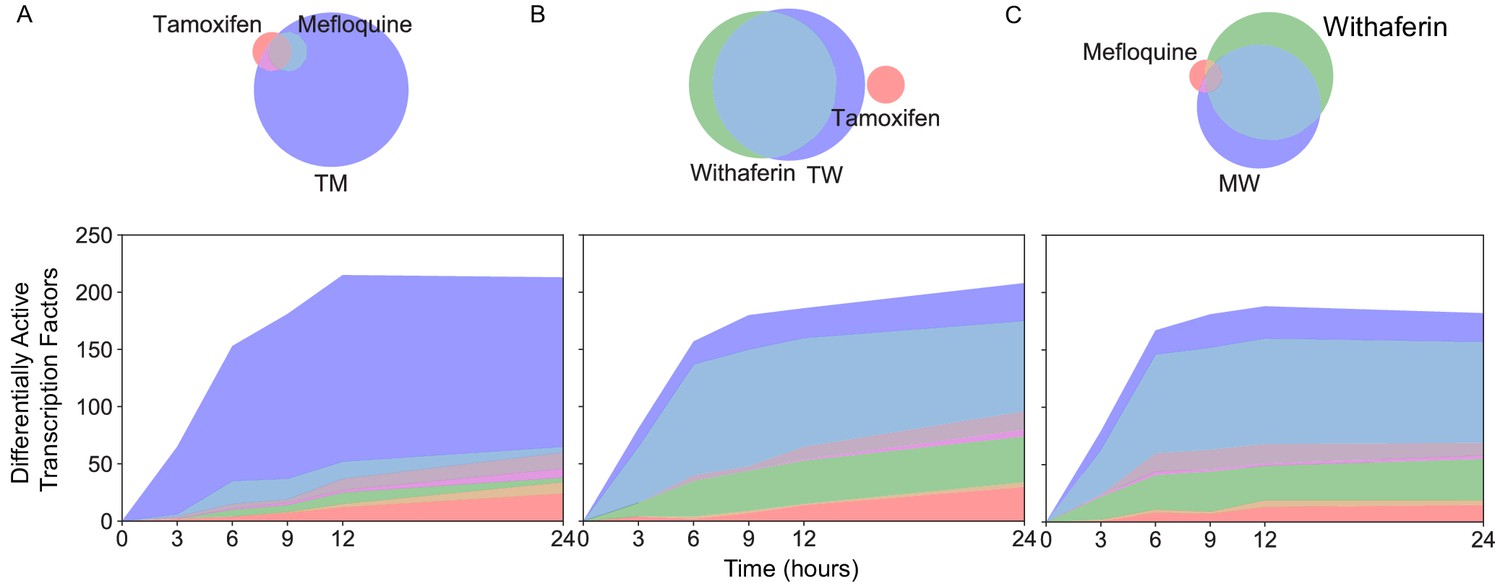
New differentially active transcription factors emerge in combination TM.
Number of DATFs over time with Venn diagrams at 3 hr in (A) T, M, and TM; (B) T, W, and TW; and (C) M, W, and MW in MCF7 cells. Area represented in each color matches the number of genes in the corresponding color of the Venn diagram; blue areas represent synergistic TFs. (See also Source data 9).
Figure 7—figure supplement 1
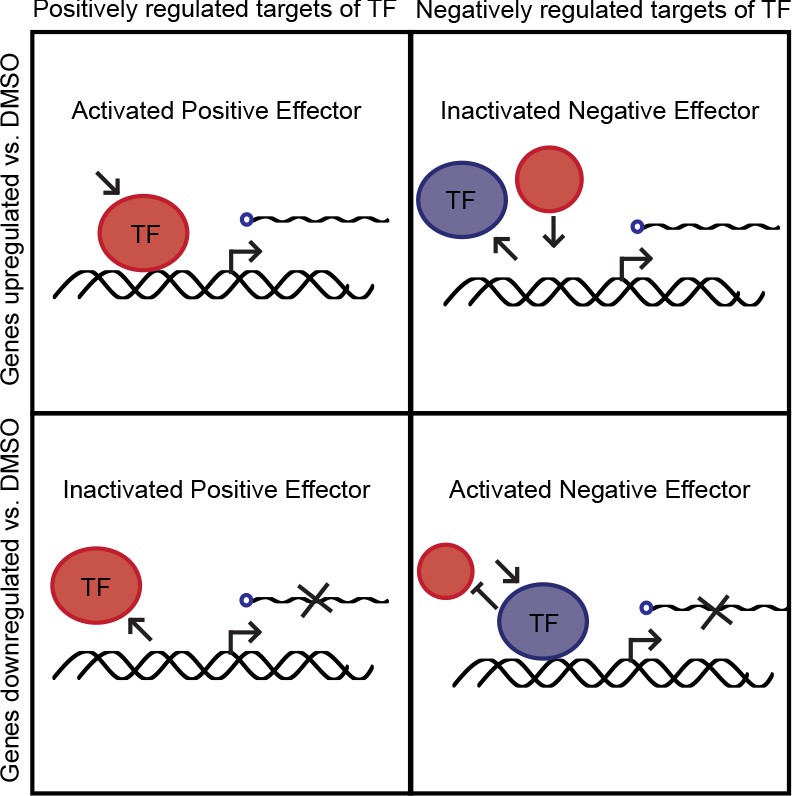
Possible changes to transcription factor activity.
Four cases of transcription factor activity that were assessed to determine whether a transcription factor was activated or inactivated.
Figure 7—figure supplement 2
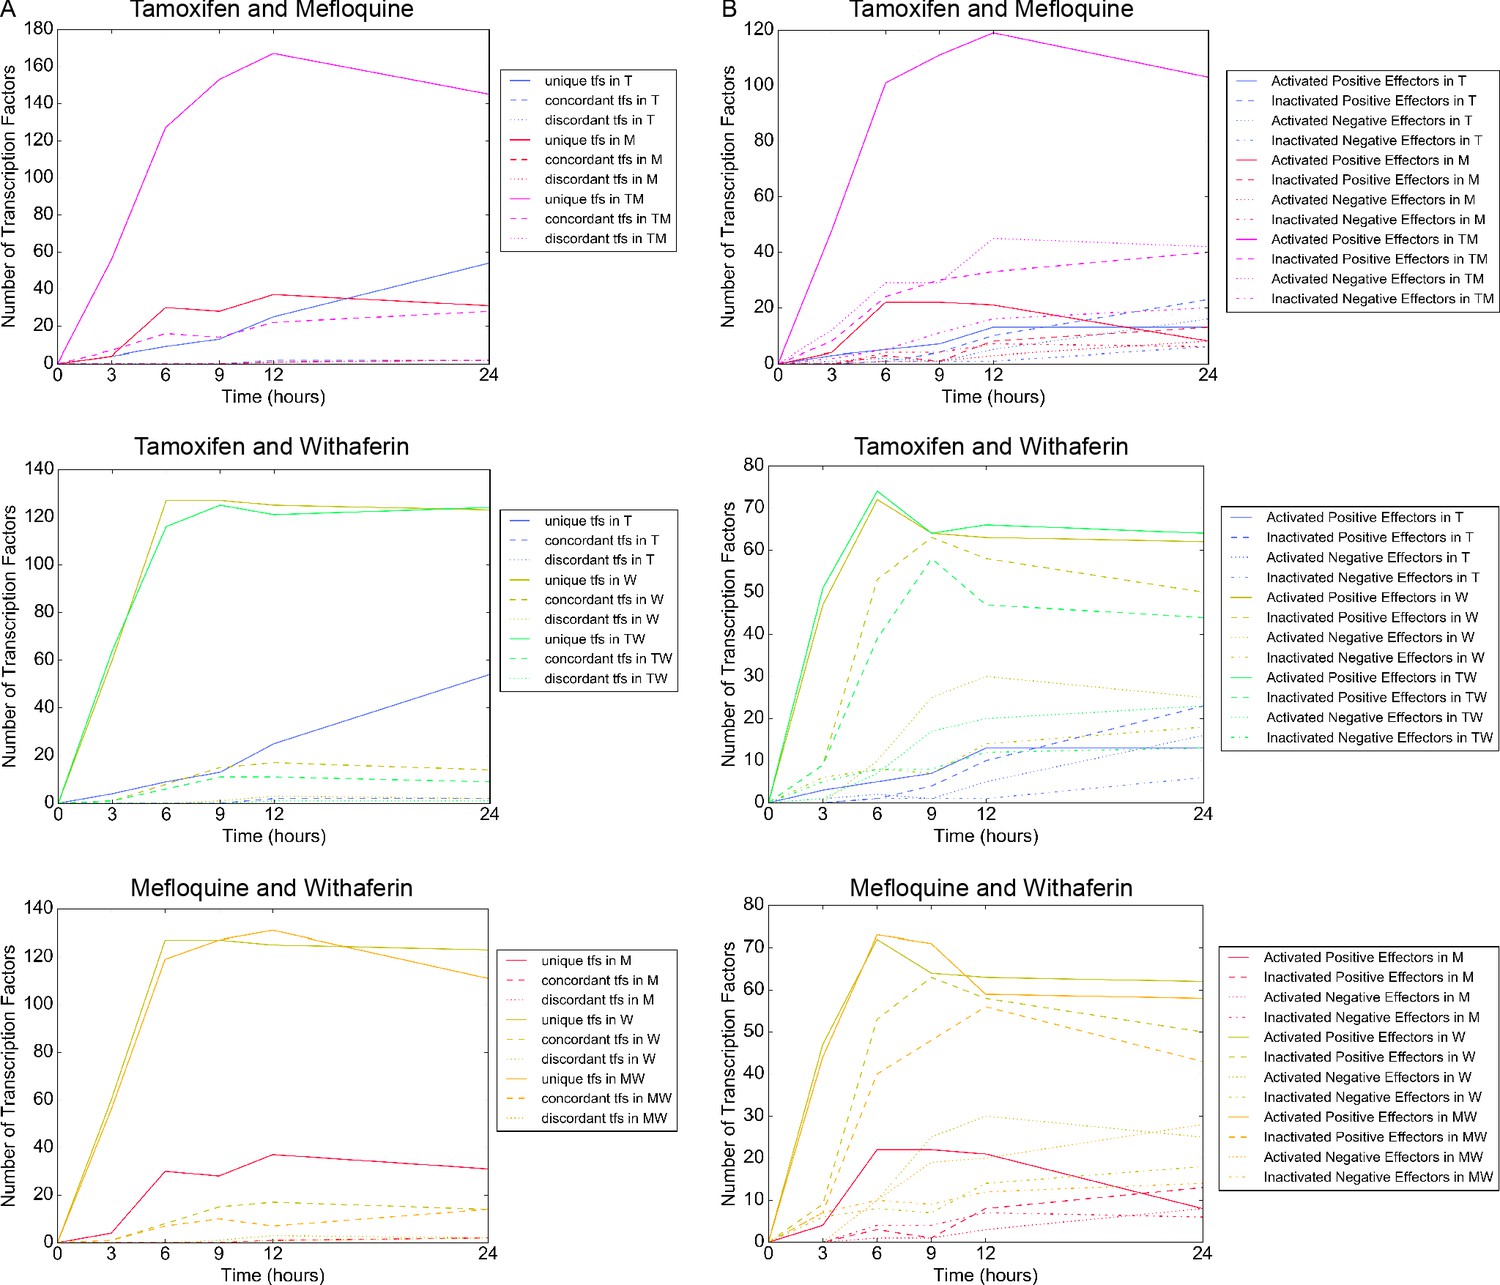
Classes of differentially active transcription factors in MCF7 cells.
(A) Differentially active transcription factors for each combination according to the status of the positive and negative effector of each transcription factor. Unique: either positive or negative effector, but not both, is differentially active; concordant: both effectors are activated or both are inactivated; discordant: one effector is activated and the other is inactivated. (B) Differentially active transcription factors for each combination according to each of the four cases supplement 1.
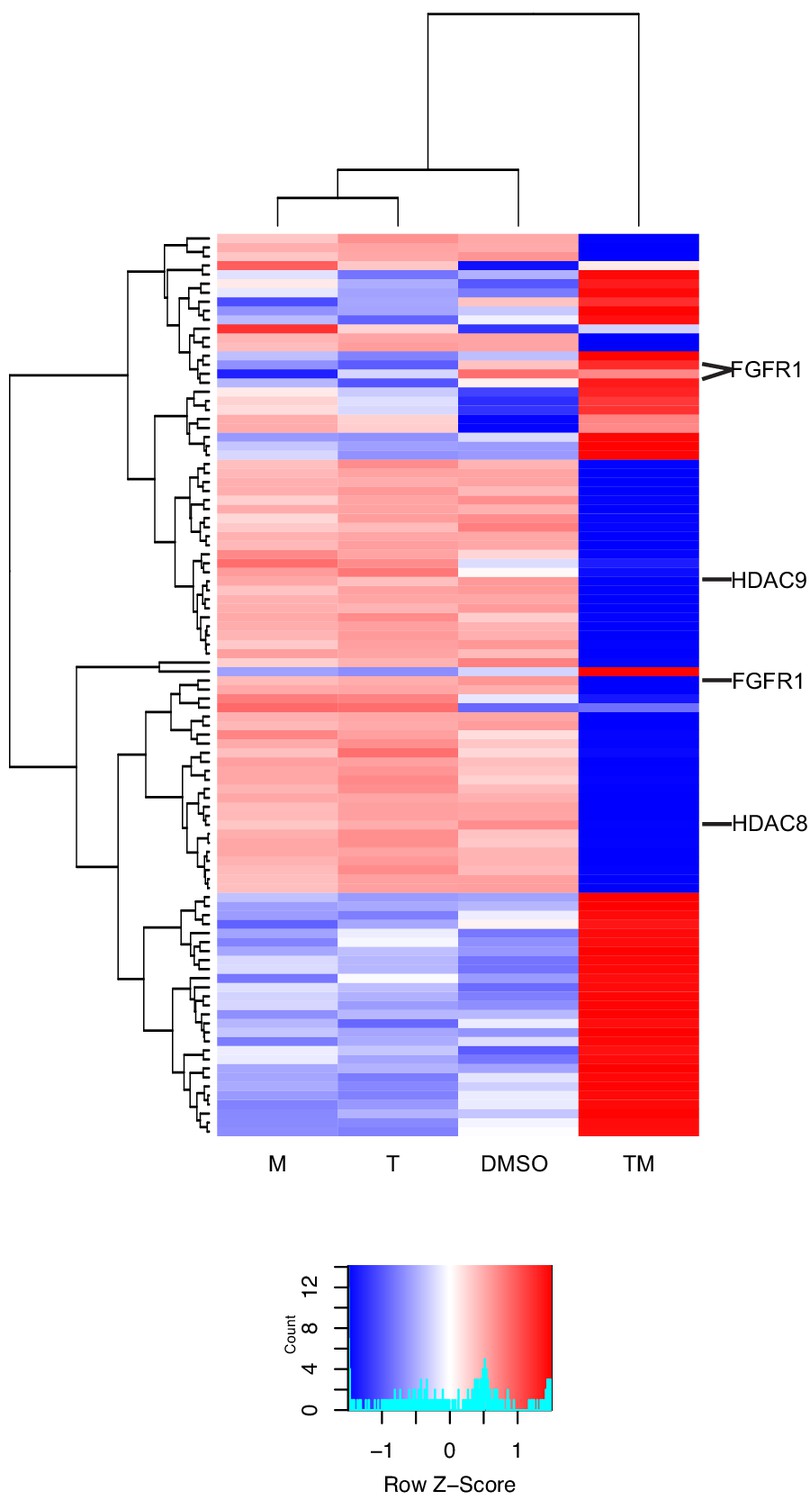
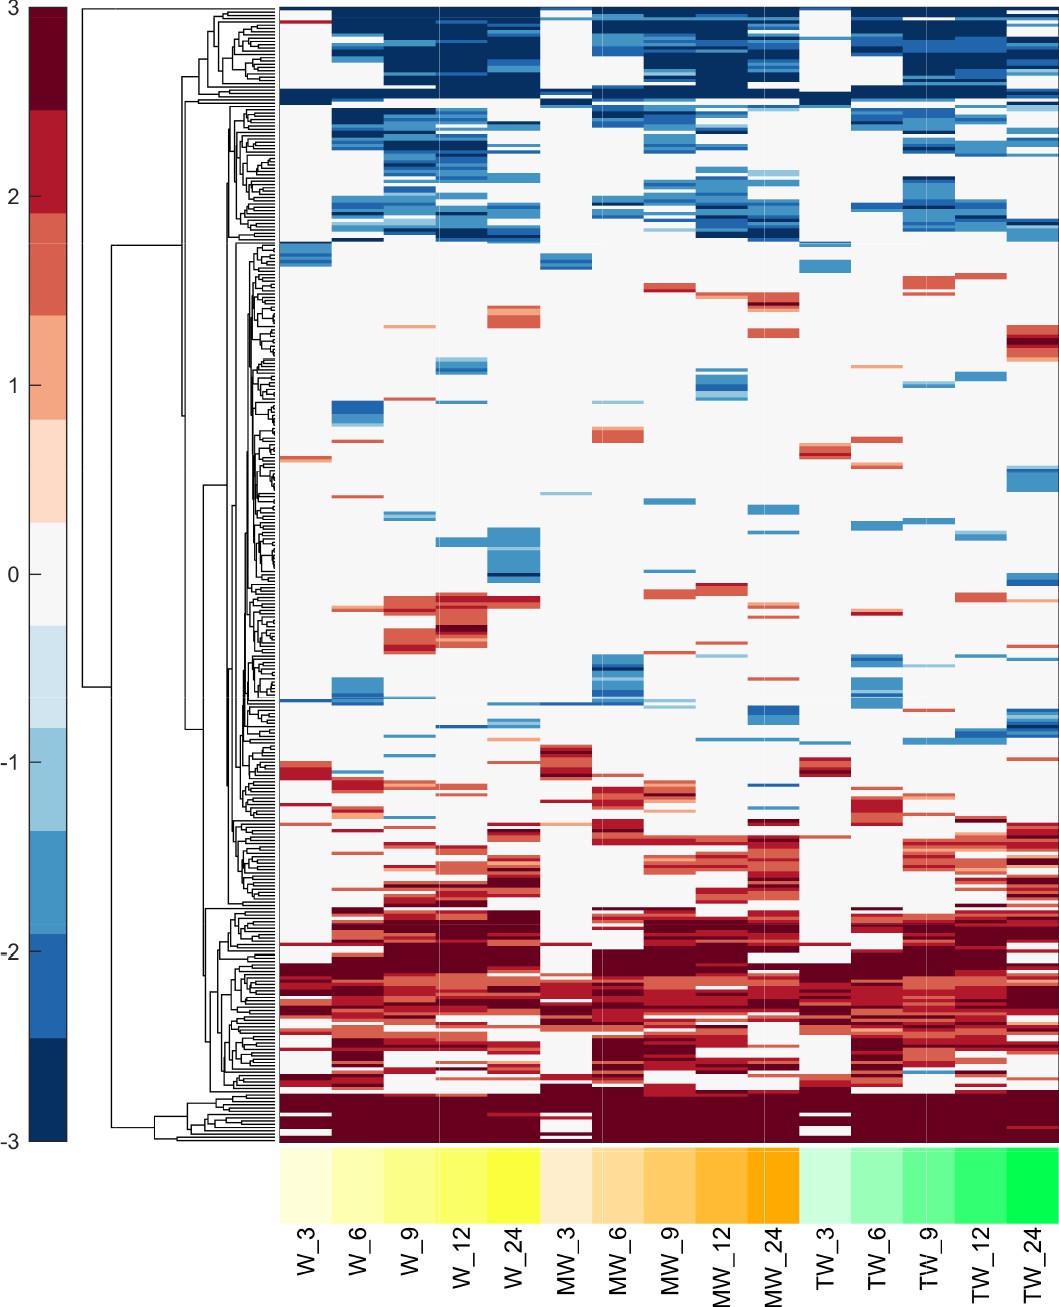
Figure 8 with 1 supplement
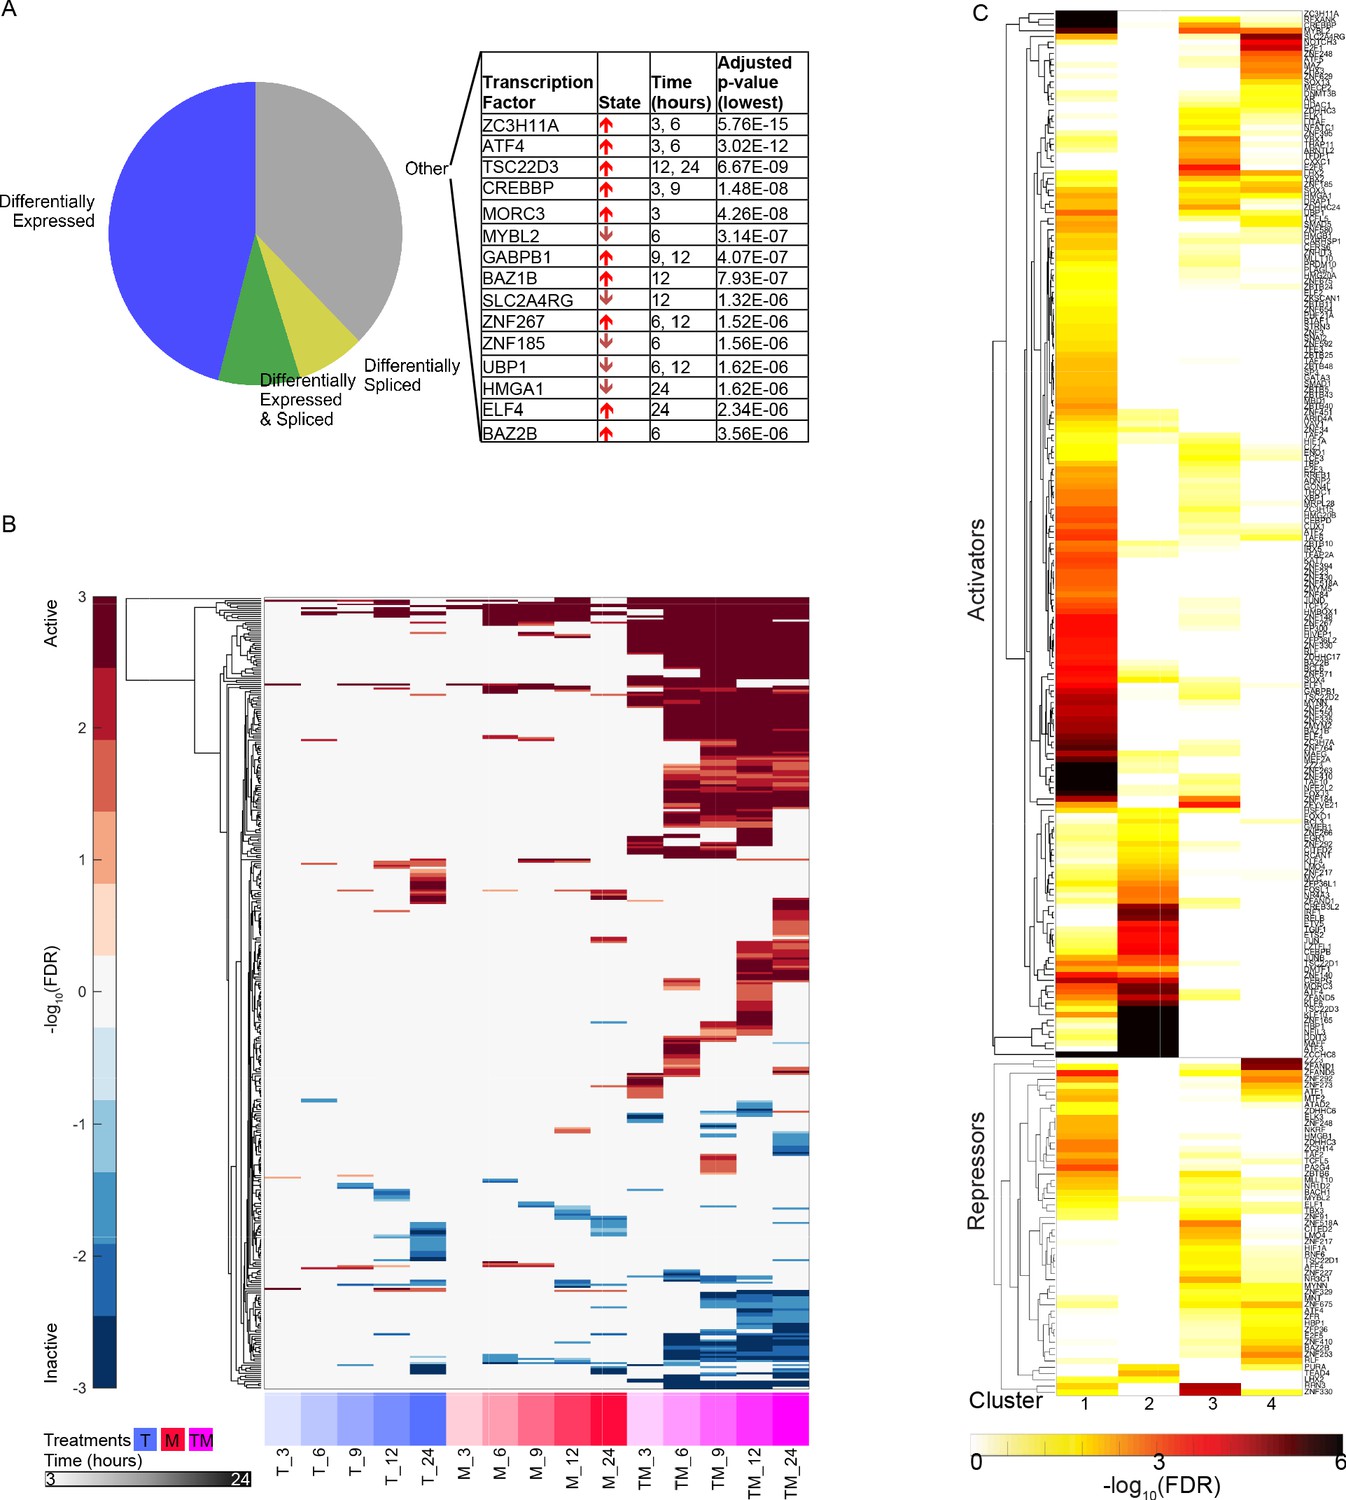
Characteristics of differentially active transcription factors.
(A) All instances of DATFs in MCF7 cells according to the differential expression or splicing status of each TF in the corresponding treatment and time point. The top 20 most significant DATFs not differentially expressed nor spliced are listed. All 20 are positive effectors. Arrows: up = activated, down = inactivated. (B) Heatmap of DATFs over time in T, M, and TM at 3–24 hr in MCF7 cells. Color intensity reflects the degree and direction of enrichment by Fisher’s Exact test with red for activation and blue for inactivation. Only significant instances are shown. (C) Enrichment of gene clusters from Figure 2F with sets of TF targets. Color intensity reflects the degree of enrichment by Fisher’s Exact test. (See also Source data 9).
Figure 8—figure supplement 1
Differentially active transcription factors in W combinations for MCF7 cells.
Heatmap of differentially active transcription factors over time in W, MW, and TW at 3–24 hr. Color intensity reflects the degree and direction of enrichment by Fisher’s Exact test and is shown as –log10(FDR corrected p-value), with positive values for activation and negative values for inactivation.
Figure 9 with 1 supplement
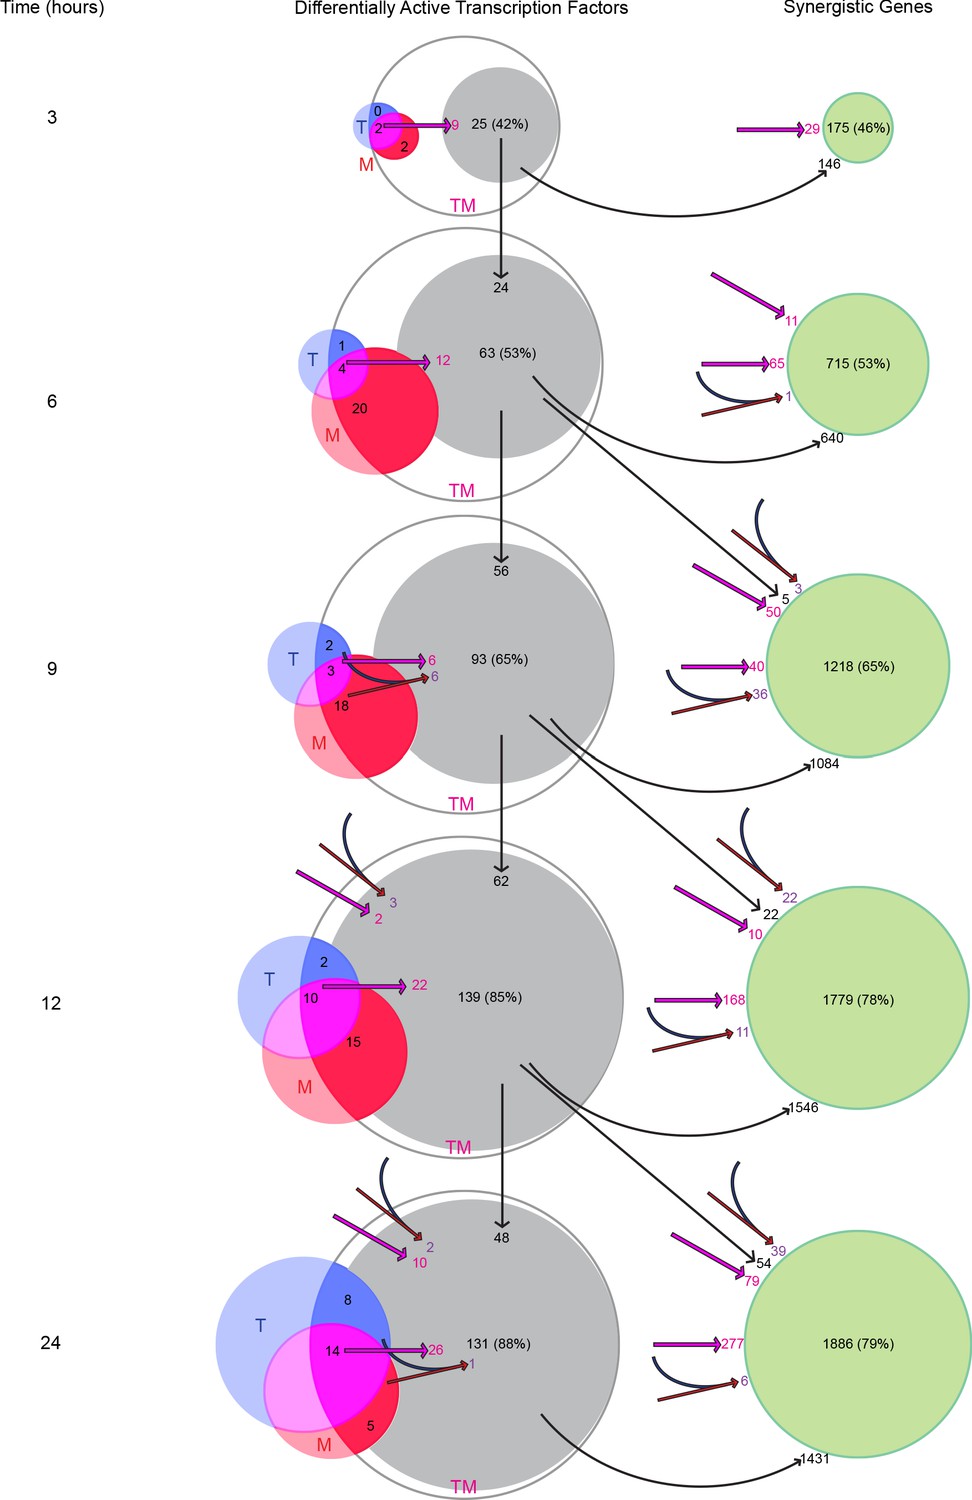
Transcription factors become differentially active in a time-dependent cascade in TM.
The number of DATFs or SEGs at 3–24 hr are shown as bubbles. Blue, red, and white bubbles represent DATFs in T, M, and TM, respectively. TFs (gray bubbles) and SEGs (green bubbles) shown are ‘explained’ by the following mechanisms: double-down mechanism at the same (magenta arrow and number) or previous (angled magenta arrow) time point, the AND mechanism at the same (converging blue and red arrows and purple number) or previous (angled converging blue and red arrows) time point, or by connection to another TF ‘explained’ by one of these mechanisms at the same (see supplement 1), or previous (vertical arrows) time point. The total number and percentage of TFs or SEGs in TM meeting any of these criteria is shown. (See also Source data 10).
Figure 9—figure supplement 1
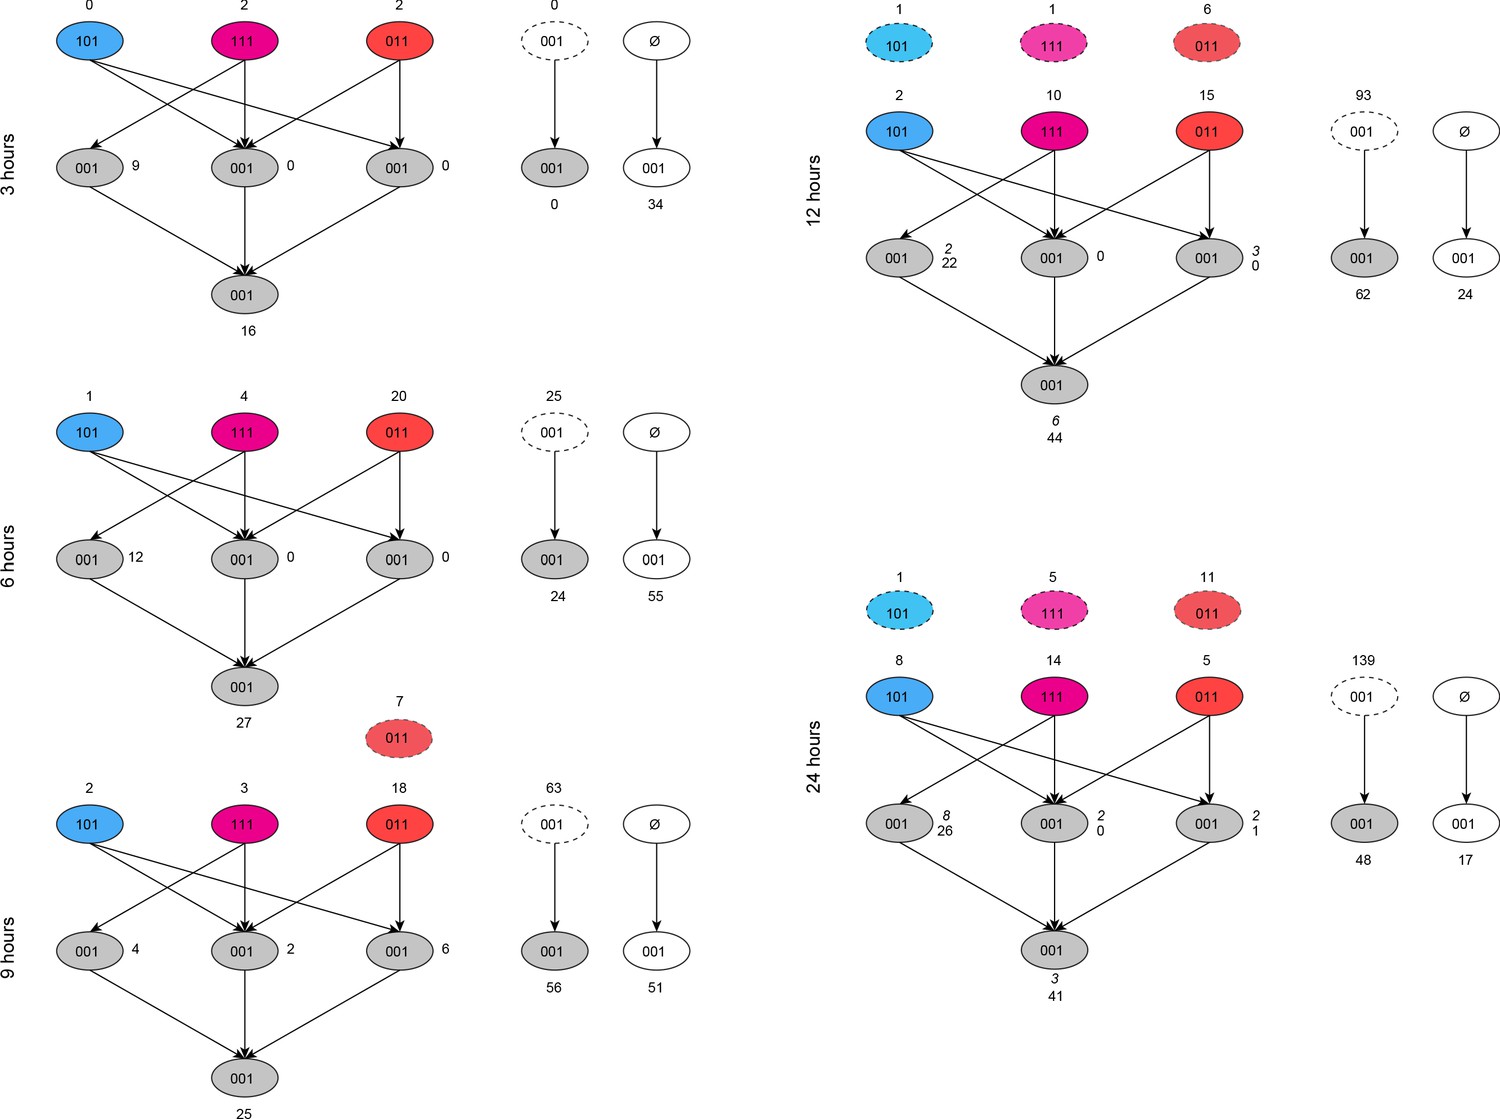
Cascade of differential transcription factor activity.
Connections between differentially active transcription factors in TM based on the MCF7 network. Each bubble represents a set of transcription factors that are differentially active in TM at a given timepoint. The codes on each bubble represent their differential activity status in Tamoxifen (first digit), Mefloquine, (second digit), and TM (third digit), where one is differentially active and 0 is not. Synergistic transcription factors in TM (001), are categorized into ‘explained’ bubbles (gray) or not explained (white). At each timepoint, synergistic transcription factors can be ‘explained’ by a network connection to a transcription factor that is differentially active in Tamoxifen and Mefloquine (111, magenta), or to at least one transcription factor in each of Tamoxifen alone (101, blue) and Mefloquine alone (011, red), or both, resulting in the left-hand, right-hand, and middle gray bubbles, respectively, in the middle layer. The fourth gray bubble in the lowest layer represents transcription factors which have connections to transcription factors in the middle ‘explained’ layer, but not to transcription factors in the top layer. Numbers in italics represent synergistic transcription factors that can be explained by connections to transcription factors that were active in monotherapies at the previous time point (blue, magenta, and red bubbled with dashed outlines at top of each timepoint). At the right in each time point, the dashed-outline bubble represents ‘explained’ transcription factors in the gray bubbles at the previous time point. Synergistic transcription factors not explained by other means which have a connection to any ‘explained’ transcription factors at the previous time point are shown in the gray bubble below the dashed-outline bubble. Finally, synergistic transcription factors that cannot be explained by any network connections are shown in the white bubble resulting from the ‘null’ set at each timepoint. The colors in this figure correspond to Figure 9, and the sum of all gray bubbles at each timepoint in this figure correspond to the single gray bubble shown at each timepoint in Figure 9. (See also Source data 10).
Figure 10
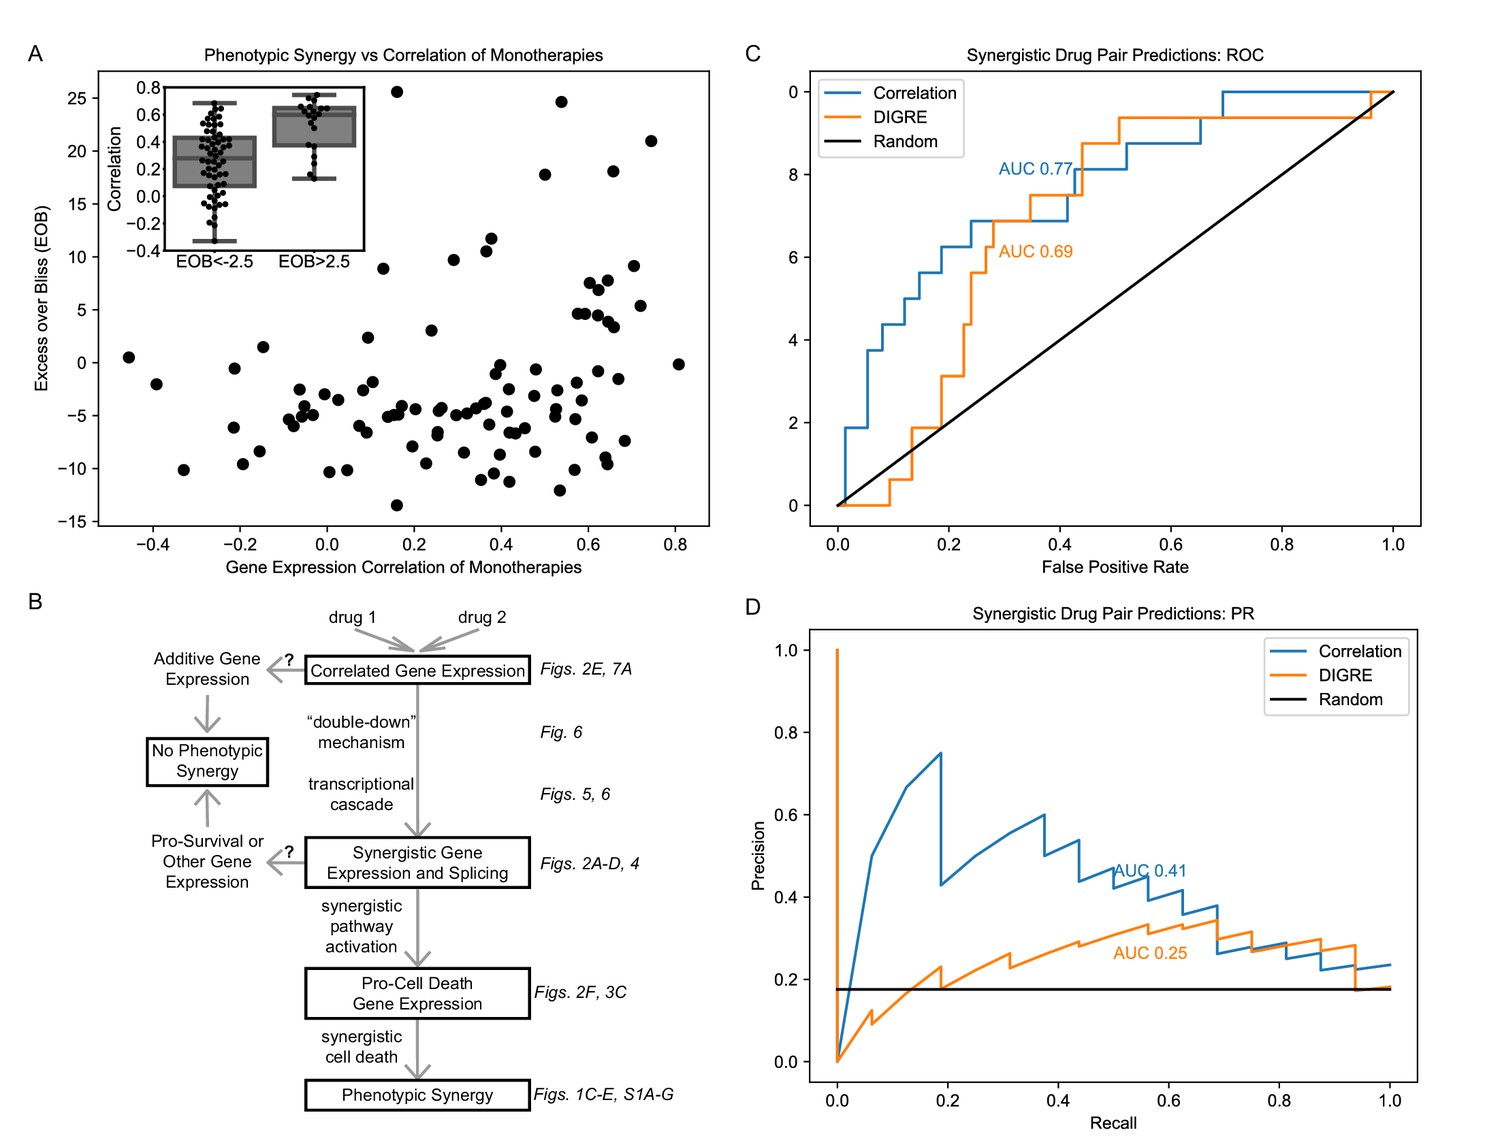
Correlation of monotherapies is associated with synergy in an independent dataset.
(A) Relationship between Excess Over Bliss (EOB) for 91 drug pairs and the correlation between the gene expression of LY3 DLBCL cells treated with corresponding monotherapies in the DREAM dataset. The inset indicates the distribution of correlations for pairs with EOB <−2.5 and EOB >2.5. (B) Hypothetical model for the relationships between monotherapy correlation, SEGs, and synergy. Boxed nodes represent phenomena we directly measured in this study. (C–D) ROC (C) and PR (D) for classification of synergistic drug pairs using expression correlation and DIGRE.
Tables
Table 1
Selection of adjusted p-value cutoff for differentially expressed genes.
The six most differentially expressed genes with respect to DMSO in each treatment at time 0 are shown in ascending order of their Voom score (log10(FDR)). Immediate Early Genes are marked in red. Differentially expressed genes according to the cutoff for FDR corrected p-value are marked in bold.
| T_0 | TM_0 | M_0 | TW_0 | MW_0 | W_0 | ||||||
|---|---|---|---|---|---|---|---|---|---|---|---|
| -6 | BCAN | −17 | ATXN2 | -3 | −54 | −53 | −53 | ||||
| -3 | −17 | -2 | −26 | −28 | −20 | ||||||
| TOB1 | -3 | VIM | −17 | ZNF592 | -1 | −23 | −17 | −19 | |||
| KLF4 | -2 | −15 | ZHX2 | -1 | −17 | PDCD7 | −17 | C17O | −16 | ||
| SGK1 | -2 | MSN | −13 | SCAF4 | -1 | PDCD7 | −16 | −15 | −16 | ||
| PRDM1 | -2 | NCAN | −10 | NAT8L | -1 | C17ORF91 | −16 | −14 | PDCD7 | −15 | |
Key resources table
| Reagent type (species) or resource | Designation | Source or reference | Identifiers | Additional information |
|---|---|---|---|---|
| Cell line (Homo sapiens) | MCF7 | American Type Culture Collection | Cat No. HTB-22 | RRID:CVCL_0031 |
| Cell line (Homo sapiens) | LNCaP | American Type Culture Collection | Cat No. CRL-1740 | RRID:CVCL_1379 |
| Chemical compound, drug | Withaferin A | Enzo Life Sciences | Cat No. BML-CT104-0010 | |
| Chemical compound, drug | Mefloquine hydrochloride | Sigma-Aldrich | Cat No. M2319-100MG | |
| Chemical compound, drug | Tamoxifen citrate | Tocris Bioscience | Cat No. 0999 |
Additional files
-
Source data 1
Log counts per million of MCF7 cell combination treatment experiments.
- https://cdn.elifesciences.org/articles/52707/elife-52707-data1-v2.csv.zip
-
Source data 2
Log counts per million of MCF7 cell monotherapy dose experiments.
- https://cdn.elifesciences.org/articles/52707/elife-52707-data2-v2.csv.zip
-
Source data 3
Log counts per million of LNCaP cell combination treatment experiments.
- https://cdn.elifesciences.org/articles/52707/elife-52707-data3-v2.csv.zip
-
Source data 4
Archive of MCF7 combination experiments differential expression data.
- https://cdn.elifesciences.org/articles/52707/elife-52707-data4-v2.zip
-
Source data 5
Archive of MCF7 dose experiments differential expression data.
- https://cdn.elifesciences.org/articles/52707/elife-52707-data5-v2.zip
-
Source data 6
Archive of LNCaP differential expression data.
- https://cdn.elifesciences.org/articles/52707/elife-52707-data6-v2.zip
-
Source data 7
k-means clusters assigned to genes.
- https://cdn.elifesciences.org/articles/52707/elife-52707-data7-v2.zip
-
Source data 8
Archive of differential splicing data.
- https://cdn.elifesciences.org/articles/52707/elife-52707-data8-v2.zip
-
Source data 9
Archive of differential transcription factor activity data.
- https://cdn.elifesciences.org/articles/52707/elife-52707-data9-v2.zip
-
Source data 10
Archive of transcription factors involved in the transcriptional cascade.
- https://cdn.elifesciences.org/articles/52707/elife-52707-data10-v2.zip
-
Supplementary file 1
Viability data and calculated EOB for TM dose matrices at 12, 24, and 48 hr in MCF7.
Actual values of negative inhibition in monotherapies are included in the heatmap at left. Monotherapy inhibition values used to calculate EOB are shown in the table at right (i.e. Drug1_NPI).
- https://cdn.elifesciences.org/articles/52707/elife-52707-supp1-v2.xlsx
-
Supplementary file 2
Viability data and calculated EOB for TW dose matrices at 12, 24, and 48 hr in MCF7.
Actual values of negative inhibition in monotherapies are included in the heatmap at left. Monotherapy inhibition values used to calculate EOB are shown in the table at right (i.e. Drug1_NPI).
- https://cdn.elifesciences.org/articles/52707/elife-52707-supp2-v2.xlsx
-
Supplementary file 3
Time courses viability data of TM, TW, and MW in MCF7.
- https://cdn.elifesciences.org/articles/52707/elife-52707-supp3-v2.xlsx
-
Supplementary file 4
Time courses viability data of TM, TW, and MW in LNCaP.
- https://cdn.elifesciences.org/articles/52707/elife-52707-supp4-v2.xlsx
-
Supplementary file 5
Viability data and calculated EOB for TM, TW, and MW at 48 hr in LNCaP.
- https://cdn.elifesciences.org/articles/52707/elife-52707-supp5-v2.xlsx
-
Supplementary file 6
Viability data for T and M dose and calculated EOB for sham combinations in MCF7.
- https://cdn.elifesciences.org/articles/52707/elife-52707-supp6-v2.csv.zip
-
Supplementary file 7
Archive of Raw Fastq IDs.
- https://cdn.elifesciences.org/articles/52707/elife-52707-supp7-v2.zip
-
Supplementary file 8
Archive of raw expression files.
- https://cdn.elifesciences.org/articles/52707/elife-52707-supp8-v2.zip
-
Supplementary file 9
Exon counts.
- https://cdn.elifesciences.org/articles/52707/elife-52707-supp9-v2.zip
-
Transparent reporting form
- https://cdn.elifesciences.org/articles/52707/elife-52707-transrepform-v2.docx
Download links
A two-part list of links to download the article, or parts of the article, in various formats.
Downloads (link to download the article as PDF)
Open citations (links to open the citations from this article in various online reference manager services)
Cite this article (links to download the citations from this article in formats compatible with various reference manager tools)
The transcriptomic response of cells to a drug combination is more than the sum of the responses to the monotherapies
eLife 9:e52707.
https://doi.org/10.7554/eLife.52707


