Hair follicle stem cells regulate retinoid metabolism to maintain the self-renewal niche for melanocyte stem cells
- Peking Union Medical College, China
- National Institute of Biological Sciences, China
- Shanghai Institutes for Biological Sciences, University of Chinese Academy of Sciences, China
- Tsinghua University, China
Figures
Figure 1 with 1 supplement
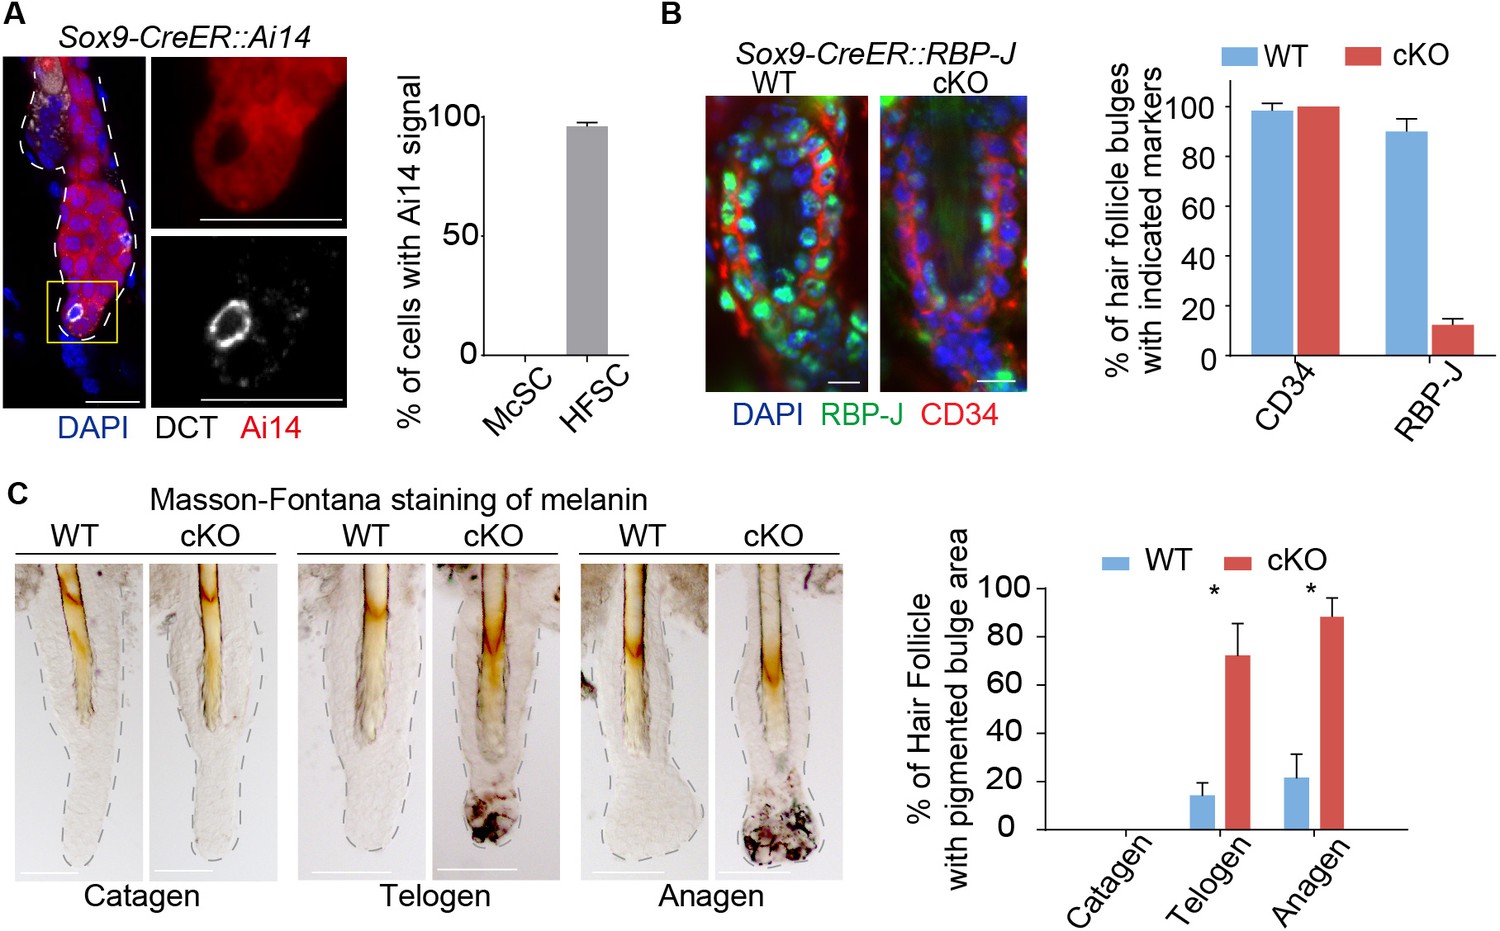
Ablation of Notch pathway effector RBP-J in bulge epithelial cells causes McSCs ectopic differentiation in the niche.
(A) Representative immunofluorescence images and quantification of Tamoxifen induced Sox9-CreER::Ai14 mice indicating efficient labeling of bulge epithelial cells but not McSCs. DCT is a melanocyte marker. Tamoxifen was injected on P1-4 at anagen, dorsal skin samples were taken on P20 at telogen. (B) Representative immunofluorescence images and quantification of CD34 and RBP-J in the bulge of WT and Sox9-CreER::RBP-J cKO HFs in dorsal skin. Note the efficient ablation of RBP-J in both HFSCs (marked by CD34) and the inner layer CPLs in cKO compared to WT bulge. (C) Representative tail skin wholemount melanin specific Masson-Fontana staining images and quantification of ectopic pigmentation in the bulge of WT and Sox9-CreER::RBP-J cKO HFs at the telogen to anagen transition stages. Tamoxifen was injected on P1-4 at anagen, tail skin samples were taken on P14(catagen), P15(telogen) and P16(anagen). All data are expressed as mean ± SD ≥ 20 follicles are quantified each mouse. N = 3 at each time point. (*) p<0.05. Scale bars = 10 μm.
Figure 1—figure supplement 1

HF phenotype in Sox9-CreER::RBP-J cKO mice.
(A) Representative tail skin immunofluorescence images of Sox9 in WT and Sox9-CreER::RBP-J cKO HFs at P18 anagen. Note the expression pattern of Sox9 is similar in cKO compared to WT bulge. (B) Schematic diagram of experiments using Sox9-CreER::RBP-J cKO mice. Tamoxifen was injected from P1-4 at morphogenesis anagen and tail skin samples were taken at P14 (catagen), P15 (telogen), P16 (anagen). (C) Representative tail skin wholemount images of melanin specific Masson-Fontana staining in WT and Sox9-CreER::RBP-J cKO mice. Follicles are counter-stained by neutral red. (D) Representative tail skin immunofluorescence images of keratinocyte differentiation marker Krt10 and Krt6 in WT and Sox9-CreER::RBP-J cKO HFs at P25. RBP-J cKO HFs undergo ectopic differentiation and structure deformation. (E) Representative dorsal skin immunofluorescence images of keratinocyte differentiation marker Krt10 and Krt6 in WT and Sox9-CreER::RBP-J cKO HFs at P50. Note the ectopic expression of Krt10 and complete degeneration of HF structure in the RBP-J cKO HF. Scale bars = 10 μm.
Figure 2 with 1 supplement
Loss of RBP-J specifically in HFSC causes hair cycle dependent McSCs ectopic differentiation in the shared niche.
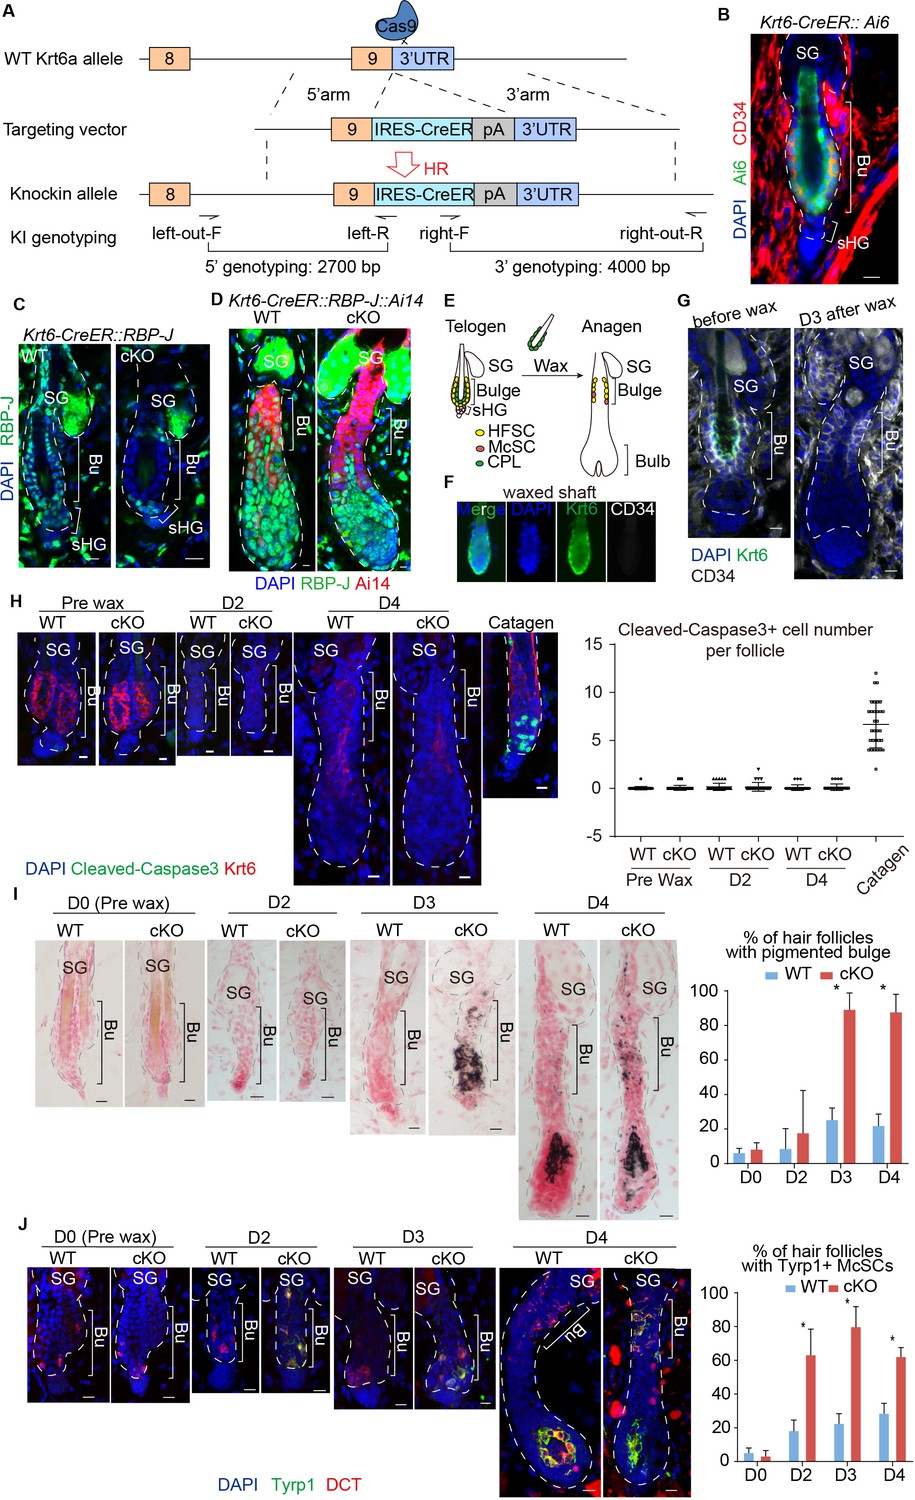
(A) Schematic diagram of CRISPR/Cas9-mediated knockin of CreER in the 3’ UTR of Krt6a locus. sgRNA targets downstream of Krt6a stop codon. Two pair of indicated primers spanning the junctions of both homologous arms and the target sequences were used to validate correct insertion. (B) Representative immunofluorescence image of Krt6-CreER::Ai6 labeling HFSCs in telogen bulge. Tamoxifen was injected on P55 at the second telogen, dorsal skin samples were taken two days later at telogen for analysis. Note the high labeling efficiency of both HFSCs (marked by CD34) and the inner layer CPLs in telogen bulge. SG, sebaceous gland; Bu, bulge; sHG, secondary hair germ. (C) Representative immunofluorescence images of RBP-J in telogen bulge of WT and Krt6-CreER::RBP-J cKO HFs. Tamoxifen was injected on P50-52 at telogen, samples were taken on P58 at telogen. Note the efficient ablation of RBP-J in both layers of cells in the bulge of cKO compared to WT HF. (D) Representative immunofluorescence images of RBP-J in anagen bulge of WT and Krt6-CreER::RBP-J::Ai14 cKO HFs. Note in all RFP+ cells RBP-J is ablated, while matrix is not affected. (E) Schematic diagram of wax induced removal of CPL cells and subsequent telogen to anagen transition. (F) Representative immunofluorescence images of waxed hair shaft. Note the presence of Krt6+ CPL cells, but not the CD34+ HFSCs. (G) Representative immunofluorescence images of HFs before and at 3 days (D3) after wax. Krt6+ CPL cells are completely removed from the HF after wax, but CD34+ HFSCs remain intact. At D3 after wax HFs have entered anagen. (H) Representative immunofluorescence images and quantification of Cleaved-Caspase3 at indicated time points of before and after wax. Catagen follicle is used as positive control for staining. (I) Representative dorsal skin Masson-Fontana staining images and quantification of ectopic pigmentation in the bulge of WT and Krt6-CreER::RBP-J cKO HFs at the telogen to anagen transition stages. Tamoxifen was injected on P50-52 at telogen, then CPL cells were removed by wax on P54 to induce anagen entry. Dorsal skin samples were taken at indicated time points of before (D0) and after (D2/3/4) wax. HFs were counter-stained by neutral red. Brackets indicate the bulge region where McSC ectopic differentiation is quantified. (J) Representative immunofluorescence images and quantification of percentage of HF with Tyrp1+ McSCs. McSC located in the bulge area indicated by brackets were labeled with DCT staining. Melanocyte differentiation marker Tyrp1 in DCT+ McSCs located in the bulge indicates ectopic differentiation. Percentage of HFs with Tyrp1+ McSCs in WT and Krt6-CreER::RBP-J cKO HFs of dorsal skin were quantified. All data are expressed as mean ± SD ≥ 15 follicles are quantified each mouse. N = 3. Scale bars = 10 μm.
Figure 2—figure supplement 1

HF phenotype in Krt6-CreER::RBP-J cKO mice.
(A) Representative fluorescent image and quantification of Krt6-CreER labeling pattern in telogen HFs. (B) FACS profile and quantification of HFSC labeling efficiency using Krt6-CreER::Ai6 mice. HFSCs were gated as CD34+, integrin-α6+ cells. GFP+ cells are gated from HFSCs to calculate labeling efficiency. (C) Schematic diagram of Tamoxifen treatment experiments in Krt6-CreER::RBP-J cKO mice used in Figure 2C. Tamoxifen was injected from P50-52 at telogen and dorsal skin samples were taken on P58 at telogen. (D) Percentage of HFs with RBP-J+ bulge in WT and Krt6-CreER::RBP-J cKO telogen HFs shown in Figure 2C. (E) Representative immunofluorescence images and quantification of McSC number in bulge and melanocyte number in bulb region of WT and Krt6-CreER::RBP-J cKO HFs at anagen. McSCs are labeled as DCT+ cells in the indicated bulge area and melanocytes are labeled as DCT+ cells in the indicated bulb area. Note the equal number of McSCs in the bulge, and the equal number of melanocytes in the bulb region of WT and Krt6-CreER::RBP-J cKO HFs. (F) Representative dorsal skin immunofluorescence images of HF marker Krt17 and HFSC marker CD34 in WT and Krt6-CreER::RBP-J cKO HFs at P115. Note at this time point the WT HF is in telogen with normal CD34 expression in the bulge regions. But the Krt6-CreER::RBP-J cKO HF lost CD34 expression and the HF structure is completely distorted, similar to the phenotype observed in Sox9-CreER::RBP-J cKO mice. (G) Representative dorsal skin Masson-Fontana staining images and quantification of ectopic pigmentation in the bulge of WT and Krt6-CreER::RBP-J cKO HFs at telogen time point indicated in (C). (H) Representative immunofluorescence images and quantification of percentage of HF with Tyrp1+ McSCs. McSC located in the bulge area indicated by brackets were labeled with DCT staining. Melanocyte differentiation marker Tyrp1 in DCT+ McSCs located in the bulge indicates ectopic differentiation. Percentage of HFs with Tyrp1+ McSCs in the bulge of WT and Krt6-CreER::RBP-J cKO HFs at telogen were quantified. (I) Representative images and quantification of ectopic pigmentation of WT and Krt6-CreER::RBP-J cKO HFs at spontaneous anagen entry. (J) Representative immunofluorescence images and quantification of Ki67 in the WT and Krt6-CreER::RBP-J cKO HFs after wax. All data are expressed as mean ± SD ≥20 follicles are quantified each mouse. N = 3. Scale bars = 10 μm.
Figure 3 with 2 supplements
RBP-J functions as a repressor in HFSC and downregulates retinoid metabolic process genes.
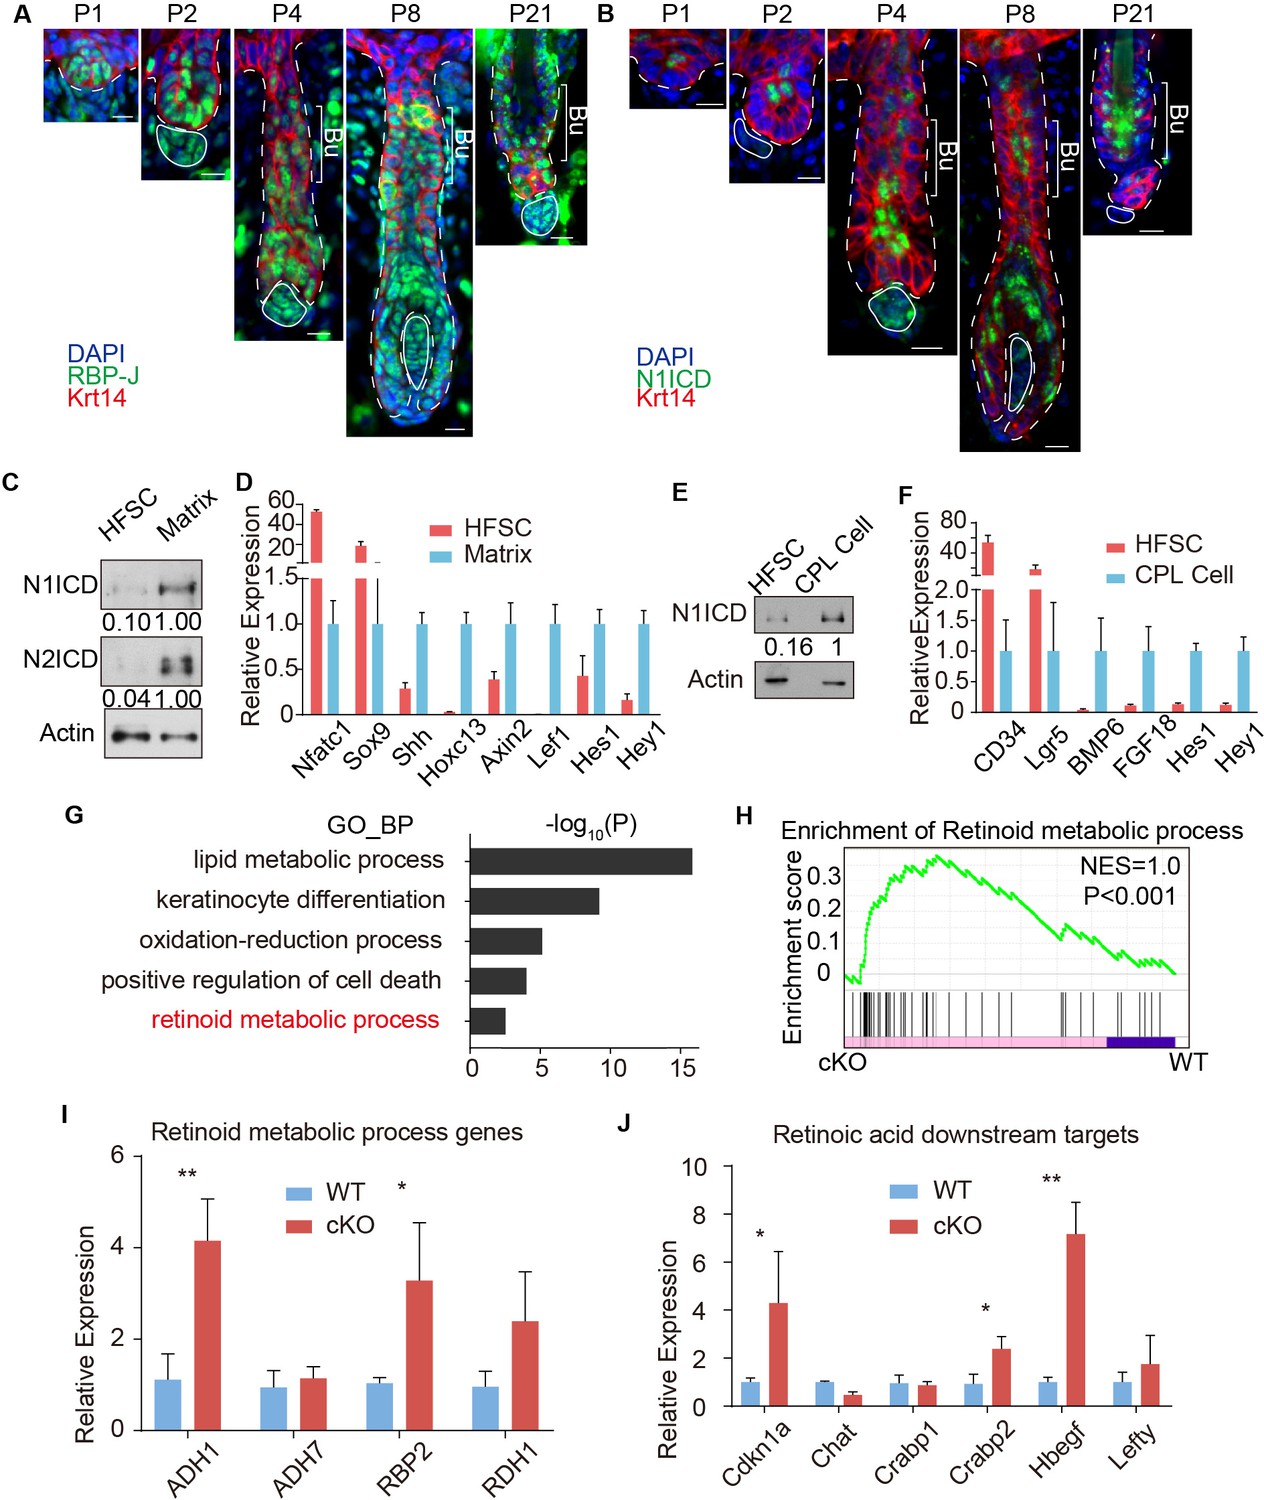
(A) Representative immunofluorescence images of RBP-J demonstrate broad expression pattern in HF epithelial cells at all stages of hair cycle from morphogenesis to adult. Krt14 is a basal epithelial cell marker. (B) Representative immunofluorescence images of Notch1 intracellular domain (N1ICD) show restricted pattern in differentiated cells instead of HFSCs at different hair cycle stages. N1ICD activates canonical Notch signaling. (C) Western blot of N1ICD and N2ICD in FACS isolated HFSCs and differentiated matrix cells from anagen HFs. Expression levels were normalized to Actin. (D) QPCR analysis of active canonical Notch signaling downstream genes Hes1 and Hey1 in FACS isolated HFSC and matrix cells from anagen HFs. HFSC marker genes Nfatc1 and Sox9; matrix cell marker genes Shh, Hoxc13, Axin2 and Lef1 were used to validate the correct cell populations used for analysis. (E) Western blot of N1ICD in FACS isolated HFSCs and CPL cells from telogen bulge. Expression levels were normalized to Actin. (F) QPCR analysis of active canonical Notch signaling downstream genes Hes1 and Hey1 in FACS isolated HFSC and CPL cells from telogen bulge. HFSC marker genes CD34 and Lgr5; CPL cell marker genes BMP6 and FGF18 were used to validate the correct cell populations used for analysis. (G) Gene Ontology analysis of upregulated genes in HFSCs of Krt6-CreER::RBP-J cKO compared to WT. HFSCs were isolated using FACS from dorsal skin at D2 after wax. Retinoid metabolic process category is marked in red. (H) GSEA results showing enrichment of retinoid metabolic process genes in HFSCs of Krt6-CreER::RBP-J cKO compared to WT. (I) QPCR analysis of retinoid metabolic process genes in FACS isolated HFSCs from WT and Krt6-CreER::RBP-J cKO HFs at D2 after wax. (J) QPCR analysis of retinoid downstream targets genes in FACS isolated HFSCs from WT and Krt6-CreER::RBP-J cKO HFs at D2 after wax. All data are expressed as mean ± SD. N ≥ 3. (*) p<0.05; (**) p<0.01. Scale bars = 10 μm.
Figure 3—figure supplement 1
FACS sorting strategy for HFSCs, CPL cells and matrix cells.
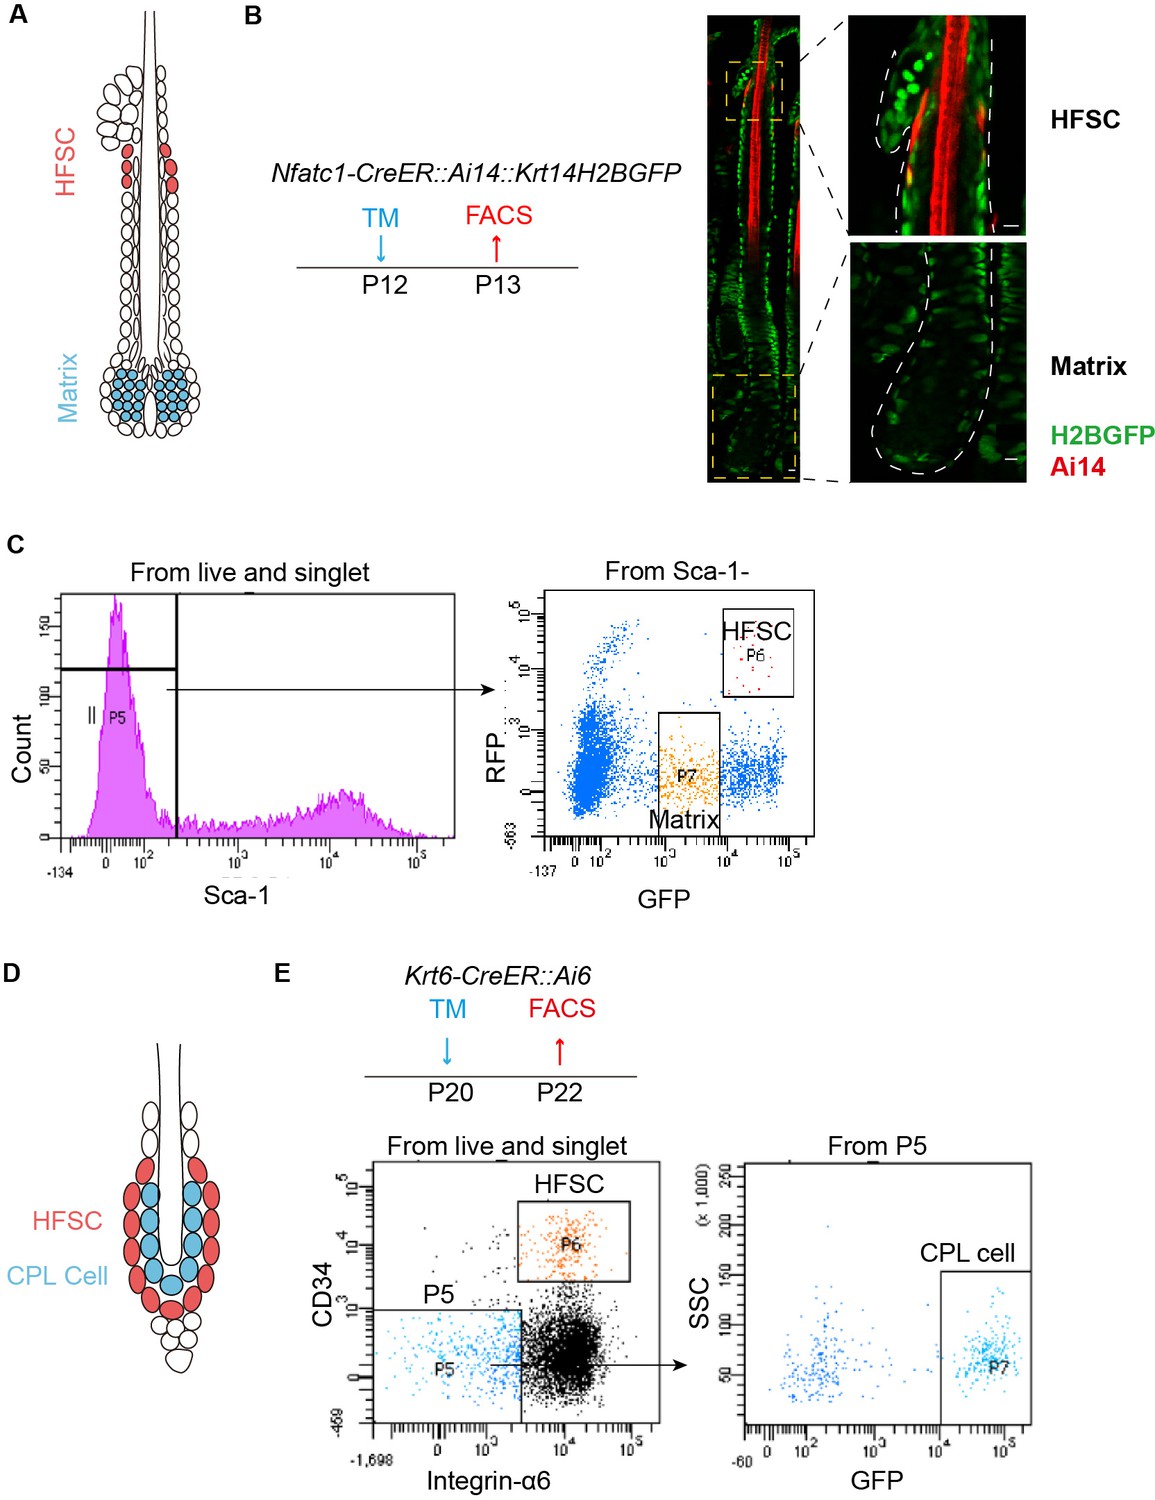
(A) Schematic diagram of P13 anagen HF used for FACS analysis. HFSCs marked in red reside in upper HF just beneath the sebaceous gland. Matrix cells containing terminally differentiated cells marked in blue locate at the bottom of HF. (B) Schematic diagram and representative dorsal skin immunofluorescence images of Nfatc1-CreER::Ai14::Krt14H2BGFP anagen HF. Tamoxifen was injected at P12 to label HFSCs as Ai14+ cells in upper HF of Nfatc1-CreER::Ai14::Krt14H2BGFP mice. GFP+ cells are epithelial cells in skin. GFPlow cells at the bottom of HF are matrix cells due to their frequent cell division that dilutes H2BGFP signals. (C) FACS profiles of HFSCs and matrix cells from anagen HFs in Nfatc1-CreER::Ai14::Krt14H2BGFP mice at indicated time point. After collagenase and trypsin treatment to collect all cells from anagen skin, Sca-1 was used to exclude epidermal cells. HF cells were gated as Sca-1- population, and then further gated for HFSC (RFP+, GFPhigh) and matrix cells (RFP-, GFPlow). (D) Schematic diagram of P22 telogen HF used for FACS analysis. HFSCs are marked in red. CPL cells are marked in blue between HFSCs and hair shaft. (E) Schematic diagram and FACS profiles of HFSCs and CPL cells from telogen HFs. Tamoxifen was injected at P20 to label HFSCs and CPL cells as GFP+ cells in the bulge of Krt6-CreER::Ai6 telogen HFs. Dorsal skin was collected 2 days later for FACS experiments. After trypsin treatment to collect epithelial cells from telogen skin, HFSC were isolated as Integrin-α6+,CD34+ population; CPL cells were isolated as Integrin-α6-, CD34-, GFP+ population. Scale bars = 10 μm.
Figure 3—figure supplement 2

Signal pathways that do not affect McSCs ectopic differentiation triggered by RBP-J loss in HFSCs.
(A) Representative non-specific lipid marker Oil Red O staining in the WT and Krt6-CreER::RBP-J cKO HFs at telogen. Follicles are counter-stained by hematoxylin. Note the normal and restricted red staining signals in sebaceous gland in both WT and Krt6-CreER::RBP-J cKO HFs. (B) Representative dorsal skin immunofluorescence staining images of non-specific lipid marker BODIPY 493/503 in WT and Krt6-CreER::RBP-J cKO HFs at telogen. Note similar signals specifically in sebaceous glands in both WT and Krt6-CreER::RBP-J cKO HFs. (C) Western blot analysis of markers for organelles with membrane structures in FACS isolated HFSCs from WT and Krt6-CreER::RBP-J cKO HFs at telogen. TOM20 is a mitochondria marker. Cathepsin D (CathD) is a lysosome marker. Actin is loading control. (D) Representative dorsal skin immunofluorescence staining images of nuclear envelope marker LaminB1 in the WT and Krt6-CreER::RBP-J cKO HFs at telogen. Note similar signals patterns in both WT and Krt6-CreER::RBP-J cKO HFs. (E) Representative dorsal skin immunofluorescence staining images of Golgi complex marker GM130 in the WT and Krt6-CreER::RBP-J cKO HFs at telogen. Note similar signals patterns in both WT and Krt6-CreER::RBP-J cKO HFs. (F) Representative immunofluorescence images and quantification of DNA double strand break marker γ-H2Ax in the WT and Krt6-CreER::RBP-J cKO HFs at telogen. (G) Representative immunofluorescence images and quantification of apoptosis marker cleaved-caspase3 in the WT and Krt6-CreER::RBP-J cKO HFs at telogen. (H) Western blot analysis of necrosis marker p-MLKL in FACS isolated HFSCs from WT and Krt6-CreER::RBP-J cKO HFs at telogen. (I) Schematic diagram, representative immunofluorescence images and quantification of nuclear β-catenin in DCT+ McSCs in the bulge of WT and Krt6-CreER::RBP-J HFs after treatment with vehicle or Wnt inhibitor LGK974 at indicated time points. Tamoxifen was injected on P50-52 at telogen to induce ablation of RBP-J in Krt6-CreER::RBP-J mice, then CPL cells were removed by wax on P54 to induce anagen entry. Wnt inhibitor LGK974 or vehicle was administered from P54 to P57 spanning the telogen to anagen transition stage. Dorsal skin samples were taken at P58 for analysis. Note the decrease of nuclear β-catenin in DCT+ McSCs, and the inhibition of anagen entry after Wnt inhibitor LGK974 treatment, indicating the efficient block of Wnt signaling. (J) Representative dorsal skin Masson-Fontana staining images and quantification of ectopic pigmentation in the bulge of WT and Krt6-CreER::RBP-J HFs after treatment with vehicle or Wnt inhibitor LGK974 at indicated time point in (I). Note the persistent ectopic pigmentation in the bulge of cKO HFs even after efficient block of Wnt signaling as demonstrated in (I). (K) Quantification of DCT+ McSCs in the bulge of WT and Krt6-CreER::RBP-J HFs after treatment with Wnt inhibitor LGK974 at indicated time point in (I). N = 3. For each mouse >= 20 follicles are quantified. Box whiskers are min to max. Other data are mean ± SD. (*) p<0.05. (**) p<0.01. Scale bars = 10 μm.
Figure 4

Chromatin accessibility change after loss of RBP-J in HFSCs.
(A) ATAC-seq signal comparison between FACS isolated HFSCs from WT and Krt6-CreER::RBP-J cKO HFs at D2 after wax. Each dot represents an ATAC-seq peak. Regions with more accessibility in cKO than in WT cells (red) vs. more accessibility in WT than in cKO cells (blue) are indicated. (B) Pie chart showing the classification of ATAC-seq peaks from (A) compared with the mouse genome (mm10). (C) Log2-fold enrichment of the genomic classes shown in (B) relative to the whole genome. (D) ATAC-seq track signals at four representative loci (Adh1, Krt10, Hes1 and CD34). RBP-J putative binding motifs are highlighted by pink (strong) and green (weak) boxes. (E) Statistic analysis of normalized ATAC-seq reads from 3.5 kb upstream to 3.5 kb downstream of indicated genes between WT and cKO. Data are showed in box-whisker from min to max. (*) p<0.05; (**) p<0.01. (F) In vitro luciferase assay for Adh1 promoter activity with or without RBP-J or N1ICD using cultured mouse keratinocytes. N = 3 and data are mean ± SD. (*) p<0.05.
Figure 5 with 1 supplement
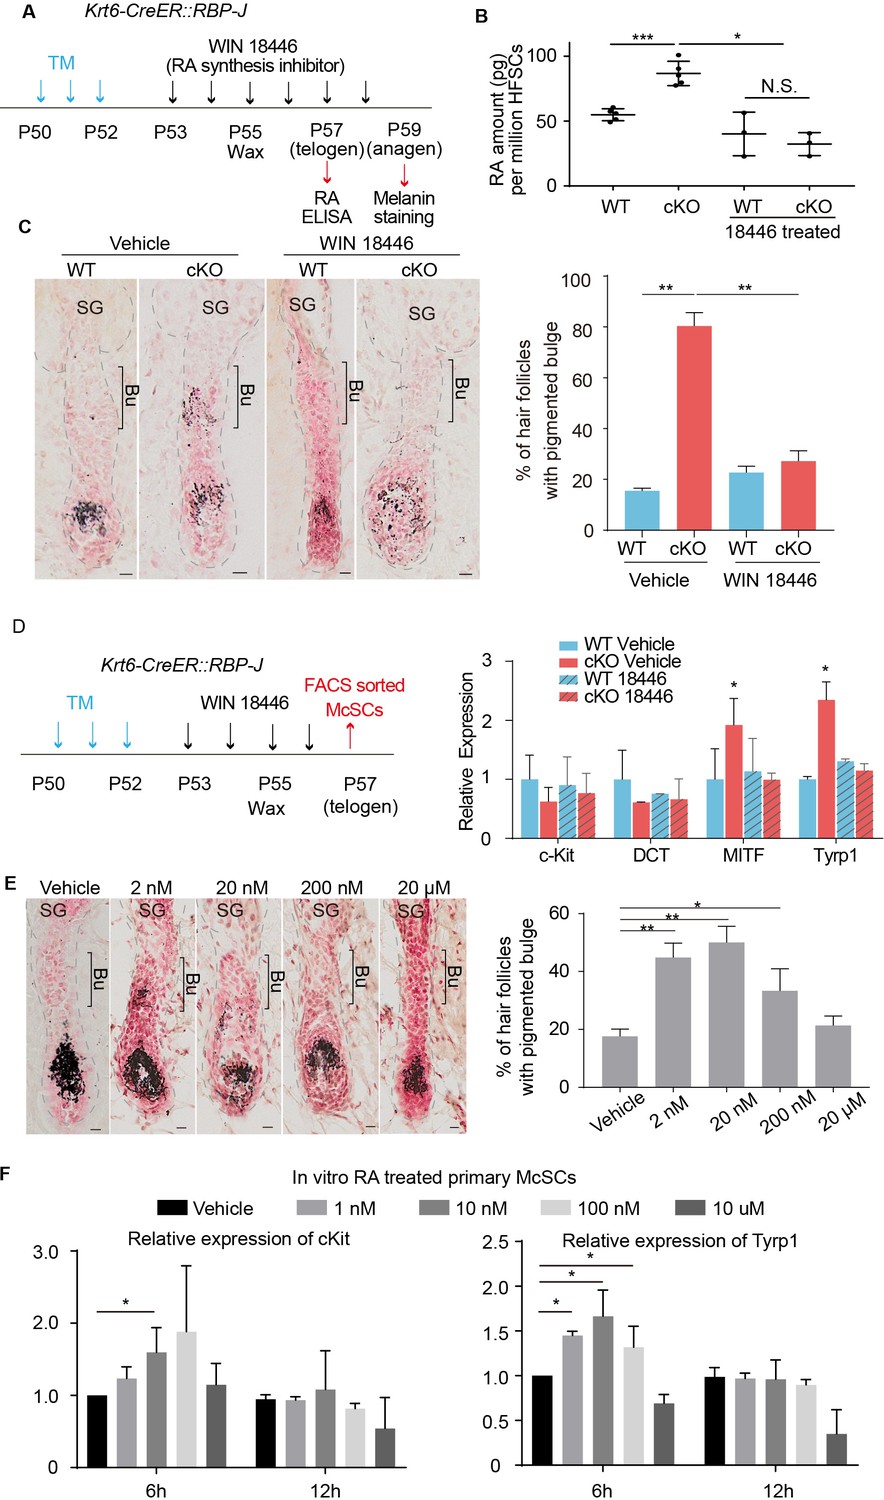
Increased RA from RBP-J null HFSCs causes McSCs to differentiate abnormally in the niche.
(A) Schematic diagram of retinoic acid synthesis inhibitor treatment experiment. Tamoxifen was injected on P50-52 at telogen to induce ablation of RBP-J in Krt6-CreER::RBP-J mice, then CPL cells were removed by wax on P55 to induce anagen entry. Retinoic acid synthesis inhibitor WIN18446 or vehicle was administered from P53 to P58 spanning the telogen to anagen transition stage. HFSCs were harvested at P57 telogen for RA ELISA detection and dorsal skin samples were taken at P59 for analysis. (B) ELISA assay to measure the level of retinoic acid in FACS isolated HFSCs from WT and Krt6-CreER::RBP-J cKO dorsal skin after different treatments. (C) Representative dorsal skin Masson-Fontana staining images and quantification of ectopic pigmentation in the bulge of WT and Krt6-CreER::RBP-J cKO HFs after different treatments as indicated in (A). (D) Schematic diagram and qPCR analysis of melanocyte lineage or differentiation related genes in FACS isolated McSCs from WT and Krt6-CreER::RBP-J cKO HFs after indicated treatments. (E) Representative dorsal skin Masson-Fontana staining images and quantification of ectopic pigmentation in the bulge of WT HFs after topical treatment with indicated amount of RA treatment. CPL cells were removed by wax on P55 to induce anagen entry. Retinoic acid was administered from P53 to P58 spanning the telogen to anagen transition stage in WT mice. Dorsal skin samples were taken at P59 for analysis. (F) QPCR analysis of c-Kit and Tyrp1 expression level on cultured primary McSCs isolated from telogen HFs after treatment of RA with indicated dosage and time. All data are expressed as mean ± SD >= 15 follicles are quantified each mouse. N >= 3. (*) p<0.05; (**) p<0.01; (***) p<0.001. Scale bars = 10 μm.
Figure 5—figure supplement 1
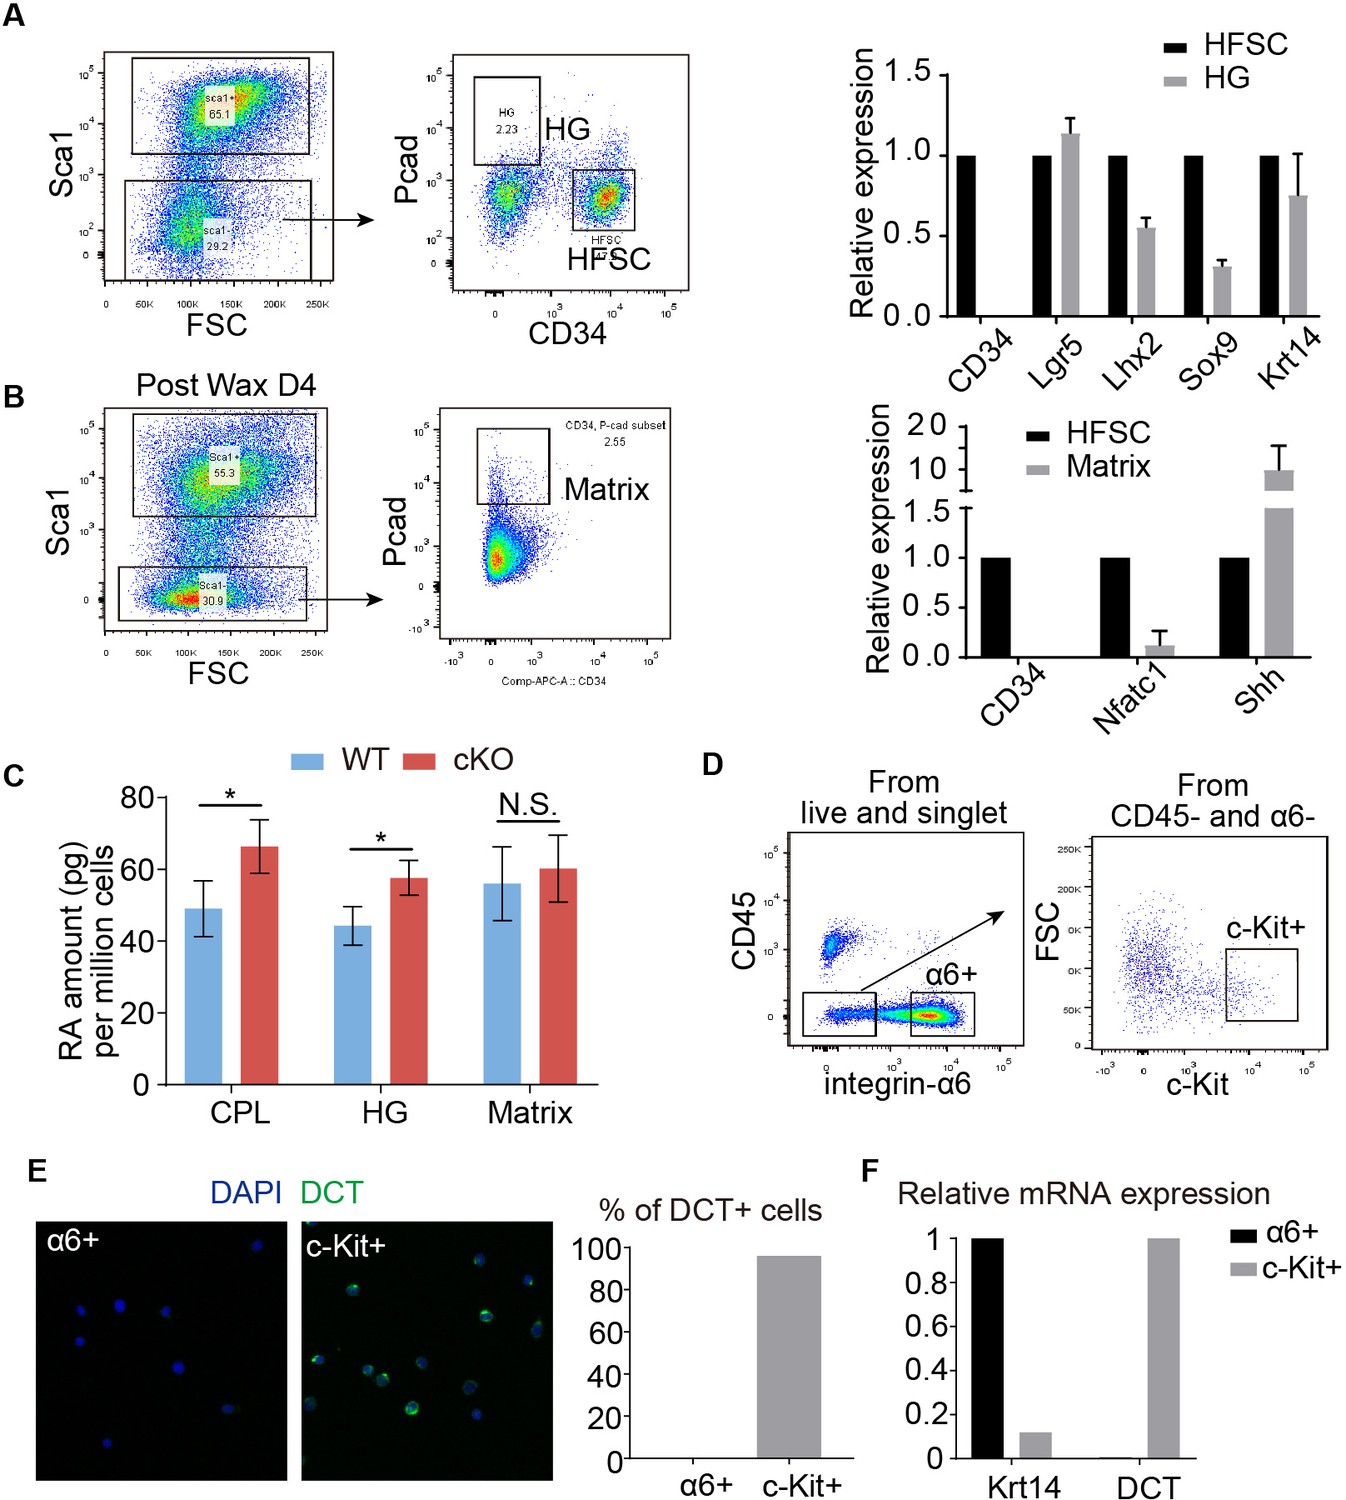
FACS sorting strategy, validation and quantification of McSCs and other cell types.
(A) FACS profile of HG cells and qPCR validation of marker genes. Sca1 was used to exclude epidermis. CD34 was used to exclude HFSC and HG cells were gated as Sca1-, CD34-, Pcadhigh. (B) FACS profile of Matrix cells and qPCR validation of marker genes. Sca1 was used to exclude epidermis and cells were gated as Sca1-, Pcadhigh. (C) ELISA detection of RA in different cell populations in WT and Krt6-CreER::RBP-J HFs. (D) FACS profiles of McSCs from telogen HFs. After trypsin treatment to collect all cells in hair follicles from telogen dorsal skin, McSCs were gated as CD45-, integrin α6-, c-Kit+ population. CD45 was used to exclude immune cells, integrin α6- was used to exclude epithelial cells. (E) Cytospin staining images and quantification of melanocyte marker DCT in FACS isolated populations. Note close to 100% of sorted CD45-, integrin α6-, c-Kit+ cells are DCT+, but none of integrin α6+ epithelial cells are DCT+. (F) QPCR analysis of epithelial cell marker Krt14 and melanocyte marker DCT in FACS isolated cells. Data are expressed as mean ± SD ≥ 20 follicles are quantified each mouse. N = 3. (*) p<0.05.
Figure 6 with 1 supplement

RA from cKO HFSCs enhances c-Kit protein level on McSCs that leads to abnormal differentiation.
(A) Schematic diagram, FACS profiles and quantification of c-Kit+ McSCs in telogen HFs from WT and Krt6-CreER::RBP-J cKO mice after indicated treatments. Tamoxifen was injected on P50-52 at telogen to induce ablation of RBP-J in Krt6-CreER::RBP-J mice, then CPL cells were removed by wax on P55 to induce anagen entry. Retinoic acid synthesis inhibitor WIN18446 or vehicle was administered from P53 to P56. Dorsal skin samples were taken at P57 at telogen for analysis. c-Kithigh population was further gated from c-Kit+ population and quantified by c-Kithigh/c-Kit+ percentage. (B) Representative immunofluorescence images and quantification of c-Kit RFI (Relative Fluorescence Intensity) after indicated topical RA treatments on C57 WT mice. (C) Western blot and quantification of GFP or UTR-GFP protein level with or without RARα and RA. (D) QPCR analysis of Tyrp1 mRNA level in cultured primary melanocytes with or without overexpression of c-Kit. All data are expressed as mean ± SD ≥ 15 follicles are quantified each mouse. N = 3. (*) p<0.05; (**) p<0.01; (***) p<0.001.
Figure 6—figure supplement 1
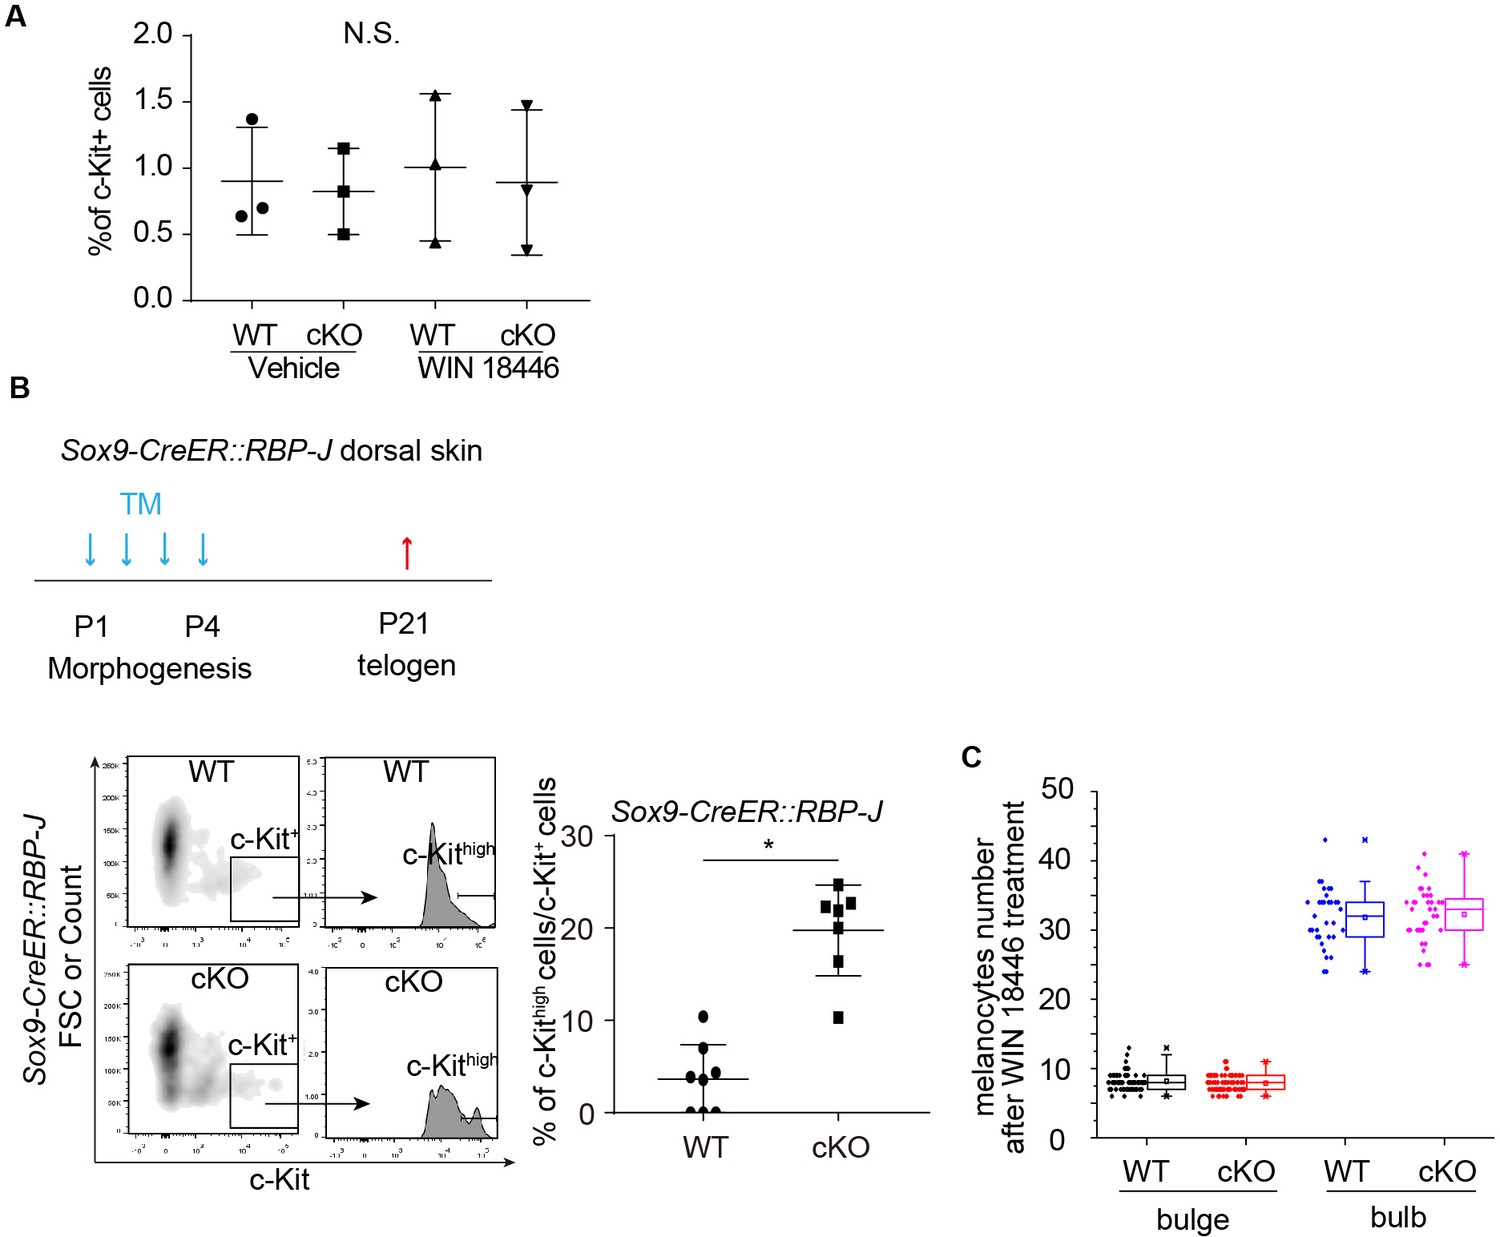
Quantification of c-Kit level on McSCs and numbers of melanocytes.
(A) Percentage of c-Kit+ cells quantified by FACS under indicated treatments in WT and Sox9-CreER::RBP-J skin. (B) Schematic diagram, FACS profiles and quantification of c-Kithigh/c-Kit+ McSCs in telogen HFs of WT and Sox9-CreER::RBP-J mice. Tamoxifen was injected on P1-4 at morphogenesis anagen to induce ablation of RBP-J in Sox9-CreER::RBP-J mice. Telogen dorsal skin HF cells were collected at collected at P21 for FACS analysis. c-Kithigh population was further gated from c-Kit+ population and quantified by c-Kithigh/c-Kit+ percentage. (C) Quantification of McSC number in bulge and melanocyte number in bulb region of WT and Krt6-CreER::RBP-J cKO HFs at anagen after retinoic acid synthesis inhibitor WIN18446 treatment. McSCs are labeled as DCT+ cells in the indicated bulge area and melanocytes are labeled as DCT+ cells in the indicated bulb area. Note the equal number of McSCs in the bulge, and the equal number of melanocytes in the bulb region of WT and Krt6-CreER::RBP-J cKO HFs after treatment. Data are expressed as mean ± SD ≥ 20 follicles are quantified each mouse. N = 3. (*) p<0.05.
Figure 7 with 1 supplement
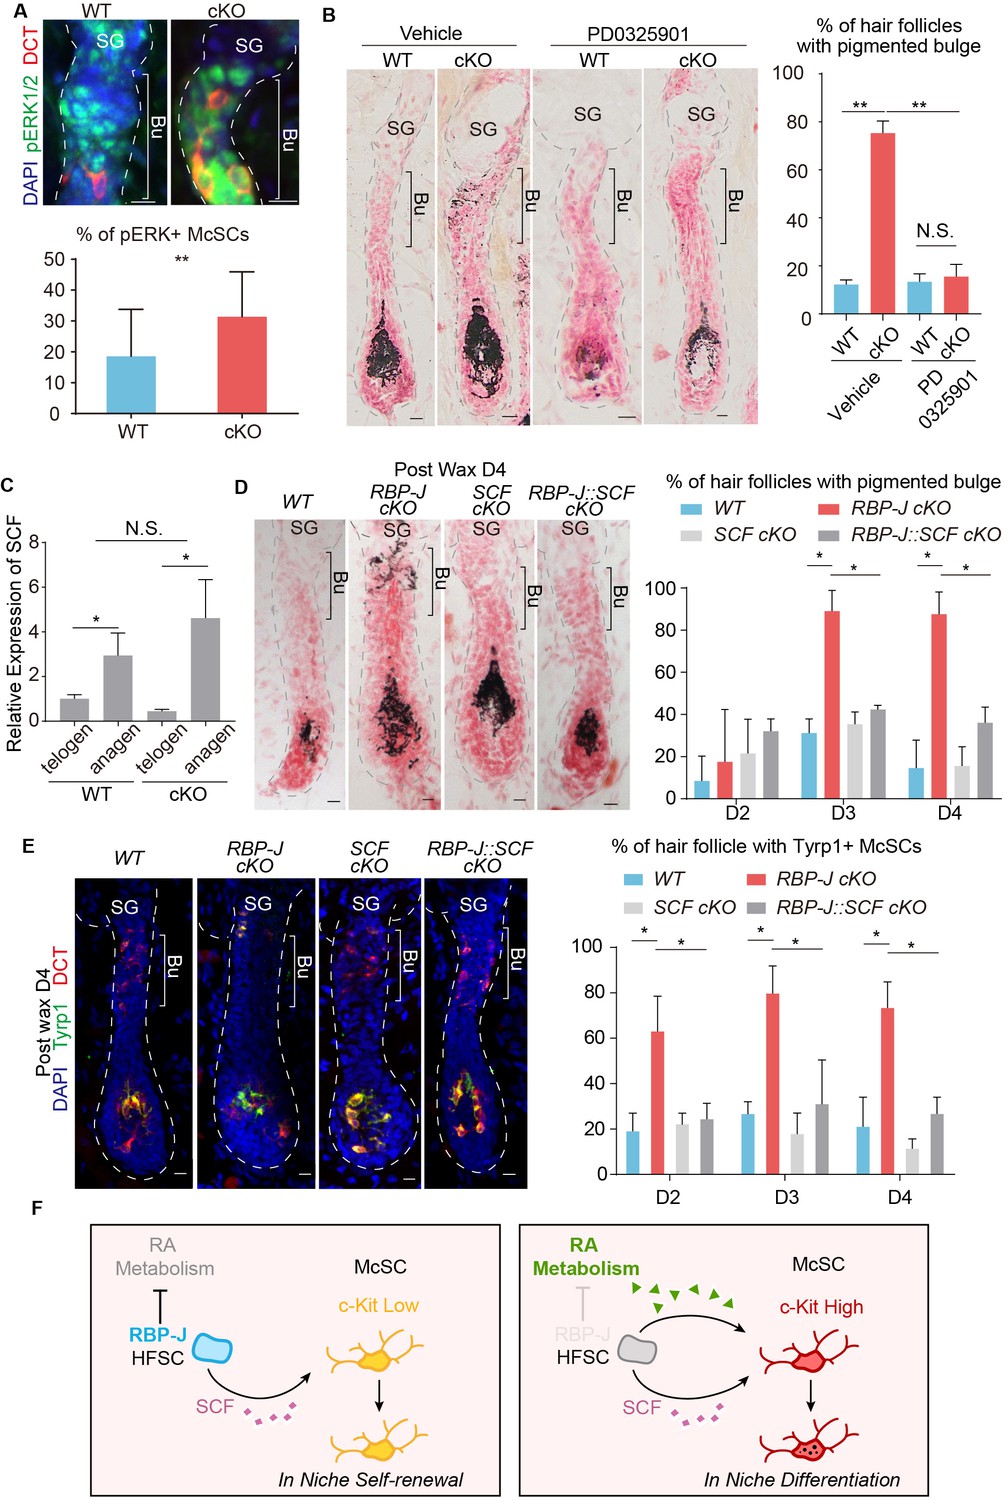
Hair cycle dependent increase of HFSC secreted SCF induces aberrant differentiation of RA sensitized McSC in the shared niche.
(A) Representative immunofluorescence images and quantification of pERK+ McSCs in WT and Krt6-CreER::RBP-J cKO HFs. (B) Representative dorsal skin Masson-Fontana staining images and quantification of ectopic pigmentation in the bulge of WT and Krt6-CreER::RBP-J cKO HFs after treatment with vehicle or MEK inhibitor PD0325901. (C) QPCR analysis of SCF mRNA in FACS isolated HFSCs from WT and Krt6-CreER::RBP-J cKO dorsal skin at both telogen and anagen. (D) Representative dorsal skin Masson-Fontana staining images and quantification of ectopic pigmentation in the bulge of WT, Krt6-CreER::RBP-J, Krt6-CreER::SCF and Krt6-CreER::RBP-J::SCF cKO HFs at the telogen to anagen transition stage. Tamoxifen was injected on P50-52 at telogen, then CPL cells were removed by wax on P54 to induce anagen entry. Dorsal skin samples were taken at D4 after wax. HFs were counter-stained by neutral red. Brackets indicate the bulge region where McSC ectopic differentiation is observed. (E) Representative immunofluorescence images and quantification of percentage of HF with Tyrp1+ McSCs. McSC located in the bulge area indicated by brackets were labeled with DCT staining. Melanocyte differentiation marker Tyrp1 in DCT+ McSCs located in the bulge indicates ectopic differentiation. Percentage of HFs with Tyrp1+ McSCs in WT, Krt6-CreER::RBP-J, Krt6-CreER::SCF and Krt6-CreER::RBP-J::SCF cKO HFs in dorsal skin were quantified. (F) Schematic diagram of HFSC expressed RBP-J regulates retinoic acid metabolic process to maintain the differentiation refractory niche for neighboring McSC. During telogen to anagen transition the SCF ligand emanating from HFSCs increases, but co-occupant McSCs in the shared niche do not respond to the differentiation signal due to their low c-Kit protein level. In the absence of RBP-J in HFSCs, retinoic acid is increased after de-repression of retinoid metabolic process genes such as Adh1. Increased retinoic acid from HFSCs enhances c-Kit protein level in McSC and sensitizes them to the increased SCF level in bulge at the telogen to anagen transition stage. This results in defect in McSC self-renewal and ectopic differentiation in the niche. All data are expressed as mean ± SD ≥ 15 follicles are quantified each mouse. N = 3. (*) p<0.05; (**) p<0.01.
Figure 7—figure supplement 1
Effect of Rapamycin or RA treatments on McSCs.
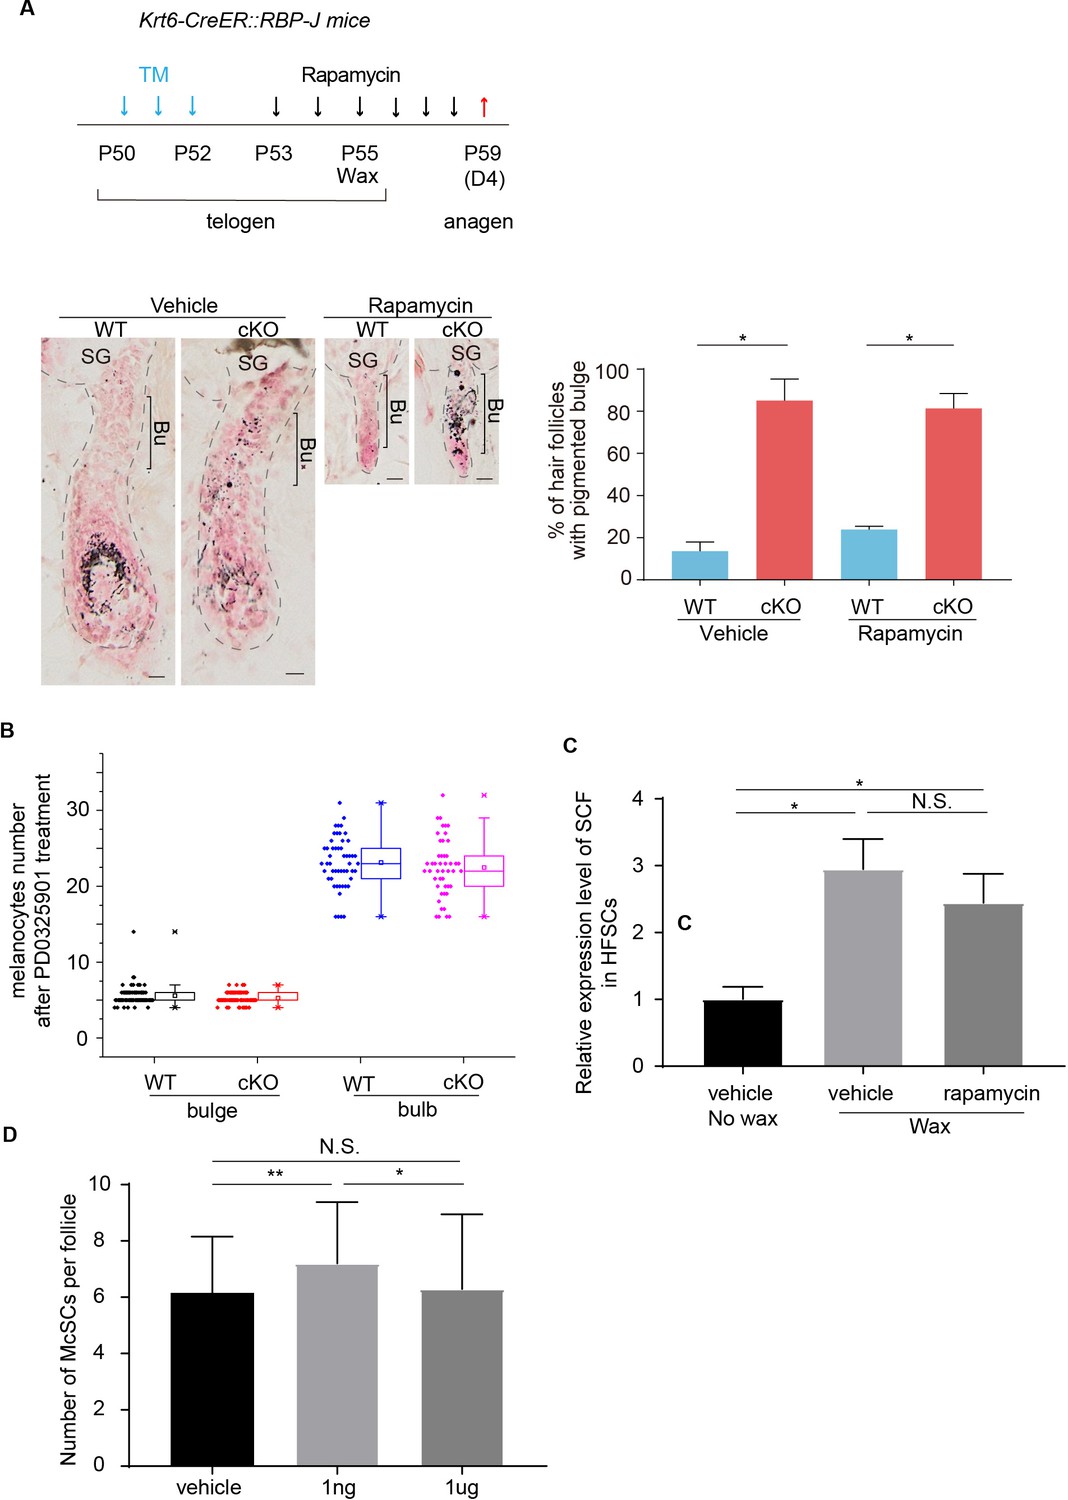
(A) Schematic diagram, representative dorsal skin Masson-Fontana staining images and quantification of ectopic pigmentation in the bulge of WT and Krt6-CreER::RBP-J HFs after treatment with vehicle or mTOR inhibitor rapamycin at indicated time point. Tamoxifen was injected on P50-52 at telogen. At P55 CPL cells were removed by wax to induce anagen entry. mTOR inhibitor rapamycin or vehicle was administered from P53 to P58 spanning the telogen to anagen transition stage. Dorsal skin samples were taken at P59 for analysis. Even though anagen entry was efficiently blocked by rapamycin treatment, the ectopic pigmentation phenotype still persisted in the cKO HFs. (B) Quantification of McSC number in bulge and melanocyte number in bulb region of WT and Krt6-CreER::RBP-J cKO HFs at anagen after MEK inhibitor PD0325901 treatment. McSCs are labeled as DCT+ cells in the indicated bulge area and melanocytes are labeled as DCT+ cells in the indicated bulb area. Note the equal number of McSCs in the bulge, and the equal number of melanocytes in the bulb region of WT and Krt6-CreER::RBP-J cKO HFs after treatment. (C) QPCR analysis of SCF mRNA in FACS isolated HFSCs from mTOR inhibitor rapamycin dorsal skin with or without wax. (D) Quantification of McSC number of indicated RA treatments. Data are expressed as mean ± SD ≥ 15 follicles are quantified each mouse. N = 3. (*) p<0.05. (**) p<0.01. Scale bars = 10 μm.
Additional files
-
Supplementary file 1
Genes Up-regulated in RBP-J cKO versus WT dorsal HFSCs.
RNA-seq analysis of WT and cKO HFSCs isolated from Krt6-CreER::RBP-J mice at D2 after wax to profile their transcriptome difference. Since RBP-J serves as a repressor in HFSCs, genes regulated >1.5 fold (p<0.05) in cKO compared to WT HFSCs were mainly focused.
- https://cdn.elifesciences.org/articles/52712/elife-52712-supp1-v2.xlsx
-
Supplementary file 2
Primer sequences used.
- https://cdn.elifesciences.org/articles/52712/elife-52712-supp2-v2.xlsx
-
Transparent reporting form
- https://cdn.elifesciences.org/articles/52712/elife-52712-transrepform-v2.pdf
Download links
A two-part list of links to download the article, or parts of the article, in various formats.
Downloads (link to download the article as PDF)
Open citations (links to open the citations from this article in various online reference manager services)
Cite this article (links to download the citations from this article in formats compatible with various reference manager tools)
Hair follicle stem cells regulate retinoid metabolism to maintain the self-renewal niche for melanocyte stem cells
eLife 9:e52712.
https://doi.org/10.7554/eLife.52712


