The inner junction complex of the cilia is an interaction hub that involves tubulin post-translational modifications
- McGill University, Canada
- Kyoto University, Japan
Figures
Figure 1 with 1 supplement
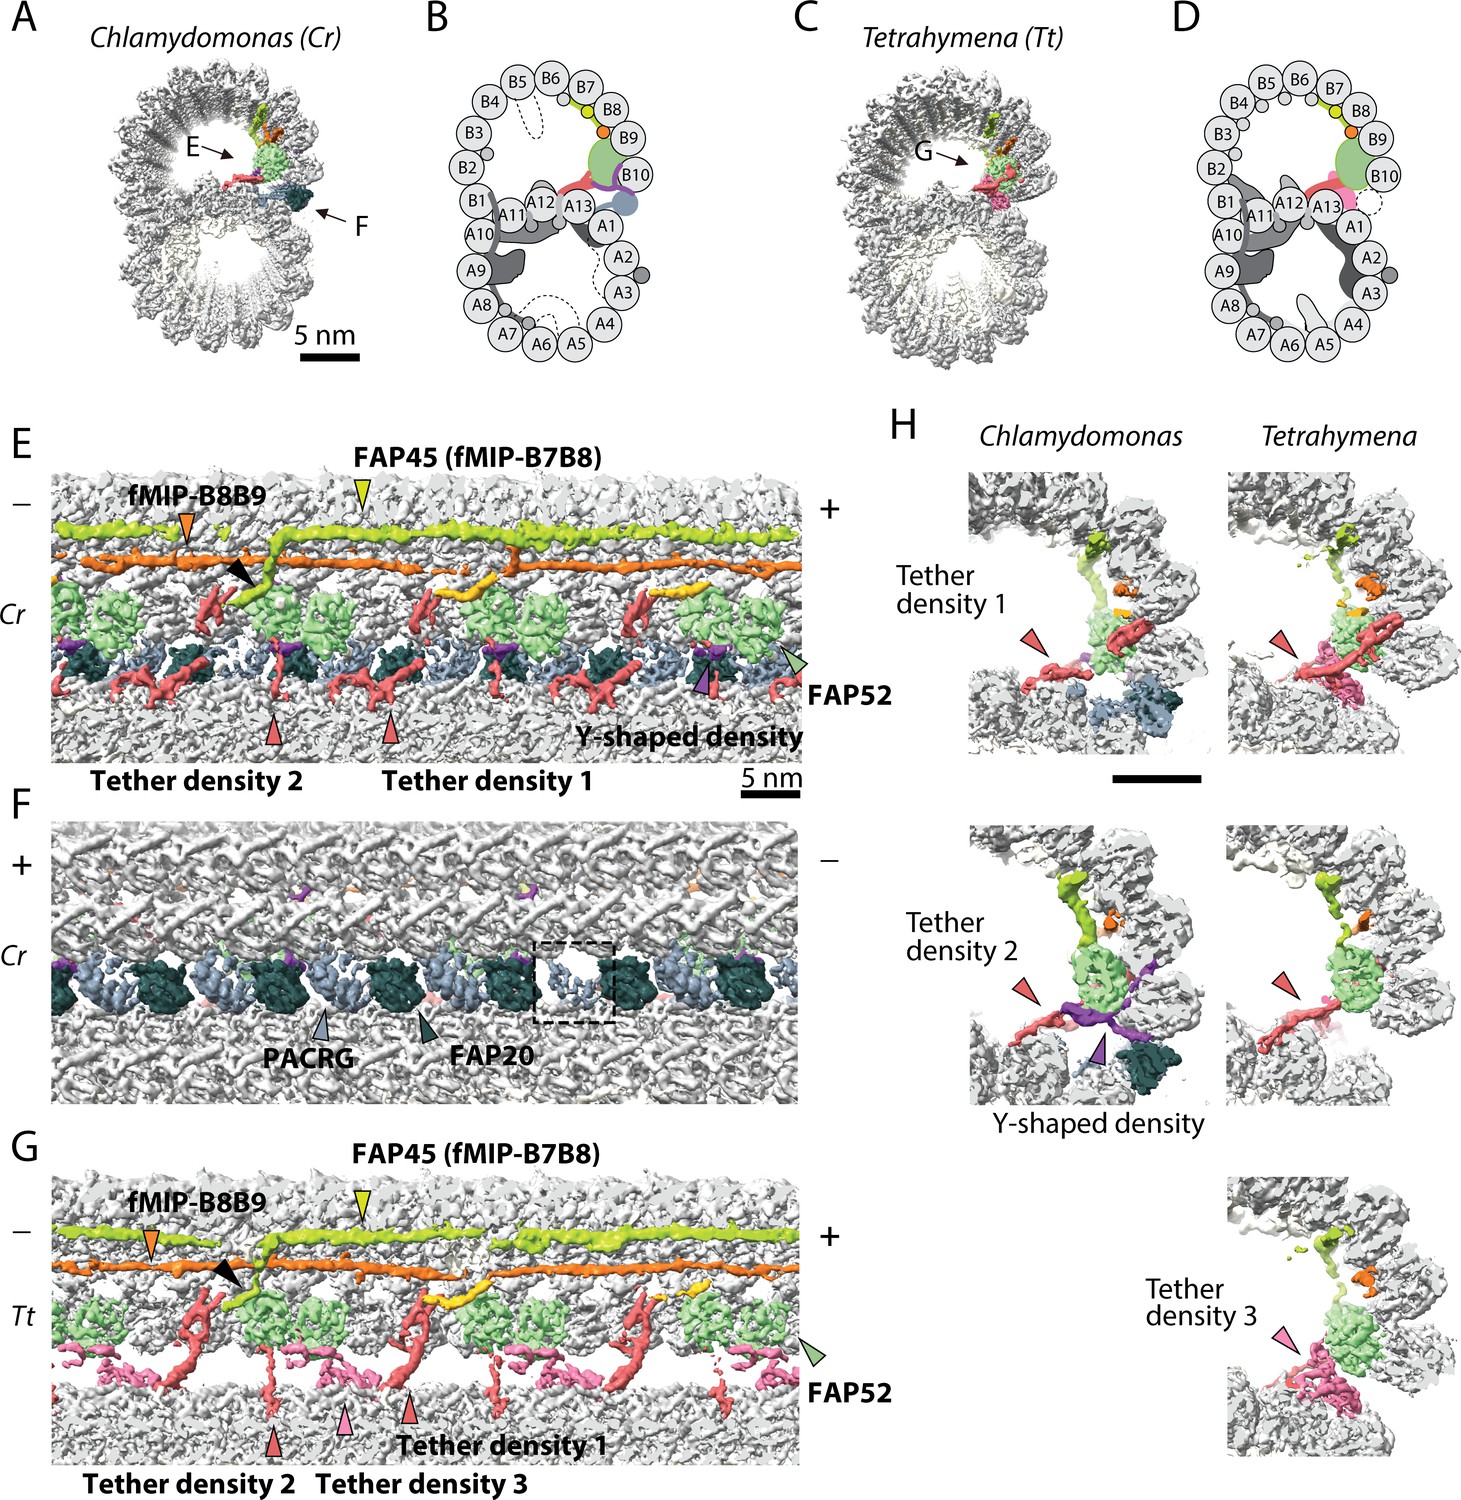
The IJ structures of Chlamydomonas and Tetrahymena doublet.
(A–D) Surface renderings and schematics of the 48 nm repeat cryo-EM maps of Chlamydomonas (A, B) and Tetrahymena (C, D) doublets viewed from the tip of the cilia. Black arrow indicates longitudinal view in (E), (F) and (G). (E–F) The longitudinal section of the Chlamydomonas doublet at the IJ complex from the inside (E) and outside (F). (G) The longitudinal section of Tetrahymena doublet viewed from the inside. Color scheme: FAP20: dark green; PACRG: gray; FAP52: light green, Y-shaped density: purple; FAP45: yellow green; fMIP-B8B9: orange; Tubulin: light gray; Unknown density: yellow; Rest of MIPs: white; Tether density 1 and 2: red; Tether density 3, pink. Plus and minus ends are indicated by + and - signs. (H) Cross sectional views of the different Tether densities from Chlamydomonas (left) and Tetrahymena (right). In Chlamydomonas, there is a Y-shaped density (purple) that cradles the FAP52 density. The Y-shaped density is absent in Tetrahymena. In Tetrahymena, we observed Tether density 3, which is absent in Chlamydomonas.
Figure 1—figure supplement 1
Data related to the doublet structures.
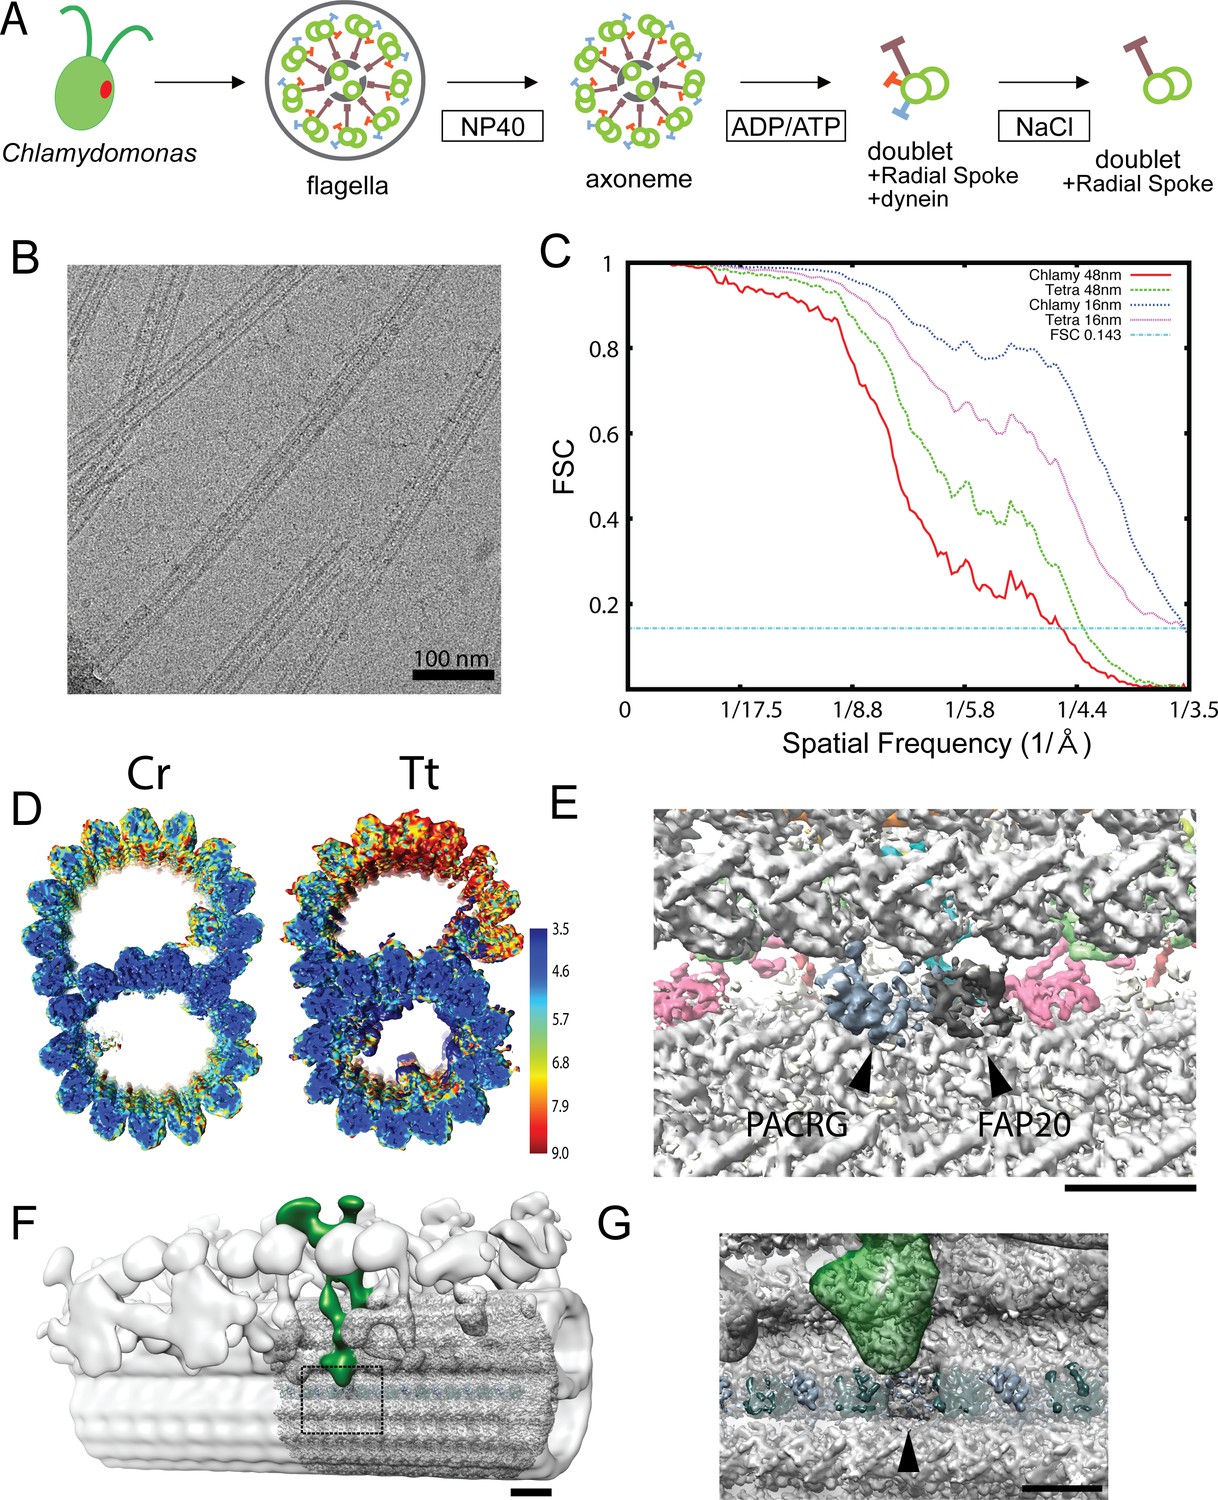
(A) Schematics of fractionation of the axoneme in this study. Doublets were split from axoneme, and outside proteins were removed to obtain a simpler sample for cryo-EM. (B) A typical cryo-EM image of Chlamydomonas doublets. (C) Gold-standard Fourier Shell Correlation of the 48 nm repeat and 16 nm repeat doublet maps of Chlamydomonas and Tetrahymena. (D) Local resolution estimation of the 16 nm repeat maps from Chlamydomonas and Tetrahymena using MonoRes. The resolution of the B-tubule in Tetrahymena is lower due to the loss of the IJ PF. (E) The remaining PACRG- and FAP20-like densities in the Tetrahymena doublet structure. (F) Superimposition of the tomographic structure of the intact doublet (EMD-2132) with the 48 nm structure of the Chlamydomonas doublet in this study. The DRC is colored green. (G) Enlarged view of the missing PACRG unit at the IJ PF, where the DRC binds. Bars in E and H denote a length of 5 nm.
Figure 2 with 1 supplement
16 nm structure of Chlamydomonas doublet.
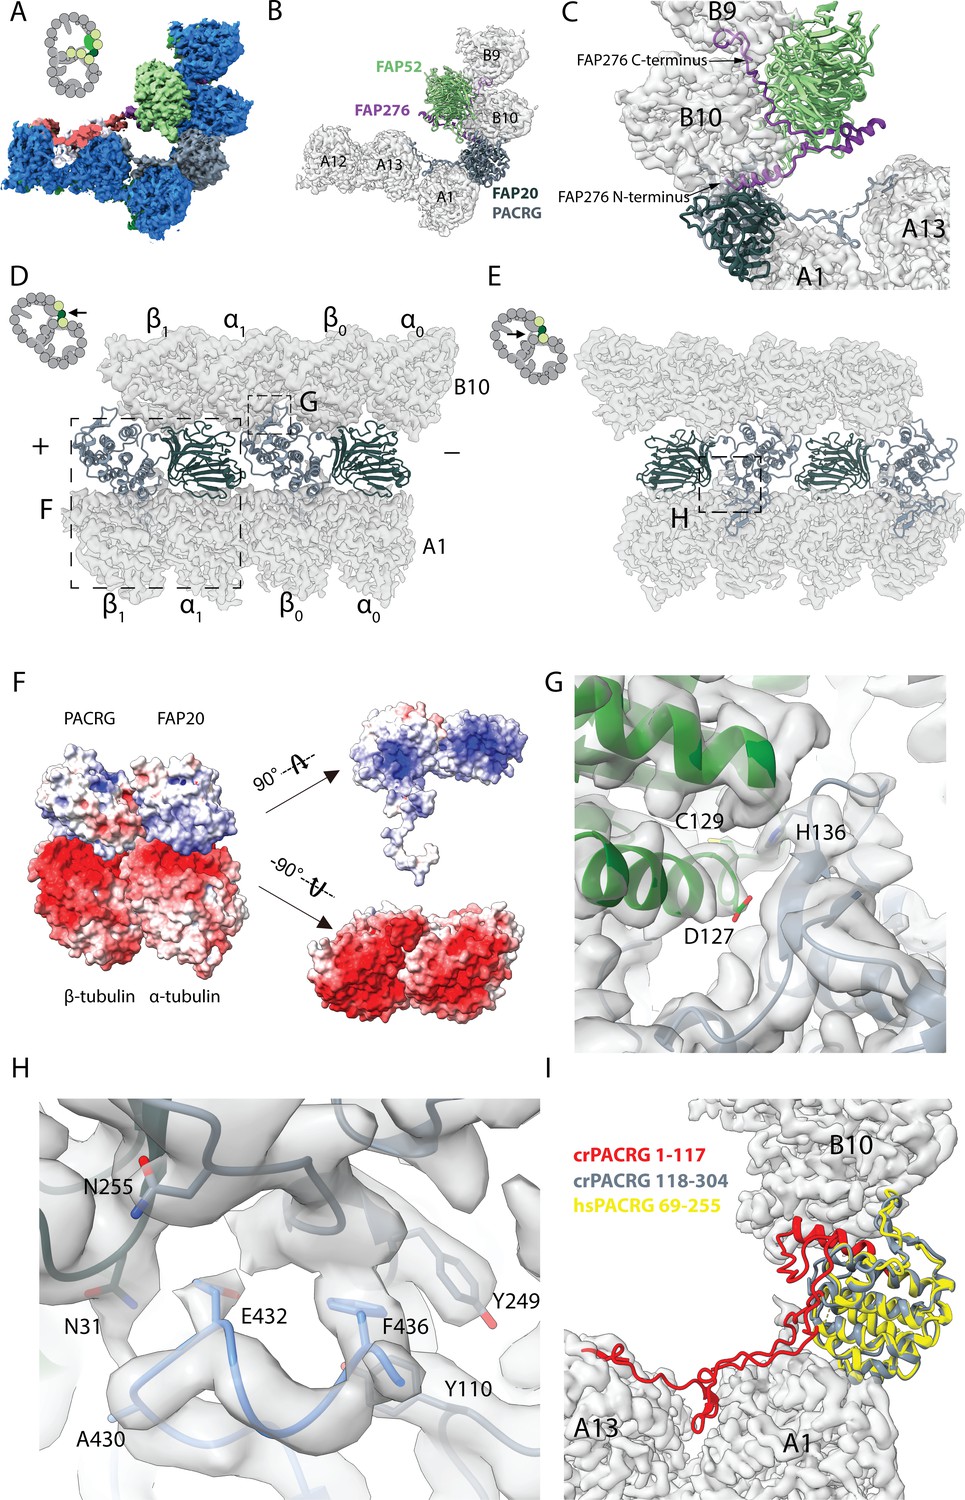
(A, B) 16 nm repeat structure of Chlamydomonas doublet and model at the IJ region. Tubulin densities are depicted as transparent gray, except in A in which tubulins are shown in dark blue. (C) Atomic model of the IJ complex, consisting of PACRG, FAP20, FAP52 and FAP276. Color scheme: FAP20: dark green; PACRG: gray; FAP52: light green, FAP276: purple; tubulin: transparent gray density. (D, E) Maps and models of PF A1 and B10, and IJ PF illustrating how the IJ PF interacts with tubulins. The views are indicated in the schematics. Dashed boxes indicate the views in (F), (G) and (H). Color scheme: α-tubulin: green; β-tubulin: blue; PACRG: gray; FAP20: dark green; FAP276: purple. (F) Electrostatic surface charge of PACRG, FAP20 and α- and β-tubulins of PF A1. Tubulin surface is negatively charged while the interacting interface of PACRG and FAP20 are positively charged. (G) The interaction of the PACRG with the inter-dimer interface of tubulins from PF B10 is shown. H136 from PACRG is conserved and is likely to take part in the interaction with D127 and C129 from α-tubulin of PF B10. (H) The C-terminus of β-tubulin of PF A1 interacts with PACRG and FAP20. Potential residues involved in the interaction of C-tail of β-tubulin and PACRG and FAP20 are shown. (I) Chlamydomonas PACRG has a long N-terminus 1–117. The N-terminus of Chlamydomonas PACRG (red) forms a stable triple helix arrangement with the core of the protein. This is not observed in the human PACRG (PDB: 6NDU) shown in yellow. In addition, the N-terminus of PACRG going into the wedge between PF A13 and A1.
Figure 2—figure supplement 1
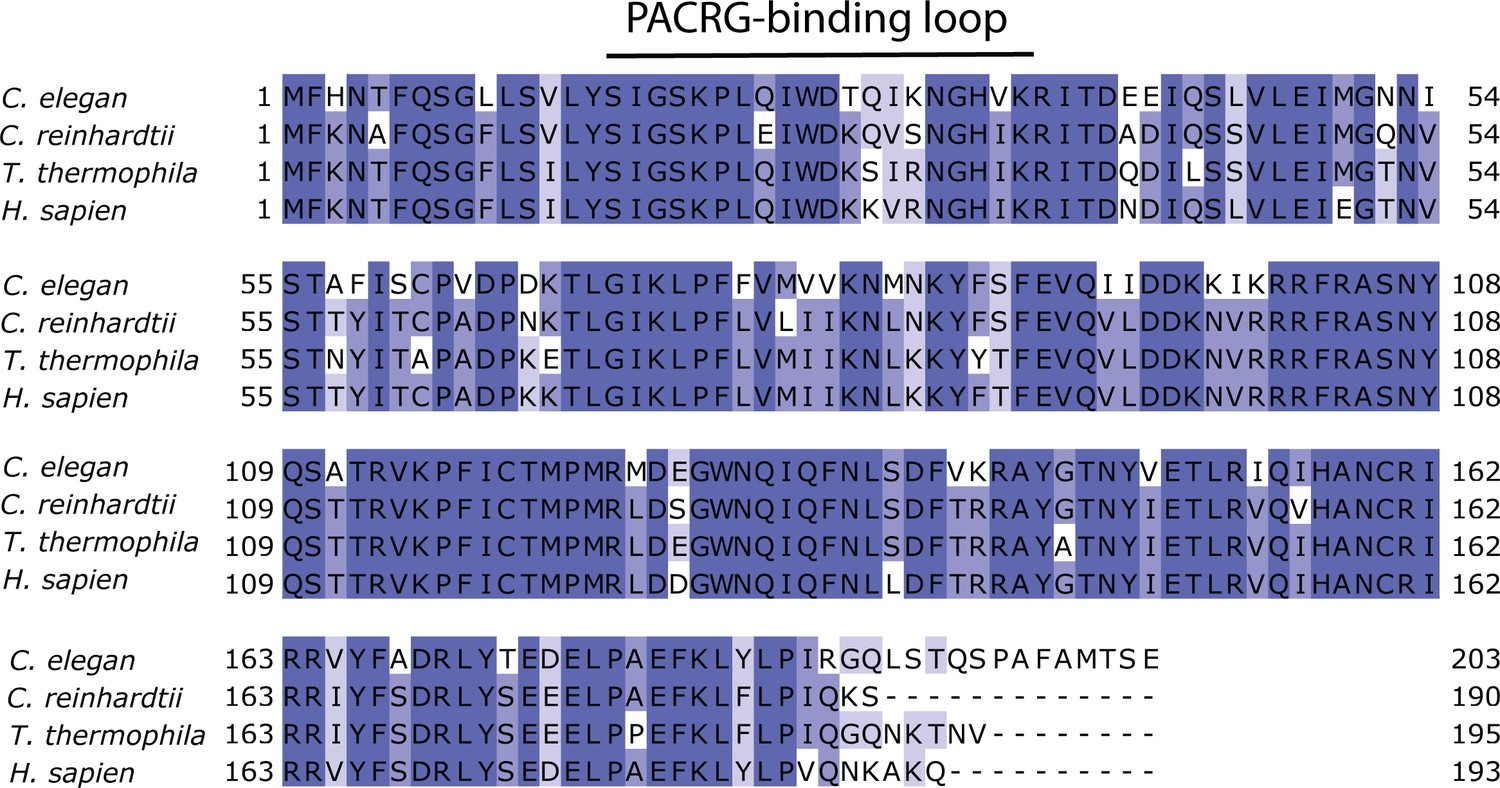
Atomic models of PACRG, FAP20, FAP52 and FAP276.
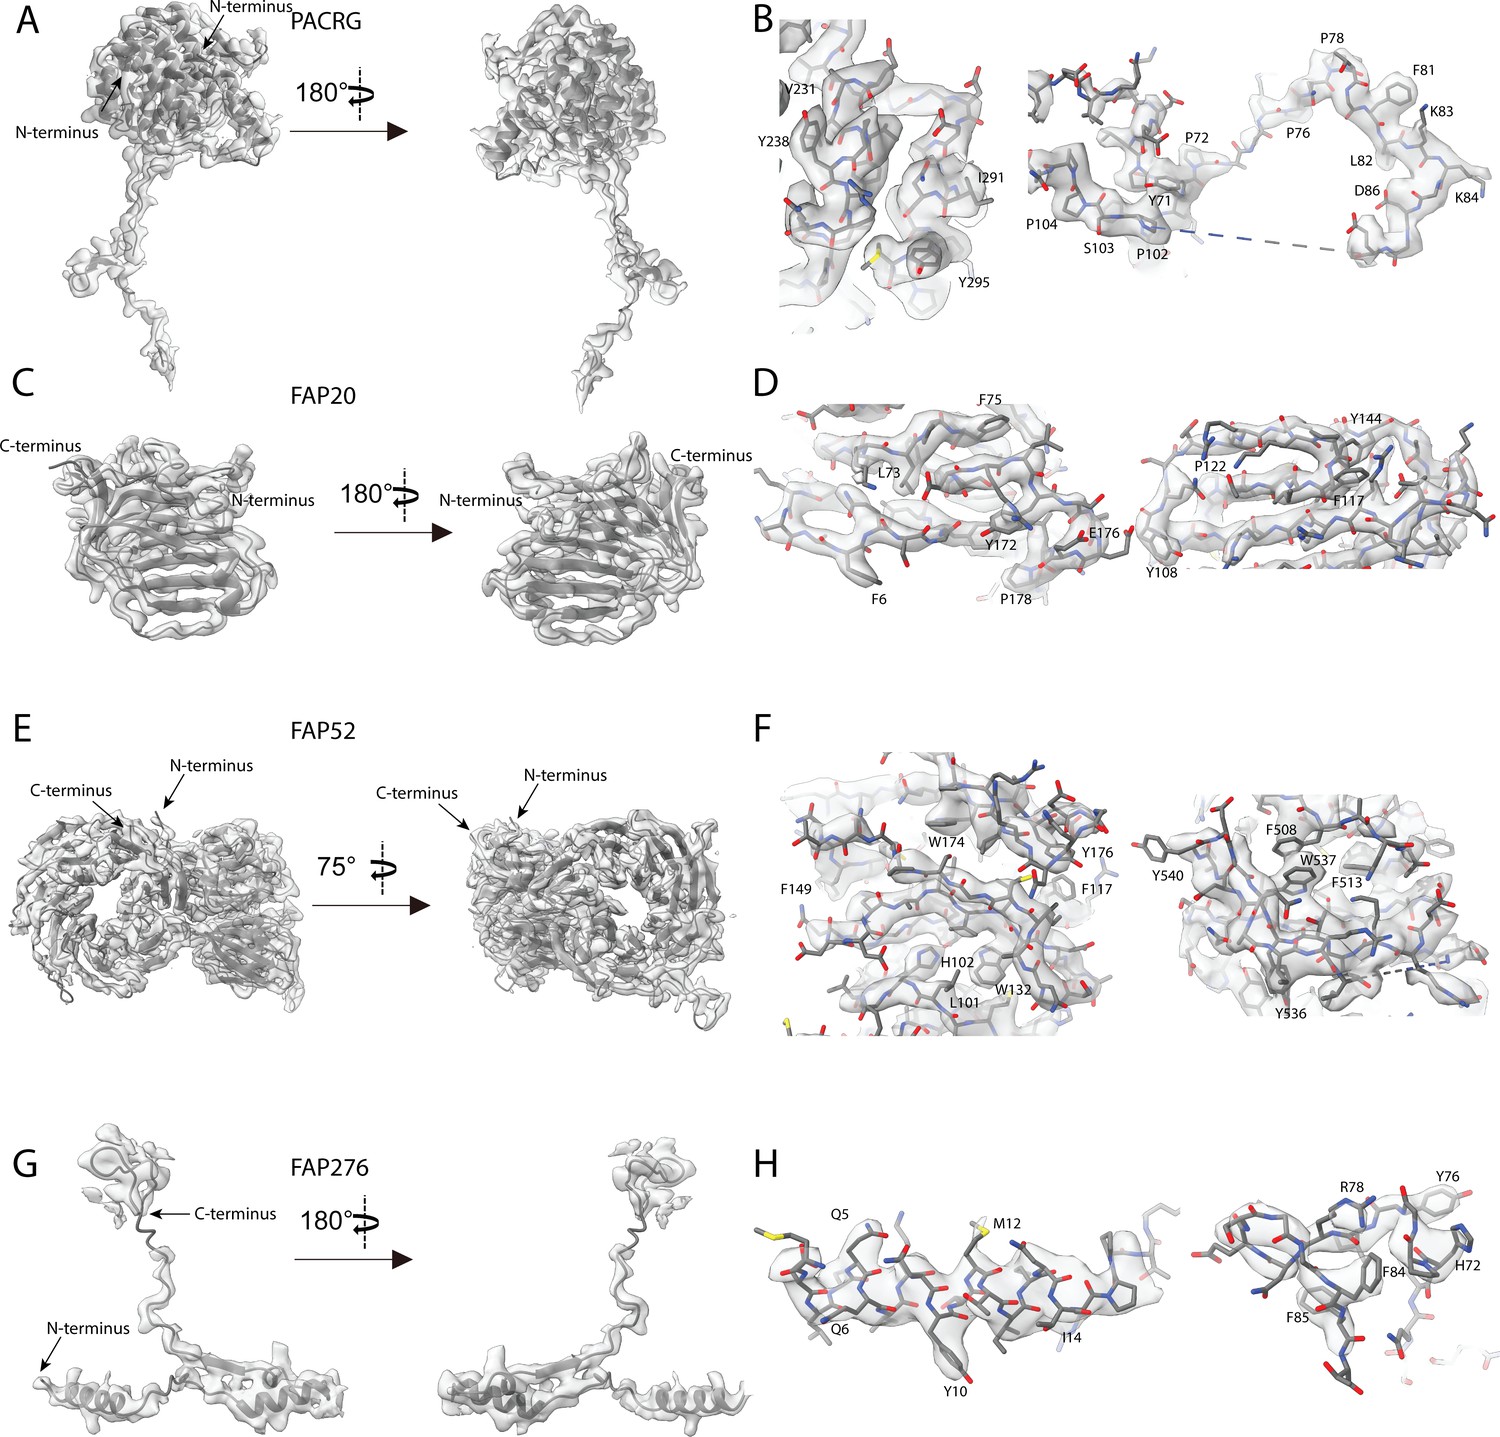
Atomic model of (A) PACRG, (C) FAP20, (E) FAP52 and (G) FAP276. Illustration of the cryo-EM density quality at selected regions of (B) PACRG, (D) FAP20, (F) FAP52 and (H) FAP276.
Figure 3 with 1 supplement
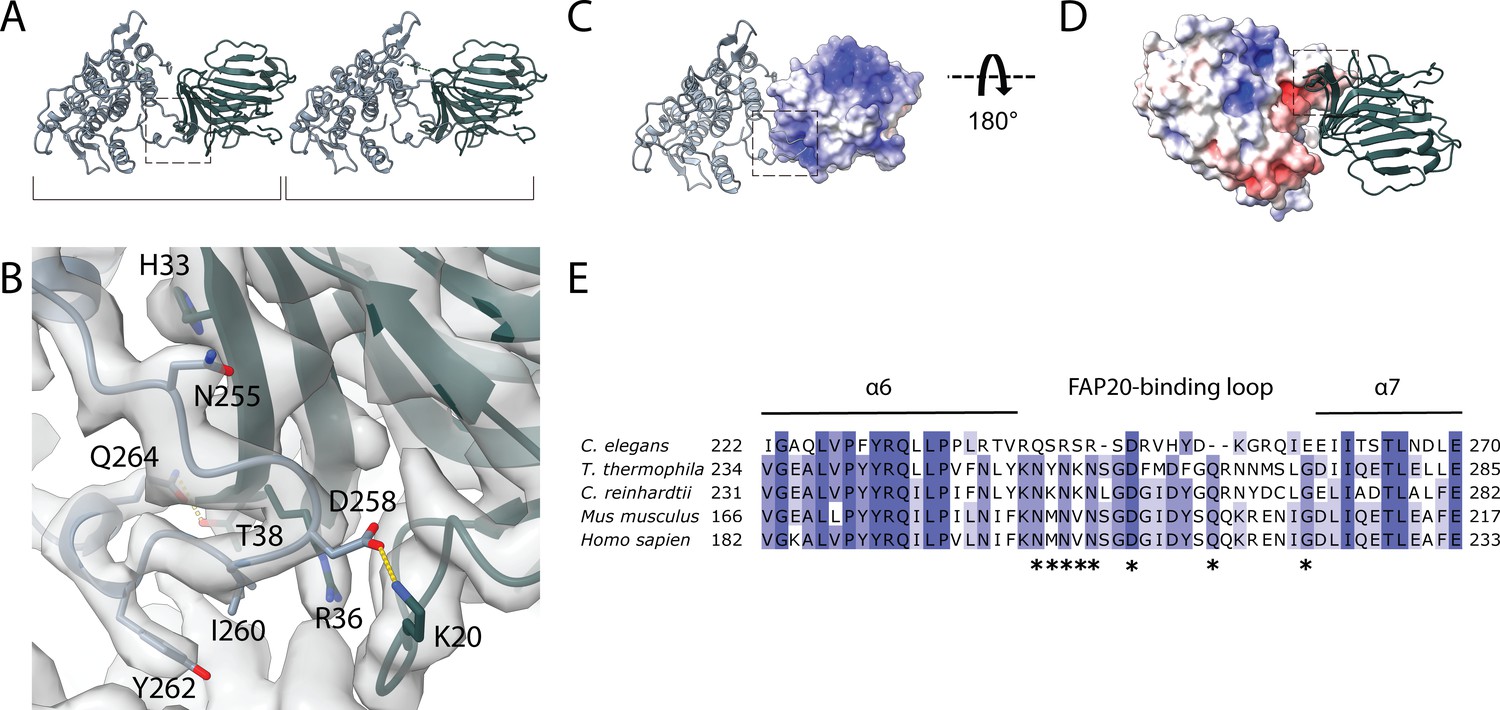
Interaction between PACRG and FAP20.
(A) Consecutive molecules of PACRG and FAP20 in the IJ PF. PACRG and FAP20 form a heterodimer as indicated by brackets. (B) Magnified view of the interacting region of PACRG and FAP20. Residues Q264 and D258 of PACRG form hydrogen bonds with residue T38 and K20 of FAP20, respectively. (C, D) Electrostatic interactions between PACRG and FAP20 illustrated by their surface charge. The dashed boxes in (A, C, D) highlight the interacting loops between PACRG and FAP20 (B). (E) Multiple sequence alignment of PACRG in the regions of FAP20-binding loop. Asterisks indicate residues that are involved in FAP20 binding.
Figure 3—figure supplement 1
Multiple sequence alignment of FAP20 shows that it is highly conserved.
Figure 4 with 1 supplement
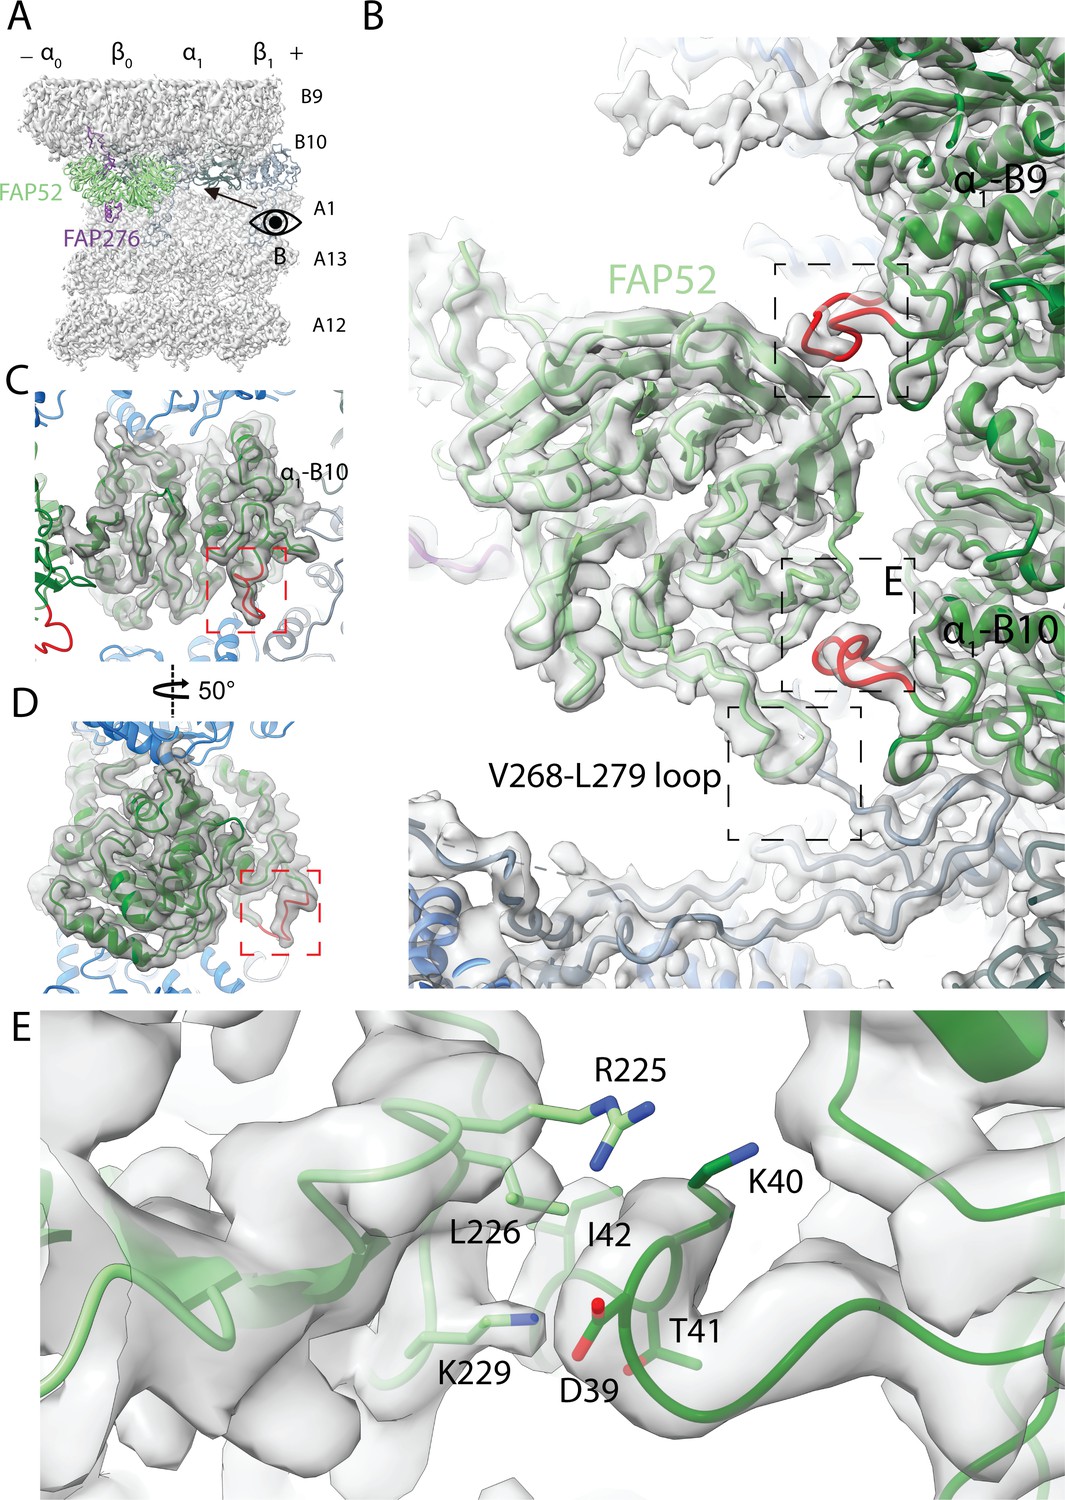
Structure of FAP52 and its interaction with tubulins and PACRG.
(A) Structure of FAP52 in a top view from the outside of the B-tubule looking down on the A-tubule. Black arrow indicates the direction of view in (B). (B) Three-point contacts of FAP52 with α-tubulins from PF B9 and B10 and PACRG, indicated by the black dashed boxes. The α-K40 loops are colored red. (C, D) The structure of the α-K40 loop from PF B10. Red dashed boxes indicate the α-K40 loop. (E) Interaction of α-K40 loop of PF B10 with FAP52. FAP52’s K229 is within favorable distance to form hydrogen bonds with the backbone of D39 and T41. Hydrophobic interactions between L226 and I42 and interactions involving R225 are also possible.
Figure 4—figure supplement 1
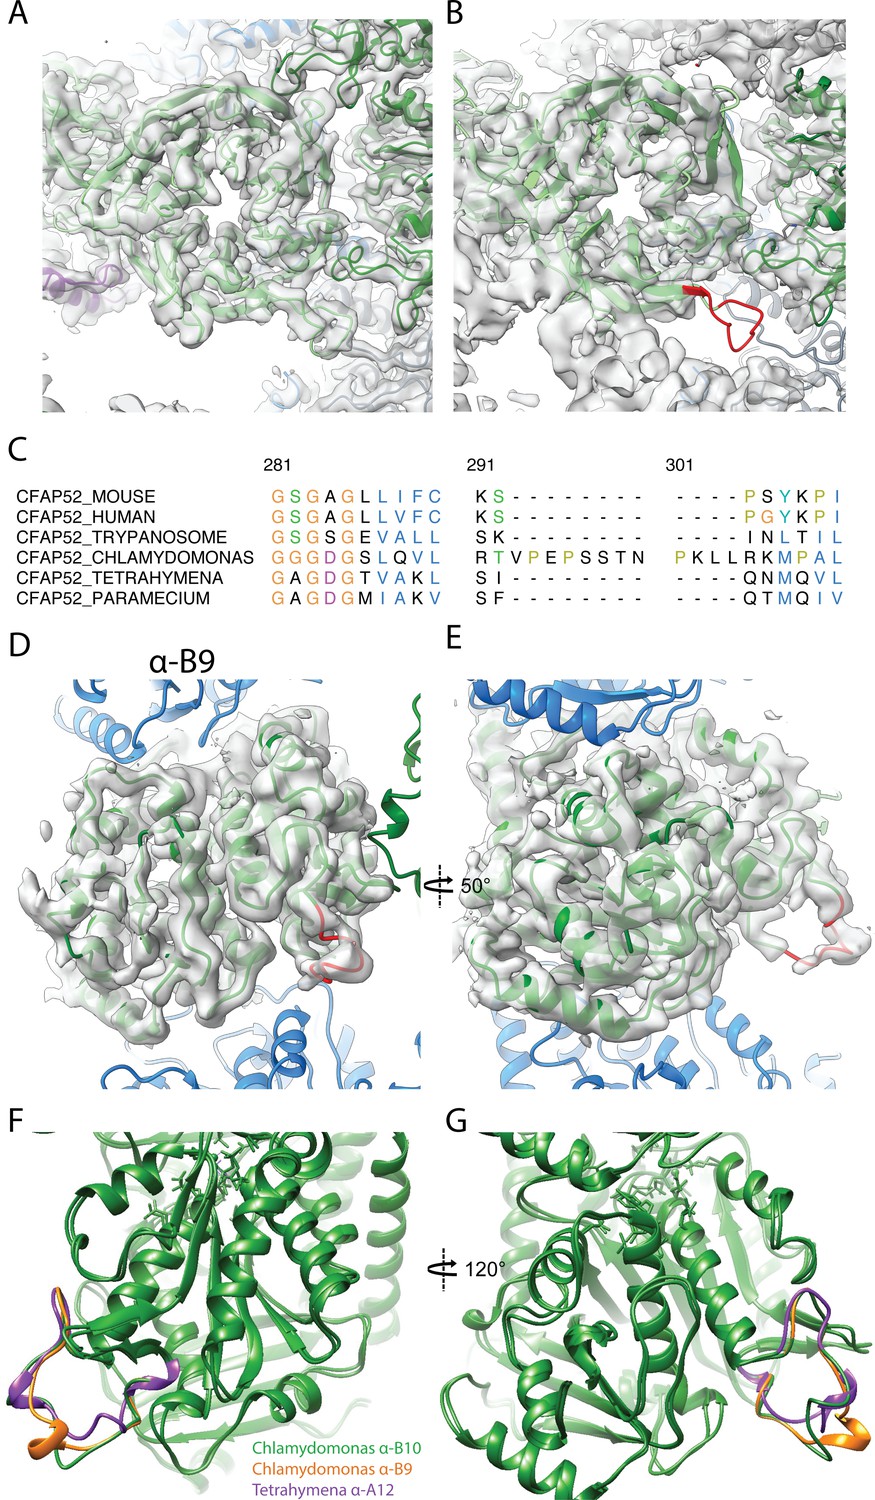
Data related to FAP52.
(A) Atomic model of Chlamydomonas FAP52 from inside the Chlamydomonas density map. (B) Atomic model of Chlamydomonas FAP52 fitted inside the Tetrahymena map highlights the longer loop (red) from Chlamydomonas. (C) Alignment of FAP52 from several species shows that Chlamydomonas has a longer loop in one beta propeller blade. The long loop is responsible for the interaction with PACRG. (D, E) α-K40 loop from PF B9 in Chlamydomonas. (F, G) Superimposition of the acetylated α-K40 loops from Chlamydomonas PF B9, B10 and Tetrahymena A12.
Figure 5 with 1 supplement

Structure of the Tether densities.
(A–B) At higher resolution, Tether densities 1 and 2 appear to be a single polypeptide chain in both Chlamydomonas (A) and Tetrahymena (B). Color scheme: tubulin: transparency gray; Tether densities 1 and 2 (Tether loop/FAP106): red; FAP276: purple; PACRG: light gray; Densities between PF A13 and A12 (turquoise). The dashed regions indicate the location of FAP52, which has been digitally removed to show the Tether densities underneath. (C) Model of FAP106 fitted inside the segmented Tether loop from Chlamydomonas. (D) Model of FAP106 tethering the B-tubule and A-tubule. Dashed box indicates view in (E). (E) Helix H3 and H4 of FAP106 insert into the gap formed by four tubulin dimers of PF B9 and B10. (F) Structure of Tether density 3 from Tetrahymena, which binds on top of the wedge between PF A13 and A1. (G) Overlay of the PACRG from Chlamydomonas onto the structure of Tetrahymena shows a hypothetical steric clash of a long Tetrahymena PACRG N-terminus with Tether density 3.
Figure 5—figure supplement 1
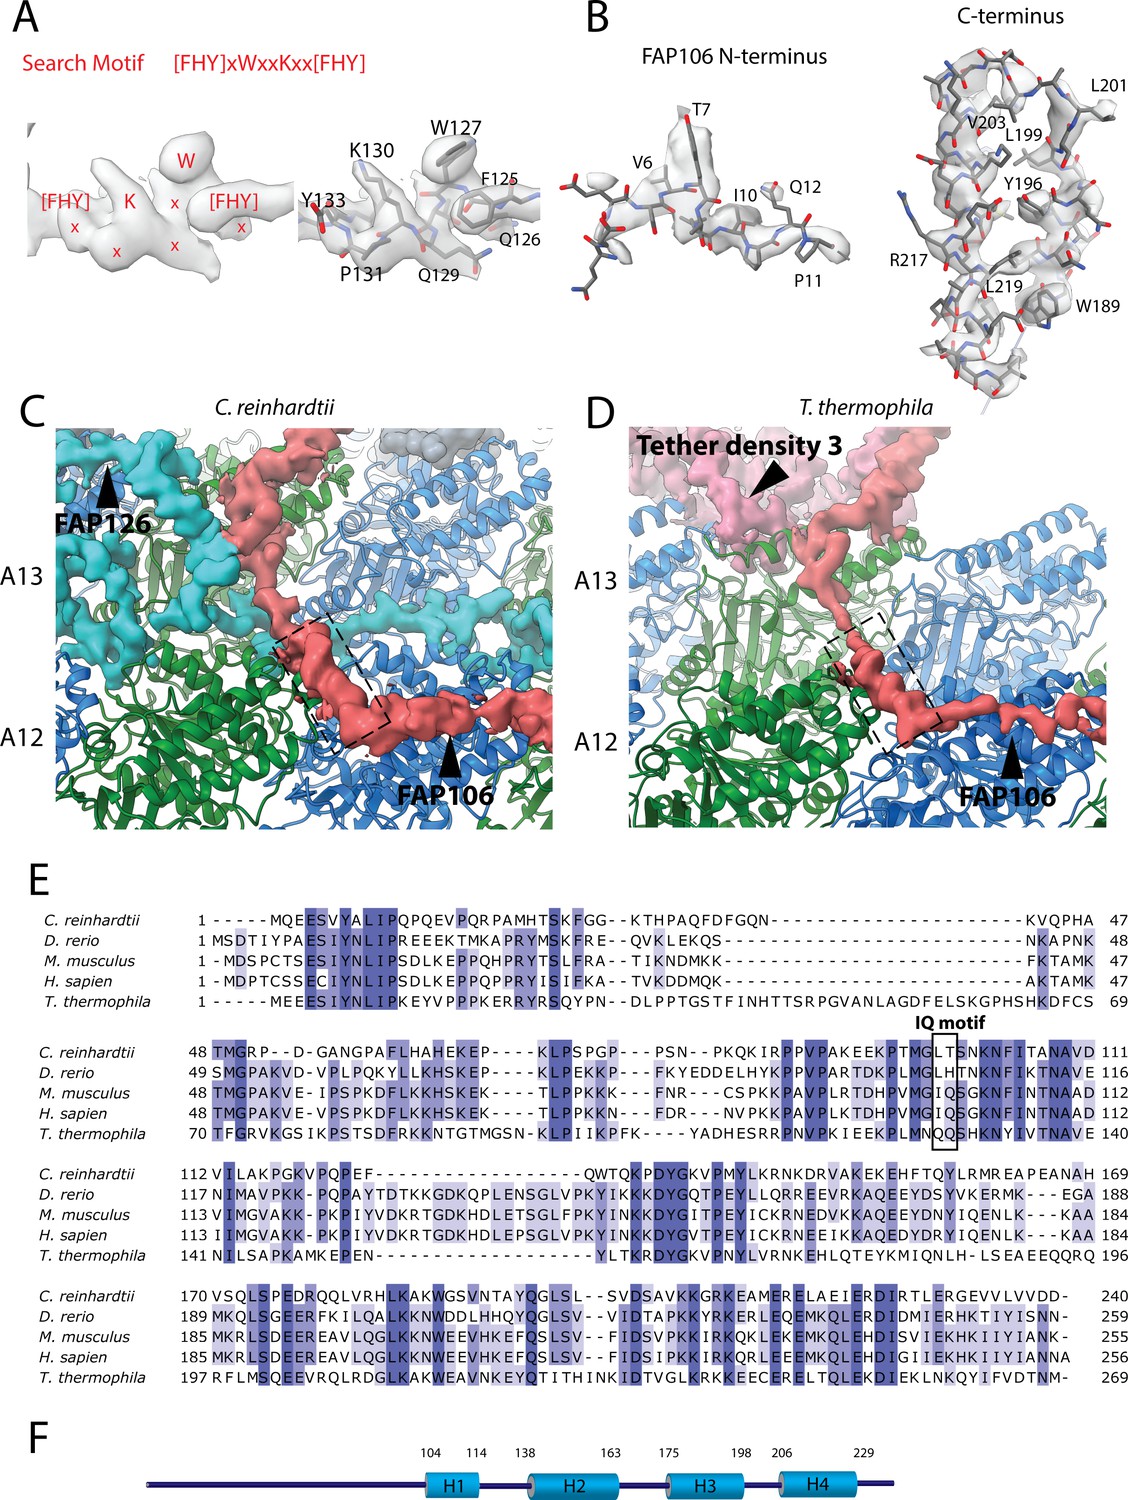
Data related to the Tether densities.
(A) The density of the search motif [FHY]xWxxKxx[FHY used for identifying FAP106 (left panel) and the fitted model segment (right panel). (B) The model of the N-terminus (left) and C-terminus (right) of FAP106 inside the electron density. (C, D) The small helix (H2) (indicated by the dashed box) from Chlamydomonas (A) and Tetrahymena homolog for Tether loop appear to interact with α-tubulin. (E) Multiple sequence alignment of FAP106 from a few organisms. (F) Secondary structure prediction of FAP106. The big cylinder represents helical prediction. Low confidence predictions are omitted.
Figure 6 with 1 supplement
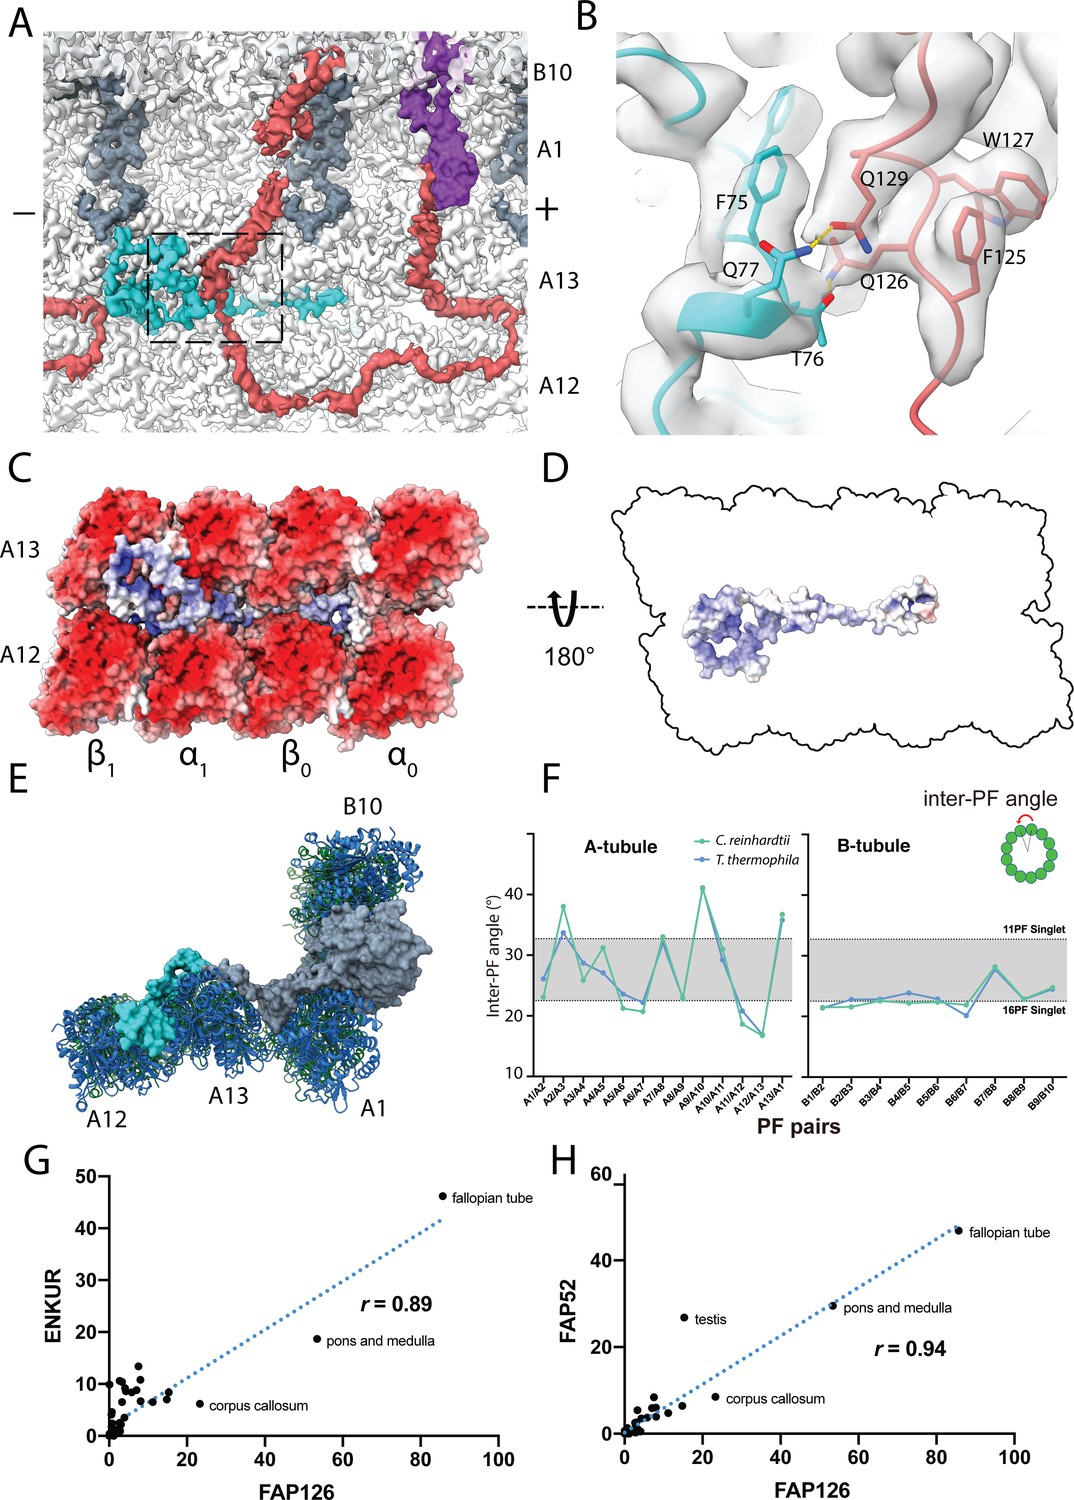
Structure of FAP126 and its interaction.
(A) View from the top of the PF A12 and A13 showing the density of FAP126 (dark turquoise). Dashed box indicates view in (B). (B) Closeup view of the interactions of FAP126 with the Tether loop, FAP106. T76 and Q77 of FAP126 form hydrogen bonds with Q126 and Q129 of FAP106, respectively. (C) Complimentary electrostatic surface charges of tubulins and FAP126. (D) Electrostatic charge of FAP126 on the tubulin interacting surface. (E) The N-terminus of PACRG and the hook density go into the wedges between PF A12 and A13, and PF A13 and A1, respectively. This likely contributes to the curvature of this region. (F) Inter-PF angles of the A- and B-tubules from Chlamydomonas and Tetrahymena (Ichikawa et al., 2019) showing very similar angle distributions. (G and H) Correlation graphs of consensus normalized expression levels for two selected pairs of genes (ENKURIN(FAP106)/FAP126 and FAP52/FAP126). Tissues showing high levels of expression of one or both genes are labeled. Correlation coefficients (r) are indicated. By excluding testis, corpus callosum, pons and medulla and fallopian tube, the correlation coefficients between ENKUR and FAP126 and between FAP52 and FAP126 are 0.66 and 0.84, respectively.
Figure 6—figure supplement 1
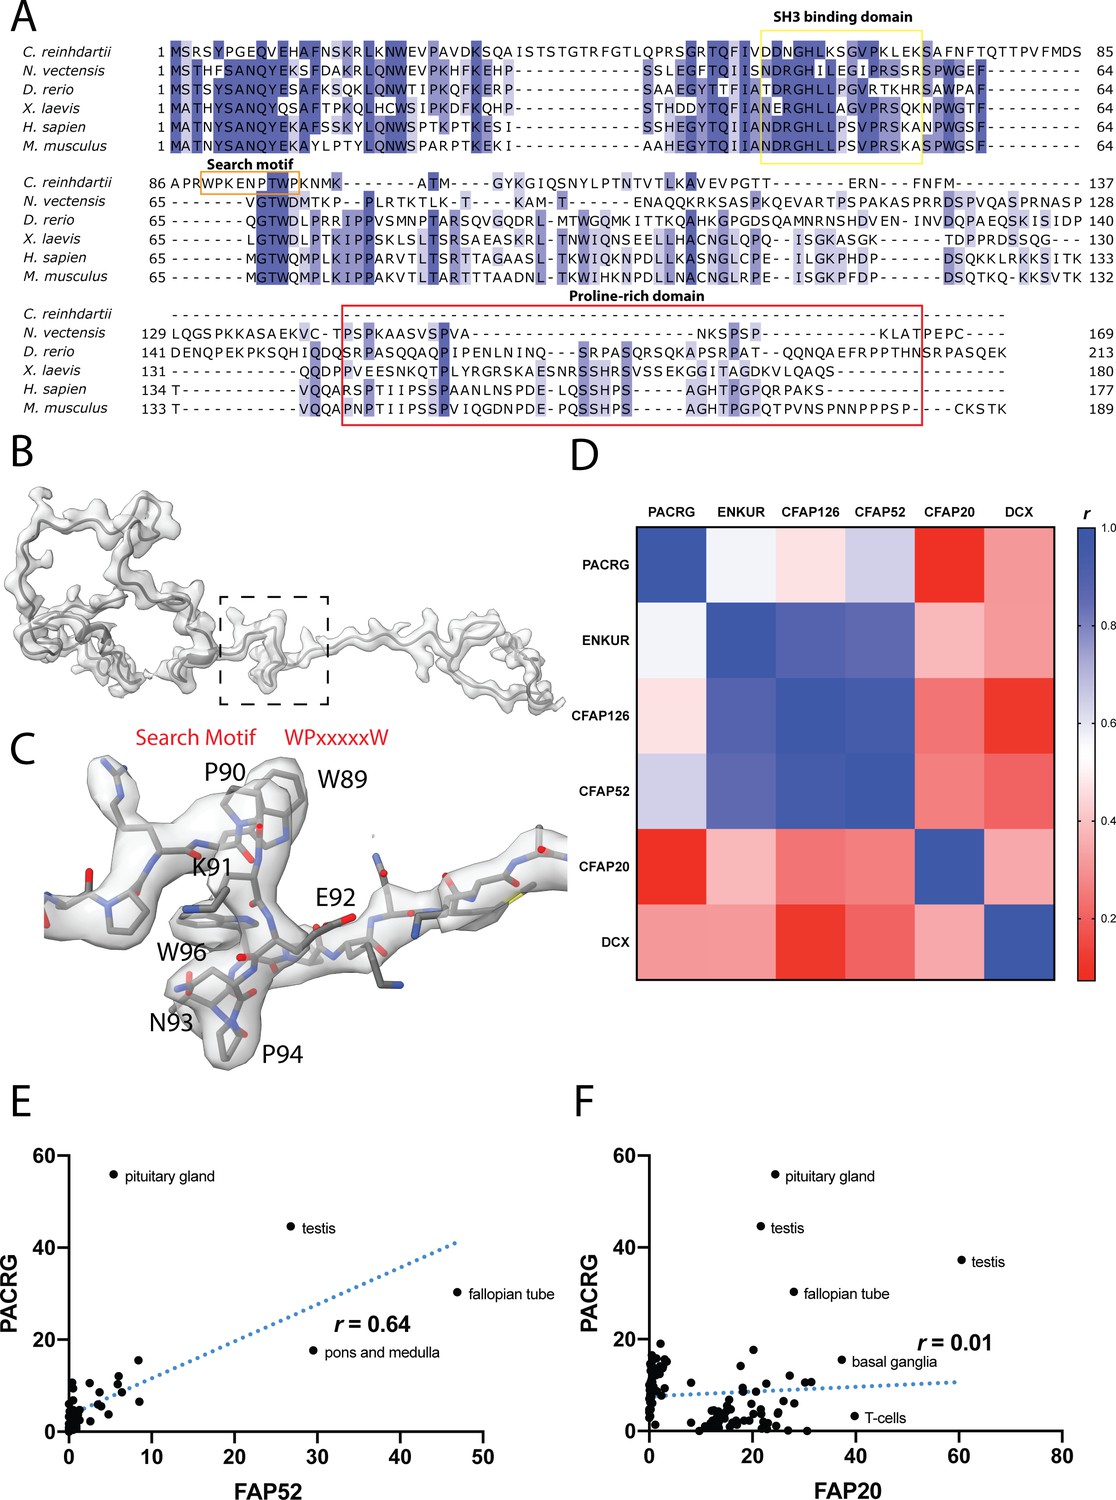
Data related to FAP126.
(A) Multiple sequence alignment of FAP126 from a few organisms. FAP126 of Chlamydomonas still have the SH3 binding domain while lacks the proline-rich region compared to other species. (B) Atomic model of FAP126 fitted inside its segmented density. The dotted box indicated the view in (C). (C) The density of the search motif WPxxxxxW used for identifying FAP126. (D) Table of pairwise correlation coefficients between tissue mRNA expression levels, color-coded from low (red) to high (blue) values. ENKUR is the homolog of FAP106 in human. DCX is a microtubule associated protein in neuron, picked as a control. (E, F) Correlation graphs of consensus normalized expression levels for two selected pairs of genes (PACRG/FAP20 and PACRG/FAP52). Tissues showing high levels of expression of one or both genes are labeled. Correlation coefficients (r) are indicated.
Figure 7
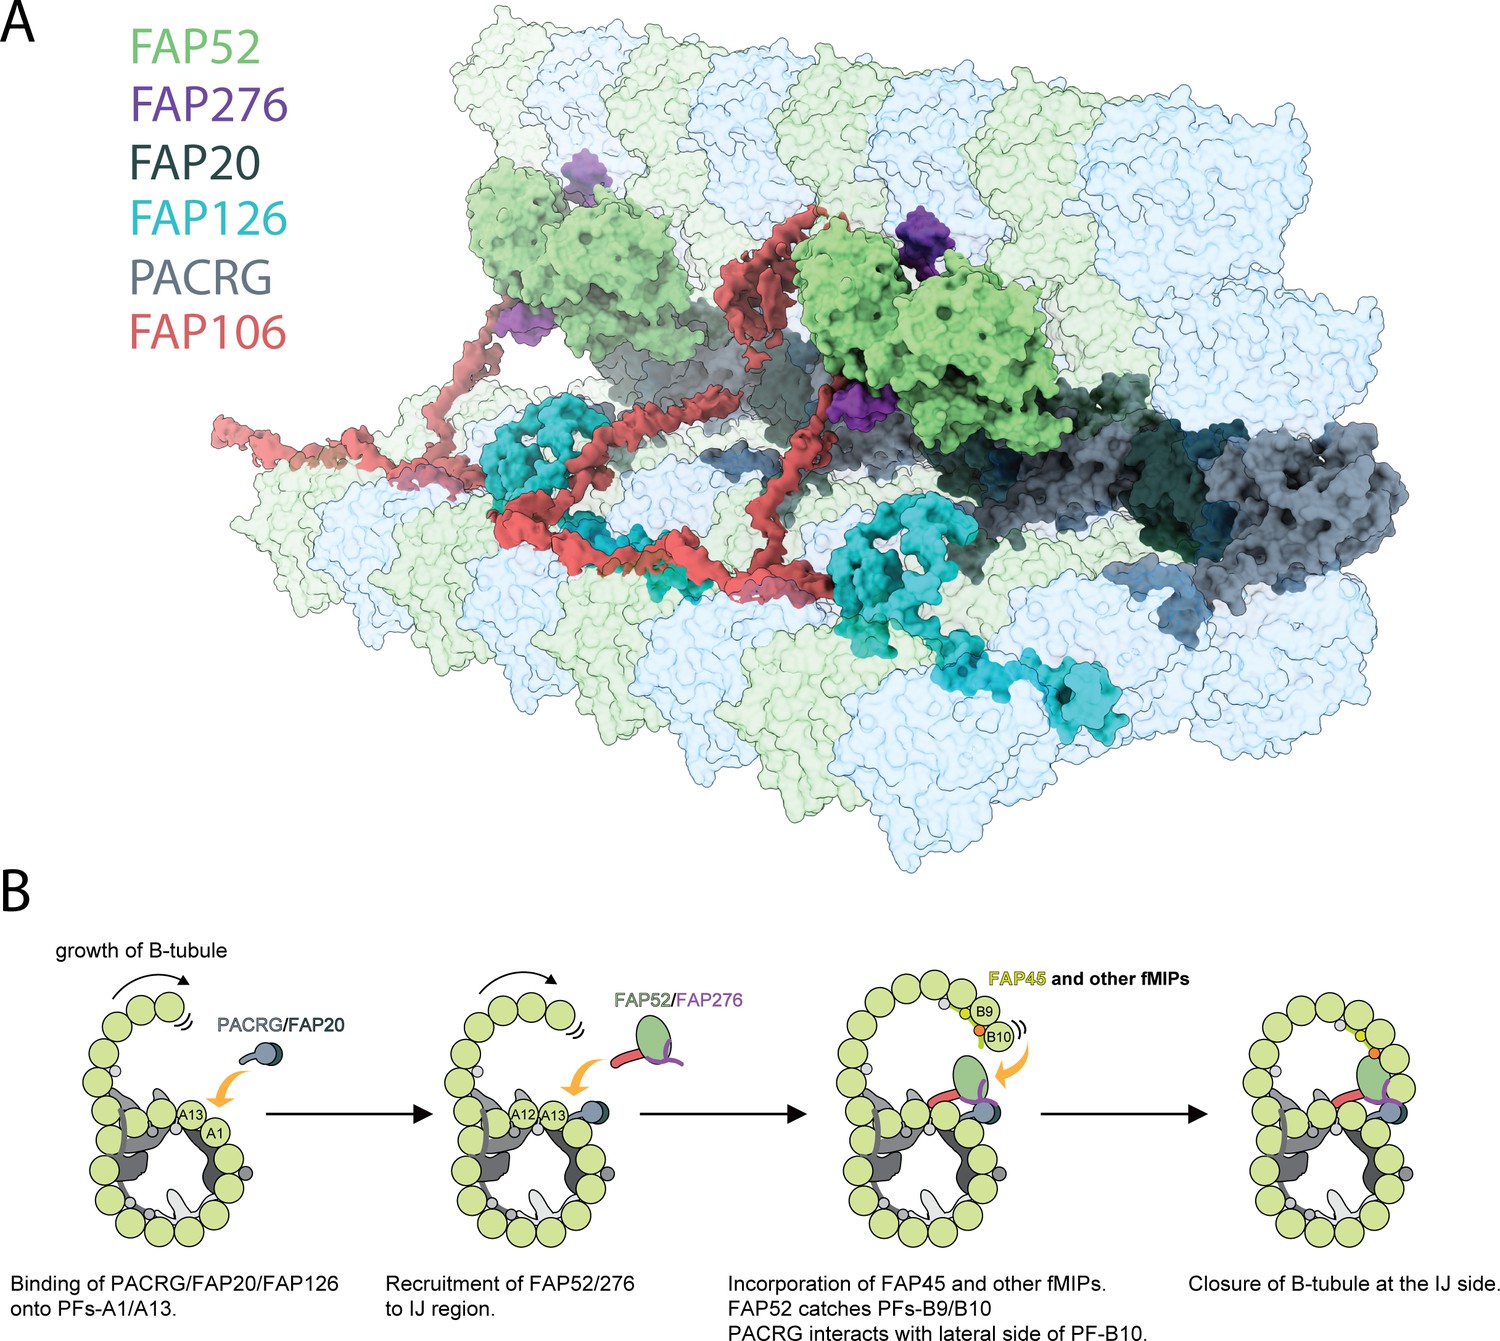
Inner junction structure and proposed model of IJ formation.
(A) Model of the IJ complex including PACRG, FAP20, FAP52, FAP126, FAP276 and FAP106. FAP45 is not depicted here. Tubulin is depicted as transparent. (B) The B-tubule starts growing laterally from the outer junction side as shown in Schmidt-Cernohorska et al. (2019). PACRG and FAP20 form a heterodimer, which binds onto the outside surface of PF A1. Following this, multiple alternative hypotheses are possible. One hypothesis is that FAP52, FAP276 and FAP106 would bind onto PF A12 and A13. FAP45 and other fMIP proteins would then be incorporated inside the B-tubule, which fixes the proper curvature so that PF B9 and B10 can interact with other IJ proteins. FAP52 binds both PF B9 and B10 through their K40 loops and finally, PACRG and FAP20 interact with the lateral side of PF B10 allowing for B-tubule closure.
Videos
Video 1
The IJ complex of the Chlamydomonas reinhardtii flagella.
Tables
Table 1
Proteins completely missing (no peptide detected) in FAP52 knockout mutant
| Names | Mol. weight (kDa) | p-values (WT vs FAP52) | Exclusive unique peptide counts in WT (quantitative values after normalization) |
|---|---|---|---|
| ARL3 | 20 | 0.0013 | 2, 2, 1 (2, 1, 2) |
| CHLREDRAFT_171815 | 57 | 0.035 | 2, 6, 1 (2, 5, 2) |
| CHLREDRAFT_156073 | 11 | 0.024 | 1, 1, 1 (2, 1, 2) |
| FAP276 | 10 | 0.015 | 3, 3, 2 (8, 7, 14) |
| FAP52 | 66 | 0.0046 | 27, 21, 15 (59, 73, 105) |
| FAP36 | 41 | 0.0023 | 3, 3, 1 (3, 3, 2) |
| CrCDPK1 | 54 | <0.0001 | 3, 5, 2 (3, 4, 4) |
| CHLREDRAFT_176830 | 110 | 0.024 | 2, 1, 2 (2, 1, 1) |
| FAP173 | 33 | 0.012 | 3, 3, 1 (5, 3, 2) |
| FAP29 | 112 | 0.00045 | 2, 3, 2 (3, 3, 4) |
| CHLREDRAFT_181390 | 41 | 0.028 | 1, 1, 1 (1, 1, 2) |
| ANK2 | 60 | 0,0041 | 1, 2, 1 (1, 1, 2) |
Table 2
Normalized spectral count of proteins detected by mass spectrometry.
| Name | Molecular Weight in kDa (MW) | Average quantitative Value (AQV) | Rough Stoichiometric Peptide Abundance (RSPA)* | T. thermophila Homologs** | Human homologs*** | Localization in C. reinhardtii |
|---|---|---|---|---|---|---|
| TUA1 | 50 | 1077.97 | 215.59 | TBA_TETTH | TUBA1C | Doublet |
| TUB1 | 50 | 625.46 | 125.09 | TBB_TETTH | TUBB4B | Doublet |
| RIB72 | 72 | 116.72 | 16.21 | TTHERM_00143690 | EFHC1 | MIP |
| PACRG | 25 | 38.39 | 15.35 | TTHERM_00446290 | PACRG | IJ |
| PF16 | 50 | 74.09 | 14.82 | TTHERM_000157929 | SPAG6 | Central Pair |
| RSP9 | 30 | 41.79 | 13.93 | TTHERM_00430020 | RSPH9 | Radial Spoke |
| FAP86 | 30 | 36.11 | 12.04 | - | - | Doublet |
| FAP1 | 22 | 26.46 | 12.03 | - | - | Doublet |
| FAP52 | 66 | 79.12 | 11.99 | TTHERM_01094880 | CFAP52 | MIP |
| FAP20 | 22 | 26.08 | 11.86 | TTHERM_00418580 | CFAP20 | IJ |
| FAP126 | 15 | 16.89 | 11.26 | - | CFAP126 | MIP |
| RSP1 | 88 | 98.73 | 11.22 | TTHERM_00047490 | RSPH1 | Radial Spoke |
| FAP115 | 27 | 29.98 | 11.10 | TTHERM_00193760 | - | Doublet |
| FAP106 | 27 | 29.81 | 11.04 | TTHERM_00137550 | ENKUR | IJ? |
| Tektin | 53 | 57.61 | 10.87 | - | TEKT5 | IJ? |
| RSP3 | 57 | 60.55 | 10.62 | TTHERM_00566810 | RSPH3 | Radial Spoke |
| FAP252 | 39 | 39.97 | 10.25 | TTHERM_00899430 | CETN3 | Axonemal |
| RSP2 | 77 | 77.95 | 10.12 | - | CALM2 | Radial Spoke |
| FAP161 | 43 | 43.50 | 10.12 | TTHERM_00155380 | CFAP161 | Axonemal |
| IDA4 | 29 | 27.29 | 9.41 | TTHERM_00841210 | DNALI1 | Dynein |
| FAP107 | 26 | 23.66 | 9.10 | - | FLG2 | Axonemal |
| DHC2 | 457 | 414.12 | 9.06 | TTHERM_01027670 | DNAH1 | Dynein |
| FAP12 | 54 | 48.85 | 9.05 | - | DAGLB | Cytoplasmic |
| RSP7 | 34 | 30.62 | 9.01 | TTHERM_00194419 | CALML5 | Radial Spoke |
| RSP5 | 56 | 49.32 | 8.81 | - | - | Radial Spoke |
| FAP230 | 45 | 39.59 | 8.80 | - | - | Axonemal |
| FAP77 | 29 | 23.88 | 8.24 | TTHERM_00974270 | CFAP77 | Axonemal |
| FAP55 | 111 | 90.47 | 8.15 | - | MYH14 | Axonemal |
| FAP90 | 28 | 22.35 | 7.98 | - | WBP11 | Axonemal |
| RSP10 | 24 | 19.10 | 7.96 | TTHERM_00378600 | RSPH1 | Radial Spoke |
| FAP71 | 32 | 24.86 | 7.77 | TTHERM_00077710 | EWSR1 | Axonemal |
| EEF1 | 51 | 39.04 | 7.66 | TTHERM_00655820 | Multiple | Axonemal |
| FAP182 | 49 | 36.69 | 7.49 | TTHERM_01049330 | C9orf116 | Axonemal |
| Rib43a | 43 | 32.06 | 7.46 | TTHERM_00624660 TTHERM_00641119 | RIBC2 | MIP |
| FAP45 | 59 | 43.20 | 7.32 | TTHERM_001164064 | CFAP45 | MIP |
-
*RSPA was calculated by (AQV)/(MW)*10.
** T. thermophila homologs were BLAST searched using the Uniprot database.
-
***Human homologs were taken from the ChlamyFP project (Pazour et al., 2005).
Additional files
-
Supplementary file 1
Supplementary Table 1: Significantly reduced or missing proteins in FAP52 compared to WT using relative mass spectrometry quantification.
- https://cdn.elifesciences.org/articles/52760/elife-52760-supp1-v2.docx
-
Transparent reporting form
- https://cdn.elifesciences.org/articles/52760/elife-52760-transrepform-v2.docx
Download links
A two-part list of links to download the article, or parts of the article, in various formats.
Downloads (link to download the article as PDF)
Open citations (links to open the citations from this article in various online reference manager services)
Cite this article (links to download the citations from this article in formats compatible with various reference manager tools)
The inner junction complex of the cilia is an interaction hub that involves tubulin post-translational modifications
eLife 9:e52760.
https://doi.org/10.7554/eLife.52760


