Nucleotide inhibition of the pancreatic ATP-sensitive K+ channel explored with patch-clamp fluorometry
- University of Oxford, United Kingdom
Figures
Figure 1 with 2 supplements

A FRET assay to measure nucleotide binding to Kir6.2.
(A) Cartoon illustrating the topology of KATP. Two (of four) Kir6.2 and two (of four) SUR1 subunits are shown for clarity. The inhibitory nucleotide-binding site on Kir6.2 is shown in red; the stimulatory nucleotide-binding sites on SUR1 are shown in green. The three transmembrane domains of SUR1 are designated TMD0, TMD1, and TMD2. The loop connecting TMD0 to TMD1 is designated L0. The nucleotide binding domains of SUR1 are labelled NBD1 and NBD2. (B) Chemical structures of ANAP and TNP-ATP. The fluorescent moieties are highlighted. (C) Side view of the structure of the cytosolic domains of Kir6.2 (PDB accession #6BAA) and one SUR1 subunit (PDB accession #6PZI). TNP-ATP (red, from PDB accession #5XW6) was docked into the nucleotide-binding site of Kir6.2 and positioned in NBS1 of SUR1 (green, from PDB accession #3AR7) by alignment as described in Materials and methods. Distances from the centre of mass of the six-membered ring of the native tryptophan at position 311 in Kir6.2 to the centre of mass of the trinitrophenyl moieties of the TNP-ATPs are displayed in Å. (D) Theoretical FRET efficiency between ANAP and TNP-ATP as a function of distance, calculated from the Förster equation. The distances and corresponding FRET efficiencies between ANAP at position 311 and TNP-ATP bound to Kir6.2 (EKir) and SUR1 (ESUR) are indicated. Our calculated R0 (the distance at which FRET efficiency is half maximal) for ANAP and TNP-ATP is 38.4 Å. (E) Spectral images acquired from an unroofed membrane expressing Kir6.2*-GFP + SUR1 and exposed to increasing concentrations of TNP-ATP. The y-dimension in each image represents distance. The x-dimension represents wavelength. (F) Line-averaged, background-subtracted spectra from E displayed with increasing concentrations of TNP-ATP coloured from purple to orange. The three fluorophores have distinct peaks: ANAP at 472 nm, GFP at 508 nm, and TNP-ATP at 561 nm. The shaded rectangle indicates the wavelength range used to measure ANAP intensity. (G) Concentration-response relationship for binding of TNP-ATP to Kir6.2*-GFP + SUR1 in unroofed membranes. Data were plotted as , where is the fluorescence intensity of ANAP in the absence of nucleotide. The smooth curve is a descriptive Hill fit. , , , n = 18. (H) Concentration-response relationship for binding of TNP-ATP to Kir6.2*,G334D-GFP + SUR1 in unroofed membranes. The dashed blue curve is the fit from G. The orange curve is a descriptive Hill fit to the G334D data. , , , n = 9. The inset shows the location of G334D (green) in relation to the inhibitory ATP binding site on Kir6.2 (PDB accession #6BAA). TNP-ATP (PDB accession #5XW6) shown in red sticks.
Figure 1—figure supplement 1
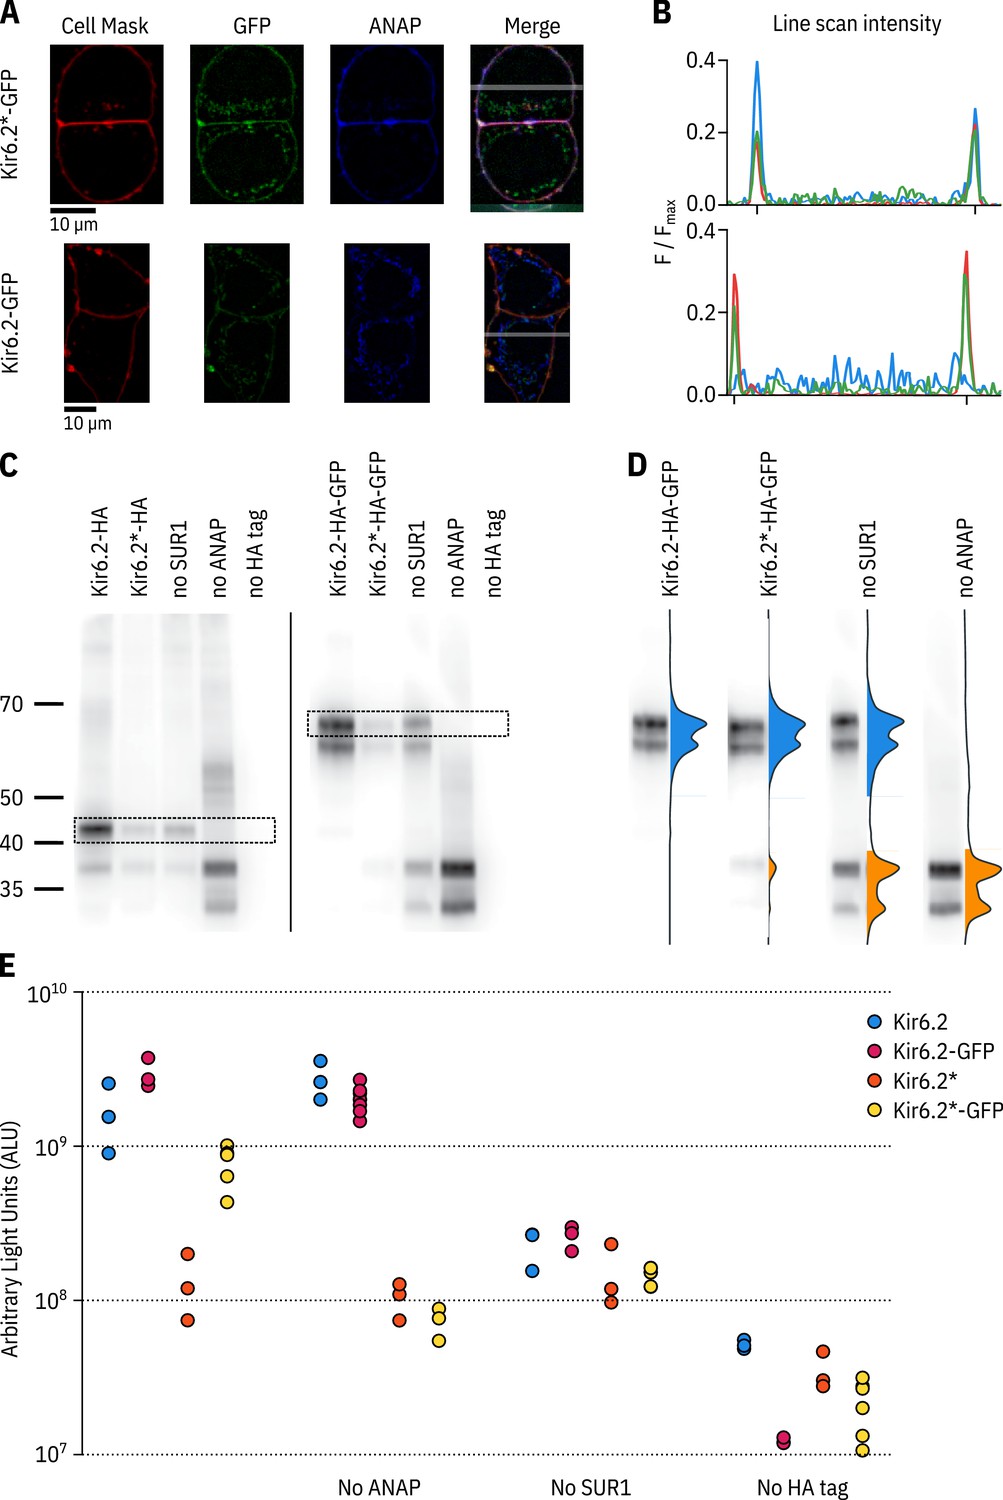
ANAP labelling is specific and only full-length Kir6.2 is expressed at the cell membrane.
(A) Confocal images of HEK-293T cells transfected with Kir6.2*-GFP + SUR1 (top panel) or Kir6.2-GFP + SUR1 (bottom panel). Cells were stained with Cell Mask Deep Red to label the plasma membrane. The grey band in the merged image is a 5 pixel-width line scan. (B) Averaged intensities of the line scans shown in A. The intensity of each channel is shown as a differently coloured line: Cell Mask in red, ANAP in blue and GFP in green. The notches on the x-axis mark the location of the plasma membrane. (C) Two separate western blots against Kir6.2*-HA (left) and Kir6.2*-HA-GFP (right) constructs. The HA tag is in the extracellular region following helix M1 of Kir6.2, and is present in constructs in C, D, and E unless otherwise stated. Cells were co-transfected with pANAP, eRF1-E55D, and SUR1 unless otherwise indicated. Full-length Kir6.2 constructs are indicated on each gel with a dashed box. The doublets represent an N-terminally truncated product - see Materials and methods. (D) Each lane from the Kir6.2*-HA-GFP gel is displayed normalised to its highest intensity accompanied by the line-averaged density trace. The density peak corresponding to ANAP-labelled Kir6.2 is filled in blue. The density peak for C-terminally truncated Kir6.2 is filled in orange. (E) Chemiluminescence-based surface expression assay for HA-tagged Kir6.2 constructs. Each data point represents an individual coverslip of transfected HEK-293T cells. n = 3–6 for each condition. Note the logarithmic scale on the vertical axis.
Figure 1—figure supplement 2
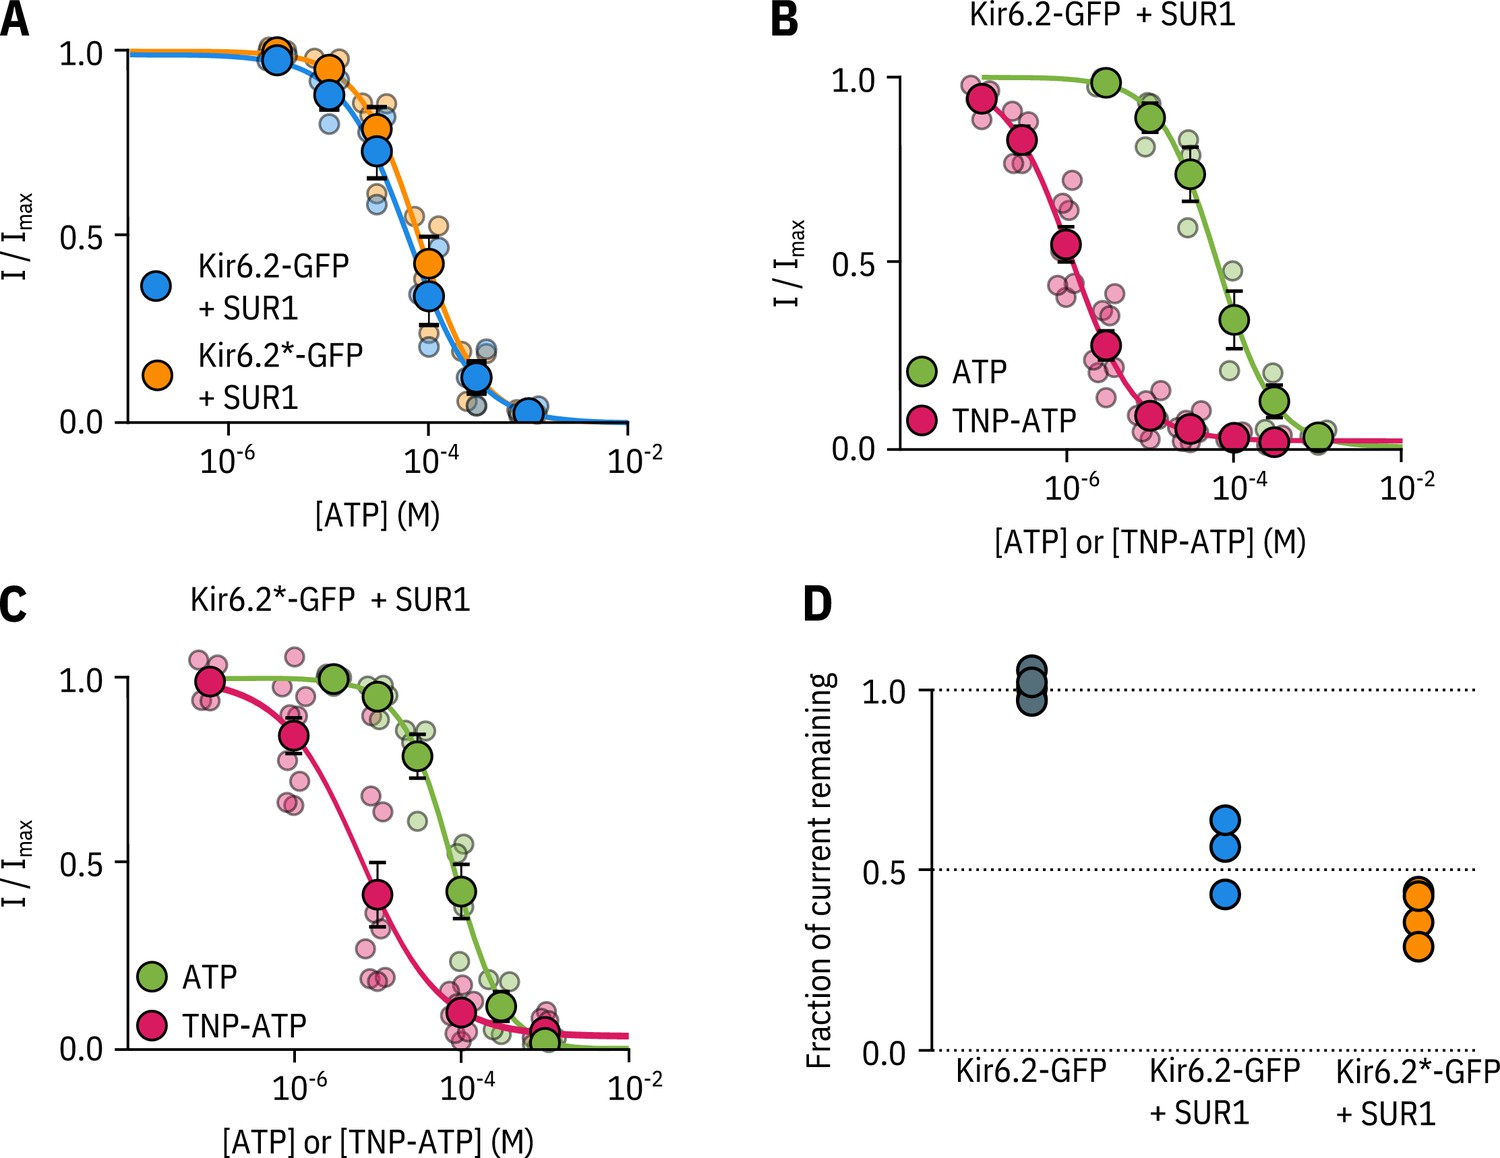
Kir6.2*-GFP is functionally similar to Kir6.2-GFP.
A. Concentration-response curve for ATP inhibition of Kir6.2-GFP + SUR1 or Kir6.2*-GFP + SUR1, measured in excised, inside-out patches. The smooth curves are descriptive Hill fits to the data. Kir6.2-GFP + SUR1: , , , n = 3; Kir6.2*-GFP + SUR1: , , , n = 4. (B, C) Concentration-response relationships for current inhibition in excised, inside-out patches expressing Kir6.2-GFP + SUR1 (C) or Kir6.2*-GFP + SUR1 (D) exposed to either ATP or TNP-ATP. The smooth curves are descriptive Hill fits to the data. Kir6.2-GFP + SUR1 (TNP-ATP): , , , n = 7, Kir6.2*-GFP + SUR1 (TNP-ATP): , , , n = 9. Data and fits for inhibition of Kir6.2*-GFP + SUR1 by TNP-ATP are the same as in Figure 2. (D) Fractional current inhibition by 100 µM tolbutamide measured in excised, inside-out patches. Data were normalised to the average current in control solution before and after tolbutamide exposure. Each data point represents an individual patch. Kir6.2-GFP without SUR1, n = 5; Kir6.2-GFP + SUR1, n = 3; Kir6.2*-GFP + SUR1, n = 4.
Figure 2 with 3 supplements
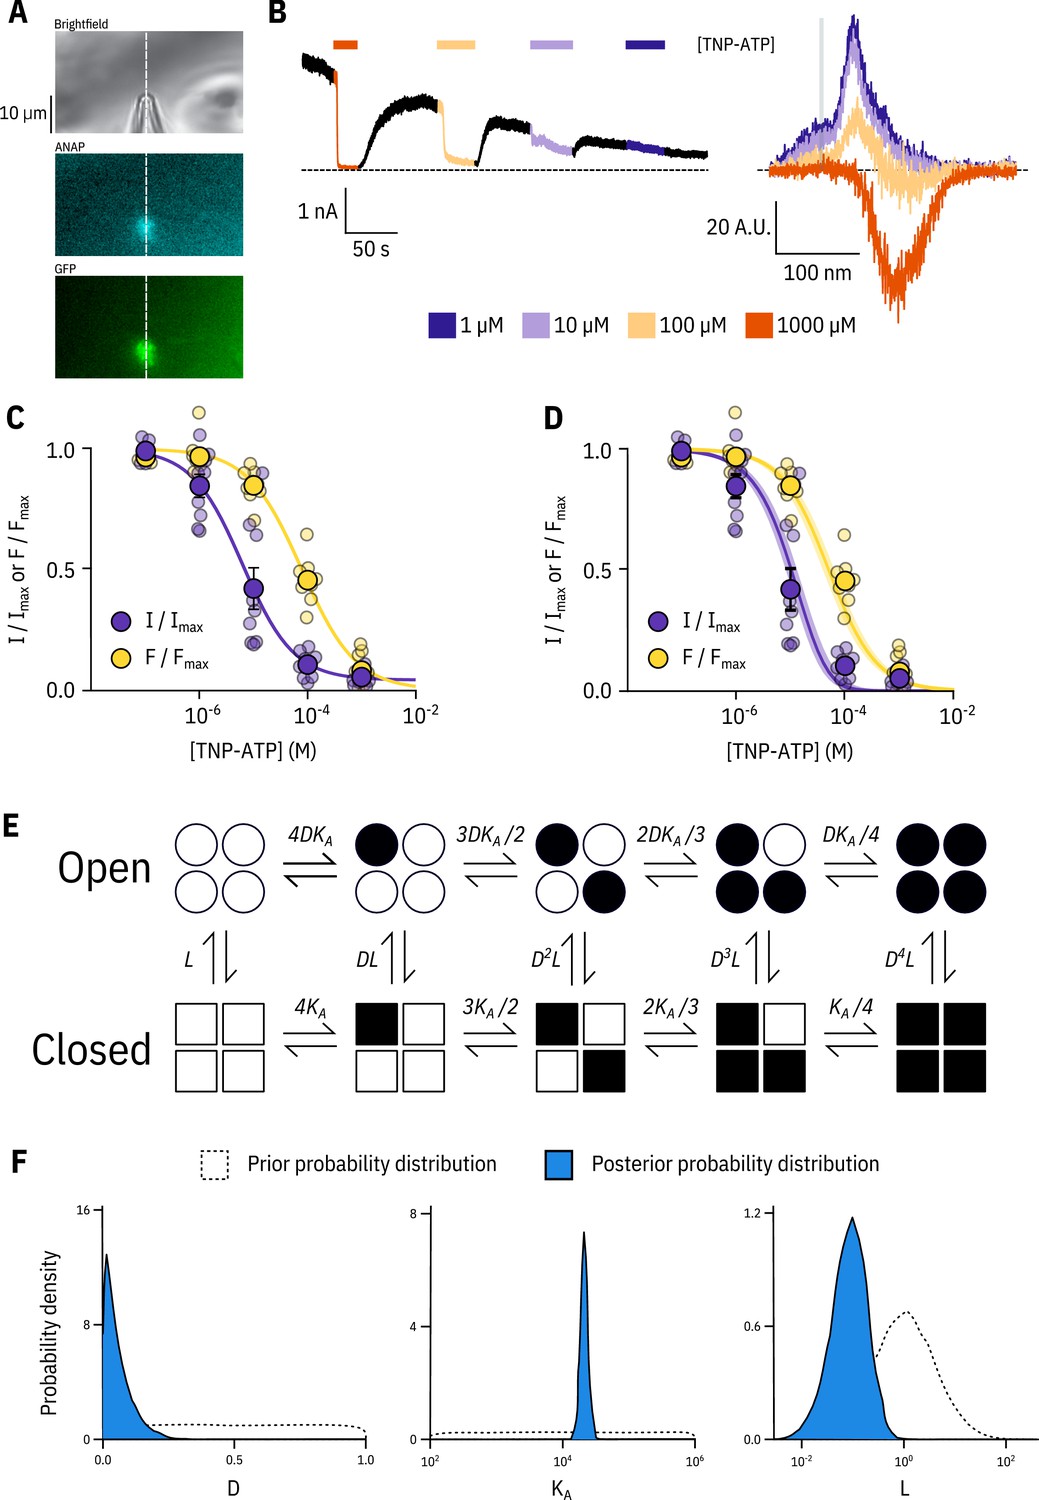
Simultaneous measurements of nucleotide binding and channel current.
(A) Brightfield and fluorescence images of a patch pipette and excised, inside out patch expressing Kir6.2*-GFP + SUR1, with the location of the centre of the spectrometer slit overlaid as a white, vertical line. (B) Current (left) and spectra (right) acquired from the same excised, inside-out patch exposed to TNP-ATP and coloured according to concentration. (C) Concentration-response (n = 9) for TNP-ATP inhibition of Kir6.2*-GFP + SUR1 currents () and for quenching of ANAP fluorescence (). Both current inhibition and fluorescence quenching were fit to the Hill equation. Current inhibition: , , , fluorescence quenching: , , . (D) The same data as in C fit to an MWC-type model. Solid curves represent the median fit; shaded areas represent the 95% quantile interval. Values for the fits are reported in the text and in Table 3. (E) MWC-type model for inhibition of KATP by nucleotides. Open subunits are shown as circles; closed are shown as squares. Nucleotide-bound subunits are represented by filled symbols. , , and are defined in the text. (F) Posterior probability distributions for the MWC-type model generated by MCMC fits to the data in C overlaid on the prior probability distribution (dashed line) for each parameter.
Figure 2—figure supplement 1
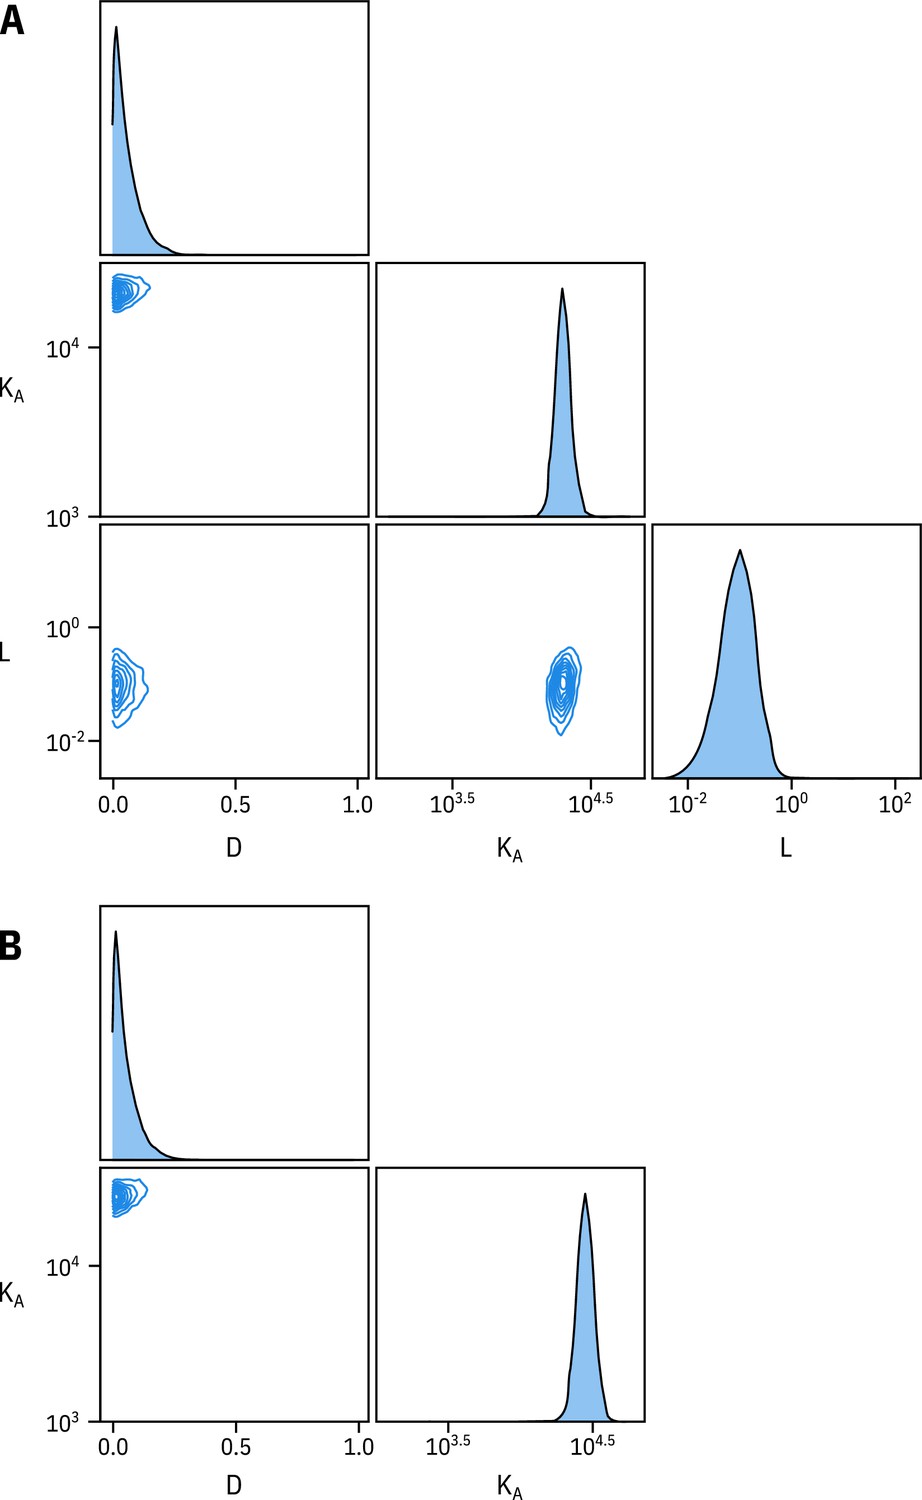
Fixing does not affect estimates of and .
(A) Pairwise correlation plots of , and from the full MWC-type model fit to Kir6.2*-GFP + SUR1. (B) Pairwise correlation plots of and from the full MWC-type model with fixed to 0.8 ().
Figure 2—figure supplement 2
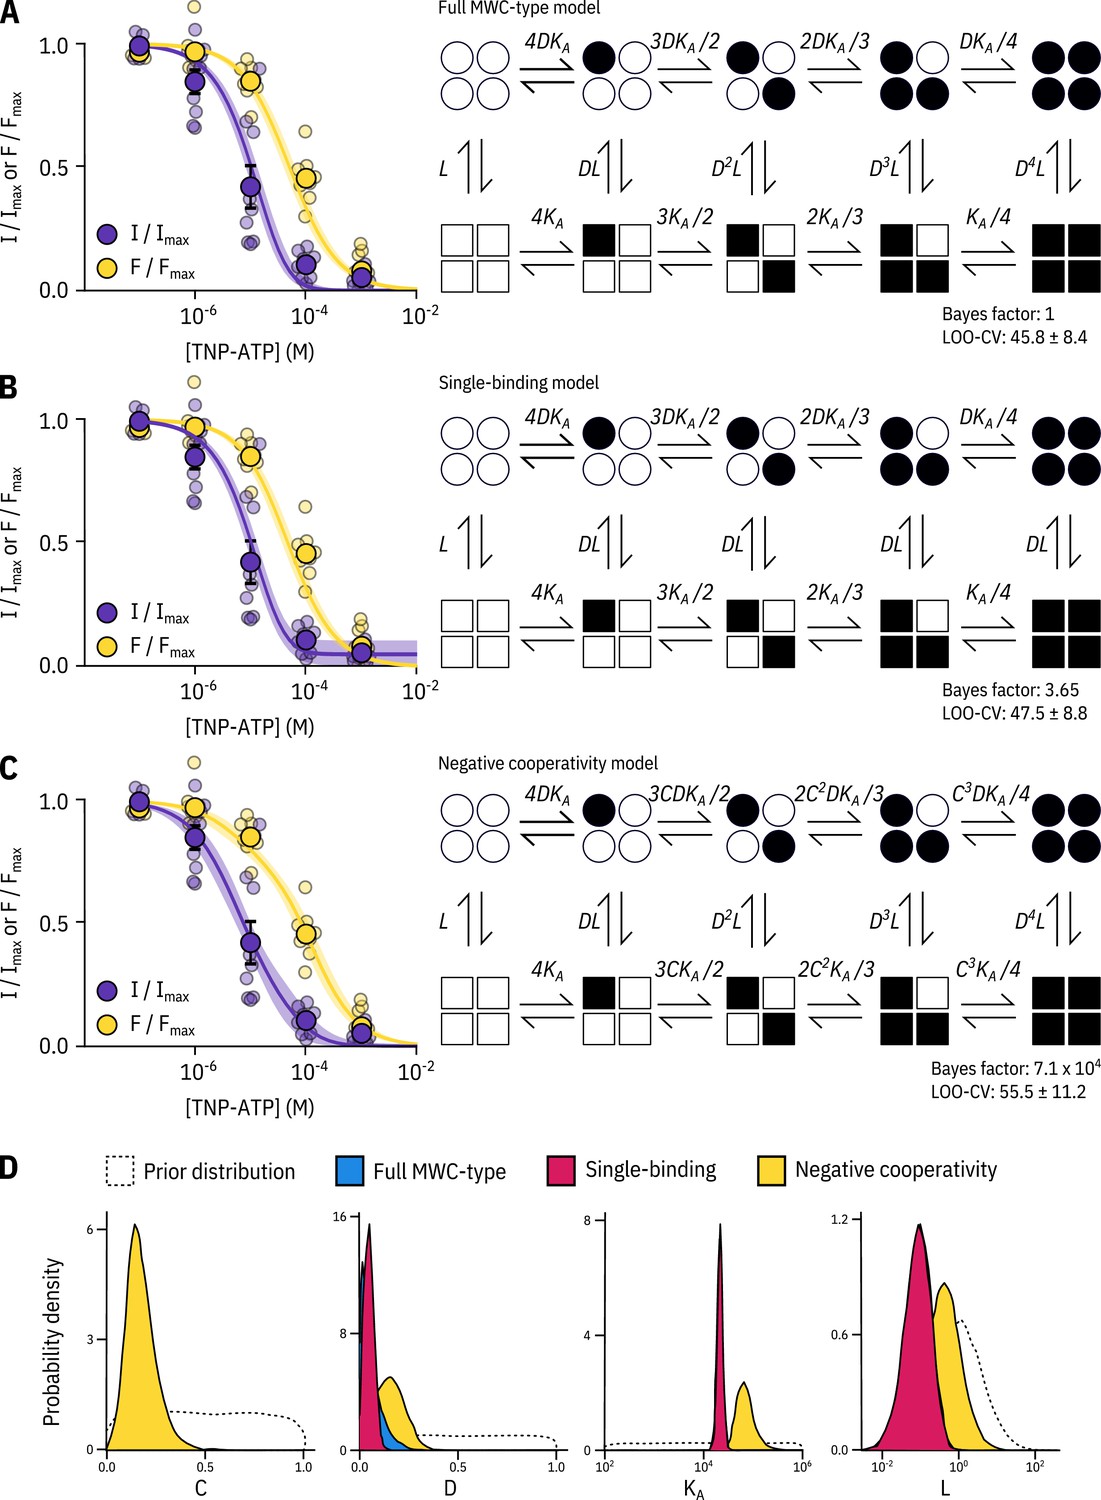
Model selection.
Fits to PCF data from Figure 2 with the full MWC-type model (A), single-binding model (B) and negative-cooperativity model (C) are shown on the left with the diagrammatic formulation of each model on the right. The Bayes factor and leave-one-out cross-validation (LOO-CV) scores for each model compared to the full MWC-type model are displayed. More detail on these fit indices is provided in the Discussion section. , , , and are defined in the text. (D) Posterior probability distributions for the each of the models generated by MCMC fits to the data in Figure 2 overlaid on the prior probability distribution (dashed line) for each parameter. For and , the distributions for the MWC-type and single-binding model were virtually identical. The MWC-type densities are hidden behind the single-binding densities.
Figure 2—figure supplement 3
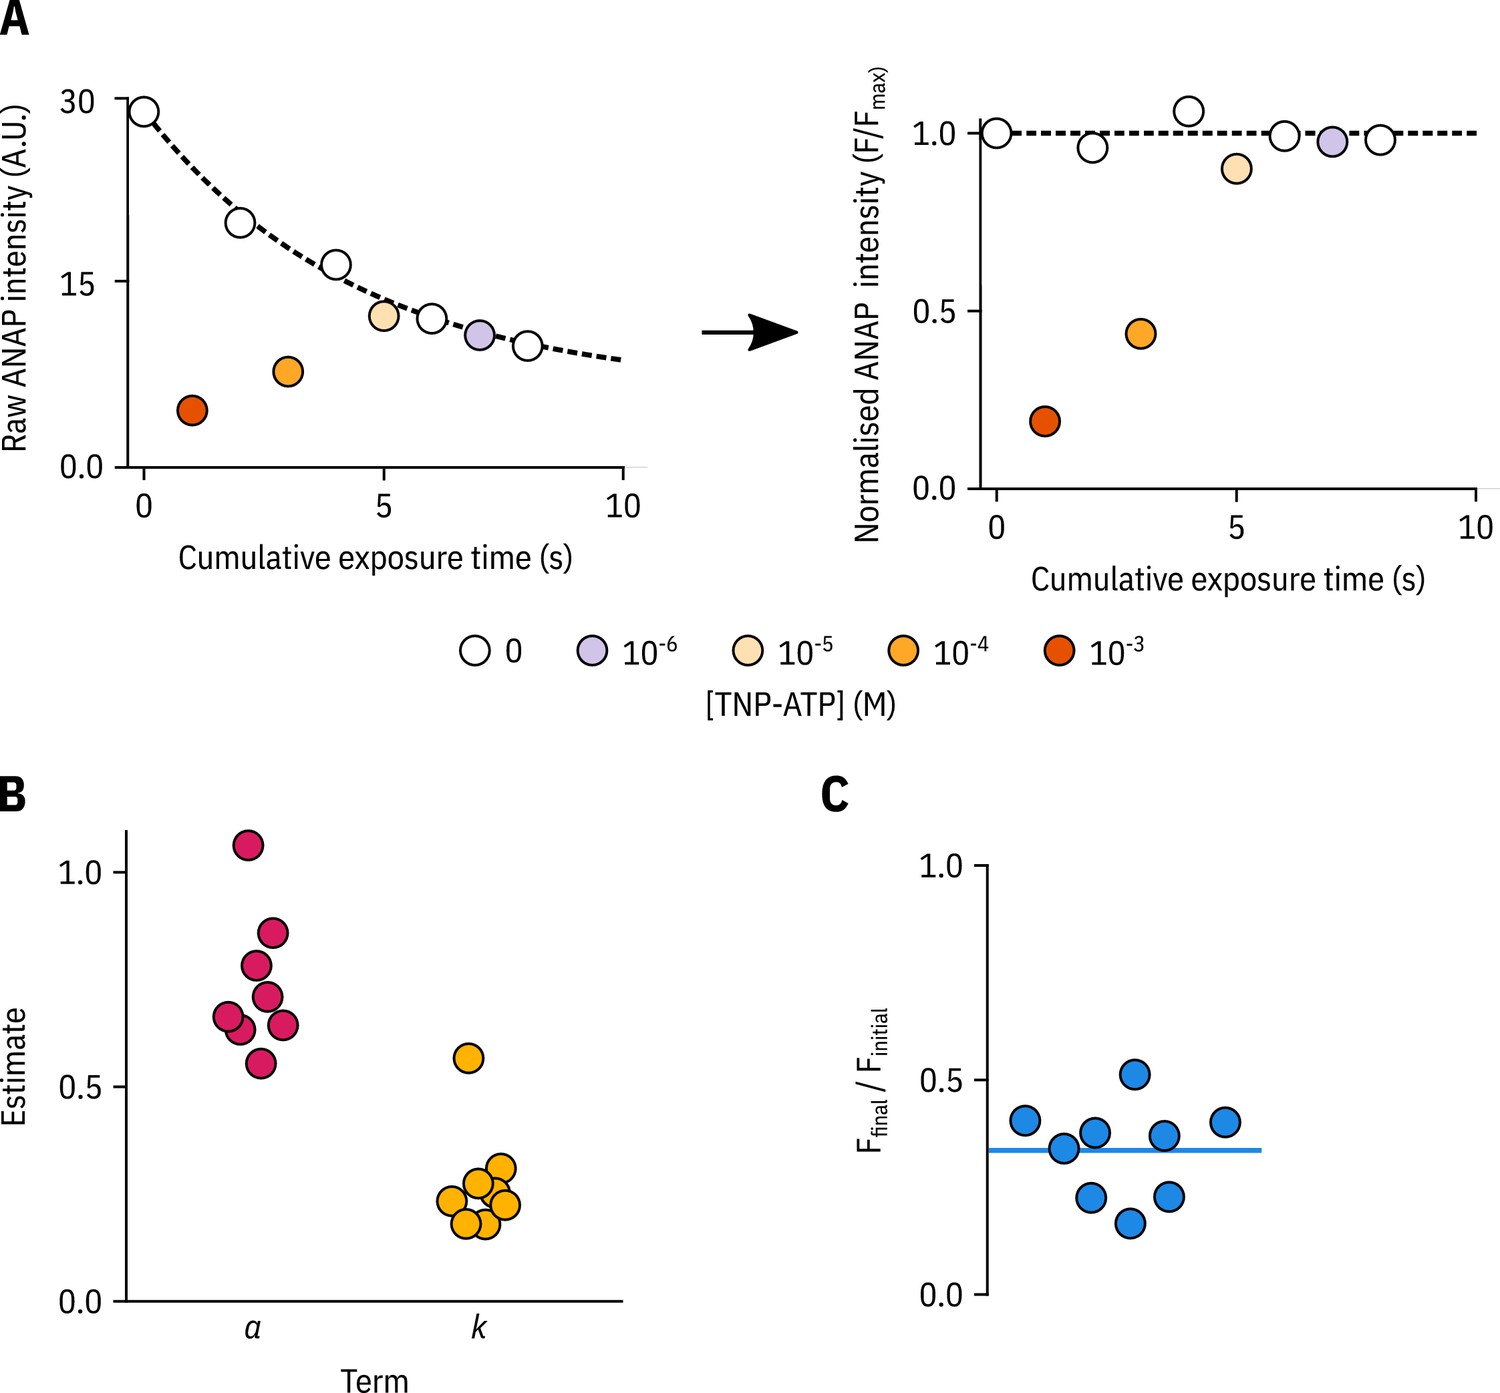
Bleaching correction for PCF experiments.
(A) Raw ANAP fluorescence intensities (left) and corrected ANAP fluorescence intensities (right) from a representative PCF experiment with Kir6.2*-GFP + SUR1 plotted against the exposure time. The fit to Equation 1 is shown as a black dashed line. To minimise artifacts from our bleaching corrections we performed experiments from both high-to-low and low-to-high TNP-ATP concentrations. (B) The parameters from fits to Equation 1 for each PCF experiment in Figure 2 are shown individually. (C) The fraction of ANAP fluorescence intensity remaining at the end of each PCF experiment in Figure 2 is shown by dividing the raw ANAP intensity of the last exposure by that of the first. The mean fractional remaining intensity of 0.34 is shown as a horizontal blue line.
Figure 3 with 2 supplements
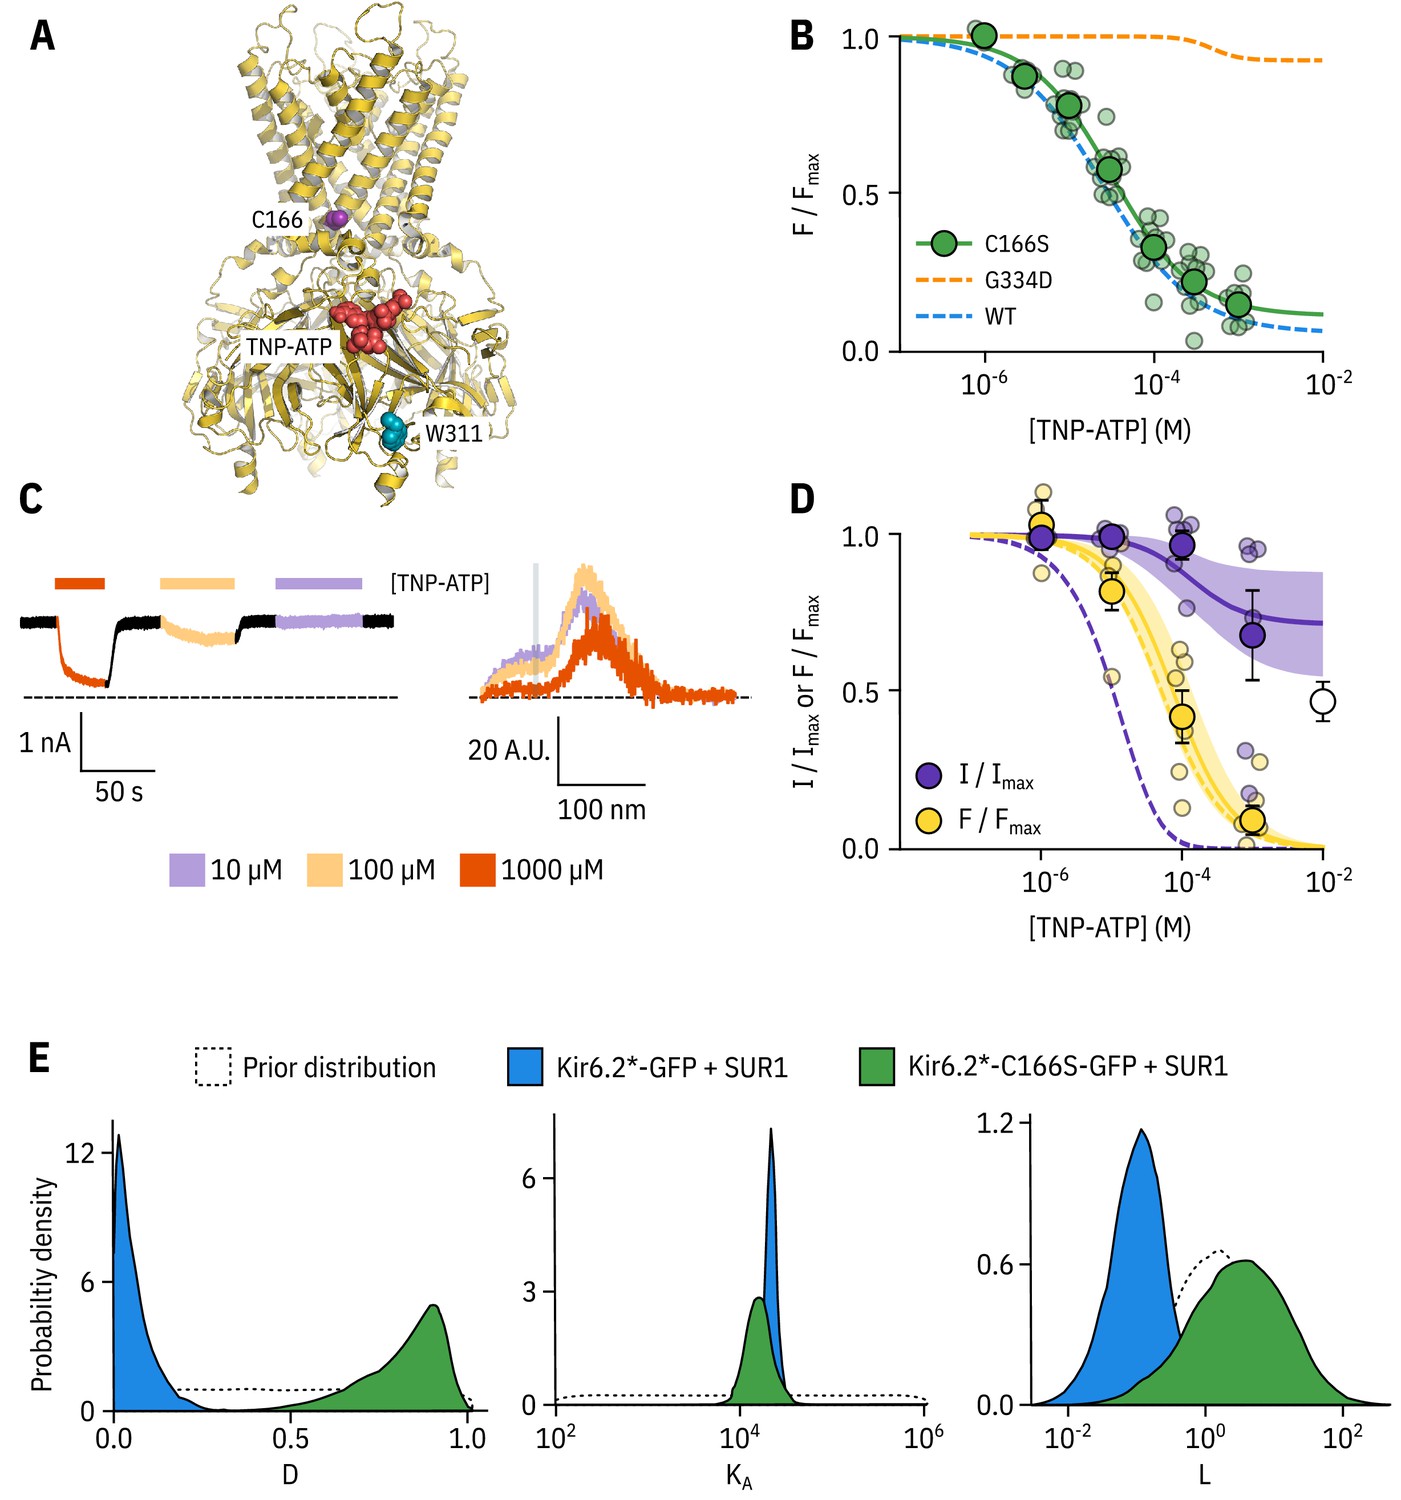
Kir6.2-C166S disrupts current inhibition, not nucleotide binding.
(A) Cartoon (from PDB accession #6BAA) showing the location of Kir6.2-C166 (purple) relative to the inhibitory nucleotide binding site (TNP-ATP from PDB accession #5XW6 shown in red). W311 is shown as blue spheres. (B) Concentration dependence of TNP-ATP binding to unroofed membrane fragments expressing Kir6.2*,C166S-GFP + SUR1 shown in green, expressed as quenching of ANAP fluorescence. The Hill fits shown previously for Kir6.2*-GFP + SUR1 and Kir6.2*,G334D-GFP + SUR1 are shown in blue and orange dashed curves, respectively. Kir6.2*,C166S-GFP + SUR1: , , , n = 12. (C) Representative current and fluorescence traces recorded simultaneously from an excised patch expressing Kir6.2*,C166S-GFP + SUR1. Exposure to different concentrations of TNP-ATP are shown by colour. (D) Concentration-response (n = 6) for TNP-ATP inhibition of Kir6.2*,C166S-GFP + SUR1 currents () and for quenching of ANAP fluorescence (). Data were fit with the MWC-type model. Solid curves represent the median fits and shaded areas indicate the 95% quantile intervals. Dashed curves represent the previous median fits of the MWC-type model to the Kir6.2*-GFP + SUR1 data from Figure 2D. Parameter estimates are reported in Table 3. The open data point represents current inhibition by ATP and was not included in the model fitting. (E) Posterior probability distributions for the full MWC-type model fit to Kir6.2*,C166S-GFP + SUR1 or Kir6.2*-GFP + SUR1 (data from Figure 2F) overlaid on the prior probability distribution.
Figure 3—figure supplement 1

AN MWC-type model predicts a nucleotide-insensitive current plateau for Kir6.2-C166S.
A. Representative current trace from an excised patch expressing Kir6.2*,C166S-GFP + SUR1 exposed to triethylamine (shown as shades of red) and ATP (shown in black). B. Concentration dependence of triethylamine inhibition for Kir6.2*-GFP + SUR1 (blue data points) or Kir6.2*,C166S-GFP + SUR1 (green data points) in excised patches. The solid curves are descriptive Hill fits to the data with set to 0. Kir6.2*-GFP + SUR1: , , n = 3, Kir6.2*,C166S-GFP + SUR1: , , n = 3. (C, D) Predictions of our full MWC-type model for a range of values of (C) or (D). Fluorescence quenching () is shown as solid curves and current inhibition () is shown as dashed curves. The blue curves represent values taken from the fit to Kir6.2*,C166S-GFP + SUR1 shown in Figure 3D rounded to the nearest significant figure. Notably, the model predicts that if nucleotide inhibition is shifted to the right of nucleotide binding, we should expect to see a current plateau proportional to the unliganded open probability of the channel.
Figure 3—figure supplement 2
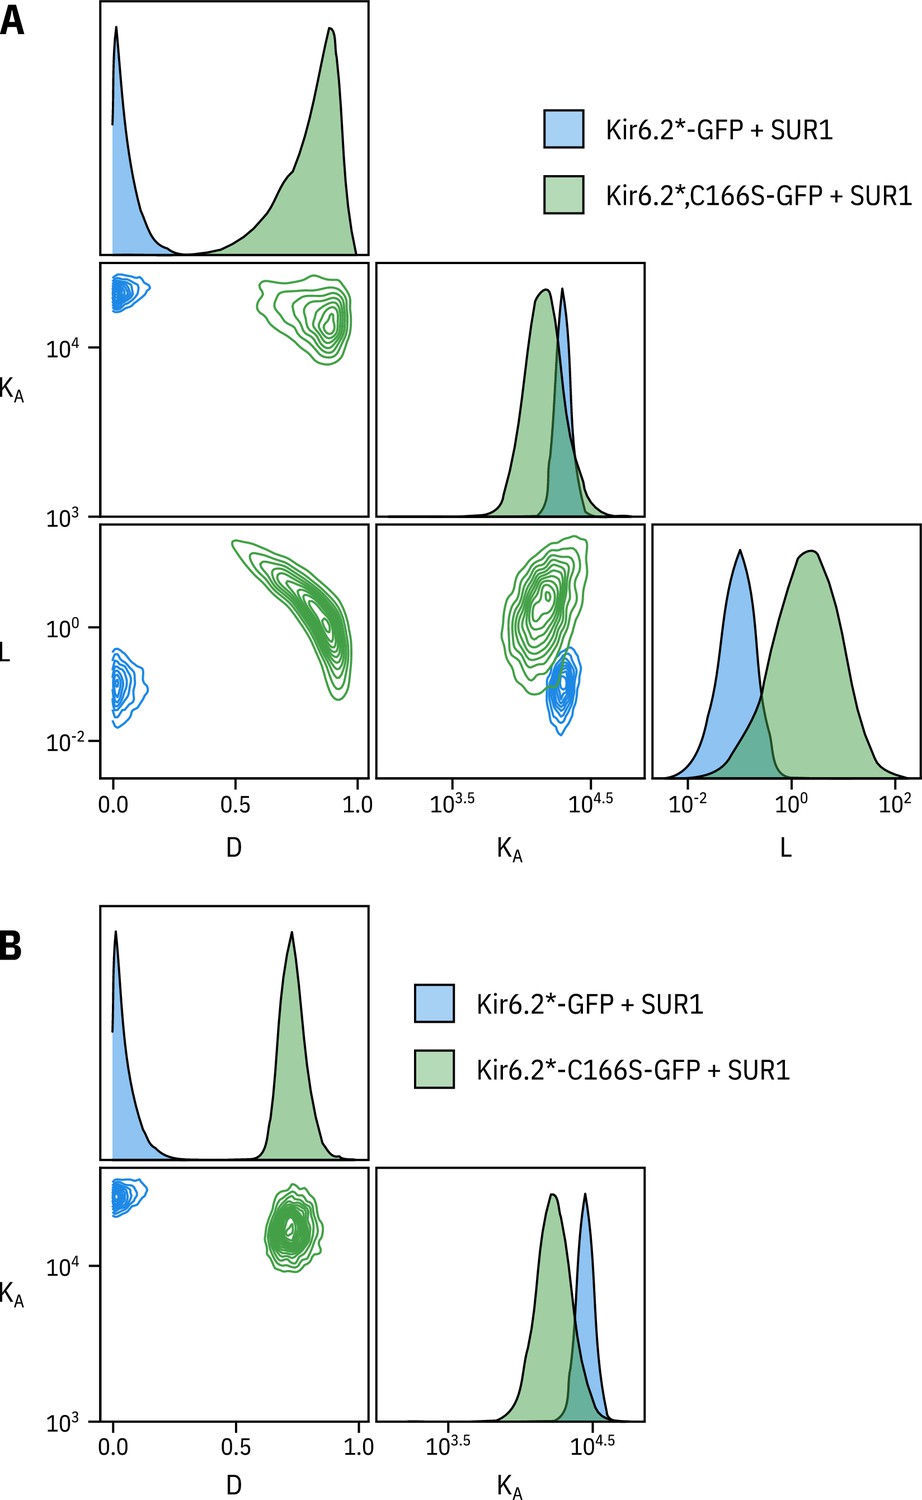
Fixing does not affect the other two parameters.
(A) Pairwise correlation plots of , and from the full MWC-type model fit to Kir6.2*-GFP + SUR1 and Kir6.2*,C166S-GFP + SUR1. (B) Pairwise correlation plots of and from the full MWC-type with fixed to 0.8 for Kir6.2*-GFP + SUR1 () or 6.0 for Kir6.2*,C166S-GFP + SUR1 ().
Figure 4 with 4 supplements

SUR1-K205 modulates both nucleotide affinity and inhibition of Kir6.2.
(A) Hydrophobic surface representation of Kir6.2 (yellow, PDB accession #6BAA) and SUR1 (blue, PDB accession #6PZI). Residue K205 on SUR1 is highlighted in pink. As this residue was built as an alanine in the structure, we used the mutagenesis tool in PyMol to insert the native lysine residue. A docked TNP-ATP molecule is shown in red. (B) Representative current and fluorescence traces acquired simultaneously from excised patches expressing Kir6.2*-GFP with SUR1-K205A or SUR1-K205E. (C,D) Concentration-response for TNP-ATP inhibition of currents () and for quenching of ANAP fluorescence () in excised inside-out membrane patches expressing Kir6.2*-GFP + SUR1-K205A (C, n = 9) or Kir6.2*-GFP + SUR1-K205E (D, n = 9). Data were fit to the MWC-type model. Solid curves represent the median fits and shaded areas indicate the 95% quantile intervals. Fits to Kir6.2*-GFP + wild-type SUR1 are shown as dashed curves. (E) Posterior probability distributions for the full MWC-type model fit to Kir6.2*-GFP co-expressed with wild-type SUR1 (fits from Figure 2), SUR1-K205A and SUR1-K205E overlaid on the prior probability distribution.
Figure 4—figure supplement 1
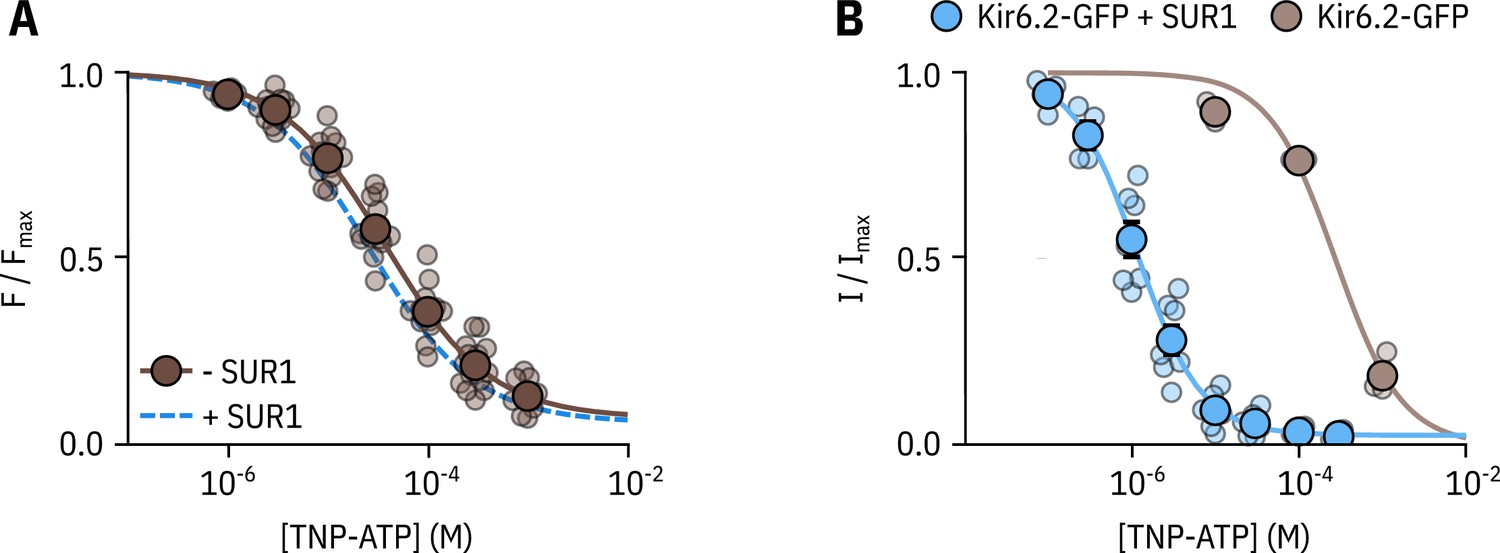
SUR1 affects the apparent affinity for nucleotide binding to Kir6.2.
(A) Concentration dependence of TNP-ATP binding to unroofed membrane fragments expressing Kir6.2*-GFP without SUR1 (brown), expressed as quenching of ANAP fluorescence. The smooth curve is a descriptive Hill fit. Kir6.2*-GFP (no SUR1): , , , n = 14. The Hill fit to Kir6.2*-GFP + SUR1 is shown as a blue dashed curve. (B) Concentration-response curve for TNP-ATP inhibition of Kir6.2-GFP (no ANAP label) with or without co-expression of SUR1, measured in excised, inside-out patches. Kir6.2-GFP + SUR1: , , , n = 7; Kir6.2-GFP (no SUR1): , , , n = 3.
Figure 4—figure supplement 2
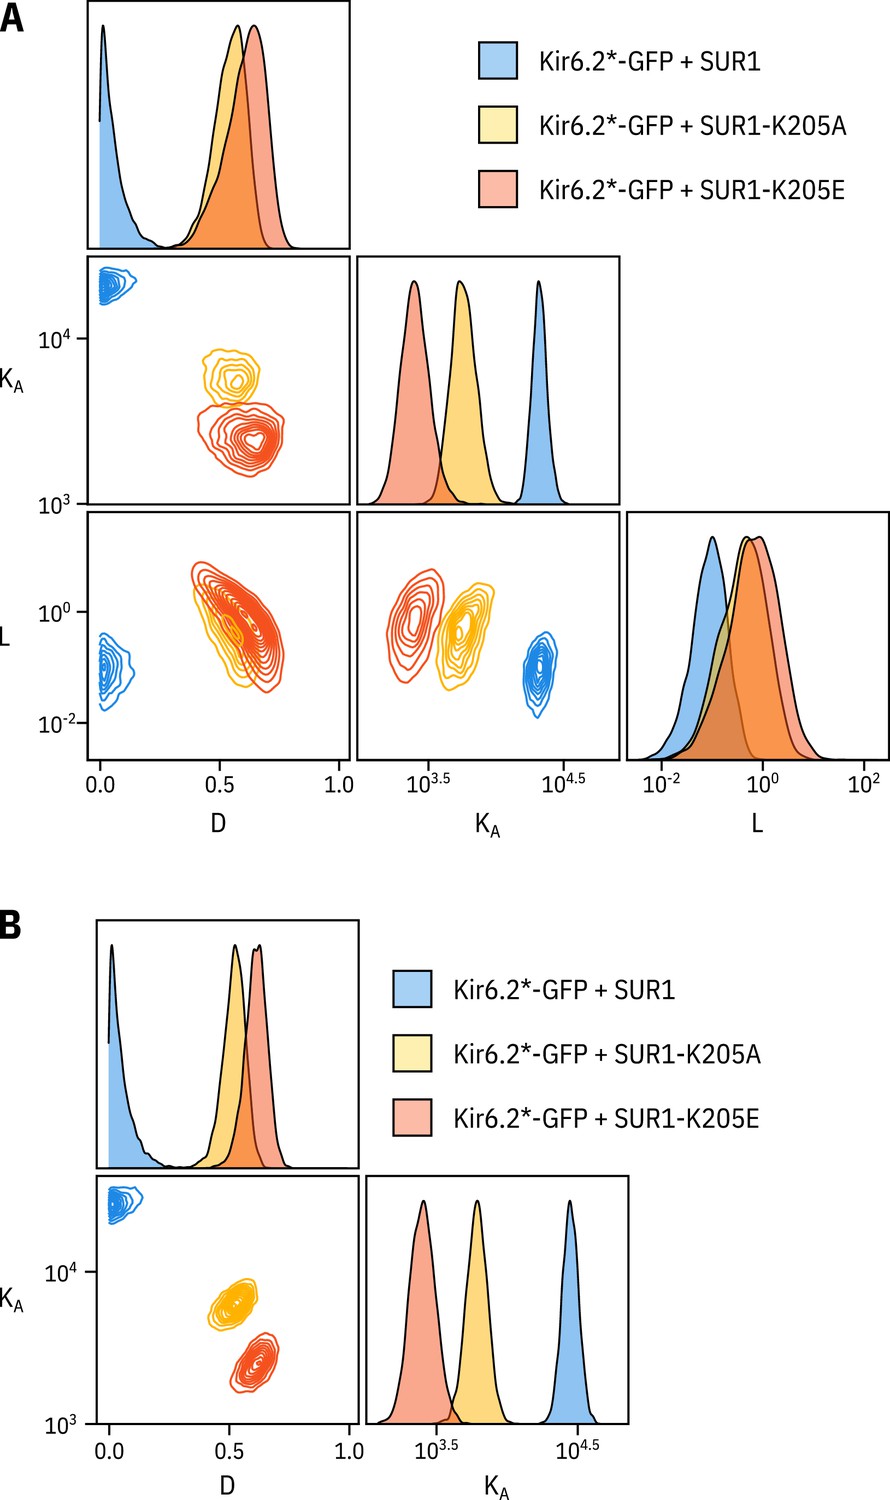
Fixing the parameter does not drastically affect the fits to the SUR1-K205A or SUR1-K205E data.
(A) Pairwise correlation plots of , and from the full MWC-type model fit to Kir6.2*-GFP co-expressed with wild-type SUR1, SUR1-K205A, and SUR1-K205E. (B) Pairwise correlation plots of and from the full MWC-type as above with fixed to 0.8 (Trapp et al., 1998).
Figure 4—figure supplement 3
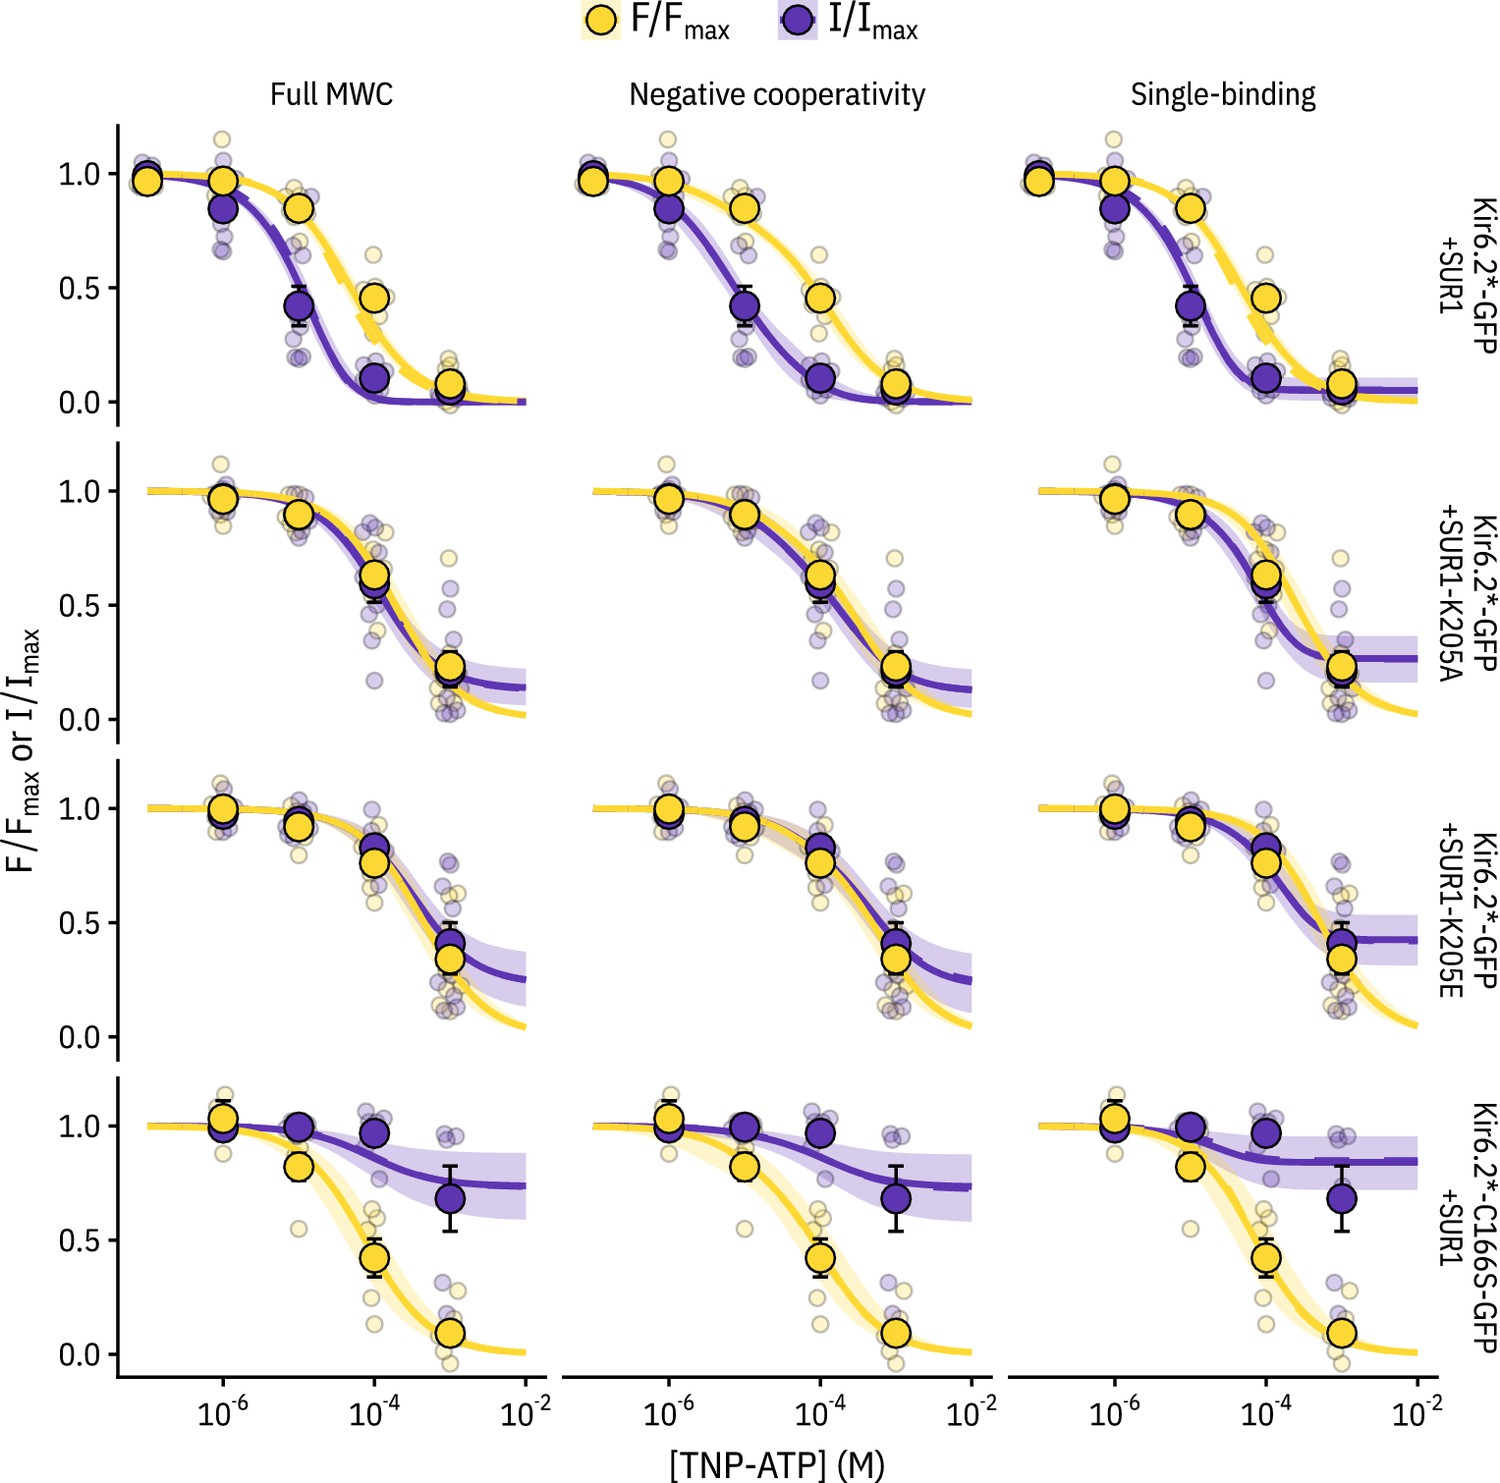
Comparing the ability of each model to explain the data.
Fits for each construct with each model (MWC-type, single-binding, negative-cooperativity) are displayed with the solid curve representing the median fit, the shaded area representing the 95% quantiles, and the dashed curve representing the median fit if the parameter is fixed (to 6.0 for Kir6.2*,C166S-GFP + SUR1 and to 0.8 for the other three constructs). As the two fits were very similar, the dashed curve mostly overlays the solid curve. The most notable differences between the fits are that the negative cooperativity model allows for non-sigmoidal curves, and the single-binding model predicts much larger plateaus of current at saturating concentrations of TNP-ATP than either of the other two models.
Figure 4—figure supplement 4
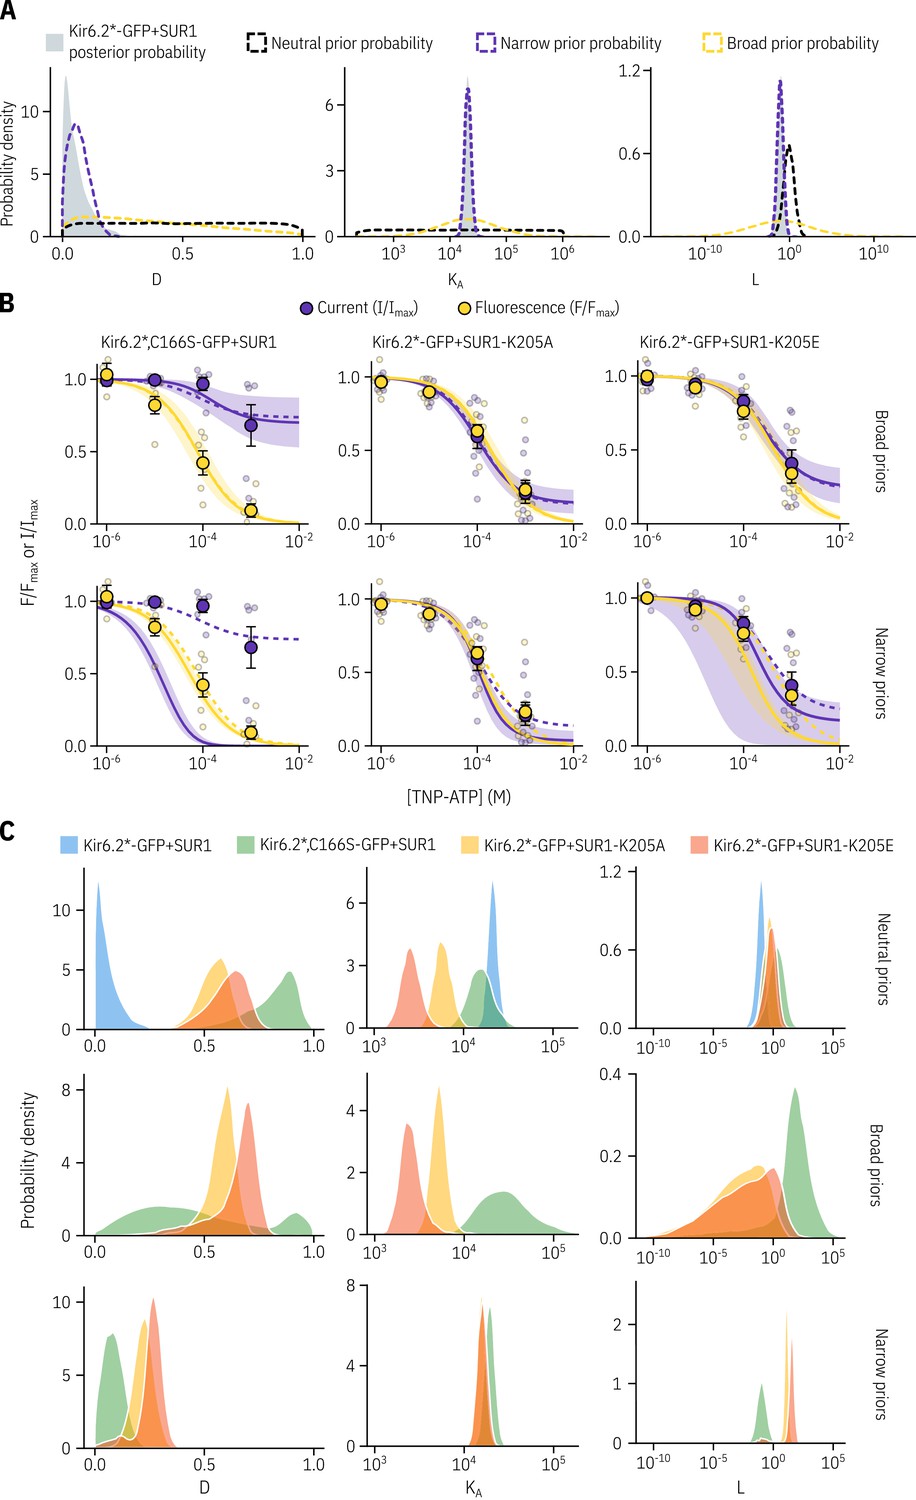
A neutral choice of priors allows for the best fits to the data.
(A) We generated more informative priors (dashed lines) based on our posterior probability distributions for Kir6.2*-GFP + SUR1 (in grey) by fitting the posterior distribution for each parameter with a normal distribution. In addition to this narrow informative prior, we generated a broad informative prior still centered on the Kir6.2*-GFP + SUR1 posterior probability density by increasing the standard deviation of the fitted normal distribution by a factor of ten. (B) Fits to the PCF data for all constructs tested using either the neutral priors reported earlier (shown as dashed lines), or priors based on the fits to Kir6.2*-GFP + SUR with the solid curves representing the median fit and the shaded area representing the 95% quantiles. (C) The posterior probability distributions corresponding to the fits shown in B are shown for each parameter.
Tables
Table 1
Hill fit parameters from unroofed membranes.
values and their standard errors are reported as . values are also provided as µM in parentheses.
| Fluorescence quenching | Construct | Term | Estimate | Standard error |
|---|---|---|---|---|
| TNP-ATP | Kir6.2*-GFP+SUR1 | −4.59 (25.7) | 0.05 | |
| n = 18 | 0.82 | 0.05 | ||
| 0.93 | 0.03 | |||
| Kir6.2*,G334D-GFP+SUR1 | −3.31 (490) | 2.23 | ||
| n = 9 | 2.63 | 17.70 | ||
| 0.08 | 0.26 | |||
| Kir6.2*,C166S-GFP+SUR1 | −4.50 (31.6) | 0.05 | ||
| n = 12 | 0.92 | 0.08 | ||
| 0.87 | 0.03 | |||
| Kir6.2*-GFP | −4.42 (38.0) | 0.05 | ||
| n = 14 | 0.83 | 0.05 | ||
| 0.92 | 0.03 |
Table 2
Hill fit parameters from excised patches.
and values and their standard errors are reported as . and values are also provided as µM in parentheses.
| Current inhibition | Construct | Term | Estimate | Standard error |
|---|---|---|---|---|
| ATP | Kir6.2-GFP + SUR1 | −4.20 (63.1) | 0.07 | |
| n = 3 | 1.28 | 0.21 | ||
| 0.99 | 0.06 | |||
| Kir6.2-GFP | −3.31 (490) | 0.05 | ||
| n = 2 | 1.15 | 0.12 | ||
| 0.93 | 0.03 | |||
| Kir6.2*-GFP + SUR1 | −4.10 (79.4) | 0.06 | ||
| n = 4 | 1.42 | 0.21 | ||
| 1.00 | 0.05 | |||
| TNP-ATP | Kir6.2-GFP + SUR1 | −5.93 (1.17) | 0.04 | |
| n = 7 | 1.14 | 0.11 | ||
| 0.97 | 0.02 | |||
| Kir6.2-GFP | −3.56 (275) | 0.64 | ||
| n = 3 | h | 1.09 | 0.85 | |
| 1.00 | 0.53 | |||
| Kir6.2*-GFP + SUR1 | −5.21 (6.17) | 0.10 | ||
| n = 9 | 0.92 | 0.18 | ||
| 0.96 | 0.05 | |||
| Kir6.2*,C166S-GFP + SUR1 | −3.11 (776) | 0.23 | ||
| n = 6 | 1.35 | 1.16 | ||
| 0.55 | 0.11 | |||
| Kir6.2*-GFP + SUR-K205A | −3.78 (166) | 0.45 | ||
| n = 9 | 0.75 | 0.30 | ||
| 1.00 | 0.29 | |||
| Kir6.2*-GFP + SUR-K205E | −3.20 (631) | 2.15 | ||
| n = 9 | 0.79 | 0.84 | ||
| 1.00 | 1.77 | |||
| Fluorescence Quenching | ||||
| TNP-ATP | Kir6.2*-GFP + SUR1 | −4.11 (77.6) | 0.09 | |
| n = 9 | 0.87 | 0.11 | ||
| 1.00 | 0.06 | |||
| Kir6.2*,C166S-GFP + SUR1 | −4.17 (67.6) | 0.23 | ||
| n = 6 | 0.84 | 0.27 | ||
| 1.00 | 0.14 | |||
| Kir6.2*-GFP + SUR-K205A | −3.69 (204) | 0.42 | ||
| n = 9 | 0.73 | 0.25 | ||
| 1.00 | 0.27 | |||
| Kir6.2*-GFP + SUR-K205E | −3.37 (427) | 1.10 | ||
| n = 9 | 0.74 | 0.47 | ||
| 1.00 | 0.79 |
Table 3
Fitted parameters for the MWC-type models.
, and their associated quantiles are reported as values.
| Full MWC | ||||
|---|---|---|---|---|
| Construct | Term | Estimate | 2.5% Quantile | 97.5% Quantile |
| Kir6.2*-GFP + SUR1 | −1.05 | −1.85 | −0.45 | |
| n = 9 | 0.04 | 0.00 | 0.19 | |
| 4.32 | 4.21 | 4.44 | ||
| Kir6.2*,C166S-GFP + SUR1 | 0.29 | −1.04 | 1.41 | |
| n = 6 | 0.84 | 0.52 | 0.95 | |
| 4.18 | 3.93 | 4.47 | ||
| Kir6.2*-GFP + SUR-K205A | −0.37 | −1.34 | 0.41 | |
| n = 9 | 0.55 | 0.39 | 0.65 | |
| 3.76 | 3.59 | 3.95 | ||
| Kir6.2*-GFP + SUR-K205E | −0.18 | −1.25 | 0.70 | |
| n = 9 | 0.62 | 0.42 | 0.74 | |
| 3.40 | 3.21 | 3.62 | ||
| Single-site | ||||
| Kir6.2*-GFP + SUR1 | −1.06 | −1.84 | −0.47 | |
| n = 9 | 0.05 | 0.01 | 0.10 | |
| 4.33 | 4.22 | 4.44 | ||
| Kir6.2*,C166S-GFP + SUR1 | 0.09 | −1.15 | 1.05 | |
| n = 6 | 0.70 | 0.29 | 0.91 | |
| 4.15 | 3.88 | 4.43 | ||
| Kir6.2*-GFP + SUR-K205A | −0.25 | −1.30 | 0.53 | |
| n = 9 | 0.18 | 0.06 | 0.32 | |
| 3.62 | 3.45 | 3.83 | ||
| Kir6.2*-GFP + SUR-K205E | −0.19 | −1.19 | 0.52 | |
| n = 9 | 0.30 | 0.13 | 0.47 | |
| 3.31 | 3.13 | 3.50 | ||
| Negative cooperativity | ||||
| Kir6.2*-GFP + SUR1 | −0.42 | −1.38 | 0.48 | |
| n = 9 | 0.15 | 0.02 | 0.29 | |
| 4.82 | 4.54 | 5.29 | ||
| 0.17 | 0.06 | 0.36 | ||
| Kir6.2*,C166S-GFP + SUR1 | 0.32 | −0.96 | 1.47 | |
| n = 6 | 0.83 | 0.50 | 0.94 | |
| 4.43 | 4.04 | 5.14 | ||
| 0.52 | 0.09 | 0.97 | ||
| Kir6.2*-GFP + SUR-K205A | −0.16 | −1.18 | 0.64 | |
| n = 9 | 0.52 | 0.32 | 0.64 | |
| 4.10 | 3.73 | 4.68 | ||
| 0.35 | 0.10 | 0.91 | ||
| Kir6.2*-GFP + SUR-K205E | −1.11 | 0.99 | ||
| n = 9 | 0.58 | 0.32 | 0.73 | |
| 3.71 | 3.34 | 4.41 | ||
| 0.45 | 0.10 | 0.96 |
Key resources table
| Reagent type (species) or resource | Designation | Source or reference | Identifiers | Additional information |
|---|---|---|---|---|
| Cell line | HEK-293T (H. sapiens) | LGC Standards (ATCC CRL-3216) | ||
| Transfected construct (Escherichia. coli) | pANAP | Addgene | ||
| Transfected construct | pcDNA4/TO | Addgene | ||
| Transfected construct (Aequorea victoria) | pCGFP_EU | Gouaux Laboratory (Vollum Institute, Portland OR USA) | ||
| Transfected construct (Homo sapiens) | peRF1-E55D | Chin Laboratory (MRC Laboratory of Molecular Biology, Cambridge UK) | ||
| Antibody | Anti-HA High Affinity; Rat monoclonal antibody (clone 3F10) | Roche | (Roche Cat# 11867423001, RRID:AB_10094468) | (1:1000) |
| Antibody | Peroxidase-AffiniPure Goat Anti-Rat IgG (H + L) antibody | Jackson ImmunoResearch Labs | (Jackson ImmunoResearch Labs Cat# 112-035-003, RRID:AB_2338128) | Western blots: (1:20,000) Surface expression: (1:2000) |
| Chemical compound, drug | trinitrophenyl-ATP (TNP-ATP) | Jena Bioscience (Jena, Germany) | ||
| Chemical compound, drug | L-3-(6-acetylnaphthalen-2-ylamino)−2-aminopropionic acid | Asis Chemicals (Waltham, MA) |
Additional files
Download links
A two-part list of links to download the article, or parts of the article, in various formats.
Downloads (link to download the article as PDF)
Open citations (links to open the citations from this article in various online reference manager services)
Cite this article (links to download the citations from this article in formats compatible with various reference manager tools)
Nucleotide inhibition of the pancreatic ATP-sensitive K+ channel explored with patch-clamp fluorometry
eLife 9:e52775.
https://doi.org/10.7554/eLife.52775


