Dynamics of pattern formation and emergence of swarming in Caenorhabditis elegans
- Bio-Medical Sciences and Engineering Program, Koç University, Sarıyer, Turkey
- Department of Physics, Koç University, Sarıyer, Turkey
- Koç University Surface Science and Technology Center, Koç University, Sarıyer, Turkey
- Koç University Research Center for Translational Medicine, Koç University, Sarıyer, Turkey
Figures
Figure 1 with 8 supplements
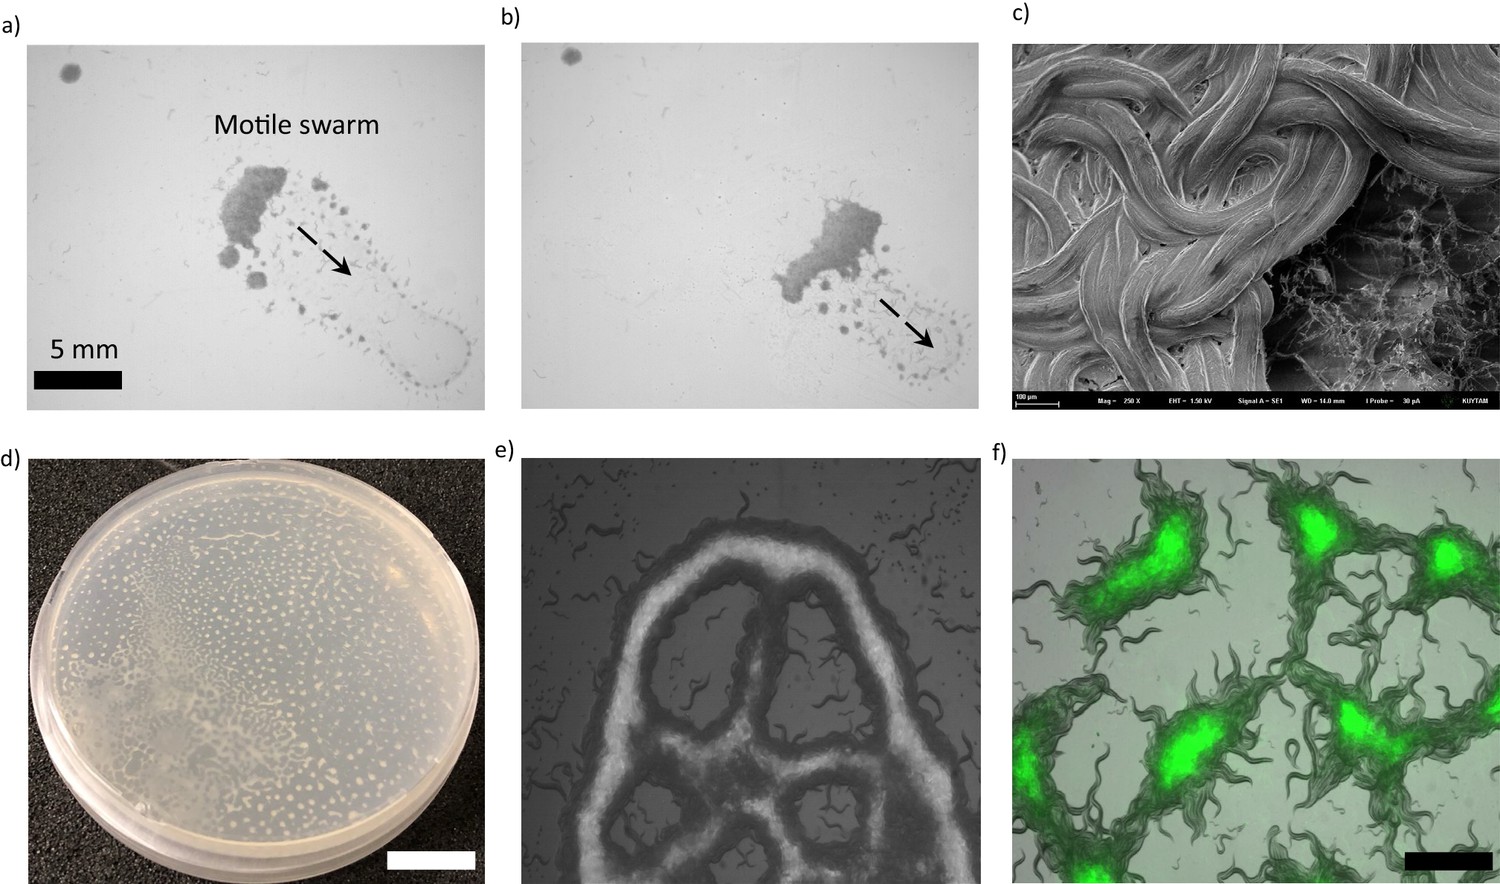
Collective response and pattern formations in C. elegans.
(a, b) Thousands of animals collectively swarm on a bacterial lawn. (a) While searching for food, worms aggregate around the edge of the bacterial lawn. Small aggregates merge and form a massive swarm. (b) Swarming body eventually gains motility and moves across the lawn while consuming the bacteria. (c) A cryo-SEM image of the swarming body. The heads and the tails of the animals are buried, and the bodies extend on the surface of the swarm. (d, e) Sample images of Turing-like patterns formed by animals on an agar surface under various conditions, such as starvation-induced and on a biofilm. The magnified version of the image is given in the supplementary information. Scale bar, 1 cm (f) Fluorescent image of worms aggregating near the GFP-labeled bacteria. Due to the capillary effect and diffusion of bacteria, worms concentrate the bacteria within the aggregates. Scale bar, 1 mm.
Figure 1—figure supplement 1
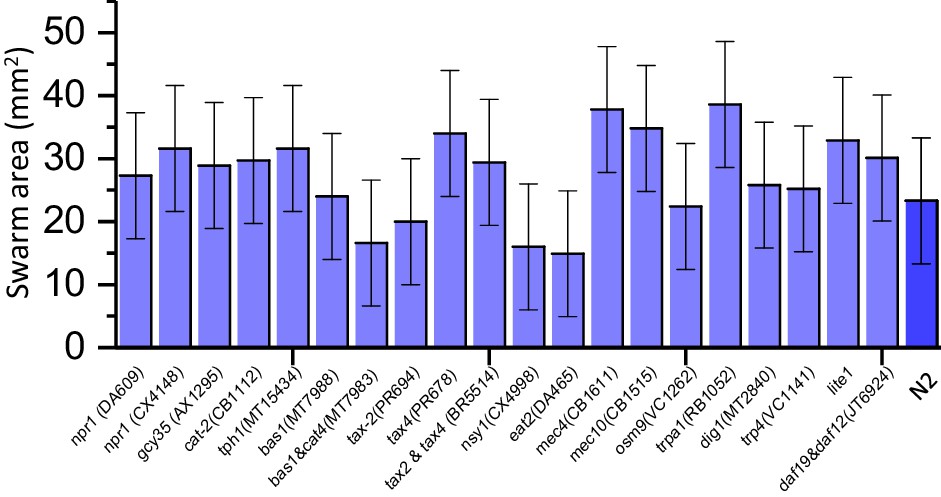
Average swarm area formed by different mutant strains.
Error bar indicates the standard error of measurement. For each experiment, 3000 animals were used. Large variations in the swarm area are originating from the random spreading of worms during the drying process. For N2 animals swarming experiments were repeated 10 times to verify their collective behavior.
Figure 1—figure supplement 2
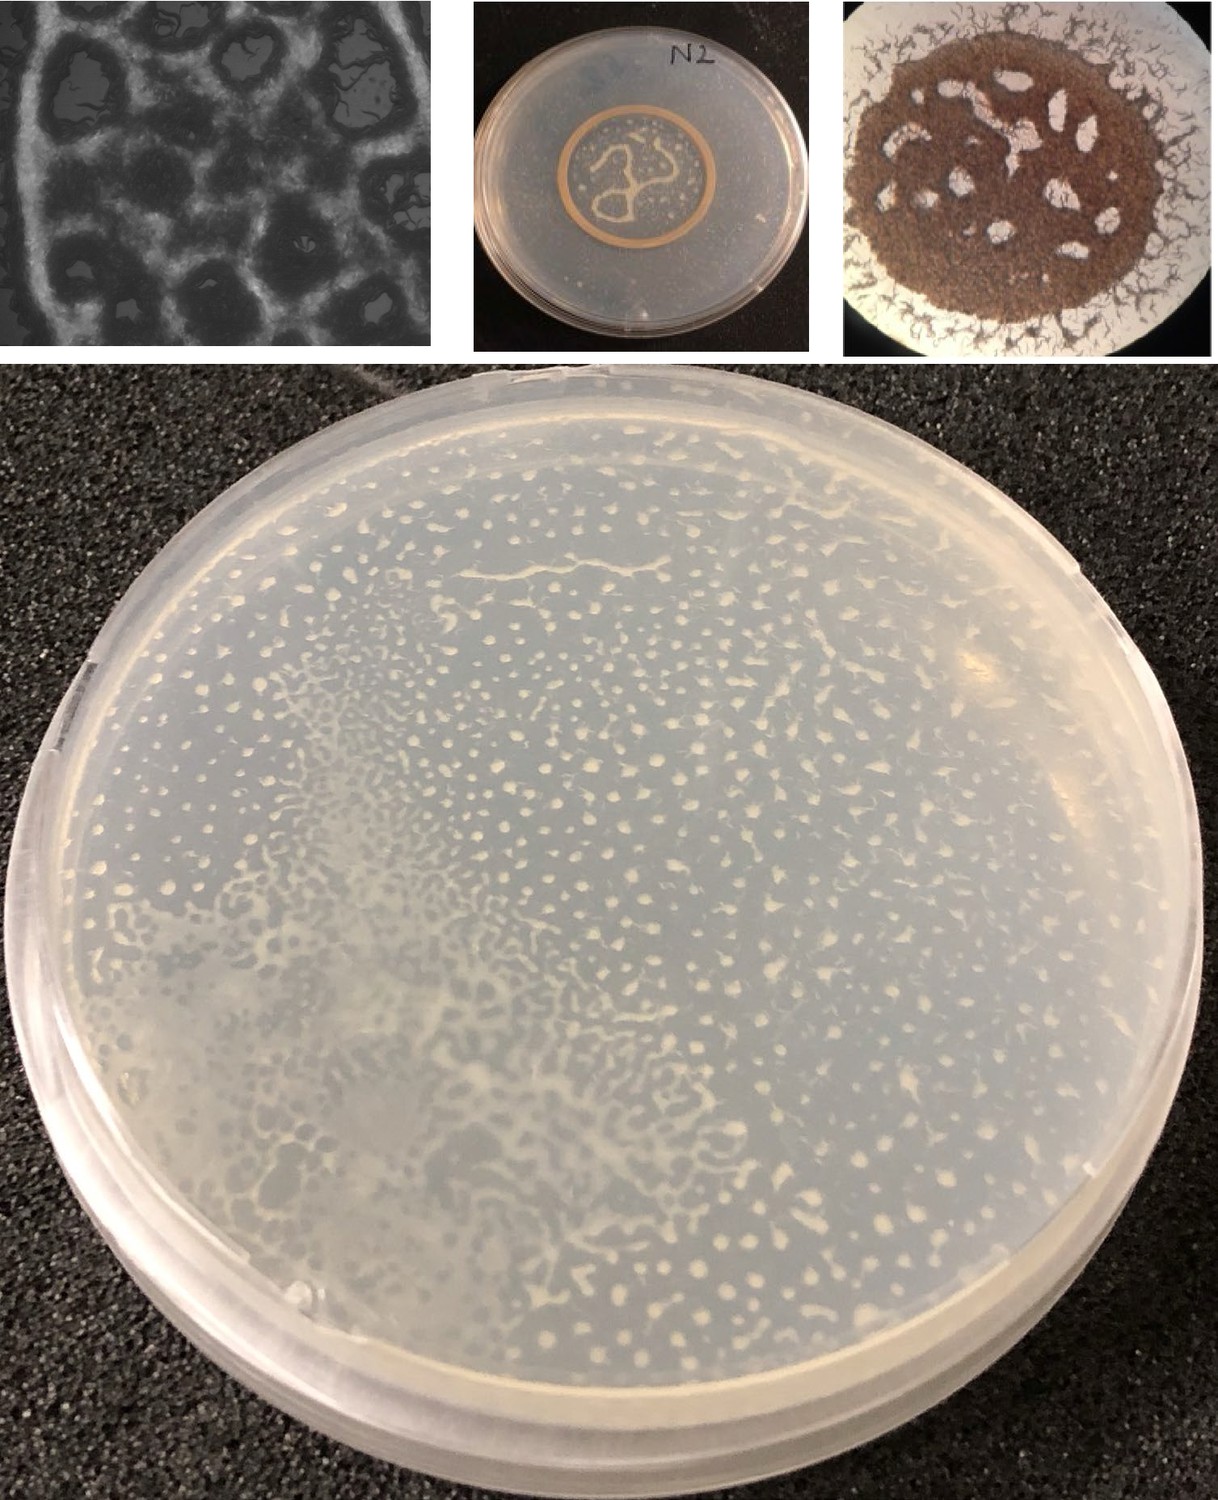
Sample patterns formed under different bacterial conditions.
Figure 1—figure supplement 3
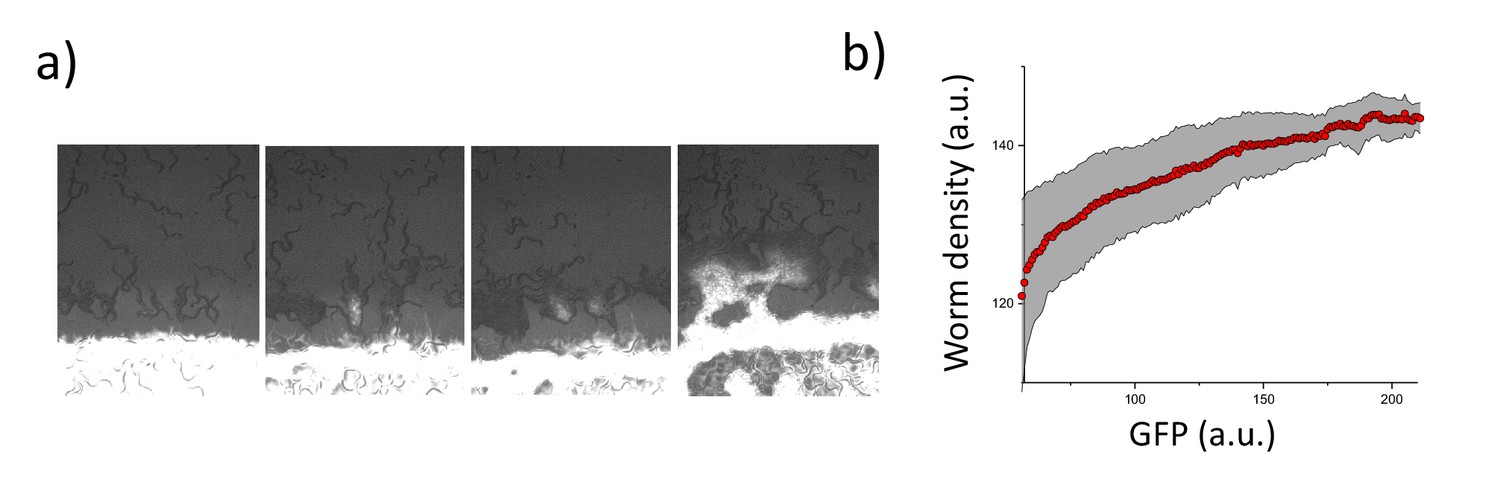
Worm density and bacterial concentration.
(a) Accumulation of worms around the lawn and the diffusion of GFP-labeled bacteria (bright white color) into the worm aggregates. (b) Worm density vs GFP signal.
Figure 1—video 1
Emergence of swarming response of npr-1 mutant around a GFP labeled bacterial lawn.
GFP-labeled bacteria shows the concentration of the bacteria within the aggregates. Small social feeding aggregates appear across the lawn.
Figure 1—video 2
Response of the swarm to the placement of cover glass.
A cover glass blocks the oxygen penetration from the top. The animals dissociate and accumulate around the glass-air interface.
Figure 1—video 3
Measurement of O2 diffusion on an agar surface.
The solution of ruthenium-based oxygen indicator was placed on the agar surface. Na2SO3 containing an agar chunk was placed on the surface. The fluorescence signal indicates the depletion of oxygen on the surface.
Figure 1—video 4
Accumulation of worms around Na2SO3 containing agar chunk.
Na2SO3 can decrease the oxygen on the surface liquid. Instead of bacterial suspension chemical-based depletion can also initiate the accumulation of the worms around the chunk.
Figure 1—video 5
Response of npr-1 animals on very thick bacterial lawn.
The thick bacterial lawn was achieved by adding yeast extract to the NGM plate during the preparation process. Animals do not form aggregates. The central region of the video becomes thick and animals avoid this thick region of the lawn. Time scale shows day: hr: min: s.
Figure 2 with 4 supplements
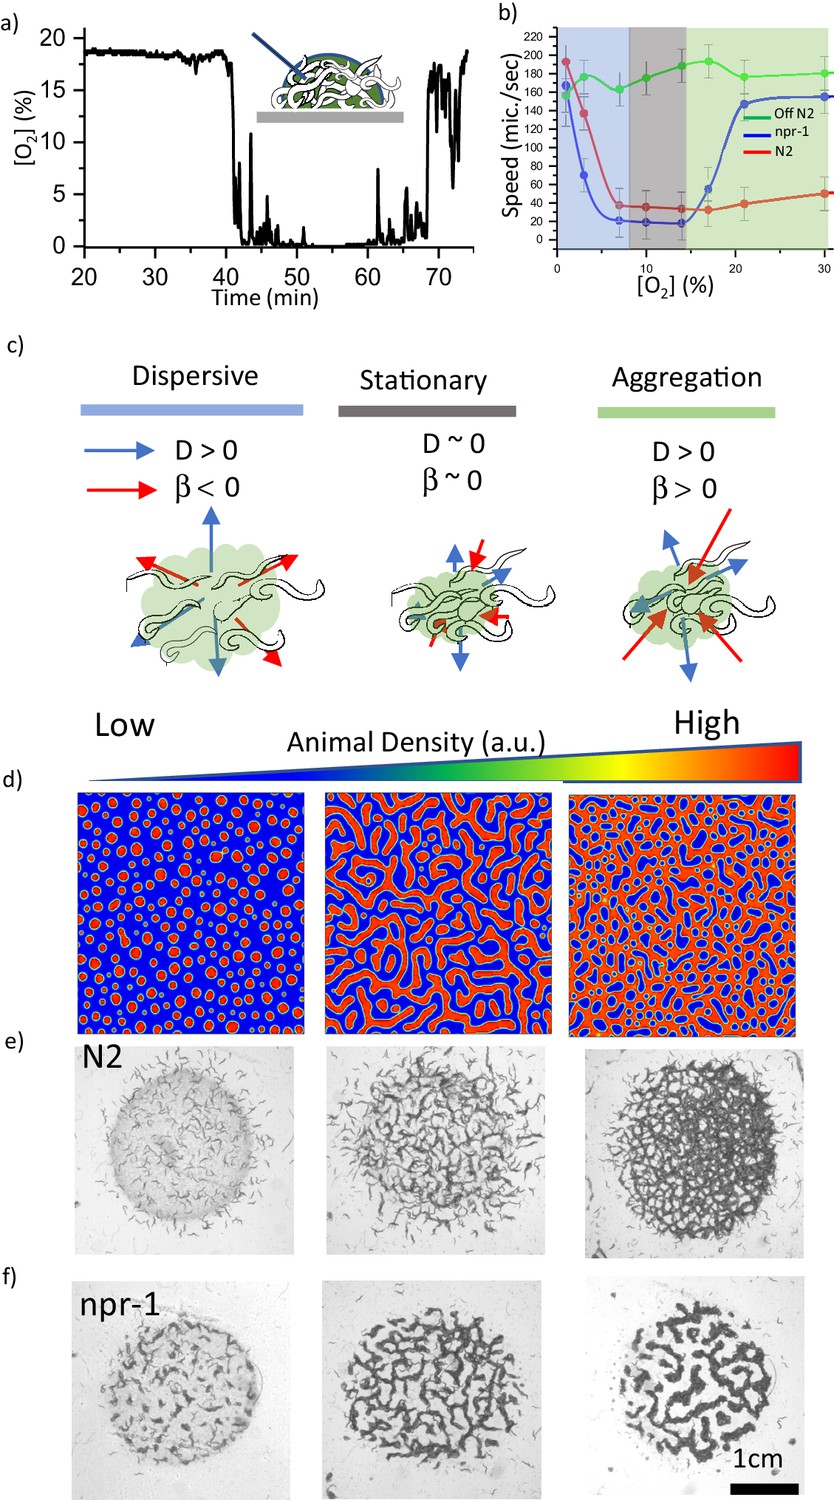
Oxygen sensitivity and the dynamics of pattern formation.
(a) Accumulation of bacterial suspension depletes oxygen in worm aggregates. Oxygen levels measured by the fiber optic sensor while the swarm passes through the sensor. Initially fiber optic sensor records ambient [O2] on the surface and the sudden drop is originating from the complete coverage of the fiber by the swarm body. (b) Oxygen-dependent motility of animals. The average speed of the worms as a function of ambient oxygen. The slope of the curve defines the aerotactic response of the animals. The comparison of velocity profiles of N2 (red) (on food), npr-1(blue) (on food), and off-food-N2 (green) response show the difference between the strains. Colored regions indicate the dispersive, stationary and aggregation phases. Error bar indicates the s.e.m. = ± 18 μm/s. For each experiment, 25 individual animals were imaged. Measurement error is defined by the error in image processing steps. (c) Schematic representation of each phase. The competition between animal dispersion (D) and aerotactic response (β) defines the collective behavior of worms. (d) Simulation results of the model at time 10 min after randomization of the patterns with various initial animal densities. The pattern formation strongly depends on worm density. At low density, worms create clusters. As the worm density increases, clusters converge to stripes and hole patterns. (e, f) Experimental results of density-dependent pattern formation. (e) At low worm densities (500 worms/cm2), N2 worms do not form patterns. As the density increases, we observed stripes (2000 worms/cm2) and holes (6000 worms/cm2). (f) The strong aerotactic response of npr-1 strain enables worms to form patterns even at low densities. An increase in the worm density causes a change in the instability conditions and tunes the patterns. Scale bar, 1 mm.
Figure 2—figure supplement 1
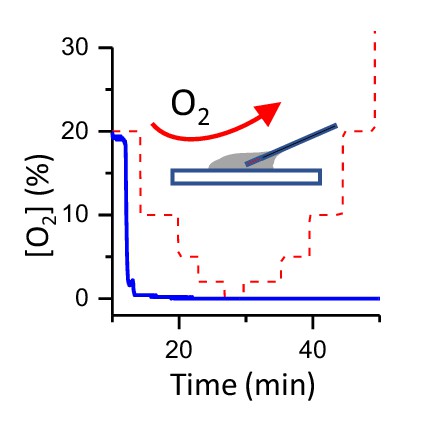
Oxygen measurement in a bacterial suspension[O2] in a bacterial suspension as a function of time (in blue).
The bacteria deplete O2. [O2] does not depend on the ambient oxygen level (in red). Initially fiber optic sensor records ambient [O2] and the sudden drop is originating from the complete insertion of the fiber into a bacterial suspension.
Figure 2—figure supplement 2
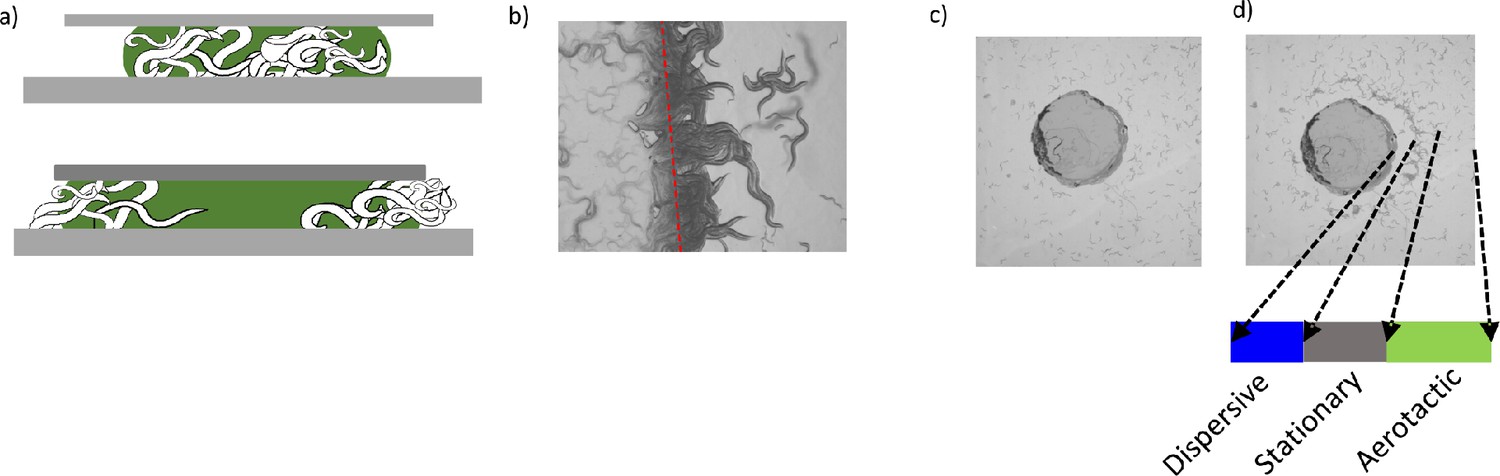
Contributions of surface penetration and lateral diffusion of oxygen.
(a) Schematic representation of a swarming body before (top) and after (bottom) the covering with a glass slide. Blocking oxygen penetration dissociates the swarm structure. (b) Dispersing animals accumulates around the glass-air interface where animals sense the sudden increase in [O2]. (C) Na2SO3 containing agar chunk and d) accumulation of worms around the oxygen-depleted region.
Figure 2—figure supplement 3
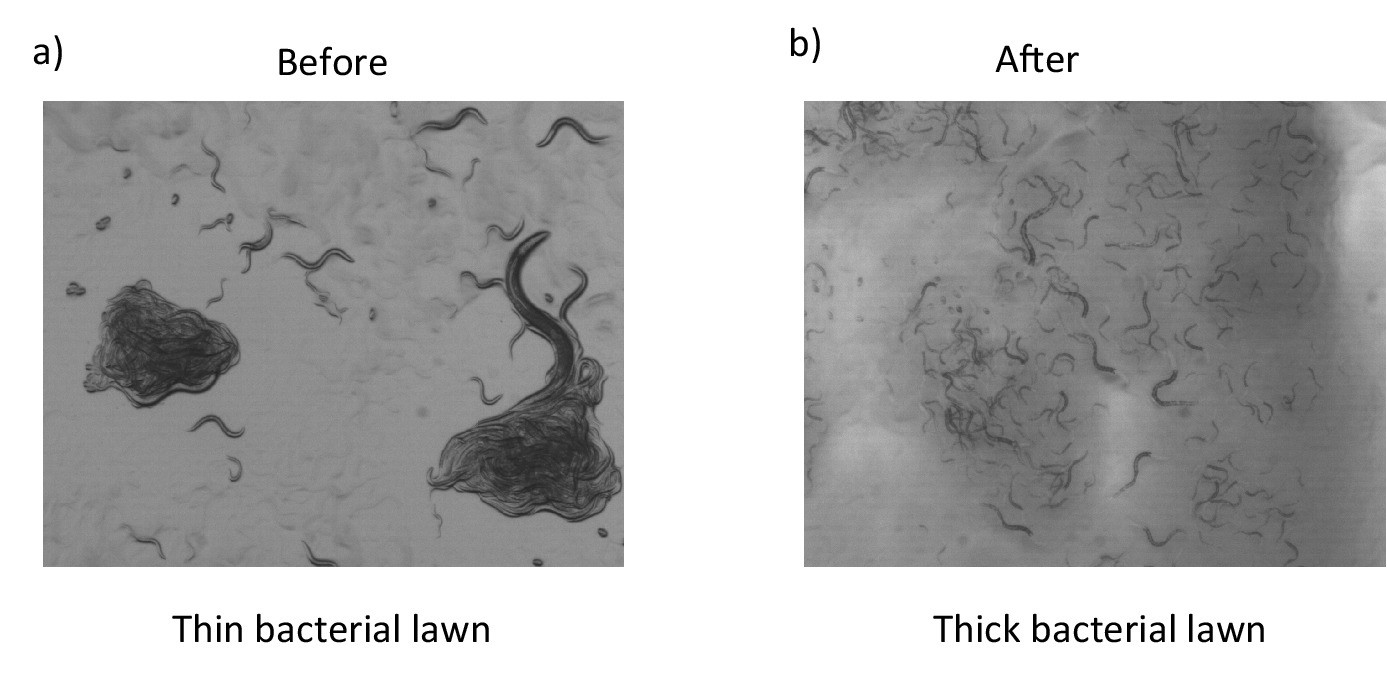
Effects of thick bacterial lawn.
Aggregation behaviors of npr-1 worms on a thin (a) and thick (b) bacterial lawn. npr-1 animals do not form clusters on a thick bacterial layer.
Figure 2—figure supplement 4
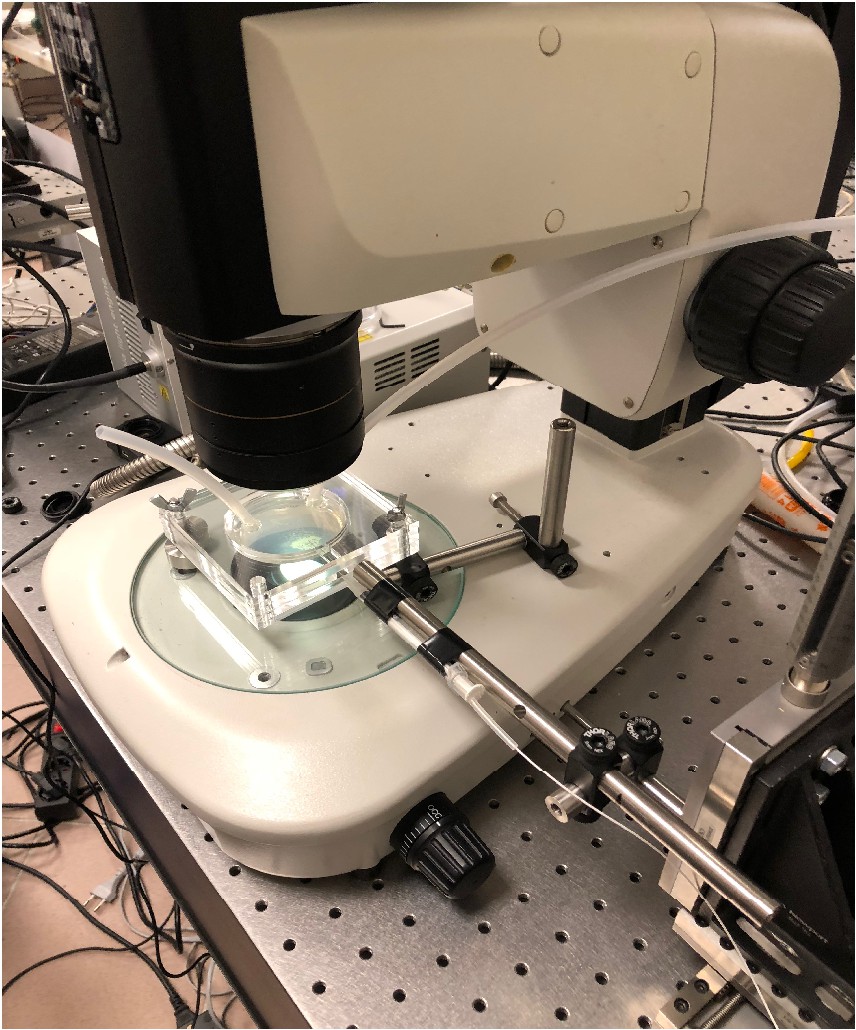
Imaging system.
Plexiglass swarm chamber was used to set ambient [O2]. Simultaneously, the fiber optic oxygen sensor can be inserted into the chamber to record [O2] in the swarm fluid.
Figure 3 with 4 supplements
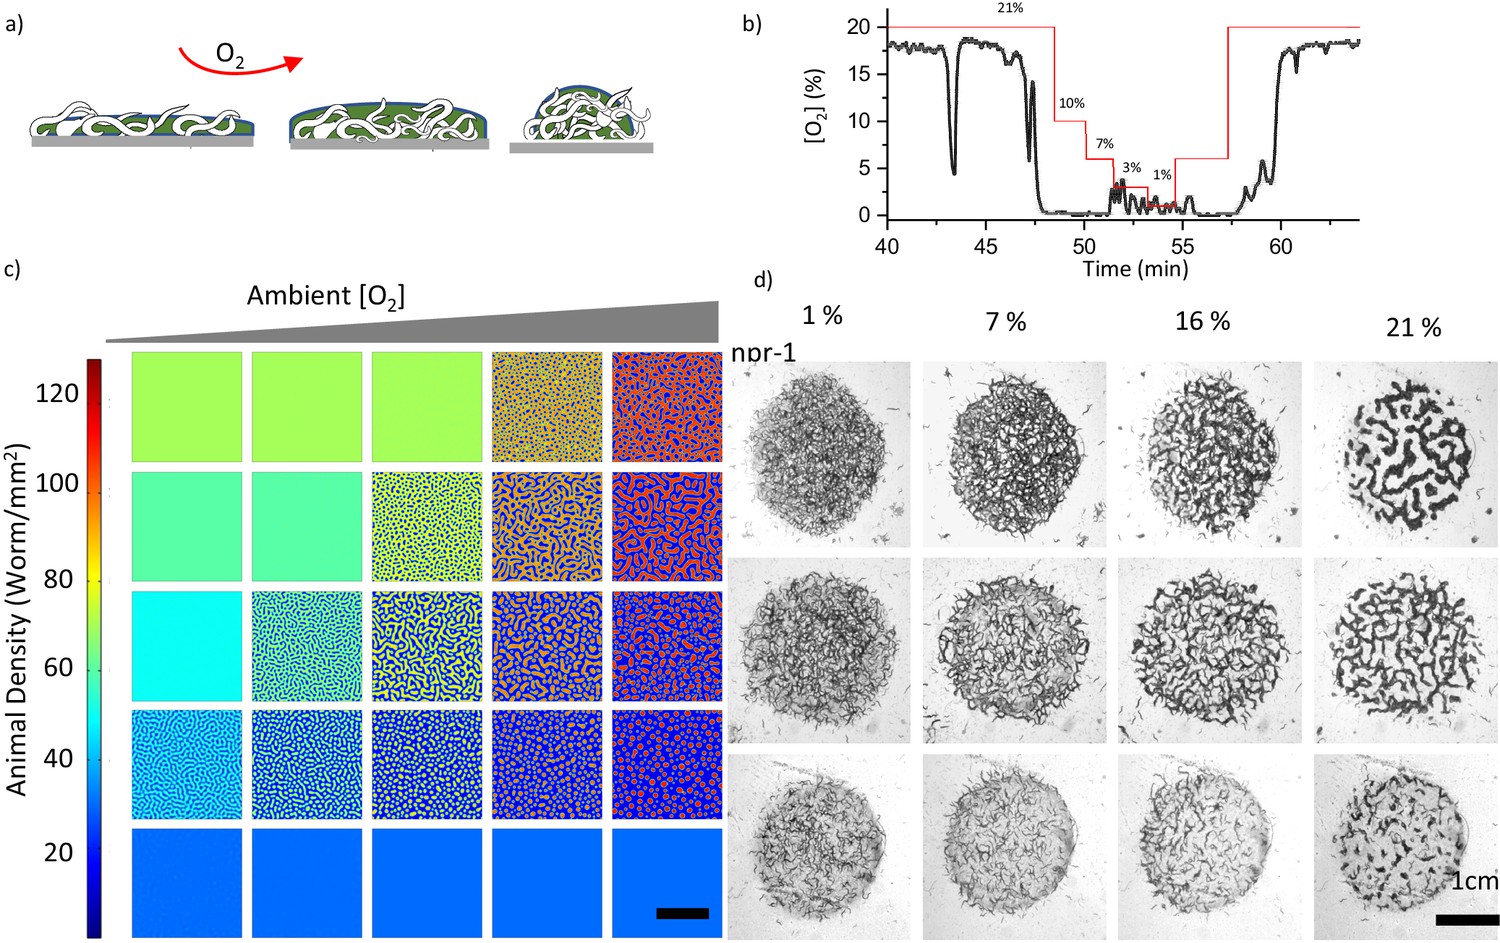
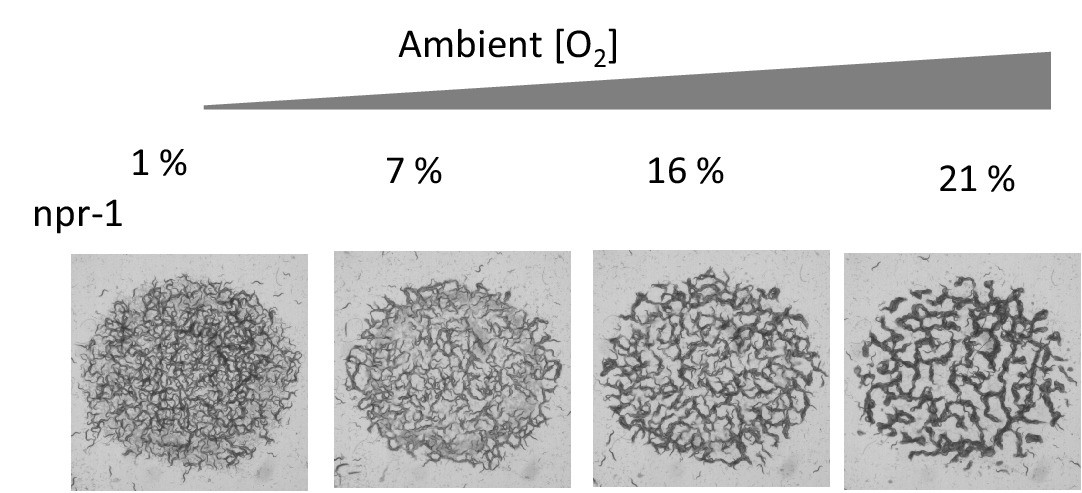
Combinatorial effect of ambient oxygen and worm density.
(a) Schematics show the response of worm aggregates to changing ambient oxygen levels. As oxygen level increases, the size of the clusters shrink and form circular aggregates which balance the oxygen penetration and diffusion. (b) Measured oxygen concentration in worm aggregates. The dashed red line shows the ambient oxygen level. Error bar indicates the s.e.m. = ± 0.1% (c, d) Simulation and experimental results of pattern formation under various worm densities and ambient oxygen levels. Patterns are formed when the instability criterion is satisfied. The instability zone is bounded by the uniform stable population. Scale bar, 1 cm. Image snapshots representing simulation results are taken at time 10 min after randomization of the patterns. Worm densities vary between 5–60 worms / mm2 (Martínez et al., 2016) in the experiments.
Figure 3—figure supplement 1
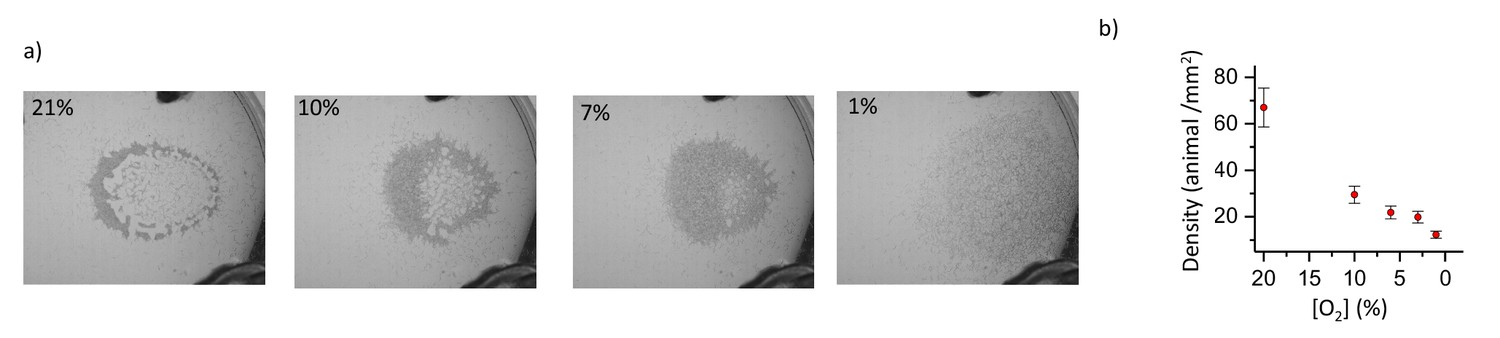
Response of the swarm to changing oxygen.
(a) Snapshots show the response of the swarm to changing ambient [O2]. As ambient [O2] decreases swarm tunes its density by increasing the total surface area. (b) Animal density in the swarm as a function of ambient [O2].
Figure 3—figure supplement 2
Sample patters formed by npr-1, under different oxygen levels.
Figure 3—figure supplement 3

Sample patterns formed by N2, under different oxygen levels.
Figure 3—figure supplement 4

Simulation results of worm density and oxygen profiles through the crossection of the clusters.
Simulation parameters were chosen to acquire a few worm thick interface width.
Figure 4 with 3 supplements
Coarsening event and the emergence of swarming behavior.
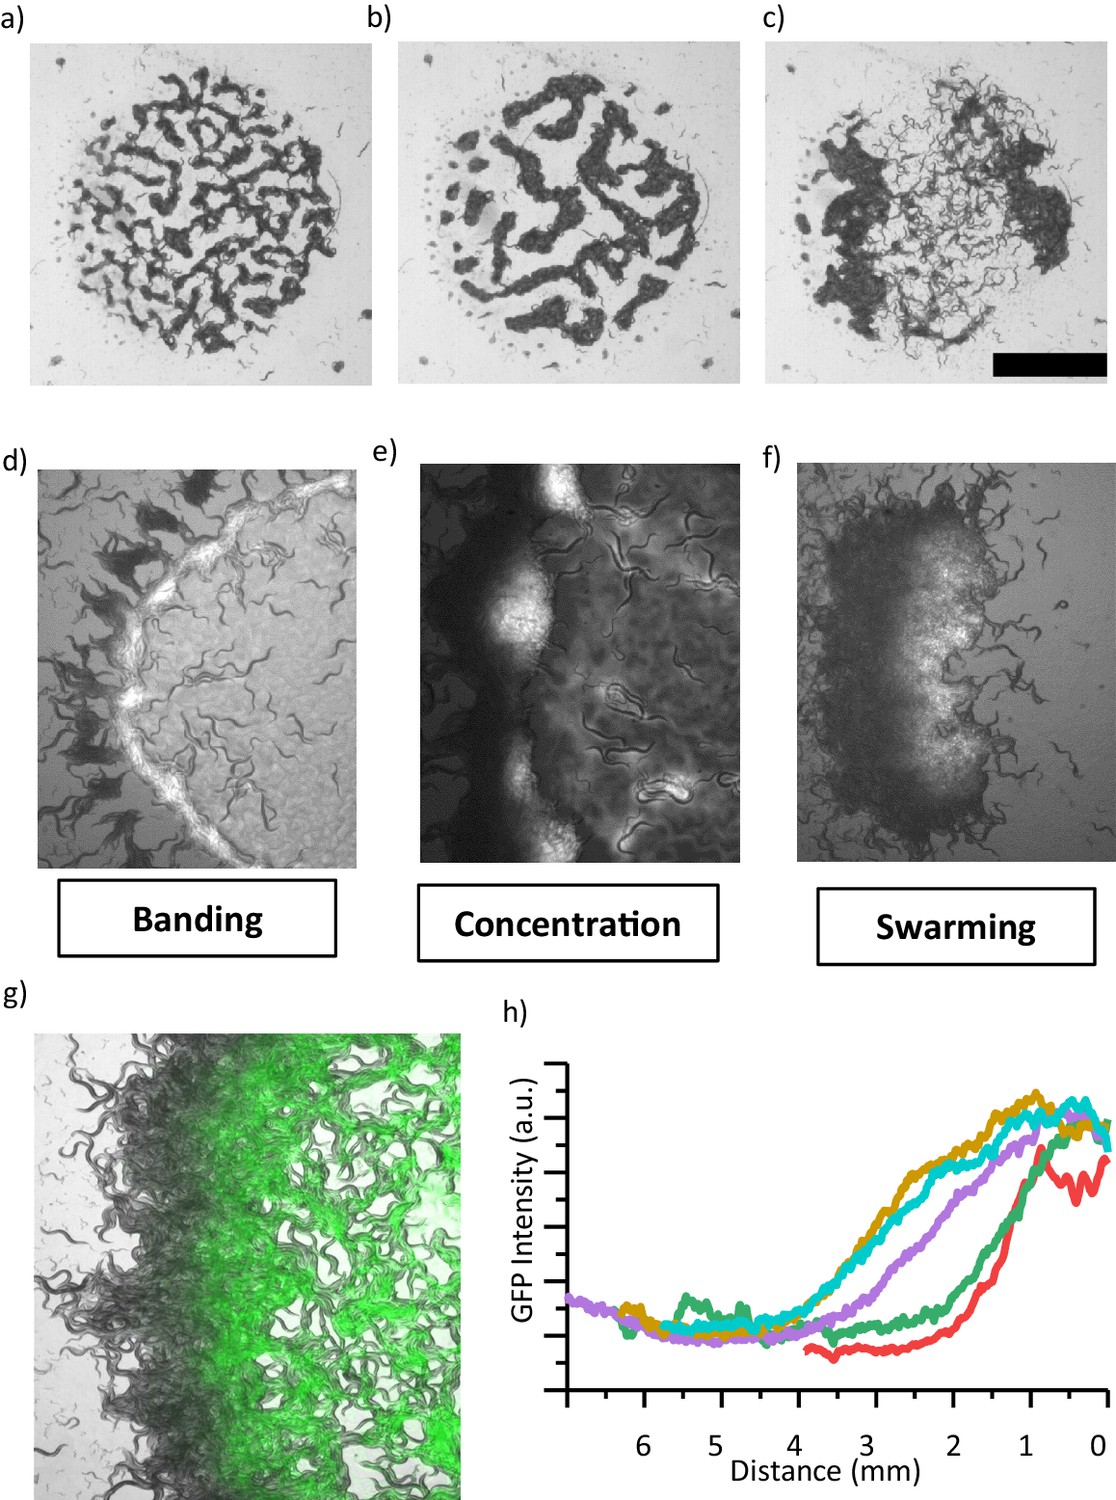
(a, b, c) After the formation of patterns, animals locally consume bacteria which eventually increases the motility of animals. (b) Further, patterns merge and coarsen. (c) Consumption of food eventually results in the formation of a large aggregate which resembles the swarming body. Scale bar, 1 cm. (d, e, f) Different stages of a swarming response observed during food search behavior in a dense population. (d) Worms accumulate around the lawn. Unlike isolated worms, diffused bacteria cause the worms to slow down and then the worms form a band around the edge of lawn which eventually converges to aggregates. (e) Small aggregates concentrate bacteria and further accumulate the incoming worms. Consumption and diffusion of bacteria from the lawn leads to a bacterial gradient within the aggregate. (f) Following the formation of a gradient, large aggregate gains motility. The swarm moves through the lawn until finishing the entire lawn and then dissociates. (g) Superposition image of swarming animals and GFP-labeled bacteria indicating the gradient formation across the swarm. (h) A gradient profile gradually extends into the swarm at different time points.
Figure 4—figure supplement 1
Gradient profile of bacterial concentration.
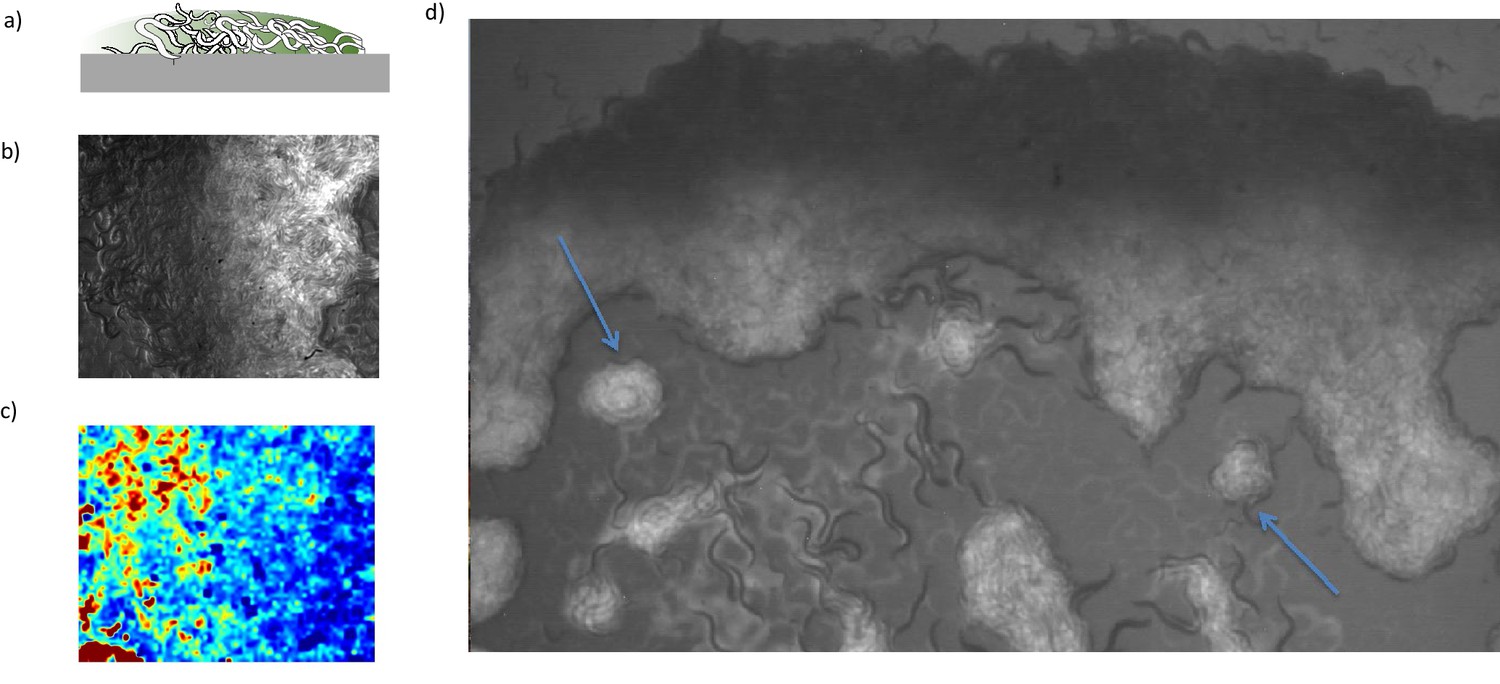
(a) Schematic of a cross-sectional view of the swarm with bacterial diffusion from the leading edge. The gradient profile of bacterial concentration develops across the swarming body. (b) The fluorescence image of the swarm is indicating bacterial concentration. (c) PIV signal measured across the swarm. The velocity of the worms increases towards the back. (d) Small clusters (blue arrows) show uniform GFP signal and do not form a gradient profile.
Figure 4—figure supplement 2
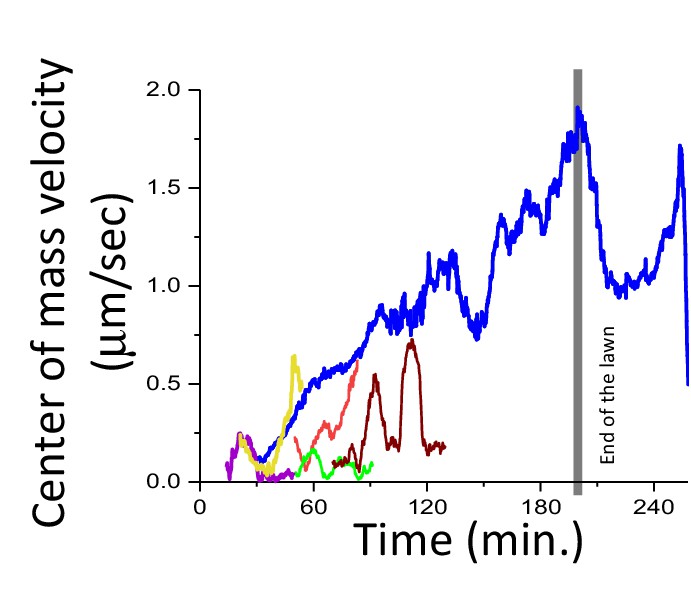
Center of mass velocities of the swarm (blue) and small aggregates (colored) as a function of time.
Small aggregates are merging to a large swarm body.
Figure 4—figure supplement 3
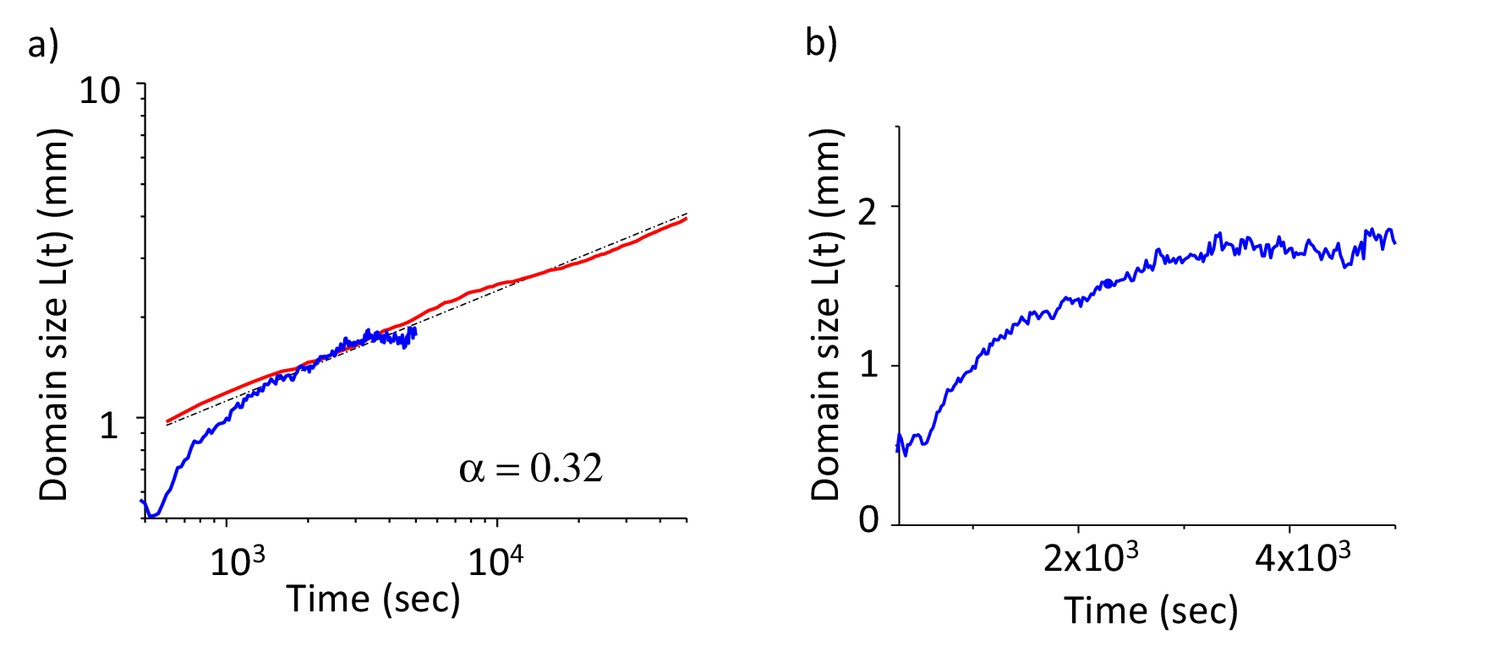
Coarsening dynamics of both simulation and experimentally measured worm clusters in (a) logarithmic and (b) linear plots.
Red: Simulation, Blue: experimental and black: fits. Simulation results show universal growth dynamics with α = 0.32, experimentally measured domain sizes reach saturation around 2 mm. We measured the width of the clusters in the direction of swarming. The length of the swarming body is defined by the size of the bacterial lawn. This limit corresponds to the decay length of the bacteria in a large worm cluster.
Figure 5 with 1 supplement
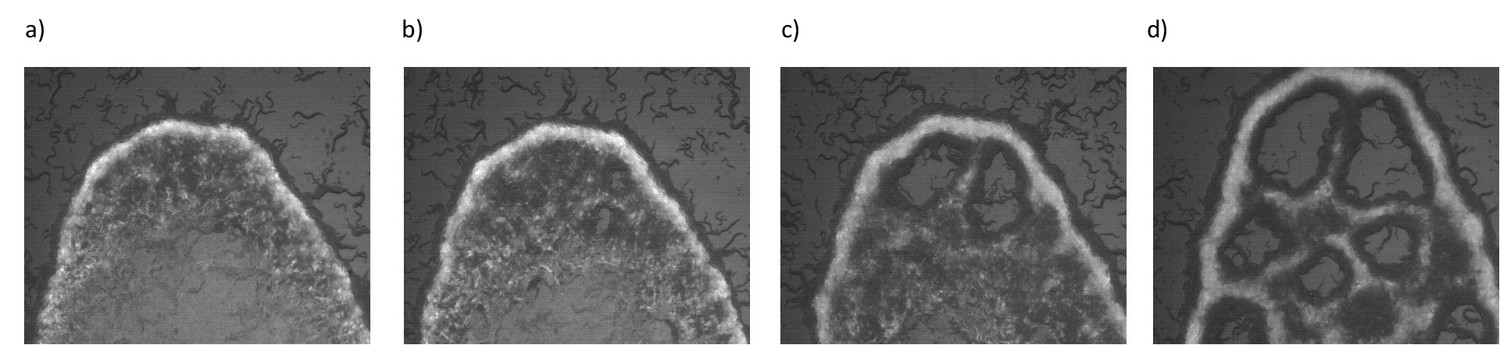
Emergence of periodic holes on biofilms.
(a–d) Snapshots of aggregating N2 animals on GFP labeled B. subtilis biofilm. Limited diffusibility of the chaining bacteria allows local bacterial depletion and oxygen penetration. An increase in the local oxygen concentration results in periodic hole structures by triggering the animals' motility.
Figure 5—figure supplement 1
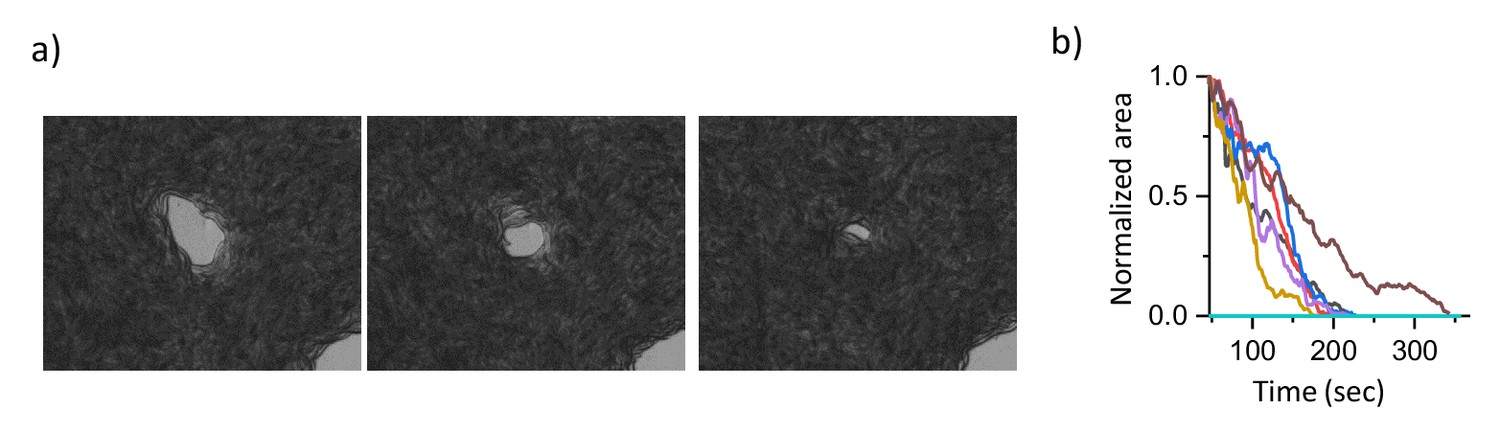
Time evolution of holes in a swarm body.
(a) Time evolution of hole structures on E. coli-based swarm body. Holes gradually shrink and disappear. b) The normalized area as a function of time.
Figure 6 with 5 supplements

Dynamics of collective response of both N2 and npr- one on pathogenic bacteria Pseudomonas aeruginosa (PA14).
Oxygen-dependent motility of the laboratory strain N2 (a) and (c) npr-1 on PA14. Error bar indicates the s.e.m. = ± 18 μm/s. Snapshots of distribution high-density animals N2 (b) and np1-1 (d) on PA14. For each experiment N = 25 individual animals were imaged.
Figure 6—figure supplement 1
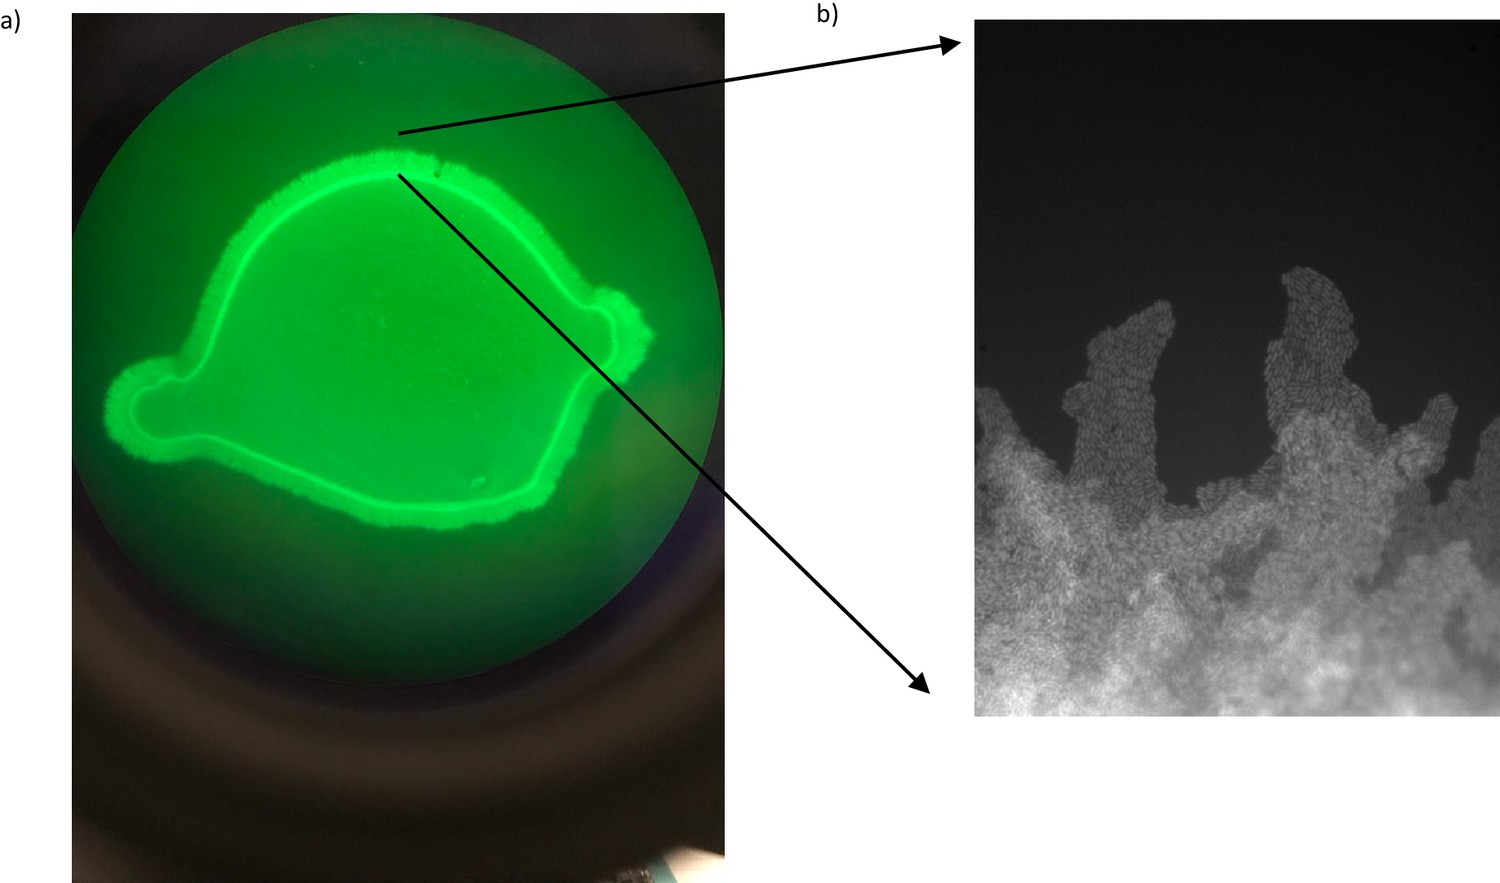
Unstable edge of a bacterial biofilm.
(a) Fluorescence image of a GFP-labeled PA14 biofilm lawn on a NGM plate. (b) The edge of the biofilm has a single layer, finger-like bacterial structures extending from the lawn.
Figure 6—video 1
Collective response of N2 animals on a biofilm-forming patghogenic PA14 bacterial lawn.
This video is associated with Figure 6a,b.
Figure 6—video 2
Collective response of npr-1 animals on a biofilm-forming patghogenic PA14 bacterial lawn.
Figure 6—video 3
Dynamics of bacteria around a single worm moving on the GFP-labeled PA14 biofilm.
The worm is moving at the center of the biofilm. The worm could open a trench on the surface but do not concentrate the bacteria.
Figure 6—video 4
Dynamics of bacteria around a single worm moving on the edge of PA14 biofilm.
In contrast to the central region, the worm could concentrate the bacteria around the edge.
Author response image 1
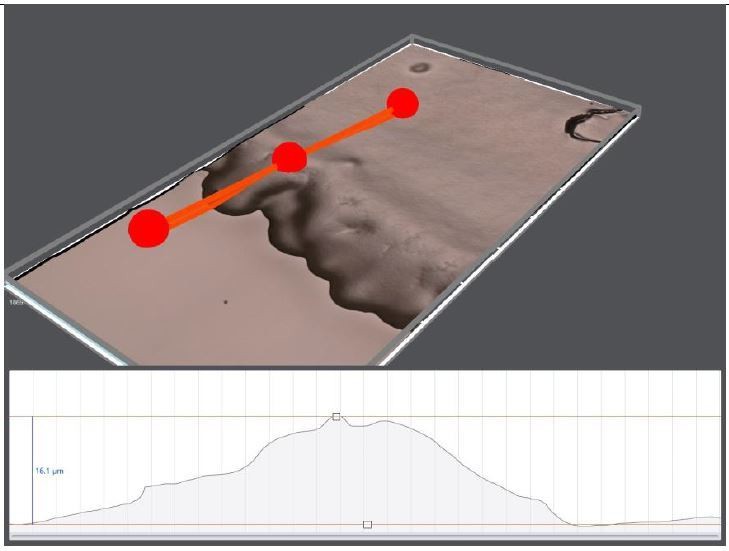
3D topography of 10 days old OP50 bacterial lawn on regular NGM plate.
The edge thickness is around 16 μm.
Author response image 2
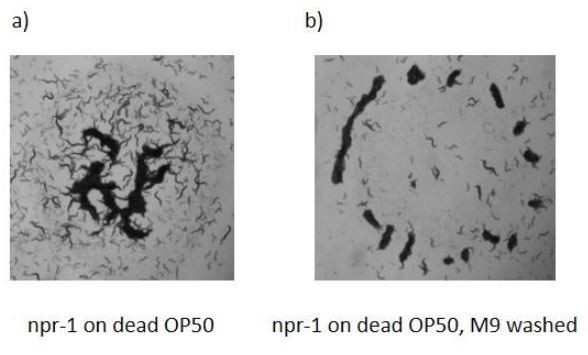
Aggregation behaviors of npr-1 worms on dead bacterial lawns.
Op50 bacterial suspension was heat-killed 65 0C before seeding. Bacterial lawns were prepared (a) with native suspension (b) fresh M9 washed suspension. npr-1 worms can form aggregation on a dead bacterial lawn.
Author response image 3
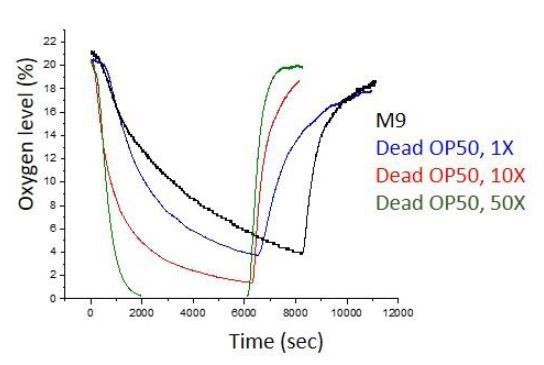
Oxygen dissociation rate measurements of dead bacterial suspensions.
Dense bacterial suspensions quickly release oxygen.
Videos
Video 1
Typical swarming response of a laboratory strain (N2) C.elegans.
The video is played 600 X speed and the real elapsed time is indicated in the video (h: min: sec). This video is associated with Figure 1a,b.
Video 2
Emergence of swarming response of laboratory strain (N2) around a GFP-labeled bacterial lawn.
Worms accumulate around the lawn and form large aggregates. As large aggregates merge, swarm body appears and gains motility. Bacteria accumulate within the aggregates. The video is played 250 X speed and the real elapsed time is indicated in the video (hr: min: s).
Video 3
Measurement of [O2] in a swarming body.
The fiber optic sensor is placed on a bacterial lawn and ambient [O2] is set to 21%. Ambient set [O2] and measured [O2] are indicated in the video as O2 set (green) and O2m (black), respectively. This video is associated with Figure 2a.
Video 4
Oxygen-dependent motility response of individual animals (npr-1).
In order to minimize the animal to animal interaction isolated bacterial slots were used. This video is associated with Figure 2b.
Video 5
Typical structural patterns formed by the animal at high population density under different oxygen levels.
Top images show N2 and bottom images corresponds to npr-1 strain. The circular region is the bacterial lawn. This video is associated with Figure 2d–f and Figure 3.
Video 6
Typical structural patterns formed by the animal at low population density under different oxygen levels.
Top images show N2 and bottom images corresponds to npr-1 strain. The circular region is the bacterial lawn. This video is associated with Figure 2d–f and Figure 3.
Video 7
Typical response of the swarm formed by N2 to changing ambient oxygen.
Video 8
Sample simulation results of representing the coarsening process.
Video 9
Typical response of npr-1 to changing ambient oxygen.
Bacterial depletion promotes coarsening and the emergence of swarming. This video is associated with Figure 4.
Video 10
Accumulation of N2 animals on a biofilm-forming B. Subtilis bacterial lawn.
GFP-labeled bacteria show the concentrated and depleted regions. Depleted regions converge to periodic open holes. This video is associated with Figure 5.
Video 11
Dynamics of bacteria around a single worm on a GFP-labeled OP50.
Bacteria can diffuse and the worm accumulates the bacteria around the trench left behind.
Additional files
Download links
A two-part list of links to download the article, or parts of the article, in various formats.
Downloads (link to download the article as PDF)
Open citations (links to open the citations from this article in various online reference manager services)
Cite this article (links to download the citations from this article in formats compatible with various reference manager tools)
Dynamics of pattern formation and emergence of swarming in Caenorhabditis elegans
eLife 9:e52781.
https://doi.org/10.7554/eLife.52781


