Building customizable auto-luminescent luciferase-based reporters in plants
- Department Genetics, Cell Biology, & Development, University of Minnesota, United States
- Center for Precision Plant Genomics, University of Minnesota, United States
- Department of Biology, University of Washington, United States
Figures
Figure 1 with 4 supplements

The fungal bioluminescence pathway creates auto-luminescence when transiently or stably expressed.
(A) Schematic of the chemical reactions driving the generation of auto-luminescence in planta. Caffeic acid produced by the phenylpropanoid biosynthesis pathway is converted to Hispidin by Hisps once it is post-translationally activated by NPGA. Hispidin is then converted to 3-Hydroxyhispidin, the luciferin molecule, by H3H. Finally, the luciferase Luz oxidizes 3-Hydroxyhispidin to a high energy intermediate which degrades into Caffeylpyruvic acid, producing light. CPH can turn Caffeylpyruvic acid back into Caffeic acid, closing the cycle. (B) An image in the dark with an eight minute exposure of a N. benthamiana leaf infiltrated with the FBP demonstrating auto-luminescence in the infiltrated zone. (C) An image in the light of the same leaf with the infiltrated zone marked with a black outline. (D) Bar plots representing background subtracted luminescence from N. benthamiana leaves infiltrated with either a functional FBP (yellow) or a broken control (gray) missing the luciferase, Luz, three days after infiltration (n = 12, p=0.0002 based on a T-test). Black bars represent standard deviation. (E) Bar plots representing background subtracted luminescence seven days after infiltration from N. benthamiana leaves infiltrated with FBPs that either have (pink) or do not have (gray) the CPH-based recycling pathway (n = 12, p=0.05 based on a T-test). Black bars represent standard deviation. (F, G) Bright field image (F) and luminescence signal (G) captured with a CCD camera of transgenic N. benthamiana plants with a stable integration of the FBP (FBP-6) into the genome. Warmer colors correspond to higher luminescence in accordance with the lookup table.
-
Figure 1—source data 1
Raw data for Figure 1—figure supplements 1 and 2.
- https://cdn.elifesciences.org/articles/52786/elife-52786-fig1-data1-v3.xlsx
-
Figure 1—source data 2
Raw data for Figure 1—figure supplements 1 and 2.
- https://cdn.elifesciences.org/articles/52786/elife-52786-fig1-data2-v3.xlsx
-
Figure 1—source data 3
Raw data for Figure 1—figure supplement 3.
- https://cdn.elifesciences.org/articles/52786/elife-52786-fig1-data3-v3.xlsx
Figure 1—figure supplement 1

Characterization of luminescence from transient expression of different FBP pathway variants.
(A) Box plots summarizing luminescence recorded from N. benthamiana leaves infiltrated with FBPs three days after infiltration. Each dot represents a reading from a different infiltrated leaf. The bars labeled agro are readings from confluent cultures of agrobacterium strains used to deliver the respective FBP. Pathway two is a functional pathway without CPH and pathway six is a functional pathway with CPH. Pathways 8,10 and 11 are all negative controls missing pathway enzymes. (B) Schematics of the expression cassettes assembled for each of the pathways characterized.
Figure 1—figure supplement 2

Inclusion of a caffeic acid recycling pathway in the FBP prolongs luminescence signal.
Box plots representing luminescence from N. benthamiana leaves infiltrated an FBP that either with (blue) or without (gray) the CPH-based recycling pathway. Each dot represents a reading from a different infiltrated leaf. Data is from four days and seven days after infiltration.
Figure 1—figure supplement 3
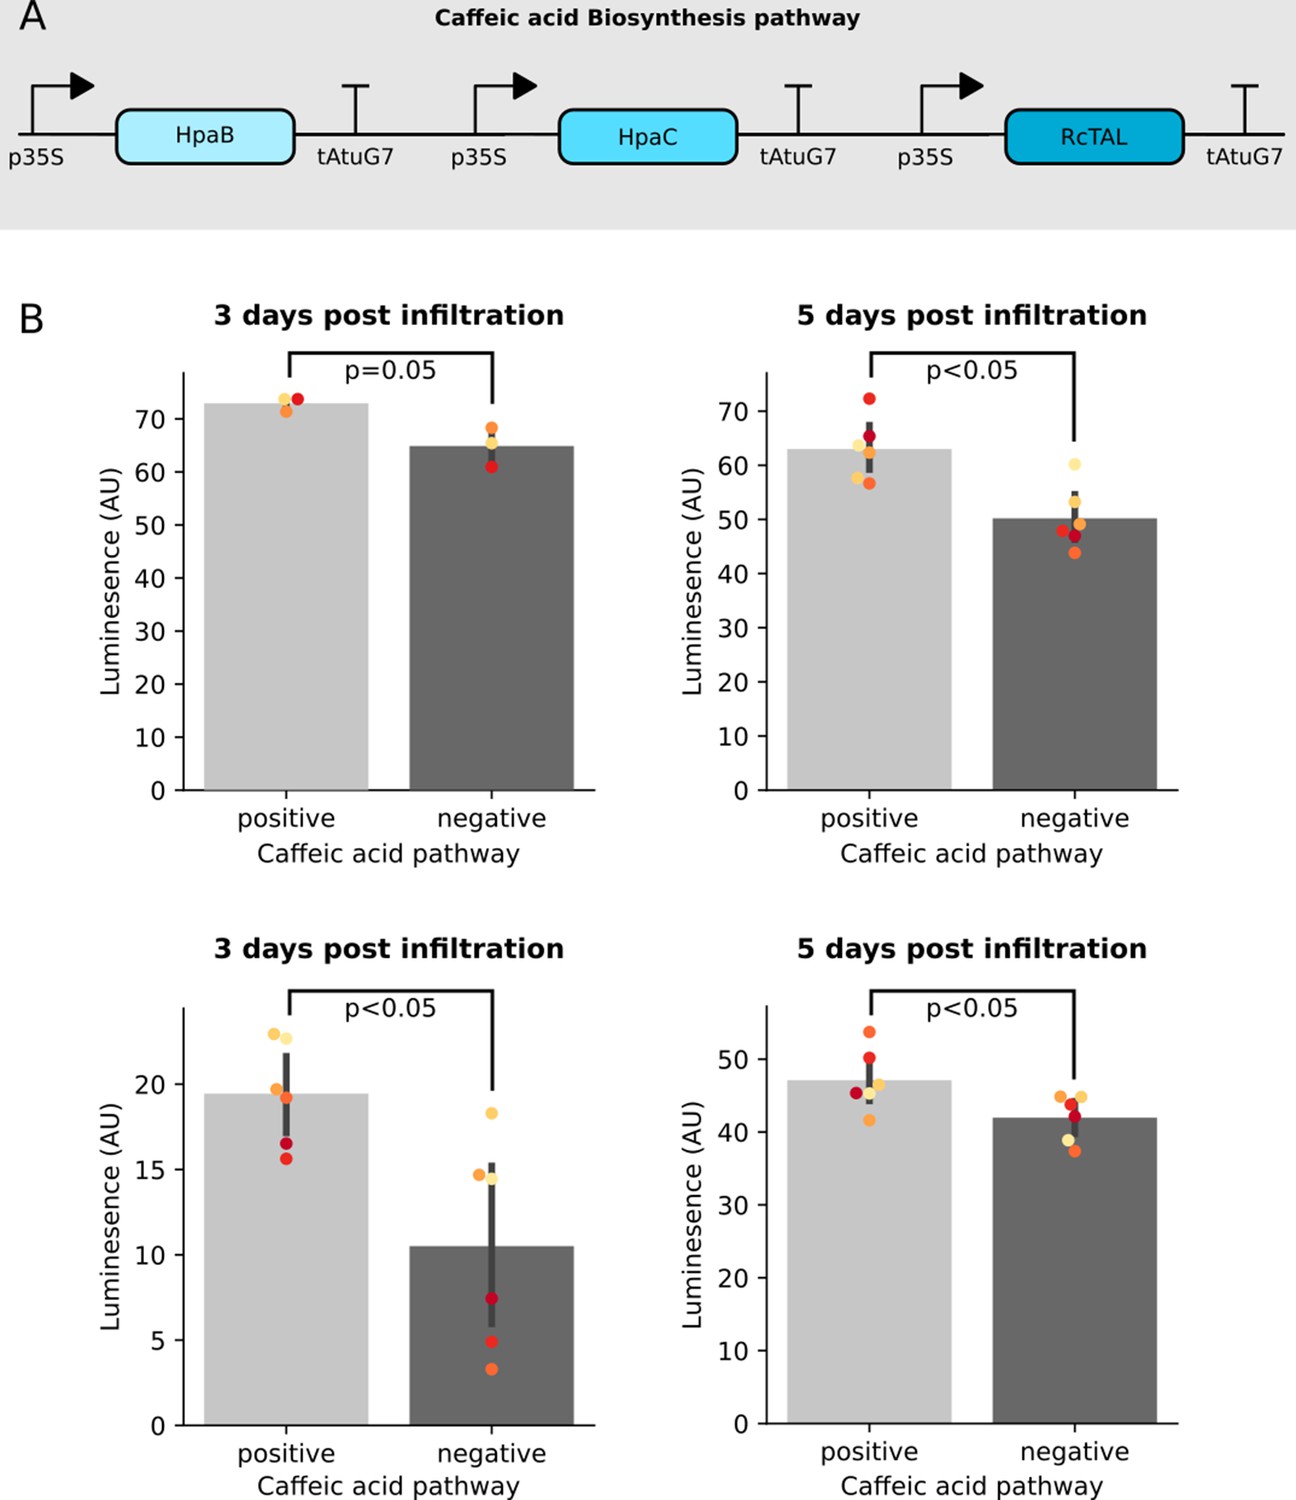
Co-expression of the Caffeic acid biosynthesis pathway with the FBP increases luminescence signal.
(A) A schematic of the three enzyme pathway built and transiently expressed in an FBP6 stable transgenic line to enable biosynthesis of Caffeic acid from tyrosine. (B) Bar plots summarizing luminescence data from leaves of a transgenic line of N. benthamiana stably expressing FBP6 and infiltrated with agrobacterium to deliver either the caffeic acid biosynthesis pathway, or a control T-DNA. Each plot represents data collected from an independent biological replicate, where one side of the leaf was infiltrated with the caffeic acid pathway and the other was infiltrated with the control. The black bars represent standard deviation and the dots represent technical replicates. All p values were calculated using a T-test.
Figure 1—figure supplement 4
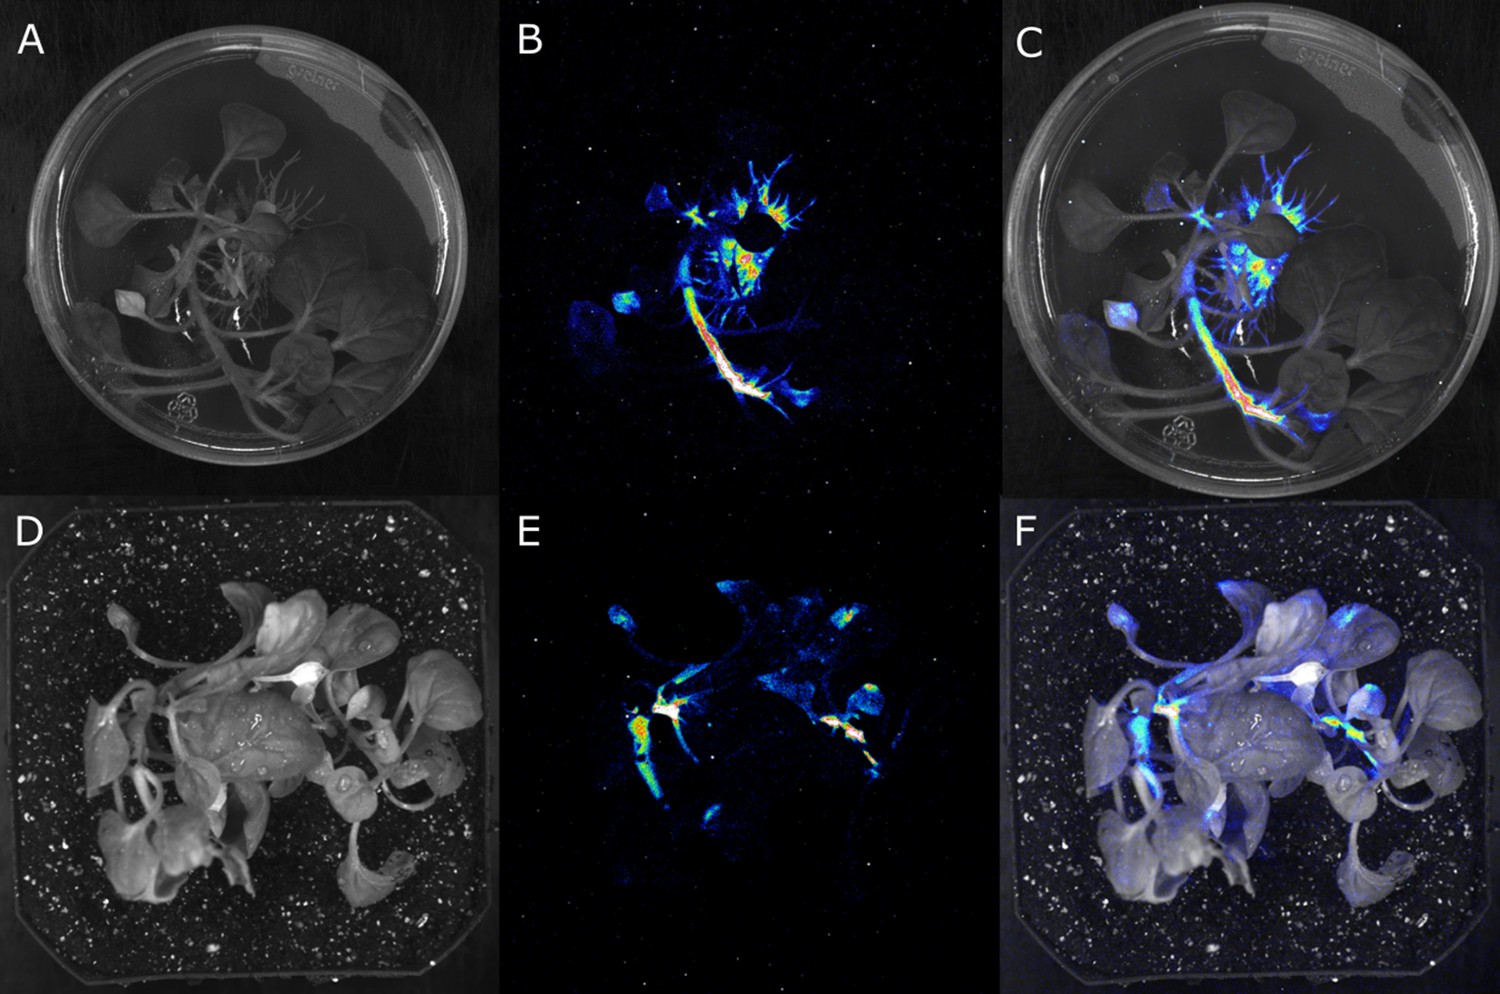
Stable integration of the FBP into the genome results in the creation of auto-luminescent plants.
(A–F) Luminescence signal captured with a CCD camera (B,E), a bright field image of the same plant (A,D), and the two superimposed on each other (C,F), of a transgenic N. benthamiana plant with a stably integrated FBP on rooting media (A,B,C) and in soil (D,E,F). Warmer colors correspond to higher luminescence.
Figure 2 with 1 supplement
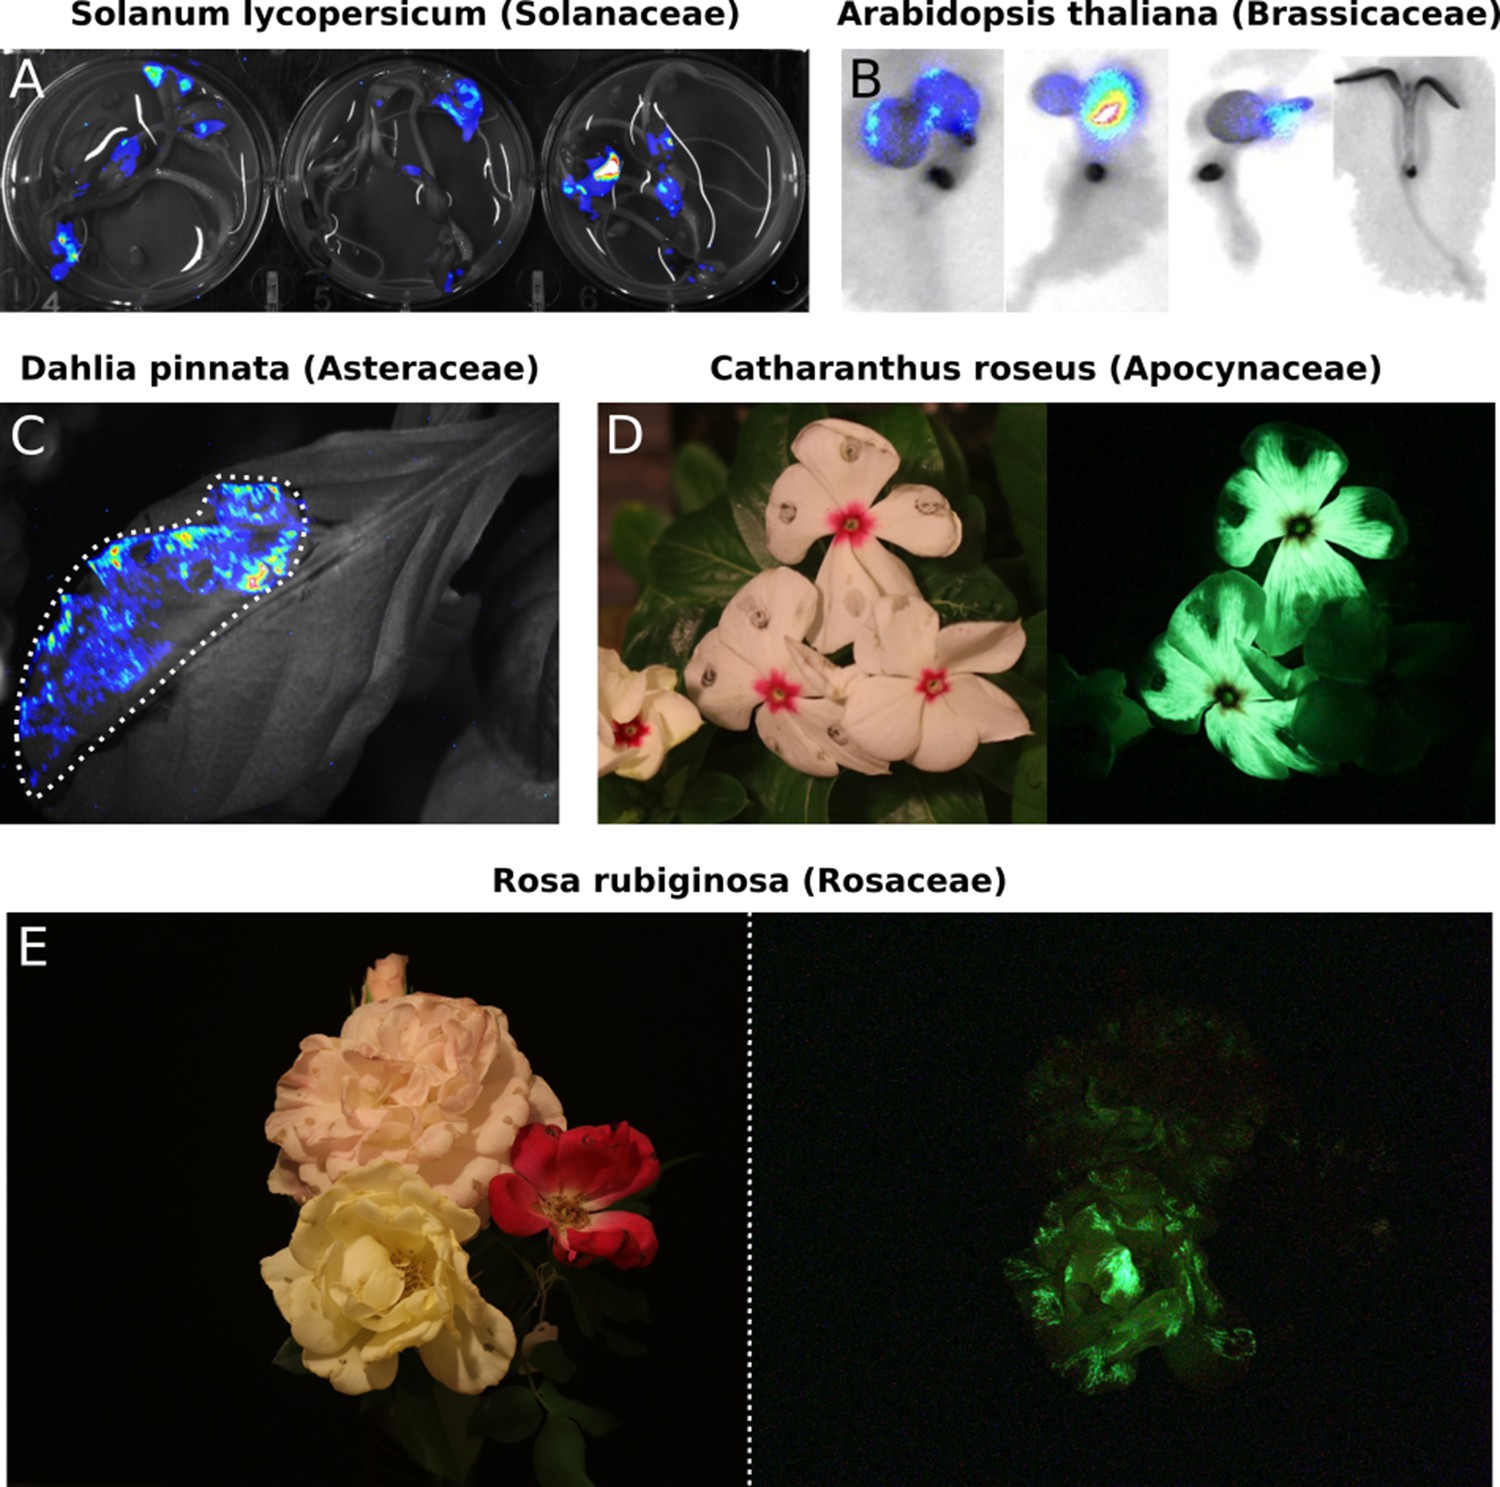
Transient expression of the FBP can generate auto-luminescence in a range of plant species.
(A) Luminescence signal superimposed on a bright field image of Solanum lycopersium (tomato) seedlings with an FBP delivered via the AgroBEST protocol. Warmer colors correspond to higher luminescence signal. (B) Luminescence signal superimposed on bright field images of Arabidopsis thaliana seedlings with a functional FBP (left three seedlings) or a broken FBP (right most seedling) delivered via the AgroBEST protocol. Warmer colors correspond to higher luminescence signal. (C) Luminescence signal superimposed on a bright field image of a Dahlia pinnata leaf infiltrated with an FBP. (D) Lit (left) and unlit, long exposure (right) true color images of Catharanthus roseus flowers infiltrated with an FBP. (E) Lit (left) and unlit, long exposure (right) true color images of Rosa rubiginosa flowers infiltrated with an FBP.
Figure 2—figure supplement 1
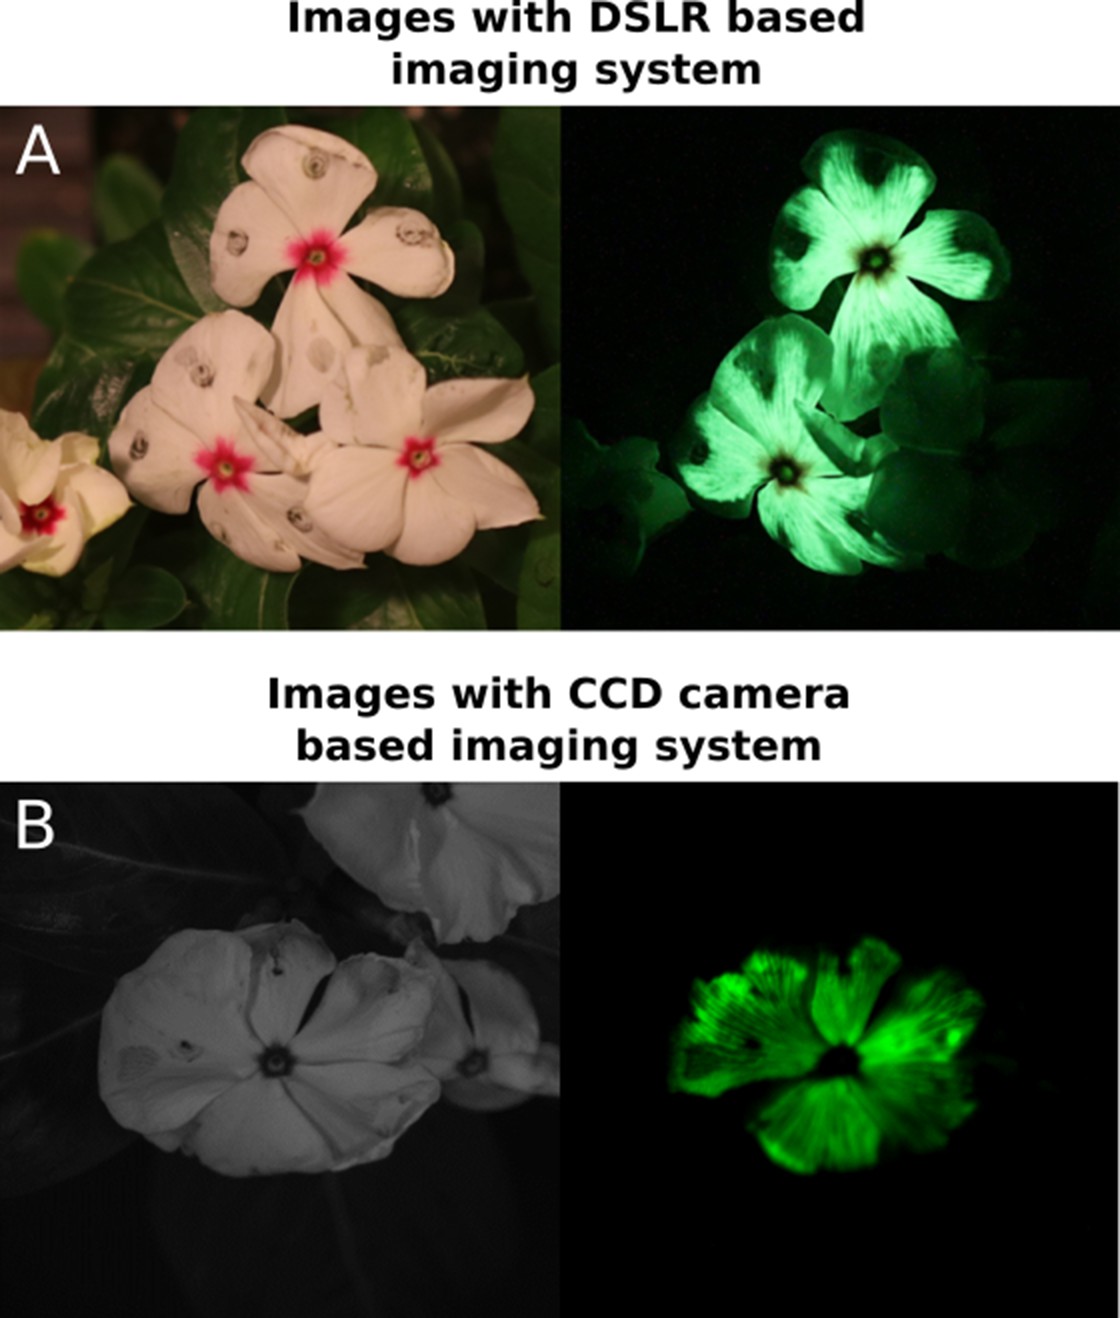
DSLR-based imaging produces comparable images of FBP luminescence to CCD-based imaging systems.
Petal infiltrations of C. roseus flowers with an FBP imaged three days post infiltration with either our DSLR-based imaging system (A) or a CCD based imaging system (B).
Figure 3
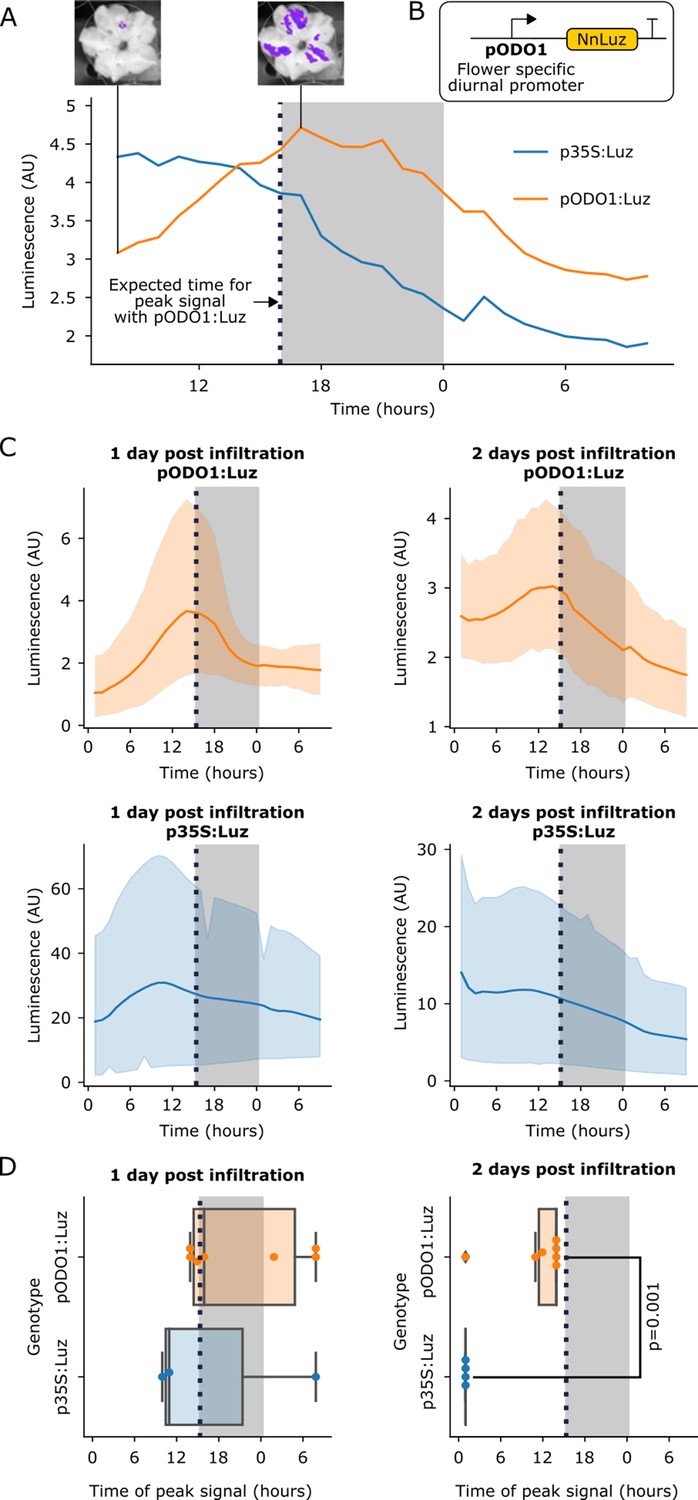
The FBP can be used to build reporters of the spatio-temporal patterns of gene expression.
(A) A representative example of time course luminescence data from long day entrained P. hybrida flowers infiltrated with FBPs. The orange line represents FBP with Luz driven by the ODO1 promoter from Petunia and the blue line represents the mean luminescence signal of an FBP with Luz driven by the 35S promoter. The gray background represents the night period. The dashed black line highlights where we expect to see the peak expression from the ODO1 promoter. Representative images of petunia flowers infiltrated with the pODO1:Luz at minimum and maximum bioluminescence are also shown, where luminescence signal is overlaid on the bright field image. (B) A schematic of the Luz expression cassette being driven by flower specific diurnal promoter of the petunia gene, ODO1, which is expected to have peak expression at the day to night transition. (C) Time course luminescence data from long day entrained P. hybrida flowers that were infiltrated with an FBP with Luz driven by the ODO1 promoter, 1 and 2 days post infiltration (n = 7 for both) is shown in orange. The time course luminescence data from controls imaged in parallel that were infiltrated with an FBP with Luz driven by the 35S promoter, 1 (n = 4) and 2 (n = 3) days post infiltration is also shown, in blue. The solid lines are mean luminescence and light outlines represent standard deviation. Time (hours) shows Zeitgeber time (time after the light onset at 9AM). The gray background represents the night period. The dashed black line highlights where we expect to see the peak expression from the ODO1 promoter. (D) Box plots summarizing when we observe peak luminescence signal in the time course luminescence data shown in C. Each dot represents an independent biological replicate of a flower infiltrated with a pathway that contains either pODO1:Luz (orange) or p35S:Luz (blue). The gray background represents the night period. The dashed black line highlights where we expect to see the peak expression from the ODO1 promoter. The reported p value was calculated based on a t-test.
-
Figure 3—source data 1
Raw data plotted in Figure 3.
- https://cdn.elifesciences.org/articles/52786/elife-52786-fig3-data1-v3.xlsx
-
Figure 3—source data 2
Raw data plotted in Figure 3.
- https://cdn.elifesciences.org/articles/52786/elife-52786-fig3-data2-v3.xlsx
-
Figure 3—source data 3
Raw data plotted in Figure 3.
- https://cdn.elifesciences.org/articles/52786/elife-52786-fig3-data3-v3.xlsx
Figure 4 with 2 supplements
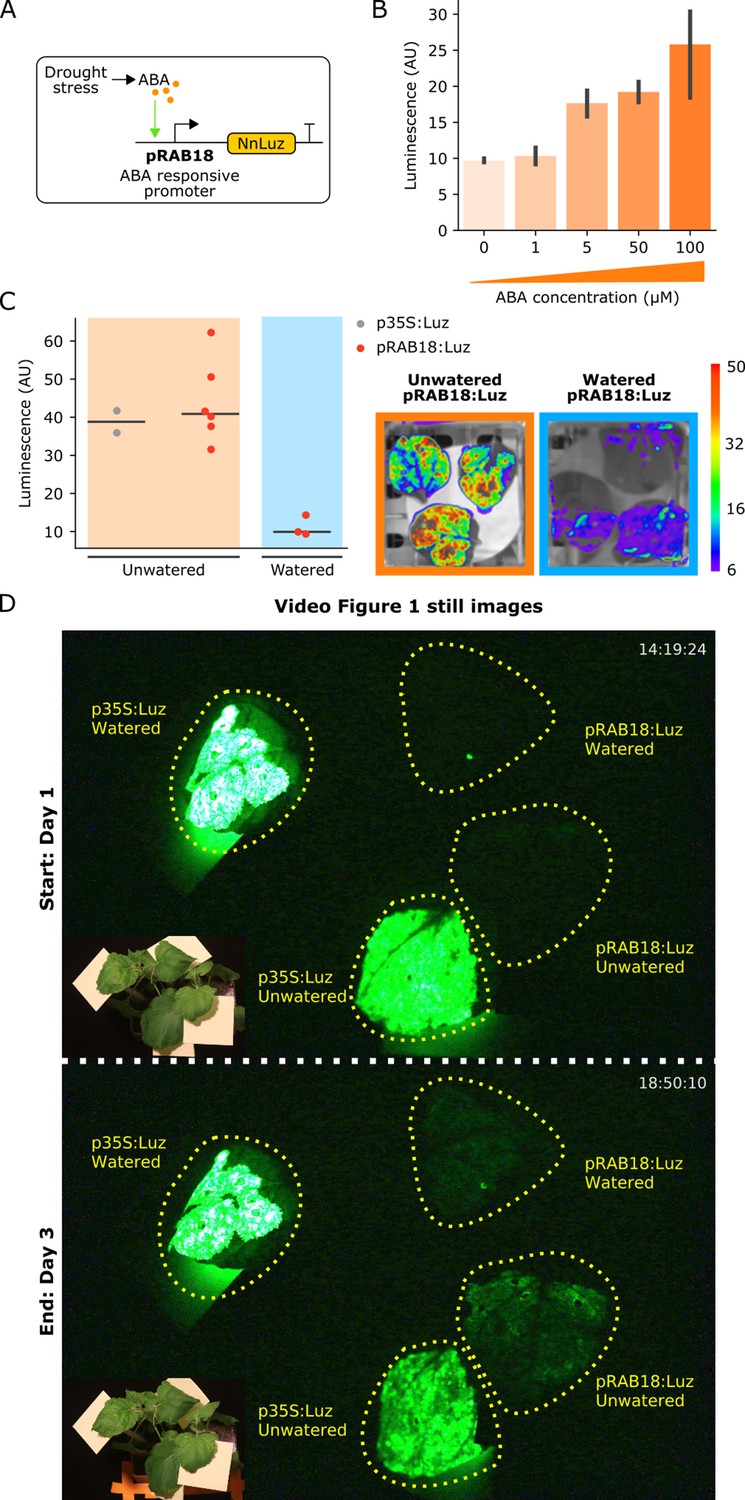
The FBP can be used to build reporters of hormone signaling dynamics in planta.
(A) Schematic of the Luz expression cassette driven by the ABA-responsive AtRAB18 promoter. (B) Bar plots summarizing mean luminescence signal observed from N. benthamaina leaves co-infiltrated with the pRAB18:Luz FBP variant along with increasing concentrations of the hormone ABA and then imaged after three days. Black bars represent standard deviation (n = 3). (C) Luminescence signal observed from N. benthamaina leaves infiltrated with an FBP and then either kept moist (blue background) or allowed to desiccate to trigger an ABA signal (orange background). Gray and red dots represent data from independent leaves infiltrated with FBP with a 35S or pRAB18 driven Luz respectively. Representative images of watered and un-watered leaves infiltrated with the pRAB18:Luz FBP with luminescence signal overlaid on a bright field picture. Warmer colors represent higher signals. (D) Still images from the start and end of Video Figure 1, where one leaf each on two N. benthamiana plants were agro-infiltrated with FBPs that had either a 35S or pRAB18 driven Luz. One plant was allowed to desiccate (bottom two leaves labeled unwatered) while the other was kept watered (top two leaves labeled watered). The infiltrated leaves are highlighted with a dashed yellow line. A paired bright field image is inset in corner of each image.
-
Figure 4—source data 1
Raw data for Figure 4.
- https://cdn.elifesciences.org/articles/52786/elife-52786-fig4-data1-v3.xlsx
Figure 4—figure supplement 1
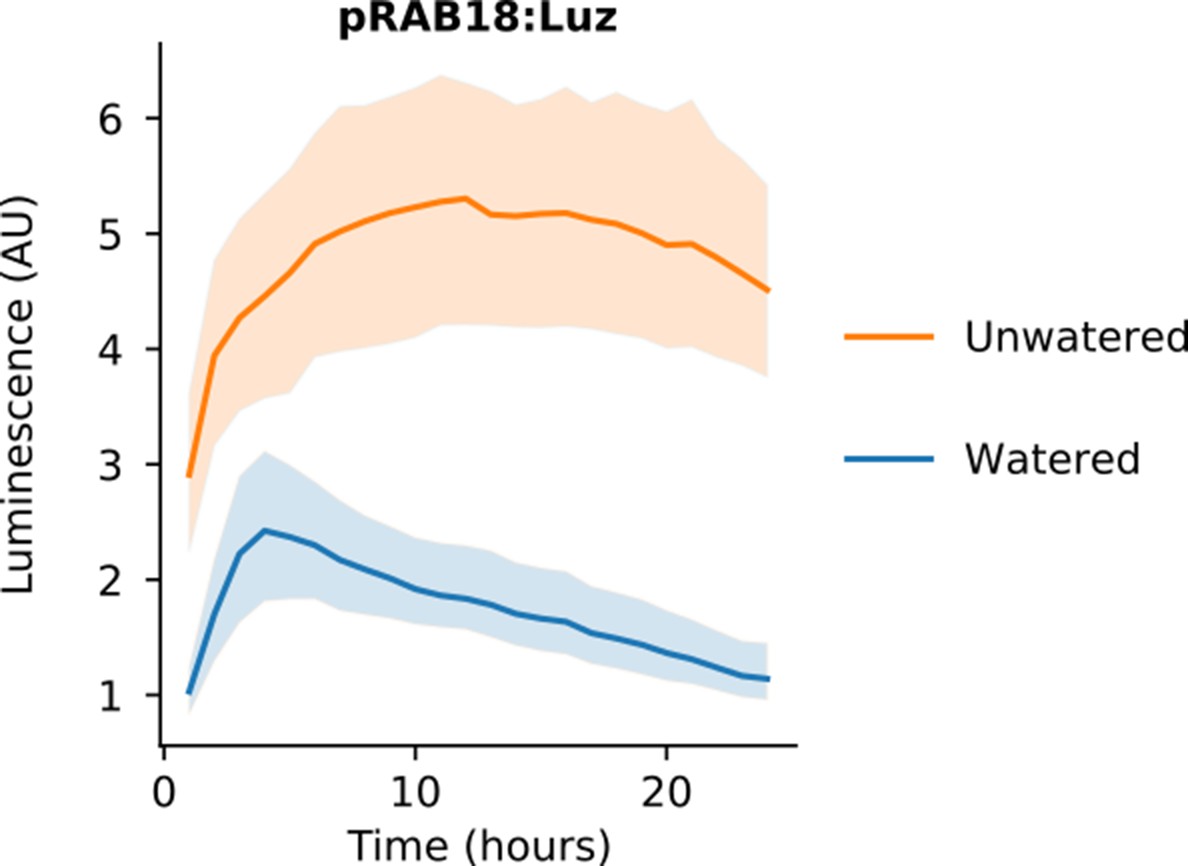
An FBP with pRAB18 driving Luz expression shows increased luminescence in unwatered conditions.
Time course luminescence data from N. benthamiana leaves infiltrated with a pRAB18:Luz FBP variant either kept moist (n = 3, blue) or allowed to dry out (n = 6, orange). The solid lines are mean luminescence and light outlines represent standard deviation.
Figure 4—video 1
Time lapse movie of Nicotiana benthamiana transiently expressing an FBP with pRAB18 driving Luz expression in watered and unwatered conditions with parallel positive controls.
Time lapse imaging was performed with our RaspberryPi controlled DSLR imaging platform to visualize ABA induced FBP expression in plants exposed to drought stress. We infiltrated one leaf each on two N. benthamiana plants with FBPs that had either a 35S (+control) or pRAB18 driven Luz. One plant was allowed to desiccate while the other was kept watered. Bioluminescence in the leaves as then imaged over three days. The treatments of the leaves are labeled with white legends.
Tables
Table 1
Vectors containing FBP components.
| Plasmid Name | Fungal Bioluminescent Pathway Components | Plasmid Type |
|---|---|---|
| P303-FBP_2 | p35S_Short_TMV 5':AsNpga:tAtug7, pCmYLCV:NnH3H:AtuOCS, pCmYLCV:NnHisps:tHsp, p35S:NnLuz:tAtuOcs | T-DNA |
| P307-FBP_6 | pLHB1B1:NnCPH:tSlH4, p35S_Short_TMV 5':AsNpga:tAtug7, pCmYLCV:NnH3H:AtuOcs, pCmYLCV:NnHisps:tHsp, p35S:NnLuz:tAtuOcs | T-DNA |
| P313-FBP_8 | pLHB1B1:NnCPH:tSlH4, p35S_Short_TMV 5':AsNpga:tAtug7, pCmYLCV:NnHisps:tHsp, pAtuMas:Nn Luz:trbcSE9 | T-DNA |
| P315-FBP_10 | pUBQ1:NhH3H:tNos, pCmYLCV:NnHisps:tHsp, pAtuMas:NnLuz:trbcSE9 | T-DNA |
| P336-FBP_11 | pLHB1B1:NnCPH:tSlH4, p35S_Short_TMV 5':AsNPGA:tAtug7, pCmYLCV:NnH3H:AtuOcs, pCmYLCV:NnHisps:tHsp | T-DNA |
| P362-FBP_12 | pSlH4:NnCPH:tSlH4, p35S_Short_TMV 5':AsNpga:tAtug7, pAtuMas:NhH3H:tAtuMas, p35S:NnHisps:t35S, p35S:NnLuz:AtuOcs | T-DNA |
| P427-FBP_13 | pSlH4:NnCPH:tSlH4, pSlRBCS2:AsNpga:tAtug7, pAtuMas:NhH3H:tAtuMas, p35S:NnHisps:t35S, pAtELF4:NnLuz:trbcse9 | T-DNA |
| P445-FBP_17 | pSlH4:NnCPH:tSlH4, pSlRBCS2:AsNpga:tAtug7, pAtuMas:NnH3H:tAtuMas, p35S:NnHisps:t35S, pPhODO1:NnLuz:tAtuOcs | T-DNA |
| P447-FBP_19 | pSlH4:NnCPH:tSlH4, pSlRBCS2:AsNpga:tAtug7, pAtuMas:NnH3H:tAtuMas, p35S:NnHisps:t35S, pAtRAB18:NnLuz:tAtuOcs | T-DNA |
| P532 | 35S Short_TMV 5':HpaB:tAtug7, 35S Short_TMV 5':HpaC:tAtug7, 35S Short_TMV 5':RcTAL:tAtug7 | T-DNA |
| P195 | pMOD_A''_p35S_Short_TMV 5':AsNpga:tAtug7 | Module Čermák et al., 2017 |
| P212 | pMOD_D_p35S:NnLuz:tAtuOcs | Module Čermák et al., 2017 |
| P223 | pMOD_A'_pLHB1B1:NnCPH:tSlH4 | Module Čermák et al., 2017 |
| P364 | pMOD_A'_pSlH4:NnCPH:tSlH4 | Module Čermák et al., 2017 |
| P366 | pMOD_A''_pSlRBCS2:AsNpga:tAtug7 | Module Čermák et al., 2017 |
| P368 | pMOD_B_pAtuMas:NnH3H:tAtuMas | Module Čermák et al., 2017 |
| P440 | pMOD_D_pPhODO1:NnLuz:tAtuOcs | Module Čermák et al., 2017 |
| P442 | pMOD_D_pAtRAB18:NnLuz:tAtuOcs | Module Čermák et al., 2017 |
| pCO486 | pMOD_A_35S Short_TMV 5':AsNpga:tAtug7 | Module Čermák et al., 2017 |
| pCO487 | pMOD_B_CmYLCV:NnH3H:tAtuOcs | Module Čermák et al., 2017 |
| pCO488 | pMOD_C'_CmYLCV:NnHisps:tHsp | Module Čermák et al., 2017 |
| pCO489 | pMOD_D_AtuMas:NnLuz:trbcSE9 | Module Čermák et al., 2017 |
| pCO601 | pMOD_C'_p35S:NnHisps:t35S | Module Čermák et al., 2017 |
| P525 | pMOD_A_35S Short_TMV 5':HpaB:tAtug7 | Module Čermák et al., 2017 |
| P526 | pMOD_B_35S Short_TMV 5':HpaC:tAtug7 | Module Čermák et al., 2017 |
| P527 | pMOD_C_35S Short_TMV 5':RcTAL:tAtug7 | Module Čermák et al., 2017 |
| pCO600 | NnHisps | MoClo Part Engler et al., 2014 |
| pCO602 | NnCPH | MoClo Part Engler et al., 2014 |
| pCO603 | NnLuz | MoClo Part Engler et al., 2014 |
| pCO604 | NnH3H | MoClo Part Engler et al., 2014 |
| pCO605 | AsNPGA | MoClo Part Engler et al., 2014 |
| pCO706 | hpaB | MoClo Part Engler et al., 2014 |
| pCO707 | hpaC | MoClo Part Engler et al., 2014 |
| pCO708 | RcTAL | MoClo Part Engler et al., 2014 |
Table 2
Components for DSLR-Based Imaging Platform.
| Component | Source | Cost | |
|---|---|---|---|
| Hardware | |||
| RaspberryPi 3 Complete Starter Kit | CanaKit | $75 | |
| Canon EOS 80D DSLR | Canon | $1100 | |
| Canon AC adapter and DC coupler | B and H Photo | $150 | |
| EF 100 mm f/2.8 Macro Lens | Canon | $600 | |
| Tripod | Amazon | $25 | |
| Controllabe 4-Outlet Power Relay | Adafruit | $25 | |
| Jumper cables | Amazon | $10 | |
| Pop-up plant growing tents | Zazzy | $153 | |
| Software | |||
| RPi.GPIO | https://pypi.org/project/RPi.GPIO/ | Free | |
| gphoto2 | http://gphoto.org/ | Free | |
| ImageJ | https://imagej.nih.gov/ij/ | Free | |
| ffmpeg | https://ffmpeg.org/ | Free | |
| Python wrappers | https://github.com/craftyKraken/P4 | ||
Additional files
-
Source code 1
Code for data analysis and plotting.
- https://cdn.elifesciences.org/articles/52786/elife-52786-code1-v3.ipynb
-
Transparent reporting form
- https://cdn.elifesciences.org/articles/52786/elife-52786-transrepform-v3.docx
Download links
A two-part list of links to download the article, or parts of the article, in various formats.
Downloads (link to download the article as PDF)
Open citations (links to open the citations from this article in various online reference manager services)
Cite this article (links to download the citations from this article in formats compatible with various reference manager tools)
Building customizable auto-luminescent luciferase-based reporters in plants
eLife 9:e52786.
https://doi.org/10.7554/eLife.52786


