Antagonistic control of Caenorhabditis elegans germline stem cell proliferation and differentiation by PUF proteins FBF-1 and FBF-2
- Division of Biological Sciences, University of Montana, United States
Figures
Figure 1 with 2 supplements
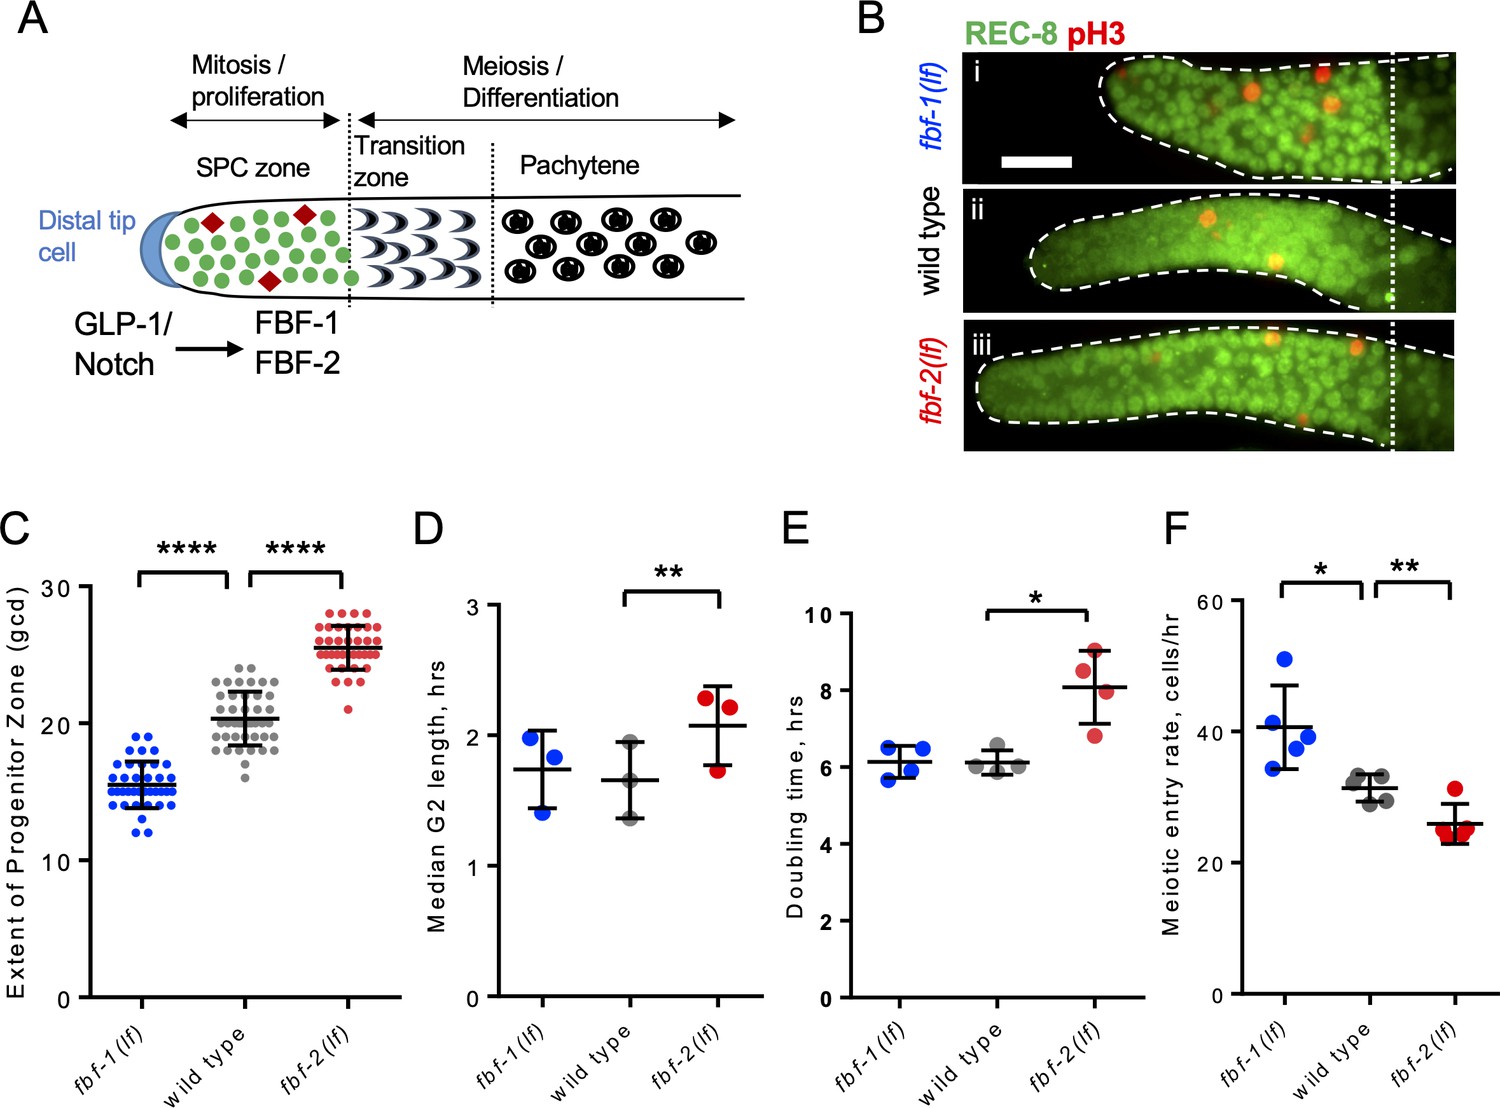
FBF-1 and FBF-2 differentially regulate the extent of germline stem and progenitor cell (SPC) zone.
(A) Schematic of the distal germline of C. elegans adult hermaphrodite. In this and following images, germlines are oriented with their distal ends to the left. GLP-1/Notch signaling from the distal tip cell (blue) supports germline SPC proliferation. Progenitors enter meiosis in the transition zone. FBF-1 and FBF-2, downstream of GLP-1/Notch, are required for SPC maintenance. Green circles, stem and progenitor cells; red diamonds, mitotically dividing cells. (B) Distal germlines dissected from adult wild type, fbf-1(lf), and fbf-2(lf) hermaphrodites and stained with anti-REC-8 (green) and anti-phospho-Histone H3 (pH3; red) to visualize the SPC zone and mitotic cells in M-phase. Germlines are outlined with the dashed lines and the vertical dotted line marks the beginning of transition zone as recognized by the ‘crescent-shaped’ chromatin and loss of REC-8. Scale bar: 10 μm. (C) SPC zone lengths of the wild type, fbf-1(lf) and fbf-2(lf) germlines were measured by counting germ cell diameters (gcd) spanning SPC zone. Genetic background is indicated on the X-axis and the extent of SPC zone on the Y-axis. Differences in SPC zone lengths were evaluated by one-way ANOVA with Dunnett’s post-test. Data were collected from three independent experiments, with 10–15 germlines per strain per replicate. (D) Median SPC G2-phase length in different genetic backgrounds, as indicated on the X-axis. Difference in median G2 length was evaluated by one-way ANOVA with Dunnett’s post-test. G2 length was estimated in three independent experiments as shown in Figure 1—figure supplement 1C, each replicate experiment involved analysis of 145–159 germlines per strain. (E) Larval germ cell doubling time in different genetic backgrounds (as indicated on the X-axis). Plotted values are individual data points and means ± SD. Difference in germ cell doubling time was evaluated by one-way ANOVA with Dunnett’s post-test. Data were collected from four independent replicates as shown in Figure 1—figure supplement 1E,F, each analyzing 15–21 germlines per strain per time point (144–148 germlines per strain total). (F) Meiotic entry rate of germline progenitors in different genetic backgrounds indicated on the X-axis. Differences in meiotic entry rate between each fbf and the wild type were evaluated by one-way ANOVA with T-test with Bonferroni correction post-test. Meiotic entry rates were estimated in five independent experiments as shown in Figure 1—figure supplement 1G, each analyzing 5–7 germlines per strain per time point (89–94 germlines per strain total). (B–F) All experiments were performed at 24°C. Plotted values are individual data points and means ± SD. Asterisks mark statistically significant differences (****, p<0.0001; **, p<0.01; *, p<0.05).
Figure 1—figure supplement 1
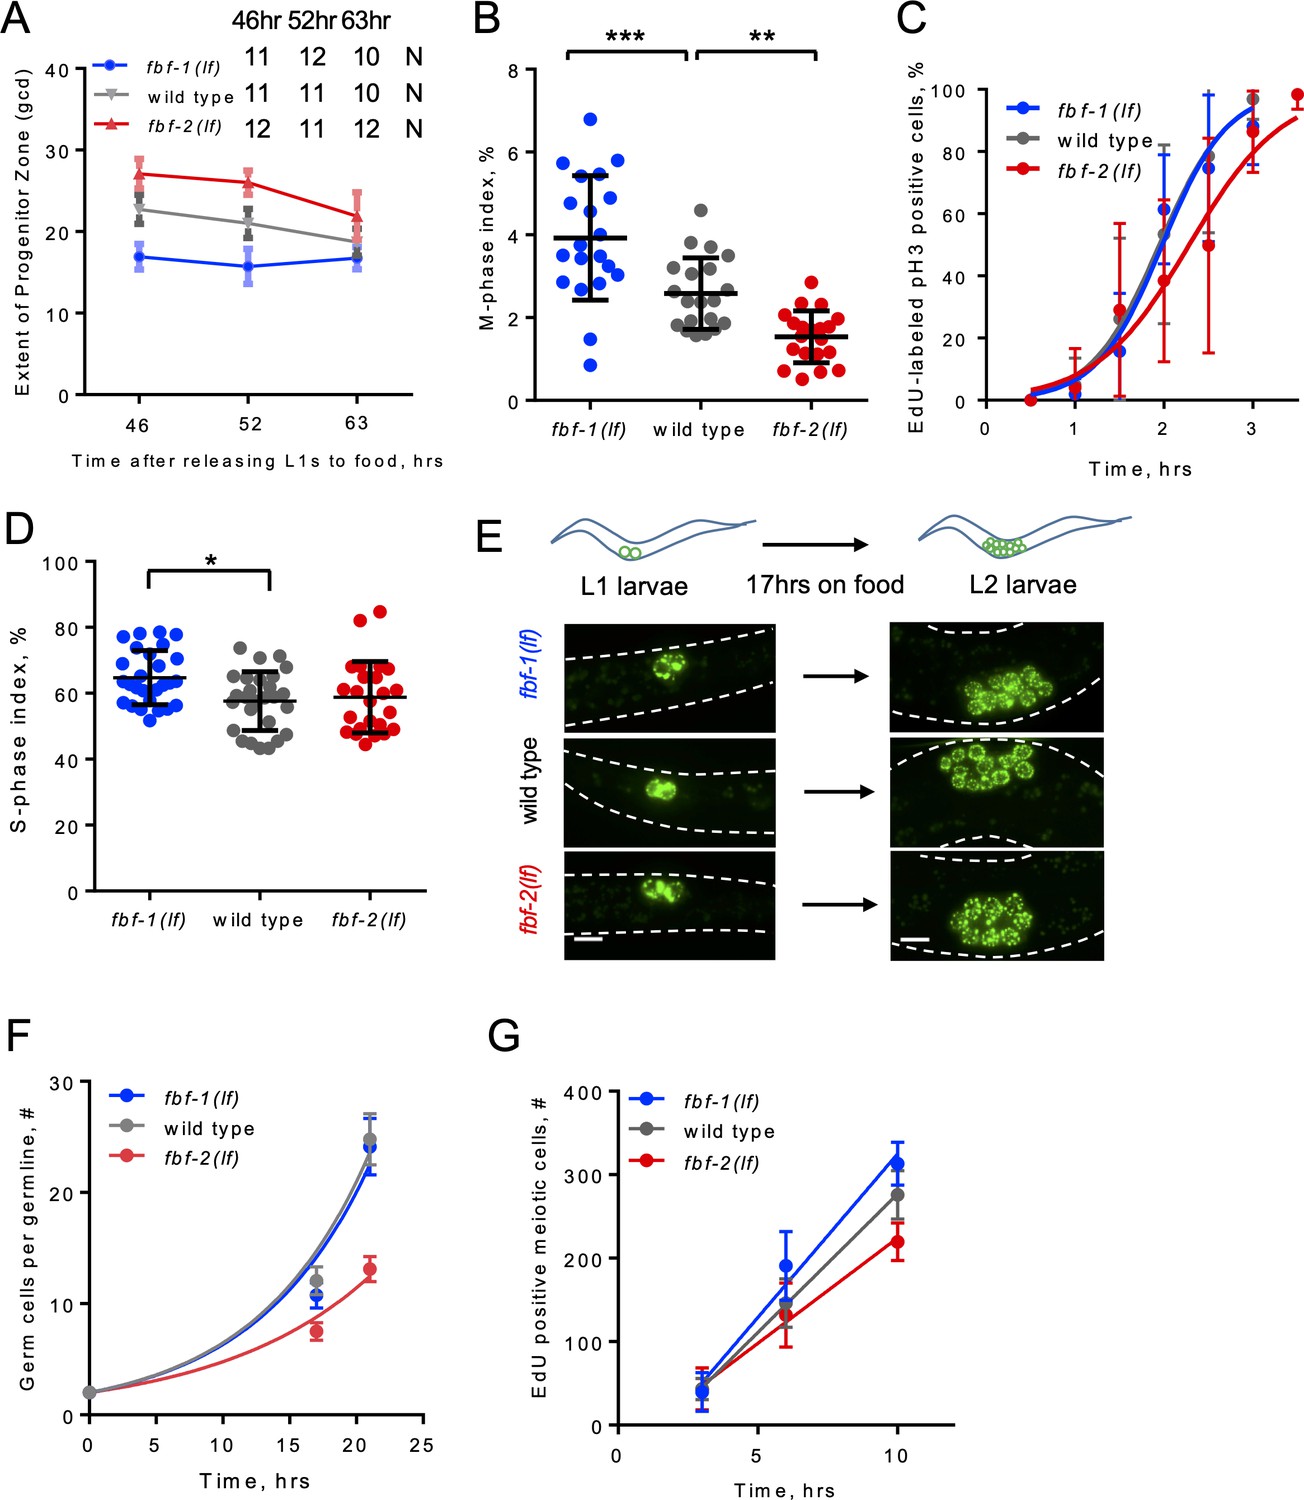
SPC dynamics in different genetic backgrounds.
(A) SPC zone length measured as the germ cell diameters (gcd) spanning the stem and progenitor cell zone. X-axis: the time after release of synchronized L1s from starvation. 46 hr, young adult; 52 hr, adult; 63 hr, second day adult. Plotted values are means ± S.D. 10–12 germlines were scored for each genotype at each time point. (B) Quantification of mitotic indices of germline SPCs in the genetic backgrounds indicated on the X-axis. Differences in mitotic indices were evaluated by one-way ANOVA with Dunnett’s post-test. Data were collected from two independent experiments and 10 germlines were scored for each genotype per replicate. (C) Representative time course of EdU labeling of mitotic cells in different genetic backgrounds in one biological replicate. X-axis displays the times when animals were dissected for staining for EdU and pH3. Y-axis indicates the percent of pH3-positive germ cells that are also EdU positive. Plotted values are means ± SD. 6–14 germlines were analyzed for each genotype per time point in each replicate. The median G2 lengths were interpolated as the times when 50% of nuclei in M phase (pH3-positive) were labeled with EdU. (D) S-phase indices of germline SPCs in different genetic backgrounds as indicated on the X-axis. Differences in S-phase indices were evaluated by one-way ANOVA with Dunnett’s post-test. Data were collected from three independent experiments with 7–10 germlines scored for each genotype per replicate. (E) Representative images of germ cells in the indicated genetic backgrounds and conditions. Germ cells are visualized using a germ-cell-specific marker PGL-1::GFP. Scale bar, 5 μm. (F) Quantification of larval germ cell proliferation in different genetic backgrounds. A representative time course of one biological replicate, plotted values are means ± SD. 15–21 larvae per genotype were analyzed for each time point. (G) Meiotic entry rate of progenitors in different genetic backgrounds. Representative time course of accumulating EdU-labeled, REC-8-negative germ cells in different genetic backgrounds in one biological replicate. X-axis displays time points when animals were dissected for staining for EdU and REC-8. Y-axis indicates the number of EdU-positive cells that are negative for REC-8. Plotted values are means ± SD. 5–7 germlines were scored for each genotype at each time point in each individual biological replicate, resulting in analysis of 89–94 total germlines per strain over five replicates. The data were fit to linear regression models, R values were between 0.87 and 0.94. The rates of meiotic entry were determined as the slopes of the regression lines. (A–G) All experiments were performed at 24°C.
Figure 1—figure supplement 2
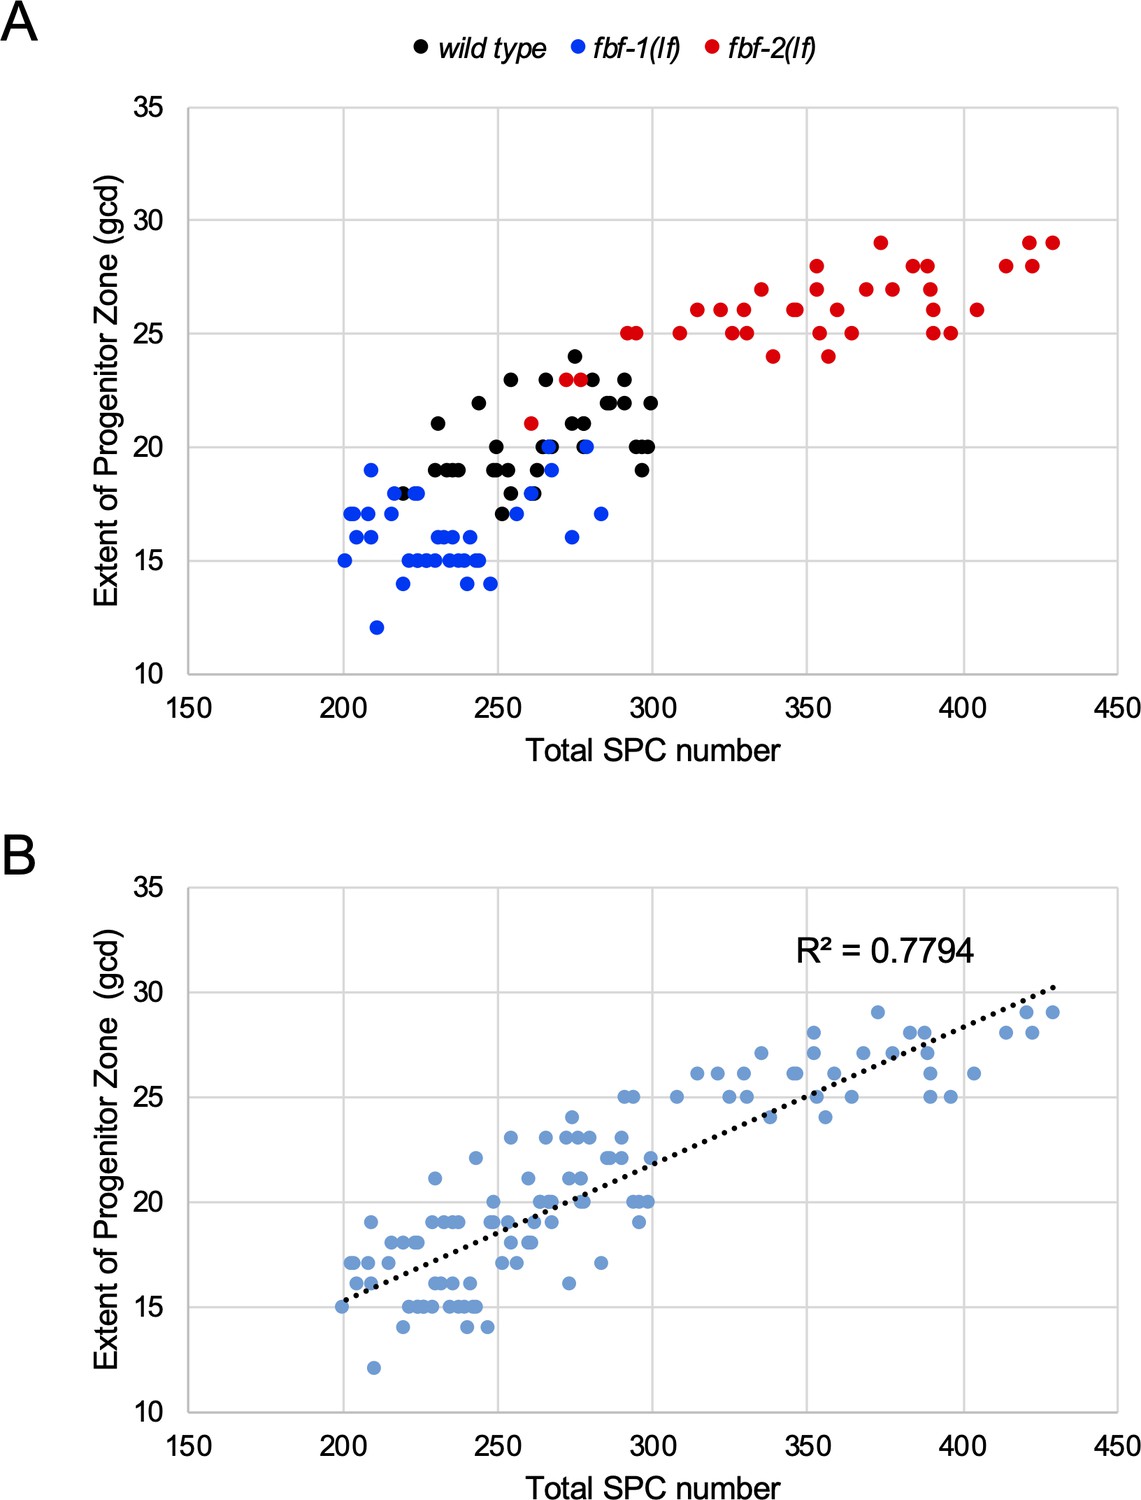
The number of SPC cell rows is a robust estimate of progenitor numbers.
(A) SPCs were counted in germlines of the wild type, fbf-1(lf), and fbf-2(lf) adults reared at 24°C; in parallel the lengths of SPC zones were measured as the number of REC-8-positive cell diameters. The SPC zone length (gcd) is plotted against the number of SPCs in each germline. The data represent three biological replicates for each strain. (B) Linear regression analysis performed on merged data from A shows robust correlation between the SPC number and SPC zone length in the three genetic backgrounds analyzed (R2 = 0.7794).
Figure 2
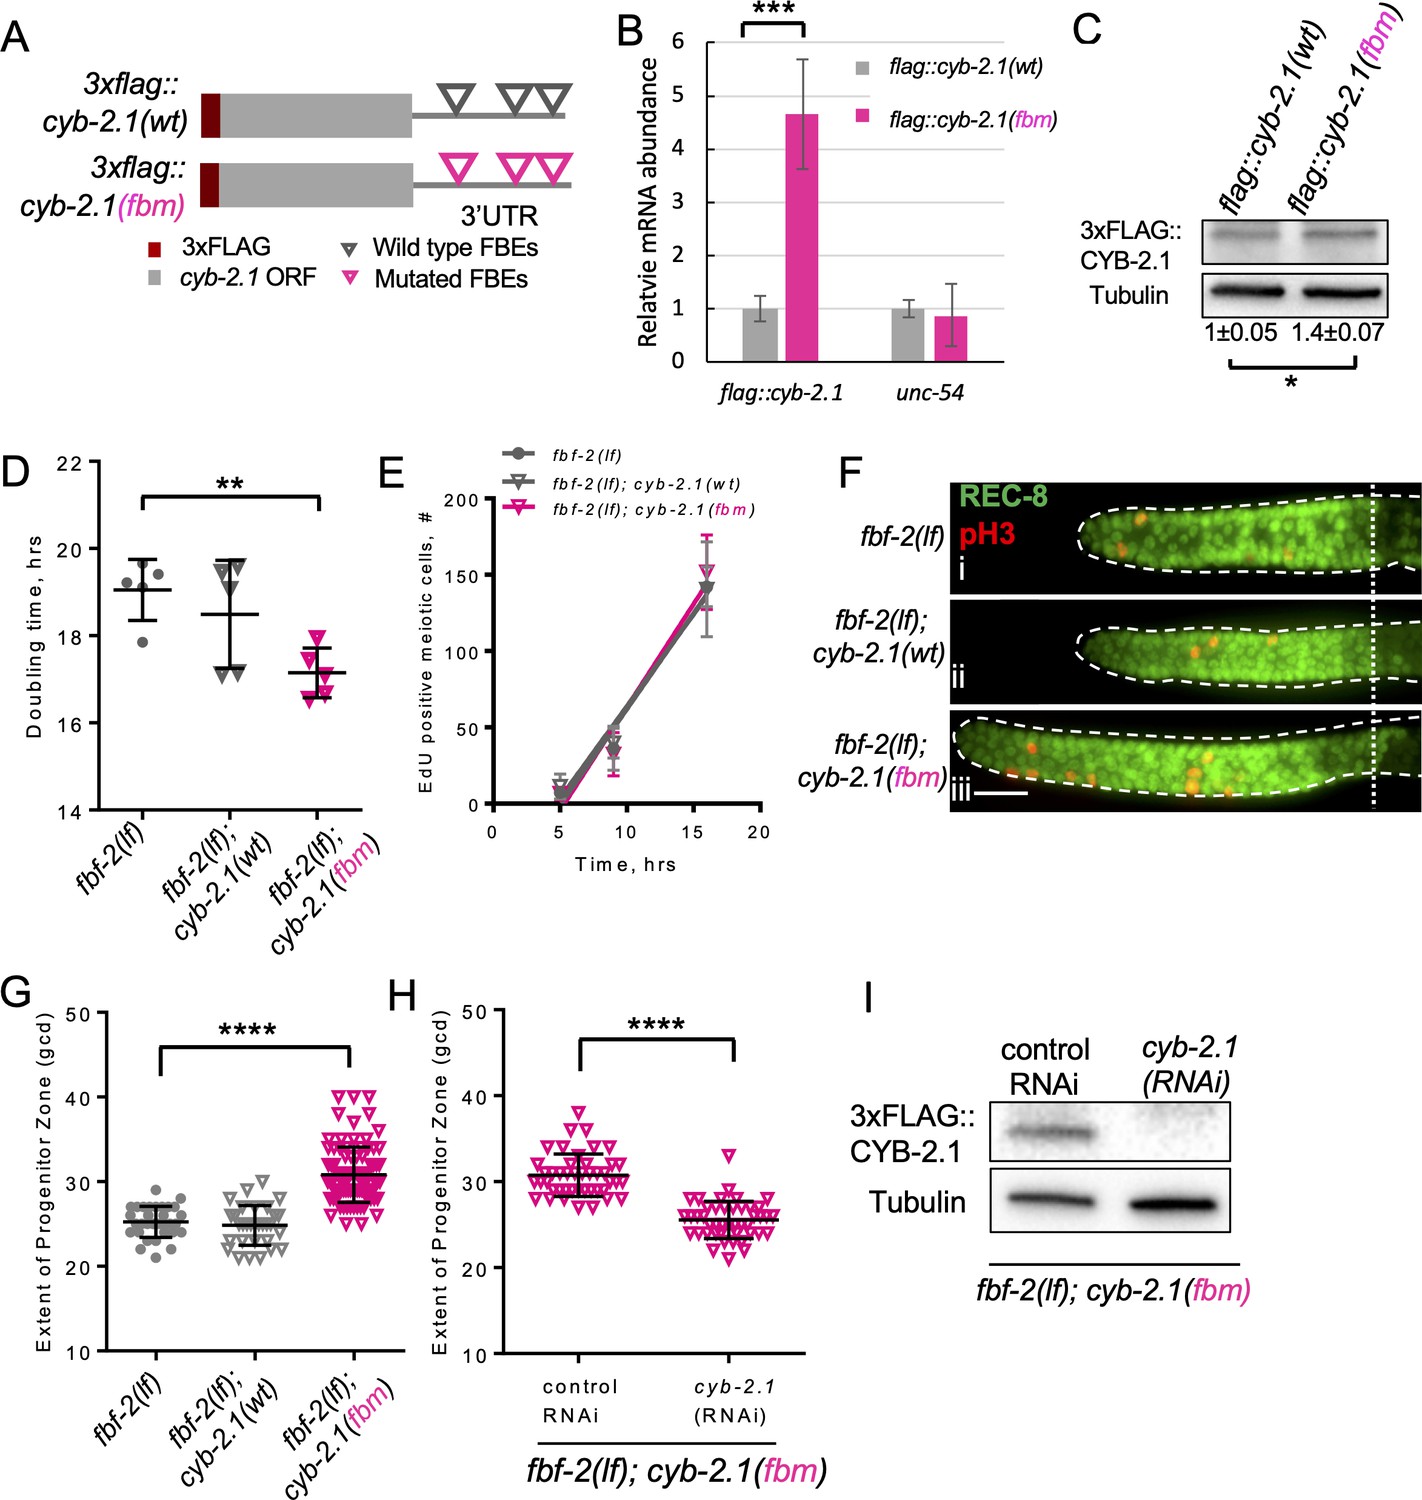
FBF-mediated repression of cyclin B limits accumulation of germline progenitor cells.
(A) Schematic representation of transgenes encoding 3xFLAG-tagged CYB-2.1(wt) with wild type FBF binding elements (FBEs, UGUxxxAU) in 3’UTR and 3xFLAG-tagged CYB-2.1(fbm) with FBF binding elements mutated (ACAxxxAU). (B) qRT-PCR of 3xflag::cyb-2.1 and unc-54 transcripts in 3xflag::cyb-2.1(wt) and 3xflag::cyb-2.1(fbm) worms using actin (act-1) as a normalization control. Data represent two replicates, values are average ± SD. Differences in levels were evaluated by T-test; asterisks mark statistically significant difference (p<0.001). (C) Immunoblot analysis of 3xFLAG::CYB-2.1 protein levels in 3xflag::cyb-2.1(wt) and 3xflag::cyb-2.1(fbm) worms using α-tubulin as a loading control. Data represent three replicates, values are average ± SD. Differences in levels were evaluated by T-test; asterisk marks statistically significant difference (p<0.05). (D) Larval germ cell doubling time in different genetic backgrounds (as indicated on the X-axis). Plotted values are individual data points and means ± SD. Difference in germ cell doubling time was evaluated by one-way ANOVA with Dunnett’s post-test. (E) Meiotic entry of progenitors in different genetic backgrounds. Time course of accumulating EdU-labeled, REC-8 negative germ cells in different genetic backgrounds in one biological replicate (the data are representative of two biological replicates, each analyzing 6–7 germlines per strain per time point, up to 41–42 germlines per strain total). X-axis displays time points when animals were dissected for staining for EdU and REC-8. Y-axis indicates the number of EdU-positive cells that are negative for REC-8. Plotted values are means ± SD. (F) Distal germlines dissected from the fbf-2(lf), fbf-2(lf); cyb-2.1(fbm) and fbf-2(lf); cyb-2.1(wt) animals and stained with anti-REC-8 (green) and anti-pH3 (red). Germlines are outlined with dashed lines and the vertical dotted line marks the beginning of transition zone. Scale bar: 10 μm. (G) The extent of SPC zone in the fbf-2(lf), fbf-2(lf); cyb-2.1(fbm) and fbf-2(lf); cyb-2.1(wt) genetic backgrounds. Plotted values are individual data points and means ± SD. Differences in SPC zone lengths were evaluated by one-way ANOVA with Dunnett’s post-test; asterisks mark statistically significant difference (p<0.0001). Data were collected from two independent experiments and 14–19 germlines were scored for each genotype per replicate. (H) The extent of SPC zone in the fbf-2(lf); cyb-2.1(fbm) after cyb-2.1(RNAi) compared to the empty vector RNAi control. Plotted values are individual data points and means ± SD. Differences in SPC zone lengths were evaluated by T-test; asterisks mark statistically-significant difference (p<0.0001). Data were collected from two independent experiments and 44 independent germlines were scored for each condition. (I) Immunoblot analysis of 3xFLAG::CYB-2.1 protein levels in 3xflag::cyb-2.1fbm after cyb-2.1(RNAi) compared to the empty vector RNAi control. Tubulin was used as a loading control. (B–I) All experiments were performed at 15°C.
Figure 3 with 1 supplement
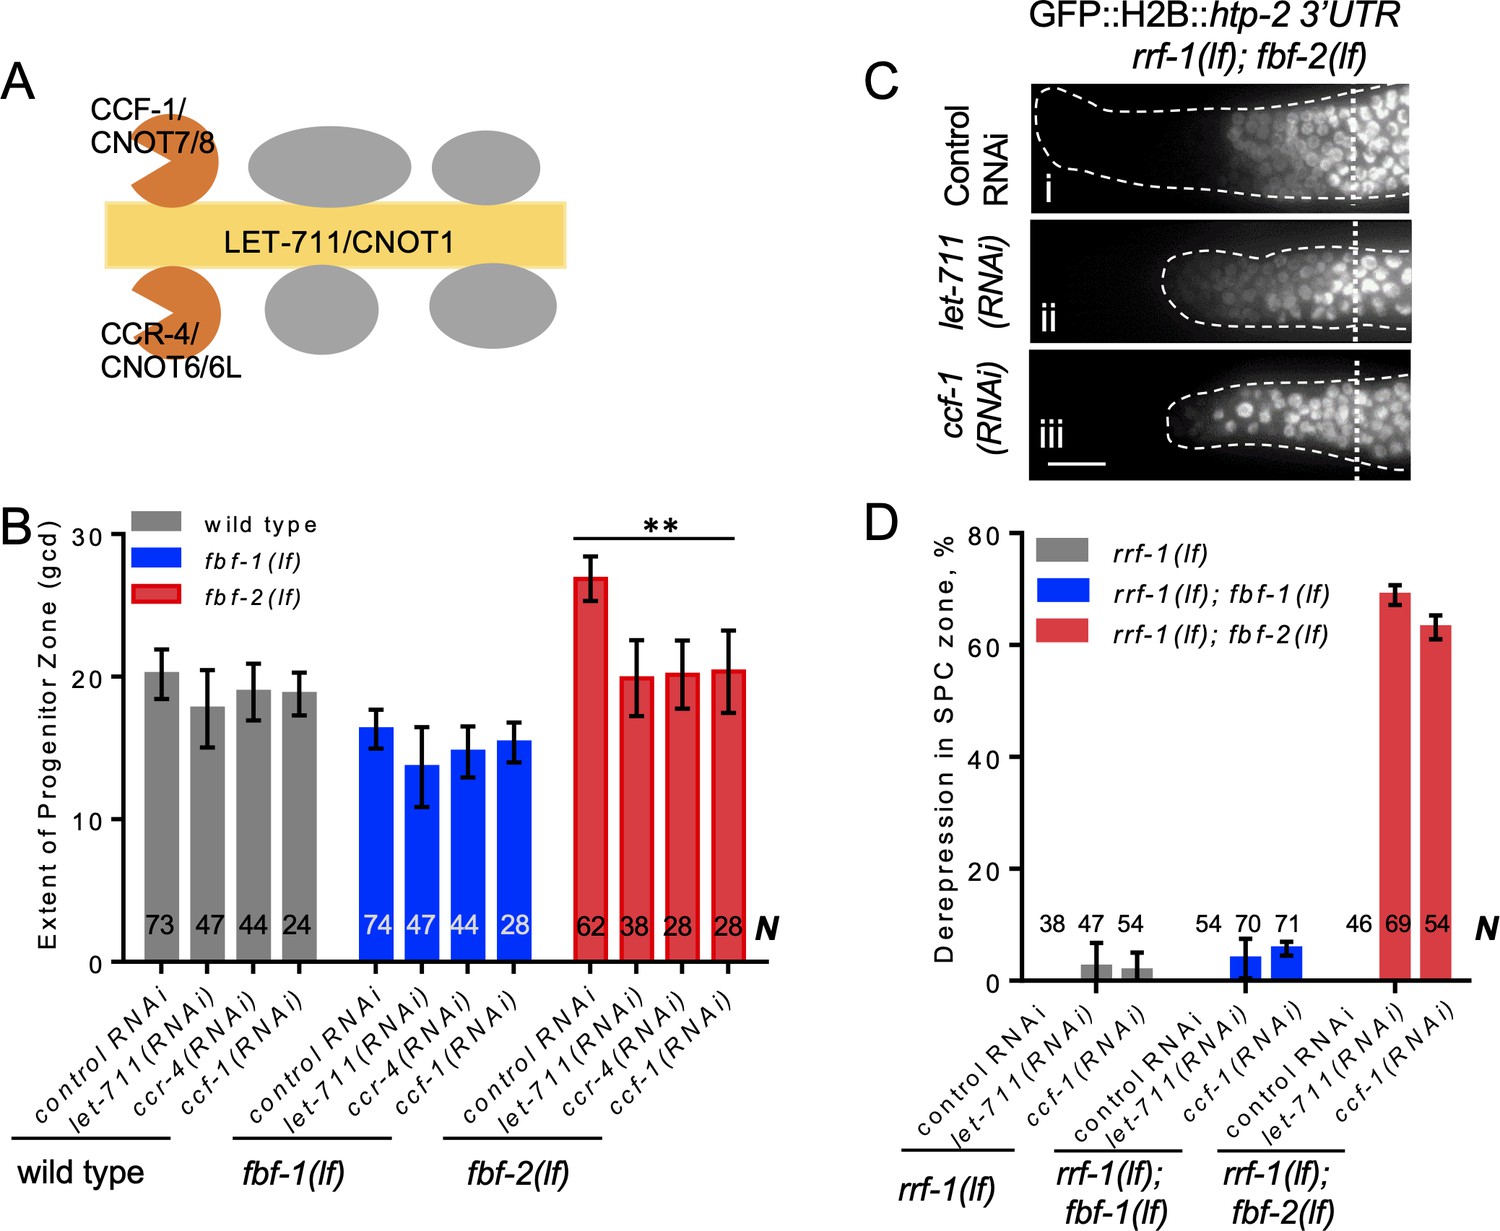
CCR4-NOT deadenylase complex promotes FBF-1 function in germline SPCs.
(A) Schematic of CCR4-NOT deadenylase complex in humans and C. elegans; highlighted are the scaffold (yellow) and catalytic (orange) subunits targeted by RNAi in this study. (B) The extent of SPC zone after knocking down CCR4-NOT subunits in the wild type, fbf-1(lf) and fbf-2(lf) genetic backgrounds. Genetic backgrounds and RNAi treatments are indicated on the X-axis and the average size of SPC zone ± SD is plotted on the Y-axis. Differences between CCR4-NOT RNAi and the empty vector RNAi control were evaluated by one-way ANOVA. Asterisks mark the group with significant changes in SPC zone length after CCR4-NOT knockdown, p<0.01. Data were collected from three independent experiments. N, the number of hermaphrodite germlines scored. (C) Distal germlines of rrf-1(lf); fbf-2(lf) expressing a GFP::Histone H2B fusion under the control of the htp-2 3’UTR after the indicated RNAi treatments. Germlines are outlined with dashed lines and vertical dotted lines indicate the beginning of the transition zone. All images were taken with a standard exposure. Scale bar: 10 μm. (D) Percentage of germlines showing expression of GFP::H2B fusion extended to the distal end in the indicated genetic backgrounds and knockdown conditions. Plotted values are means ± SD. Data were collected from three independent experiments. N, the number of germlines scored. Efficiencies of RNAi treatments were confirmed by sterility (Figure 3—figure supplement 1B) or embryonic lethality (Supplementary file 3). (B–D) All experiments were performed at 24°C.
Figure 3—figure supplement 1
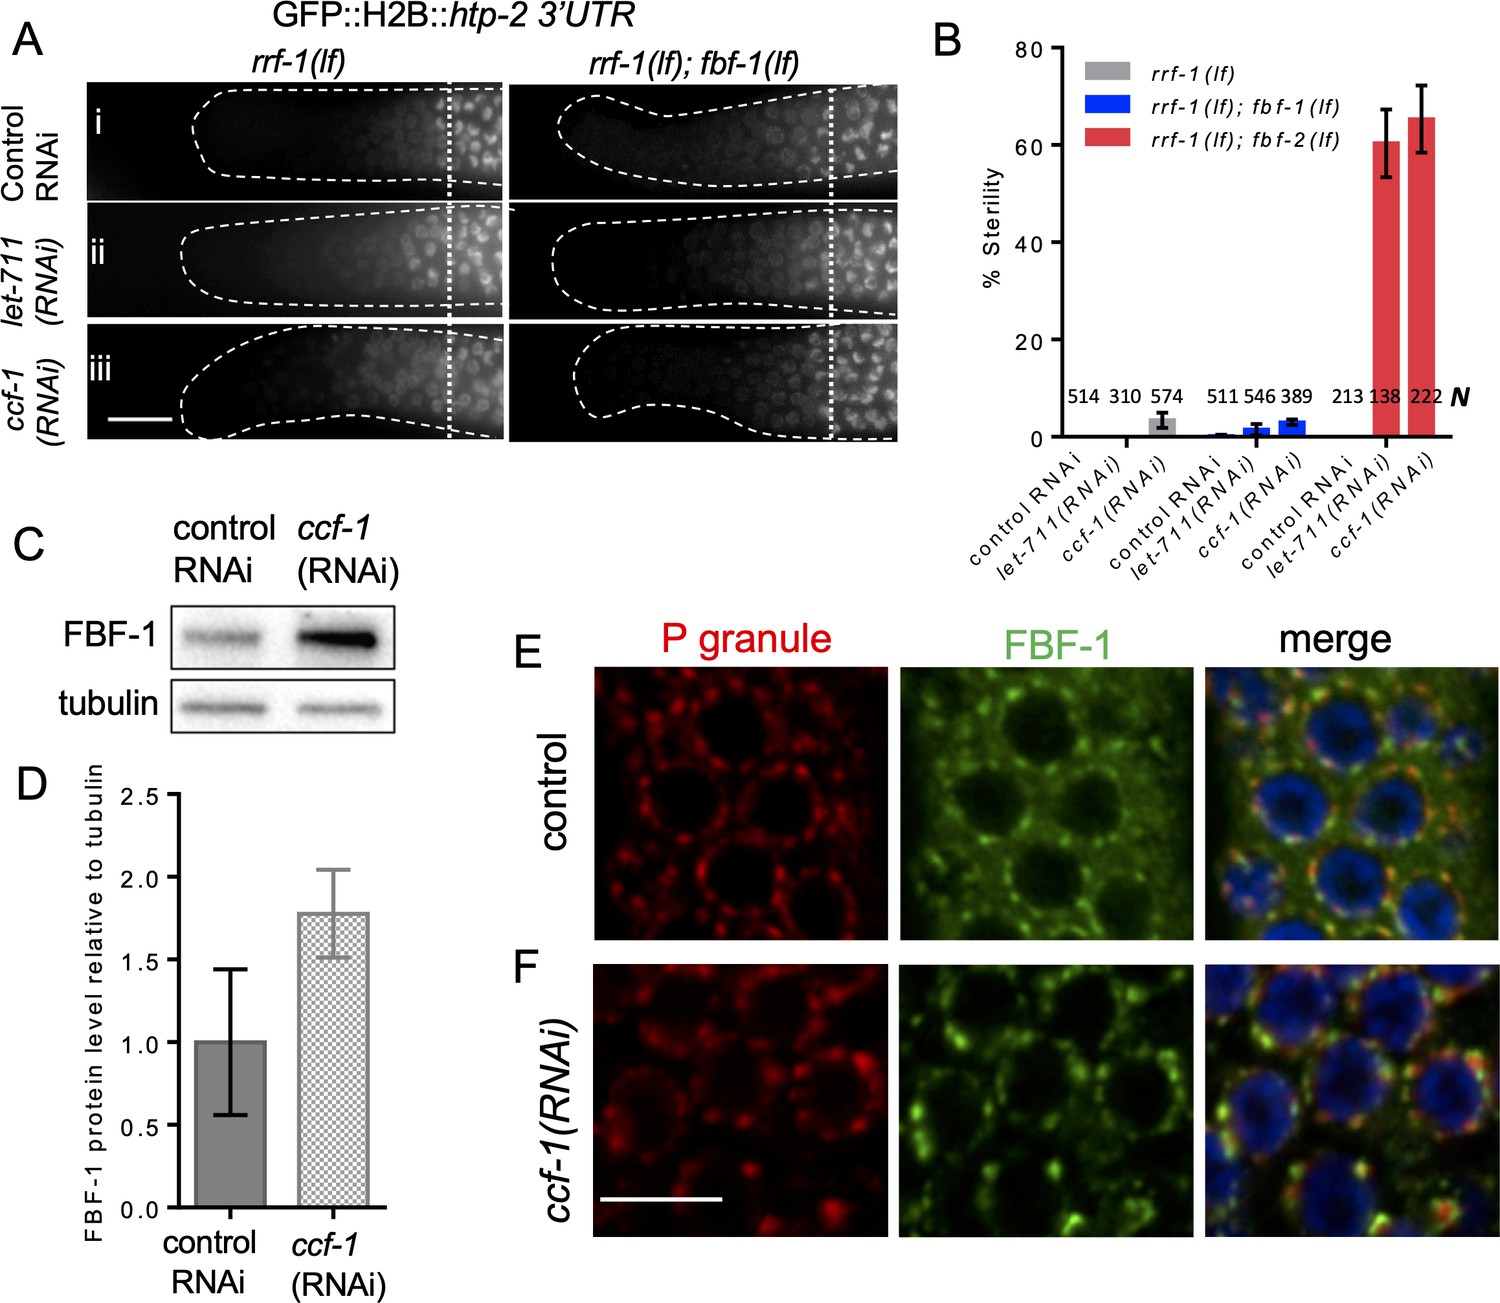
CCR4-NOT deadenylase complex promotes FBF-1 function in germline SPCs.
(A) Distal germlines of rrf-1(lf) and rrf-1(lf); fbf-1(lf) expressing GFP::Histone H2B fusion under the control of the htp-2 3’UTR after the indicated RNAi treatments. Genetic backgrounds are indicated on top of each image column. Germlines are outlined with dashed lines and vertical dotted lines indicate the beginning of the transition zone. All images were taken with a standard exposure. Scale bar: 10 μm. Efficiencies of RNAi treatments were assessed by sterility (panel B) or embryonic lethality (Supplementary file 3). (B) Percentage of sterile worms after a knockdown of CCR4-NOT subunits in rrf-1(lf), rrf-1(lf); fbf-1(lf) and rrf-1(lf); fbf-2(lf) genetic backgrounds. Data were collected from three independent experiments. N, the number of hermaphrodites scored. (C) A representative western blot detecting endogenous FBF-1 following ccf-1(RNAi). Tubulin is used as a control. (D) Endogenous FBF-1 protein levels following ccf-1(RNAi) determined by densitometry of the western blot results from three independent experiments normalized to tubulin. Plotted values are means ± SD. (E, F) Confocal images of germline SPC zone co-immunostained for endogenous FBF-1 (green) and P granules (red) in empty vector RNAi control germlines (E) and after ccf-1 knockdown (F). Scale bar: 5 μm. (A–F) All experiments were performed at 24°C.
Figure 4 with 1 supplement
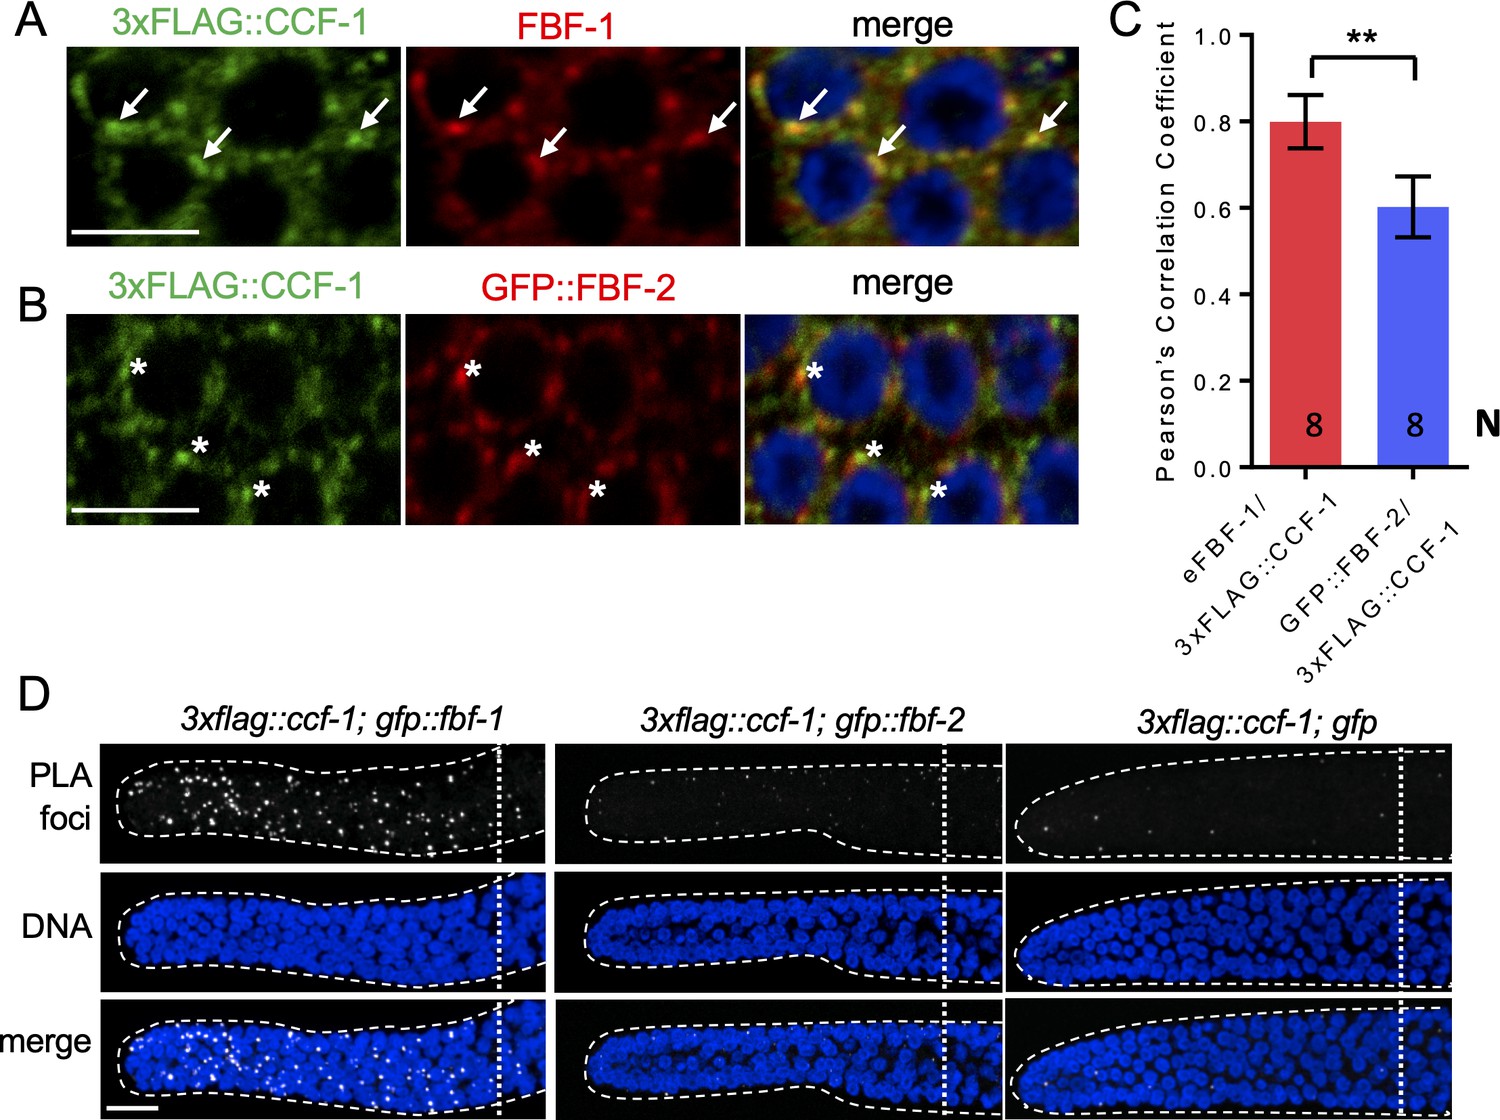
FBF-1 colocalizes with CCR4-NOT complex in germline SPCs.
(A–B) Confocal images of SPCs co-immunostained for endogenous FBF-1 (A) or GFP-tagged FBF-2 (B, red) and 3xFLAG-tagged CCF-1 (green). DNA staining is in blue (DAPI). Arrows indicate complete overlap of FBF-1 and CCF-1 granules. Asterisks denote FBF-2 granules localizing close but not overlapping with CCF-1 granules. Scale bars in A and B: 5 μm. (C) Pearson’s correlation analysis quantifying the colocalization between FBF and CCF-1 granules in co-stained germline images. Plotted values are means ± SD. N, the number of analyzed germline images (single confocal sections through the middle of germline SPC nuclei including 5–8 germ cells). Asterisks mark statistically significant difference by Student’s t-test, p<0.01. (D) Confocal images of the distal germline SPC zones with PLA foci (grayscale) and DNA staining (blue). Germlines are outlined with dashed lines and vertical dotted lines indicate the beginning of the transition zone. Genotypes are indicated on top of each image group. Scale bar: 10 μm. (A–D) All experiments were performed at 24°C.
Figure 4—figure supplement 1
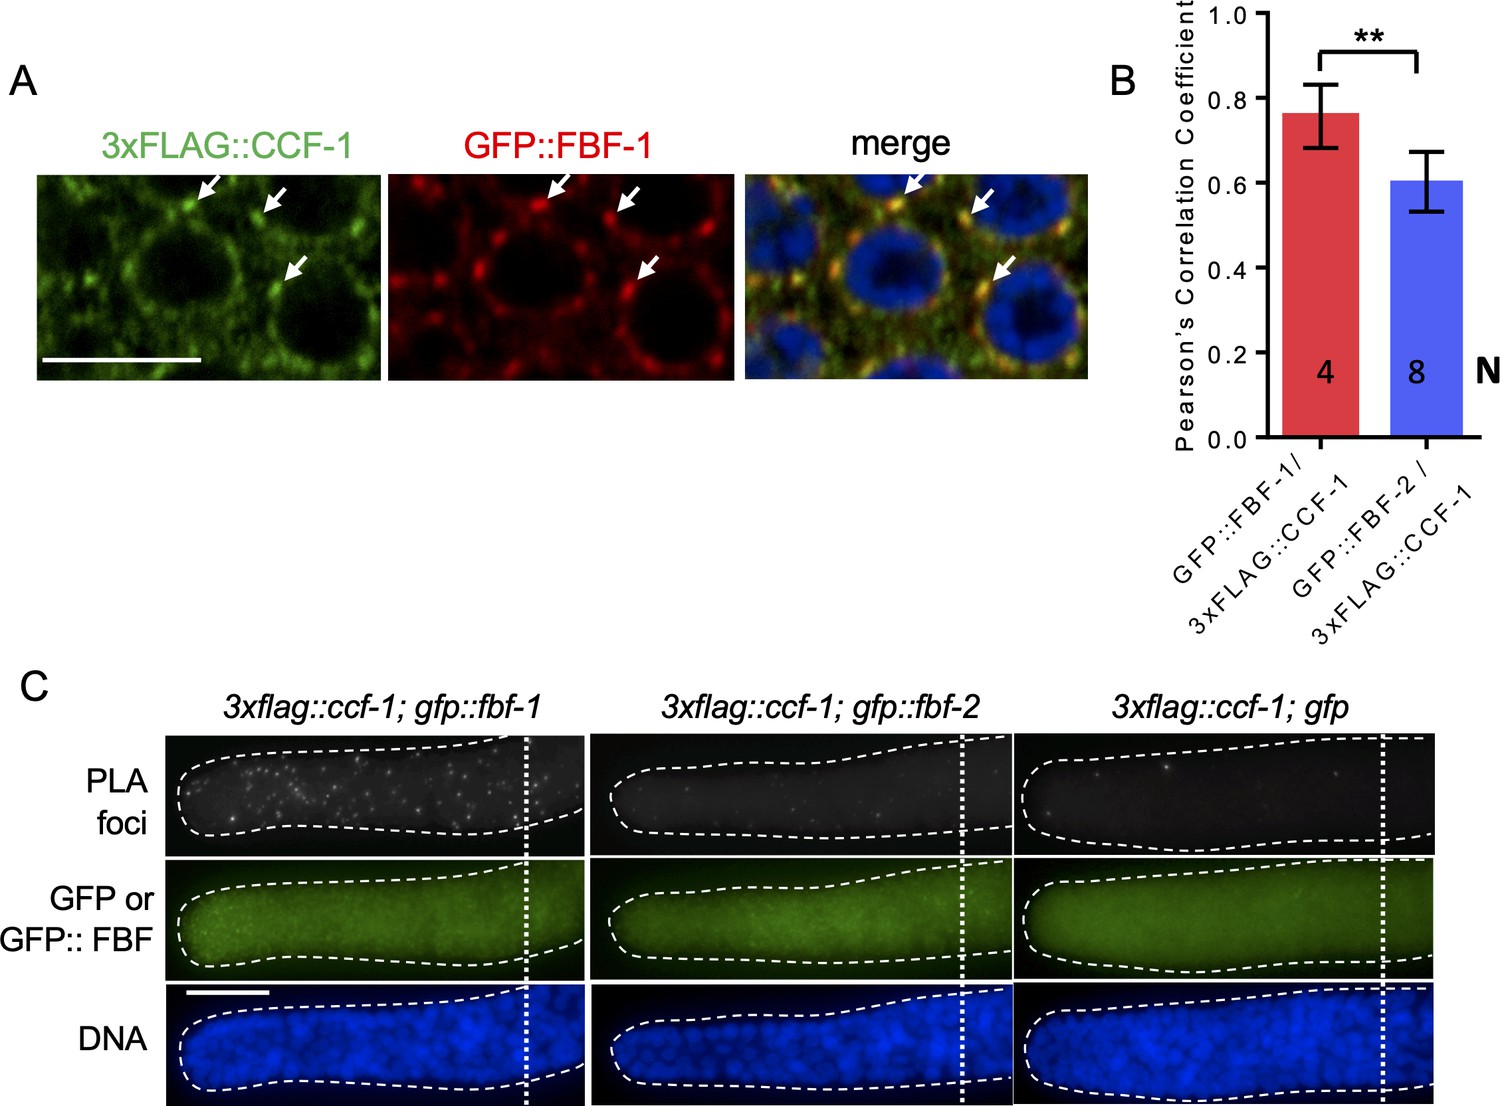
FBF-1 colocalizes with CCR4-NOT complex in germline SPCs.
(A) Confocal images of SPCs co-immunostained for GFP::FBF-1(red) and FLAG::CCF-1 (green). DNA staining (DAPI) is in blue. Arrows indicate complete overlap of FBF-1 and CCF-1 granules. Scale bar: 5 μm. (B) Pearson’s correlation analysis of the colocalization between GFP::FBF-1 and FLAG::CCF-1 granules in four single confocal sections compared to GFP::FBF-2/FLAG::CCF-1. Plotted values are means ± SD. Statistical analysis was performed by Student’s t-test; asterisks mark statistically significant difference, p<0.01. The values for GFP::FBF-2/FLAG::CCF-1 colocalization are same as in Figure 4C. (C) Epifluorescent images showing PLA signals (greyscale) and expression of GFP::FBF-1, GFP::FBF-2, and GFP alone (green) in SPCs. DNA staining is in blue (DAPI). Genotypes are indicated above each image group. Scale bar: 10 μm. (A–C) All experiments were performed at 24°C.
Figure 5 with 1 supplement
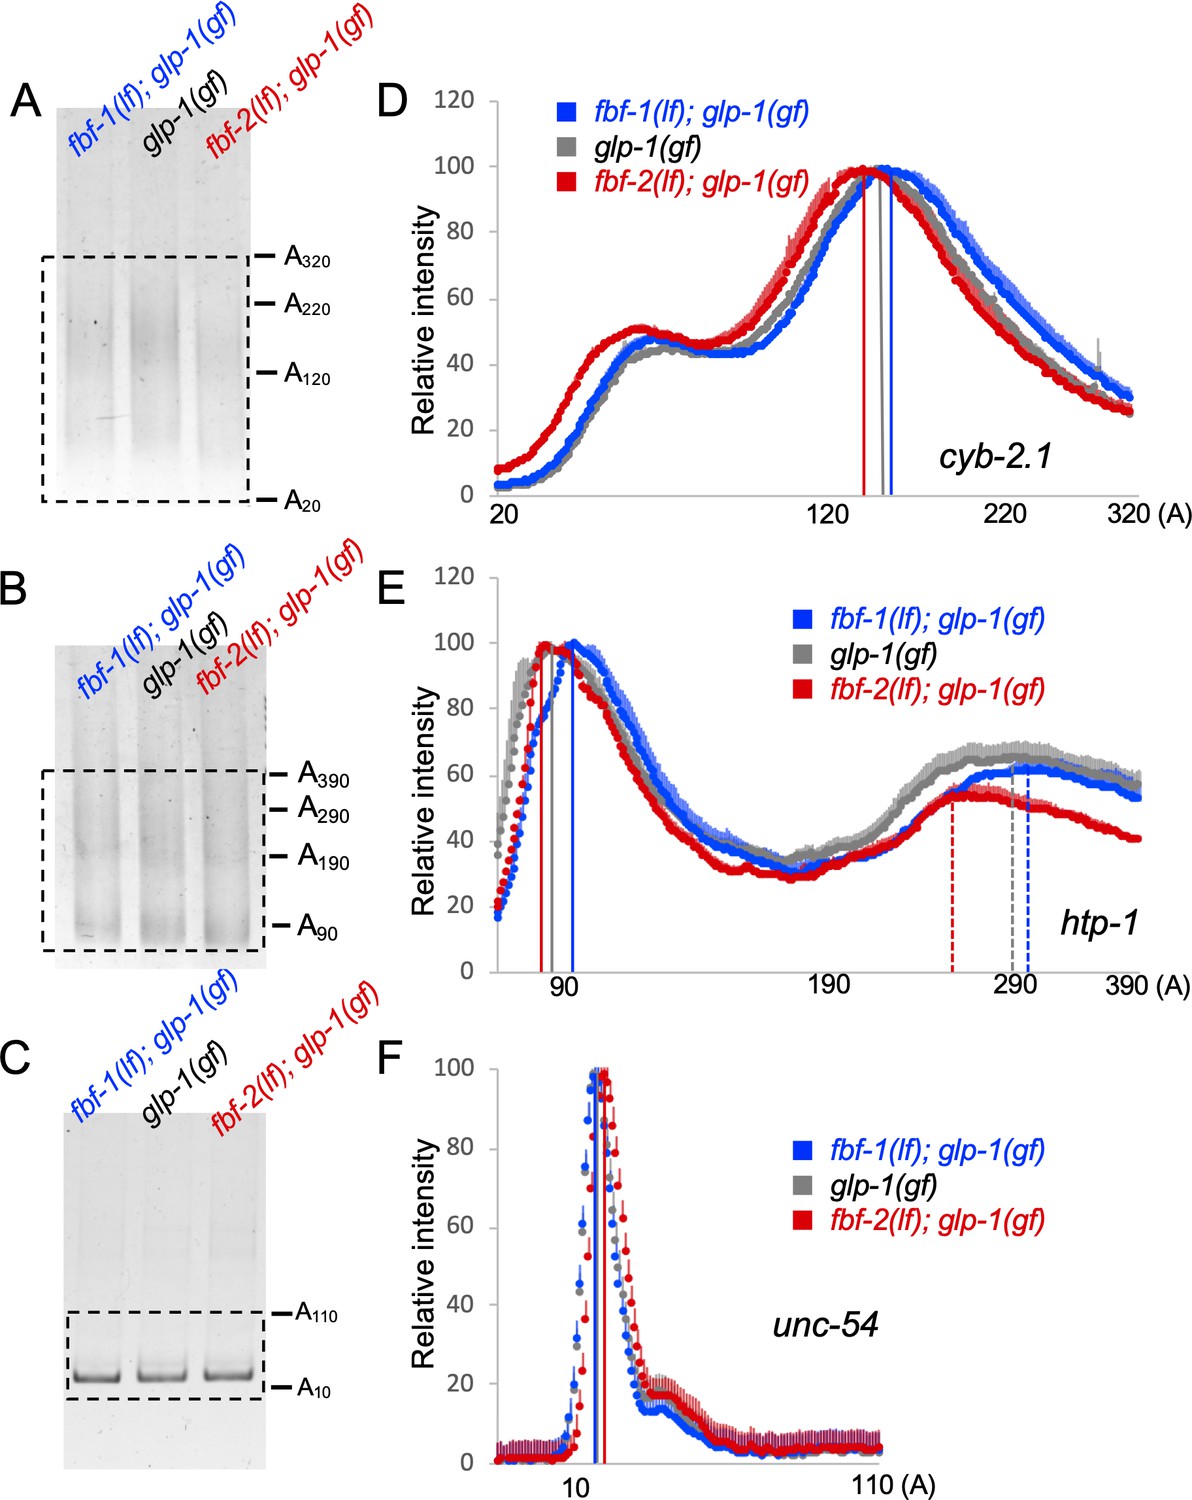
Antagonistic effects of FBF-1 and FBF-2 on poly(A) tail of target mRNAs.
(A–C) Representative PAT-PCR amplification of the poly(A) tail of cyb-2.1 (A), htp-1 (B) and control myosin heavy chain unc-54 (C) in fbf-1(lf); glp-1(gf), glp-1(gf), and fbf-2(lf); glp-1(gf) genetic backgrounds at 25°C. The estimated lengths of poly(A) tails based on the PCR fragment sizes are indicated on the right. The areas boxed by dotted lines were quantified by densitometry in ImageJ. (D–F) Densitometric quantification of PAT-PCR amplification products (boxed in A-C). Y-axis, mean relative intensity represents the average intensities of normalized PAT-PCR reactions from three independent biological replicates. X-axis, estimated sizes of poly(A) tails. Values are means + SD. Vertical lines in (D–F) mark the peaks of PAT-PCR intensity profiles for each mRNA in each genetic background, dashed lines mark secondary peaks for htp-1. (A–F) Nematodes for all replicates were grown at 25°C.
Figure 5—figure supplement 1
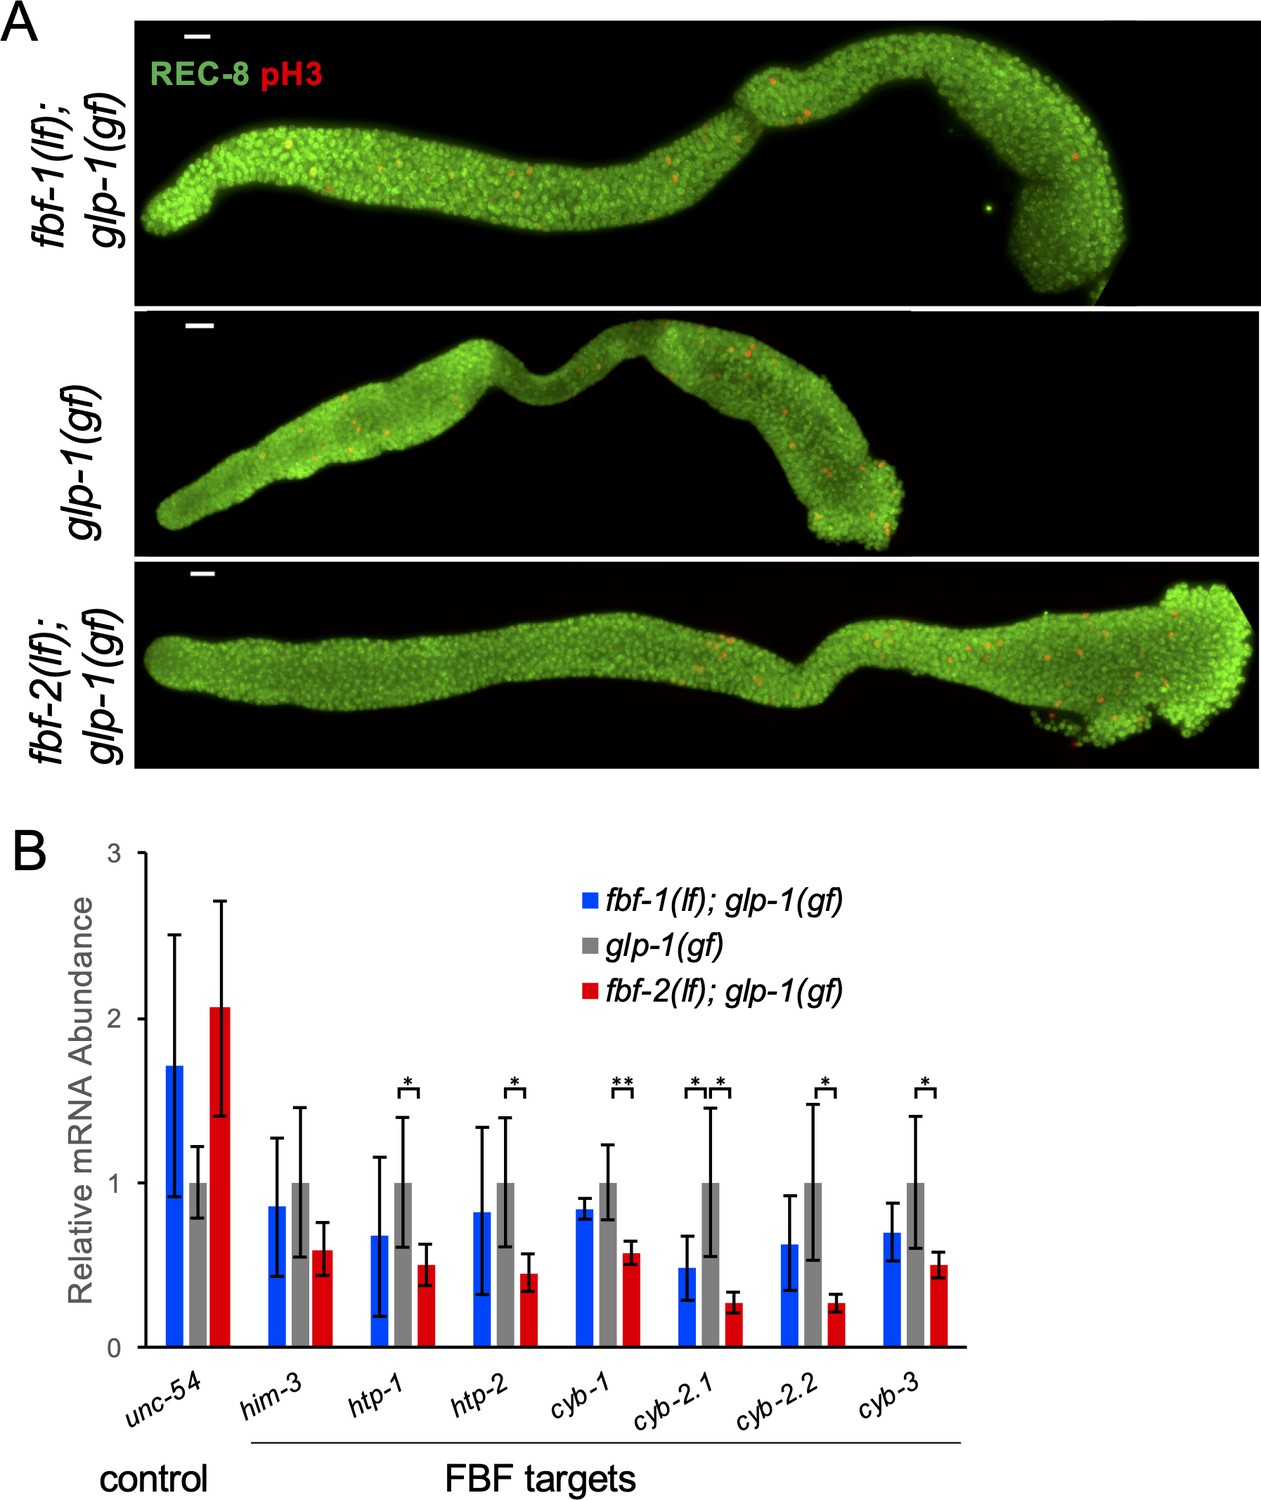
RNA analysis from predominantly mitotic germlines in glp-1(gf) genetic background.
(A) Full germline tumors were observed in all glp-1(gf) strains grown at the restrictive temperature. Germlines dissected from fbf-1(lf); glp-1(gf), glp-1(gf), and fbf-2(lf); glp-1(gf) animals grown at 25°C are stained with anti-REC-8 (green) and anti-pH3(red). Scale bars: 10 μm. (B) Steady-state mRNA abundance of FBF target genes and a control non-FBF target gene in glp-1(gf); fbf-1(lf), glp-1(gf), and glp-1(gf); fbf-2(lf) genetic backgrounds at 25°C was determined by qRT-PCR and normalized to the levels of actin (act-1). Tested FBF target genes are associated with meiotic entry (him-3, htp-1 and htp-2) or cell cycle regulation (cyb-1, cyb-2.1, cyb-2.2 and cyb-3). The control gene is a myosin heavy chain, unc-54. Reported abundance represents the mean ± SD of the following number of independent biological replicates: three for glp-1(gf), four for fbf-2(lf); glp-1(gf), and six for fbf-1(lf); glp-1(gf). Differences in mRNA abundance between fbf-2(lf) mutants and control were evaluated by one-way ANOVA tests with Student’s t-test post-test; asterisks mark statistically significant differences (**, p<0.01; *, p<0.05). (A–B) All experiments were performed at 25°C.
Figure 6 with 1 supplement
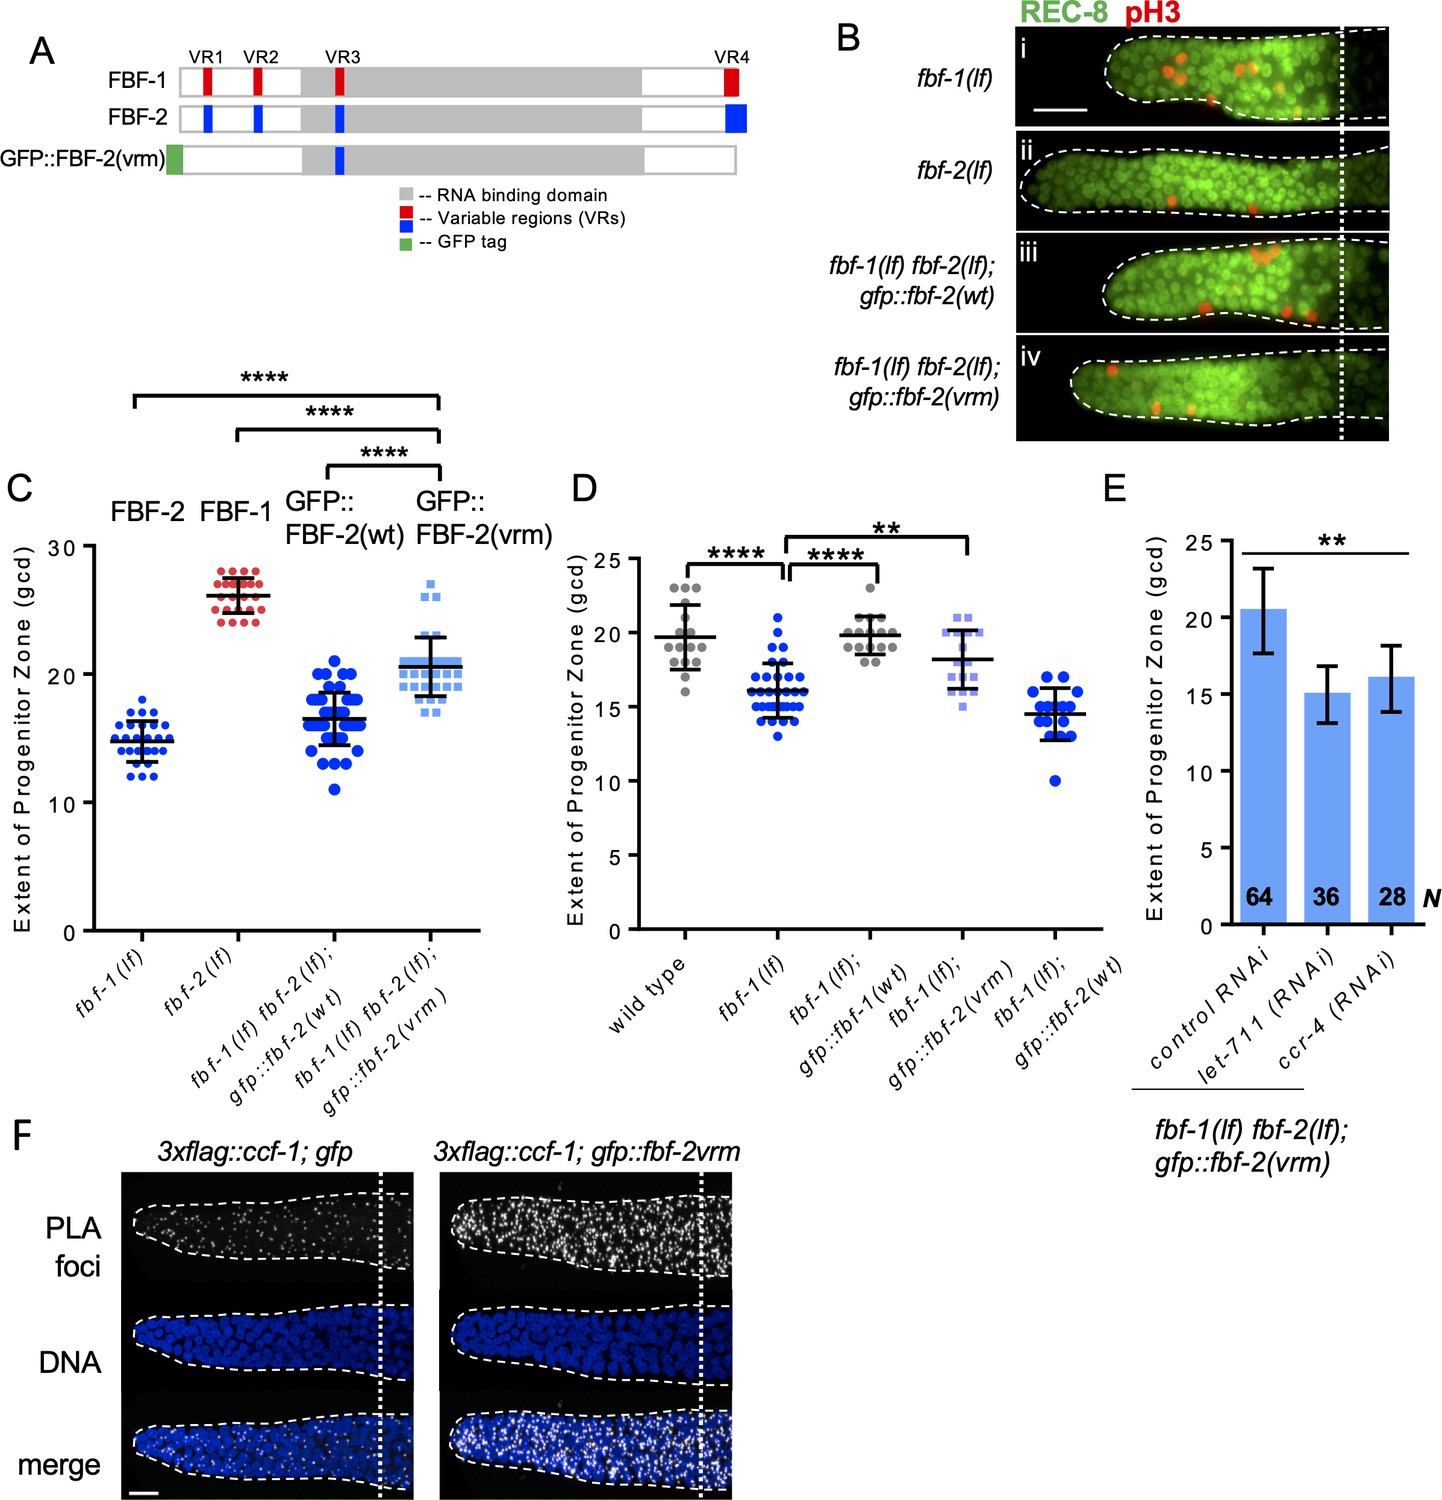
Three variable regions of FBF-2 prevent its cooperation with CCR4-NOT.
(A) Schematics of FBF-1, FBF-2 and GFP::FBF-2(vrm) mutant transgene (Wang et al., 2016). Red and blue boxes indicate variable regions distinguishing FBF-1 and FBF-2 respectively, grey box indicates the RNA-binding domain, and green box indicates GFP tag. (B) Distal germlines of the indicated genetic backgrounds stained with anti-REC-8 (green) and anti-pH3 (red). Germlines are outlined with the dashed lines, and the vertical dotted line marks the beginning of transition zone. Scale bar: 10 μm. (C) The extent of SPC zone in the indicated genetic backgrounds (on the X-axis). FBF protein(s) present in each genetic background are noted above each data set. Plotted values are individual data points and means ± SD. Differences in SPC zone length between fbf-1(lf) fbf-2(lf); gfp::fbf-2(vrm) and the other strains were evaluated by one-way ANOVA test with Dunnett’s post-test; asterisks mark statistically significant differences (p<0.0001). Data were collected from three independent experiments and 24–28 germlines were scored for each genotype. (D) The extent of SPC zone was measured after crossing the GFP::FBF-2(vrm), GFP::FBF-1(wt) and GFP::FBF-2(wt) transgenes into fbf-1(lf) genetic background. As controls, SPC zone length was also measured in fbf-1(lf) and the wild type. Plotted values are individual data points and means ± SD. Data were collected from two independent experiments and 8–17 germlines were scored for each genotype per replicate. Differences in SPC zone length between fbf-1(lf) and all other strains were evaluated by one-way ANOVA test with Dunnett’s post-test; asterisks mark statistically significant differences (****, p<0.0001; **p<0.01). (E) The extent of SPC zone after knocking down CCR4-NOT subunits in the fbf-1(lf) fbf-2(lf); gfp::fbf-2(vrm) genetic background. RNAi treatments are indicated on the X-axis and average length of SPC zone ± SD on the Y-axis. Differences in SPC zone length between CCR4-NOT knockdowns and control were evaluated by one-way ANOVA (asterisks, p<0.01). Data were collected from three independent experiments. N, the number of independent germlines scored. (F) Confocal images of the distal germline SPC zones with PLA foci (grayscale) and DNA staining (blue). Germlines are outlined with dashed lines and vertical dotted lines indicate the beginning of the transition zone. Genotypes are indicated on top of each image group. Scale bar: 10 μm. (B–D): All experiments were performed at 24°C.
Figure 6—figure supplement 1

Variable regions 1, 2 and 4 of FBF-2 are required to rescue FBF-2-specific function in germline SPCs.
(A) Expression levels of GFP::FBF-2(wt) and GFP::FBF-2(vrm) transgenes assessed by a western blot. Tubulin is used as a control. (B) The extent of SPC zone measured after crossing the GFP::FBF-2(vrm), GFP::FBF-2(wt) and GFP::FBF-1(wt) transgenes into fbf-2(lf) genetic background. As controls, SPC zone length was also measured in fbf-2(lf) and the wild type. Plotted values are individual data points and means ± SD. Differences in SPC zone length between fbf-2(lf) and other strains were evaluated by one-way ANOVA test with Dunnett’s post-test; asterisks mark statistically significant differences (****, p<0.0001). Data were collected from two independent experiments and 6–16 germlines were scored for each genotype per replicate. (A–B) All experiments were performed at 24°C.
Figure 7 with 1 supplement
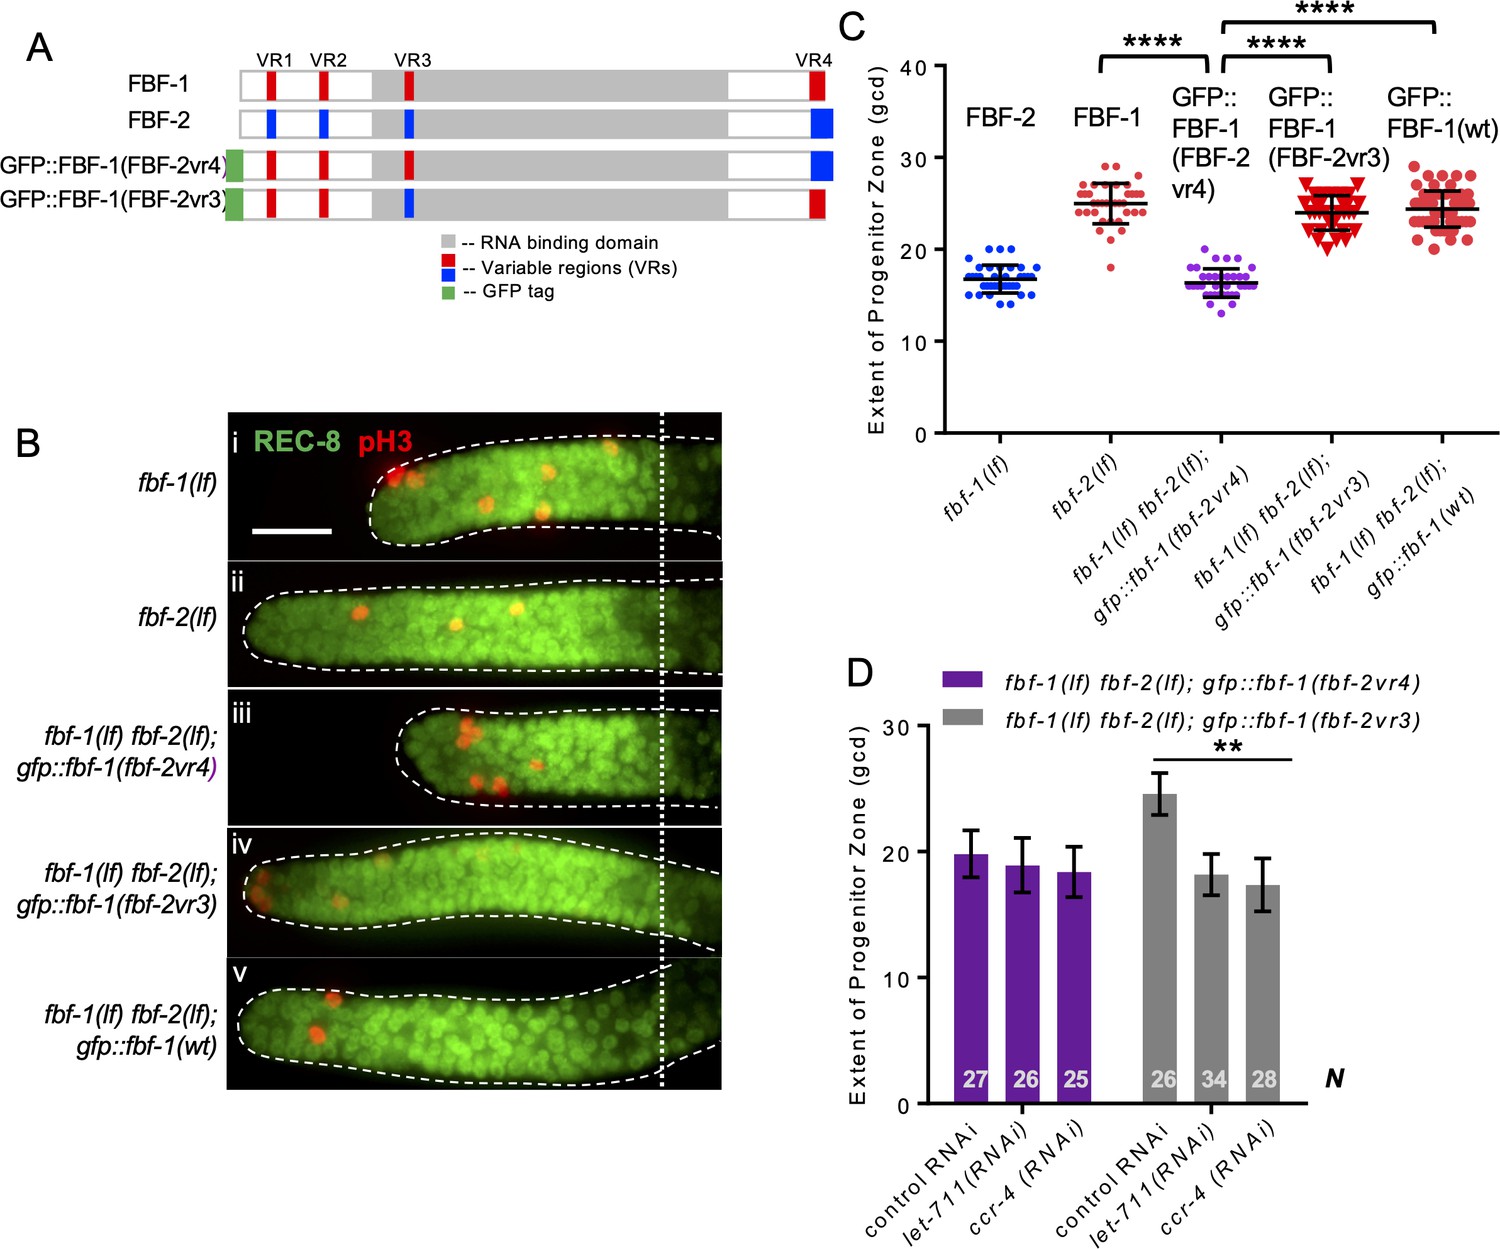
Variable region 4 (VR4) from FBF-2 is sufficient to prevent FBF-1 chimera from cooperation with CCR4-NOT.
(A) Schematics of FBF-1, FBF-2, transgenic GFP::FBF-1(FBF-2vr4) chimera (with VR4 swapped from FBF-2), and transgenic GFP::FBF-1(FBF-2vr3) chimera (with VR3 swapped from FBF-2). Red and blue boxes, variable regions distinguishing FBF-1 and FBF-2 respectively; grey box, RNA-binding domain; green box, GFP tag. (B) Distal germlines dissected from the indicated genetic backgrounds stained with anti-REC-8 (green) and anti-pH3 (red). Germlines are outlined with the dashed lines and the vertical dotted line marks the beginning of the transition zone. Scale bar: 10 μm. (C) The extent of SPC zone in the indicated genetic backgrounds (on the X-axis). FBF protein present in each genetic background is noted above each data set. Plotted values are individual data points and means ± SD. Differences in SPC zone length between fbf-1(lf) fbf-2(lf); gfp::fbf-1(fbf-2vr4) and the other strains were evaluated by one-way ANOVA test with Dunnett’s post-test; asterisks mark statistically significant differences (p<0.0001). Data were collected from three independent experiments and 31–60 germlines were scored for each genotype. (D) SPC zone length after knocking down CCR4-NOT subunits in the fbf-1(lf) fbf-2(lf); gfp::fbf-1(fbf-2vr4) and fbf-1(lf) fbf-2(lf); gfp::fbf-1(fbf-2vr3) genetic backgrounds (as indicated on the X-axis). Plotted values are means ± SD. Asterisks mark the group with significant changes in SPC zone length after CCR4-NOT knockdown vs control RNAi by one-way ANOVA (p<0.01). Data were collected from two independent experiments. N, the number of hermaphrodite germlines scored. (B–D) All experiments were performed at 24°C.
Figure 7—figure supplement 1
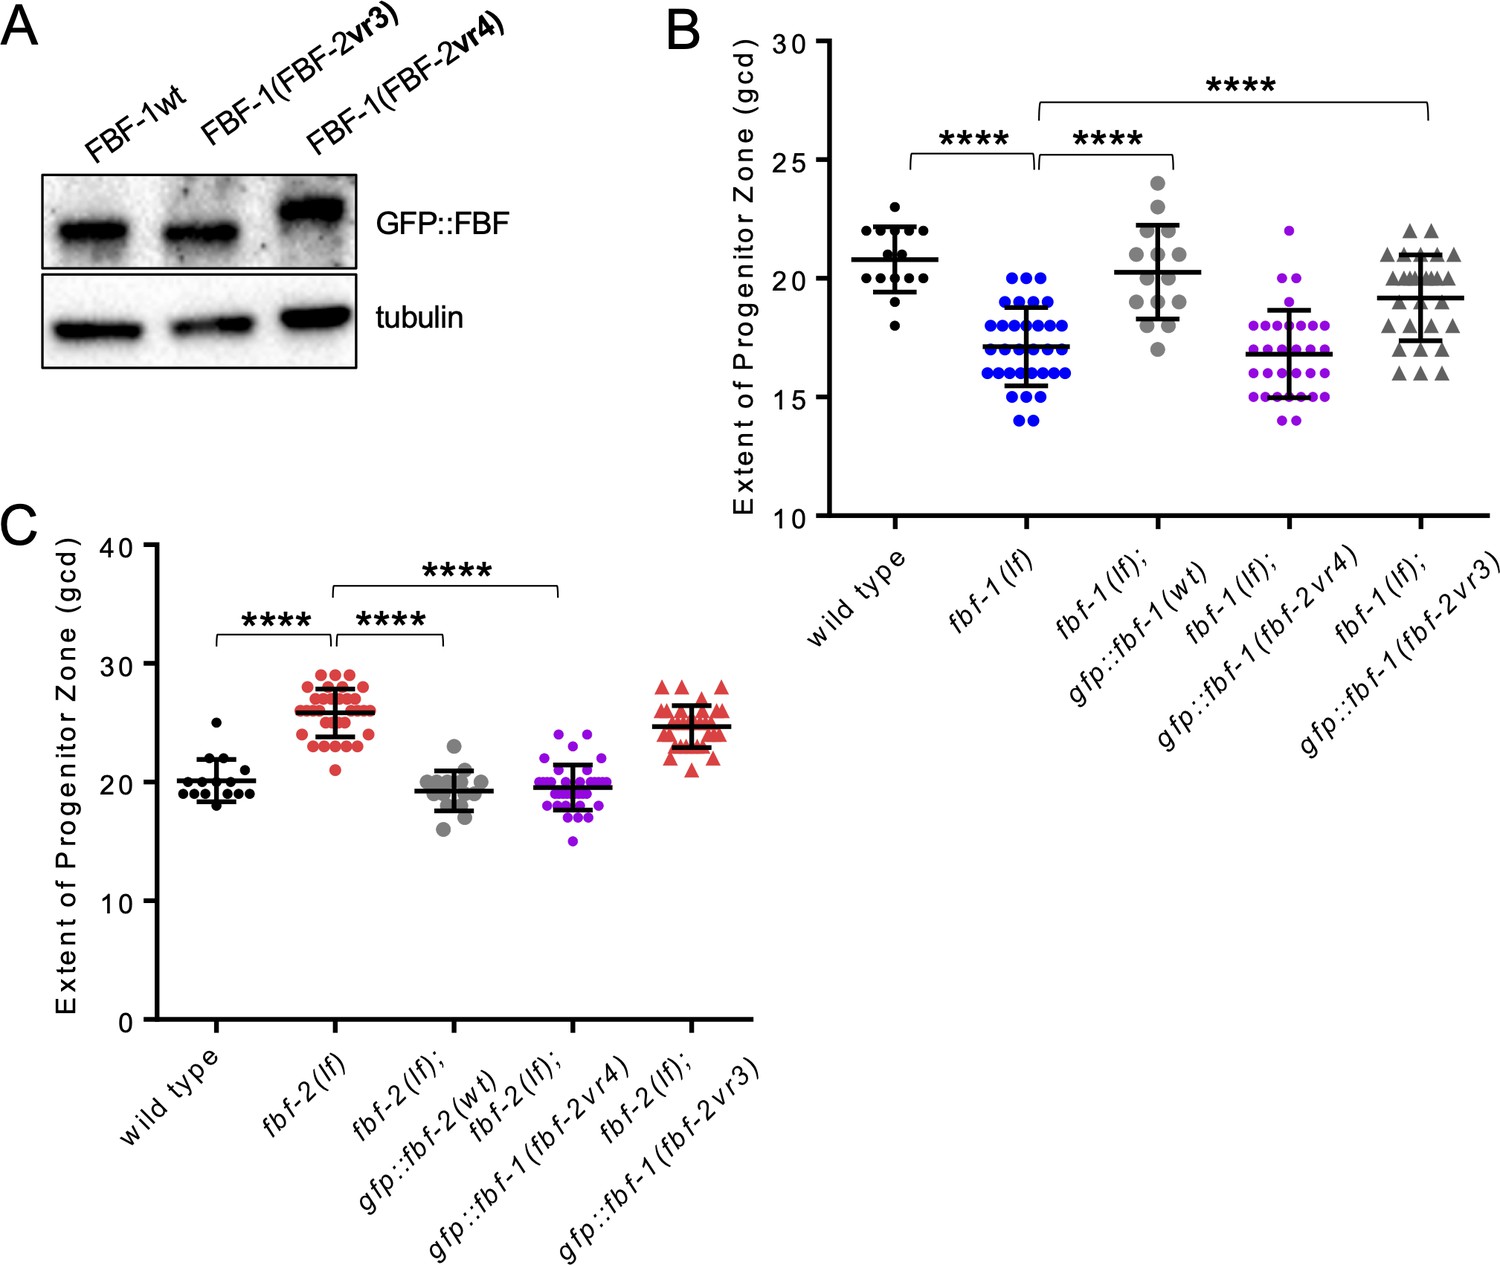
Variable region 4 of FBF-2 allows chimeric FBF-1vr4 to rescue fbf-2(lf).
(A) Expression levels of GFP::FBF-1(wt), GFP::FBF-1(FBF-2vr3), and GFP::FBF-1(FBF-2vr4) transgenes assessed by a western blot. Tubulin is used as a control. (B) SPC zone length was measured after crossing GFP::FBF-1(FBF-2vr4), GFP::FBF-1(FBF-2vr3) and GFP::FBF-1(wt) transgenes into fbf-1(lf) genetic background. As controls, the extent of SPC zone was also measured in fbf-1(lf) and the wild type. (C) SPC zone length was measured after crossing GFP::FBF-1(FBF-2vr4), GFP::FBF-1(FBF-2vr3) and GFP::FBF-2(wt) transgenes into fbf-2(lf) genetic background. As controls, SPC zone length was also measured in fbf-2(lf) and the wild type. (B, C) Plotted values are individual data points and means ± SD. Differences in the extent of SPC zone between fbf-1(lf) or fbf-2(lf) and all other strains in a given group were evaluated by one-way ANOVA test with Dunnett’s post-test; asterisk marks statistically significant differences (p<0.0001). Data were collected from two independent experiments with 7–20 germlines scored for each genotype per replicate. (A–C) All experiments were performed at 24°C.
Figure 8

A model of antagonistic effects of FBF-1 and FBF-2 on germline SPC dynamics and target mRNAs.
(A) FBFs regulate the rate of stem and progenitor (green) cell division and the rate of entry into meiosis (grey). Both FBFs negatively regulate each other’s expression (Lamont et al., 2004, not pictured). In fbf-2(lf), FBF-1 is overexpressed, and both cell division and meiotic entry rates are slow. This results in an increased total number of SPCs in the adult (larger green circle). In fbf-1(lf), FBF-2 is overexpressed and meiotic entry rate is enhanced, reducing overall numbers of SPCs (smaller green circle). In the double fbf-1(lf) fbf-2(lf) mutant (not pictured), adult SPCs are lost to differentiation. (B) FBF-1 and FBF-2 bind the same target mRNAs, and each can promote SPC maintenance. FBF-1 cooperates with CCR4-NOT deadenylase and robustly represses target mRNAs (Crittenden et al., 2002; Brenner and Schedl, 2016) to restrict the rate of germline stem cell meiotic entry. FBF-2 protects mRNAs from deadenylation; FBF-2-dependent regulation is associated with leaky repression of protein synthesis and sustains the wild-type rates of SPC cell division and meiotic entry. Differential cooperation of FBFs with CCR4-NOT is determined by their variable regions outside of the RNA-binding domain.
Tables
Table 1
fbf-2(lf) enhances the overproliferation phenotype of glp-1(gf) at 15°C.
All animals were maintained at 15°C. For each genotype, after scoring sterility as the lack of embryos in the uterus, germlines of sterile animals were dissected and stained with DAPI, anti-REC-8 antibodies, and anti-phospho-histone H3 antibodies for evaluation of overproliferation. All animals were analyzed at 1 day after L4 stage. Tum, a complete tumorous germline. Pro, proximal overproliferation phenotype.
| Genotype | Normal germline, % | Tum, % | Pro, % | N |
|---|---|---|---|---|
| fbf-2(q738lf) | 100 | 0 | 0 | many |
| fbf-1(ok91lf) | 100 | 0 | 0 | many |
| glp-1(ar202gf) | 100 | 0 | 0 | 231 |
| fbf-2(lf); glp-1(gf) | 3 | 24 | 74 | 104 |
| fbf-1(lf); glp-1(gf) | 99 | 0 | 1 | 414 |
Table 2
Proximity ligation assay detects association of FBF-1 with CCR4-NOT complex component CCF-1.
PLA foci density was determined in maximal intensity projections of confocal image stacks encompassing germline SPC zones of the indicated strains. Reported values are mean ± SD derived from three independent biological replicates (3xflag::ccf-1; gfp::fbf-1 and 3xflag::ccf-1; gfp::fbf-2) or a single replicate (3xflag::ccf-1; gfp), all reared at 24°C. Differences in PLA density between 3xflag::ccf-1; gfp::fbf-1 or 3xflag::ccf-1; gfp::fbf-2 and the control 3xflag::ccf-1; gfp were analyzed by one-way ANOVA with Dunnett’s post-test. N, number of germline images analyzed.
| Genotype | PLA density in SPC zone (/um^2) x 10−2 | P value,vs. control | N |
|---|---|---|---|
| 3xflag::ccf-1; gfp::fbf-1 | 5.2 ± 2.4 | <0.0001 | 32 |
| 3xflag::ccf-1; gfp::fbf-2 | 1.1 ± 0.8 | ns | 27 |
| 3xflag::ccf-1; gfp | 0.6 ± 0.2 | n/a | 12 |
Table 3
Proximity ligation assay detects association of FBF-2(vrm) with CCR4-NOT complex component CCF-1.
PLA foci density was determined in maximal intensity projections of confocal image stacks of germline SPC zones of the indicated strains. Reported values are mean ± SD derived from three independent biological replicates reared at 24°C. PLA densities were compared by Student’s t-test. N, number of germline images analyzed.
| Genotype | PLA density in SPC zone (/um^2) x 10−1 | p value,vs. control | N |
|---|---|---|---|
| 3xflag::ccf-1; gfp::fbf-2vrm | 2.3 ± 0.7 | <0.0001 | 58 |
| 3xflag::ccf-1; gfp | 1.1 ± 0.5 | n/a | 48 |
Table 4
Variable regions outside of the RNA-binding domain regulate FBF function.
| Transgene | Mutated variable region (VR) sequence | Rescues fbf-1(lf)? | Rescues fbf-2(lf)? | Dependent on CCR4-NOT |
|---|---|---|---|---|
| GFP::FBF-2wt | N/A | No | Yes | No* |
| GFP::FBF-1wt | N/A | Yes | No | Yes* |
| GFP::FBF-2(vrm) | mutated VR1, 2; VR4 deleted | Yes | No | Yes† |
| GFP::FBF-1(FBF-2vr4) | VR4 swapped with FBF-2 | No | Yes | No† |
| GFP::FBF-1(FBF-2vr3) | VR3 swapped with FBF-2 | Yes | No | Yes† |
-
Rescue assays were performed by crossing transgenic GFP::FBFs into loss of function mutant of each fbf, followed by SPC zone length measurement (Figure 6, Figure 6—figure supplement 1, and Figure 7—figure supplement 1). Dependence on CCR4-NOT was defined as a decrease in the length of SPC zone after knocking down CCR4-NOT subunits.
* – analyzed in single fbf loss-of-function mutants, Figure 3B.
-
† – analyzed in the strains containing GFP::FBF transgenes in fbf-1 fbf-2 double-mutant background, Figures 6E and 7D.
Key resources table
| Reagent type (species) or resource | Designation | Source or reference | Identifiers | Additional information |
|---|---|---|---|---|
| Strain, strain background (C. elegans) | JK3022 | Crittenden et al., 2002 | fbf-1(ok91) II | |
| Strain, strain background (C. elegans) | JK3101 | Lamont et al., 2004 | fbf-2(q738) II | |
| Strain, strain background (C. elegans) | GC833 | Pepper et al., 2003a | glp-1(ar202) III | |
| Strain, strain background (C. elegans) | JH3269 | Putnam et al., 2019 | pgl-1::gfp(ax3122) IV | |
| Strain, strain background (C. elegans) | JH2766 | Merritt and Seydoux, 2010 | axIs1922[Ppie-1::GFP::H2B::htp-2 3’UTR] | |
| Strain, strain background (C. elegans) | UMT433 | This paper | mntSi33 [Pgld-1::3xFLAG::CYB-2.1::cyb-2.1 3'UTR] unc-119(ed3) III | |
| Strain, strain background (C. elegans) | UMT394 | This paper | mntSi29 [Pgld-1::3xFLAG::CYB-2.1::cyb-2.1 3'UTR (fbm)] unc-119(ed3) III | |
| Strain, strain background (C. elegans) | UMT360 | This paper | mntSi23 (Pgld-1::3xFLAG::CCF-1::ccf-1 3’UTR) II; unc-119(ed3) III | |
| Strain, strain background (C. elegans) | UMT338 | This paper | mntSi21 [Pgld-1::patcGFP::fbf-1 3'UTR] unc-119(ed3) III | |
| Strain, strain background (C. elegans) | UMT389 | This paper | mntSi28 [Pgld-1::patcGFP::fbf-1::fbf-1 3'UTR] unc-119(ed3) III | |
| Strain, strain background (C. elegans) | UMT378 | This paper | mntSi27 [Pgld-1::patcGFP::fbf-2::fbf-2 3'UTR] unc-119(ed3) III | |
| Strain, strain background (C. elegans) | UMT441 | This paper | mntSi32 [Pgld-1::patcGFP::FBF-2vrm::fbf-2 3'UTR] unc-119(ed3) III | |
| Strain, strain background (C. elegans) | UMT373 | This paper | mntSi26 [Pgld-1::patcGFP::fbf-1(fbf-2vr3)::fbf-1 3'UTR] unc-119(ed3) III | |
| Strain, strain background (C. elegans) | UMT411 | This paper | mntSi31 [Pgld-1::patcGFP::fbf-1(fbf-2vr4)::fbf-1 3'UTR] unc-119(ed3) III | |
| Antibody | Mouse monoclonal anti-FLAG M2 | Sigma-Aldrich Cat# F1804 | RRID:AB_262044 | (1:1,000) |
| Antibody | Rabbit monoclonal anti-GFP | Thermo-Fisher Cat# G10362 | RRID:AB_2536526 | (1:200) |
| Antibody | Mouse monoclonal anti-phospho-Histone H3 pSer10 6G3 | Cell Signaling Technology Cat# 9706 | RRID:AB_331748 | (1:400) |
| Antibody | Rabbit polyclonal anti-REC-8 | Novus Biologicals Cat# 29470002 | RRID:AB_2178279 | (1:500) |
| Antibody | Mouse monoclonal anti-PGL-1 K76 | DSHB Cat# K76 | RRID:AB_531836 | (5.2 μg/ml) |
| Antibody | Rabbit polyclonal anti-FBF-1 | Voronina et al., 2012; PA2388 | (3.5 μg/ml) | |
| Antibody | Mouse monoclonal anti-Tubulin DM1A | Sigma-Aldrich Cat# T6199 | RRID:AB_477583 | (1:300) |
| Antibody | Goat anti-mouse IgG (H+L) 594 | Jackson ImmunoResearch Cat# 115-585-146 | RRID:AB_2338881 | (1:500) |
| Antibody | Goat anti-rabbit IgG (H+L) 594 | Jackson ImmunoResearch Cat# 111-585-144 | RRID:AB_2307325 | (1:500) |
| Antibody | Goat anti-rabbit IgG (H+L) 488 | Jackson ImmunoResearch Cat# 111-545-144 | RRID:AB_2338052 | (1:500) |
| Antibody | Goat anti-mouse IgM 594 | Jackson ImmunoResearch Cat# 115-585-020 | RRID:AB_2338874 | (1:500) |
| Antibody | Goat anti-mouse HRP | Jackson ImmunoResearch Cat# 115-035-003 | RRID:AB_10015289 | (1:5,000) |
| Antibody | Goat anti-rabbit HRP | Jackson ImmunoResearch Cat# 111-035-003 | RRID:AB_2313567 | (1:5,000) |
| Recombinant DNA reagent | Plasmid: control RNAi | Timmons and Fire, 1998 | pL4440 | |
| Recombinant DNA reagent | Plasmid: let-711 RNAi | Source BioScience Ahringer RNAi Collection | ||
| Recombinant DNA reagent | Plasmid: ccr-4 RNAi | Source BioScience Ahringer RNAi Collection | ||
| Recombinant DNA reagent | Plasmid: ccf-1 RNAi | Sönnichsen et al., 2005 | ||
| Recombinant DNA reagent | Plasmid: cyb-2.1 RNAi | This paper | cyb-2.1 genomic CDS in pL4440 | |
| Sequence-based reagent | act-1.qF | Merritt and Seydoux, 2010 | qPCR primers | GGCCCAATCCAAGAGAGGTATC |
| Sequence-based reagent | act-1.qR | Merritt and Seydoux, 2010 | qPCR primers | CAACACGAAGCTCATTGTAGAAGG |
| Sequence-based reagent | unc-54.qF | This paper | qPCR primers | agagagcaggttttggaggat |
| Sequence-based reagent | unc-54.qR | This paper | qPCR primers | ttgagggtgacctcatttcc |
| Sequence-based reagent | him-3.qF | Merritt and Seydoux, 2010 | qPCR primers | AGAGATTTTCGTATCTCTAAATAACGGAATC |
| Sequence-based reagent | him-3.qR | Merritt and Seydoux, 2010 | qPCR primers | GGGTGTATAGTCTTTTGGAGCTTTTTC |
| Sequence-based reagent | htp-1.qF | Merritt and Seydoux, 2010 | qPCR primers | ATTCGGAGGACAGTGACACAA |
| Sequence-based reagent | htp-1.qR | Merritt and Seydoux, 2010 | qPCR primers | GTGCTTTCTCGAGAGACTCAGTTATATC |
| Sequence-based reagent | htp-2.qF | Merritt and Seydoux, 2010 | qPCR primers | ATCGTTCAATTCGGAGGACAC |
| Sequence-based reagent | htp-2.qR | Merritt and Seydoux, 2010 | qPCR primers | GTGTTTTCTCGAGAGAATCGGTTATATT |
| Sequence-based reagent | cyb-1.qF | This paper | qPCR primers | CCAACAACAGACGAACATCG |
| Sequence-based reagent | cyb-1.qR | This paper | qPCR primers | CTGGATTGGATGGCTTGAGT |
| Sequence-based reagent | cyb-2.1.qF | This paper | qPCR primers | AAACCACGAAAAATGCCGT |
| Sequence-based reagent | cyb-2.1.qR | This paper | qPCR primers | TGAAGCTGTCGTCAAGAACA |
| Sequence-based reagent | cyb-2.2.qF | This paper | qPCR primers | CAAGAATCAACATGAAAACGGAT |
| Sequence-based reagent | cyb-2.2.qR | This paper | qPCR primers | TCAGCCATGCAATTGAACTC |
| Sequence-based reagent | cyb-3.qF | This paper | qPCR primers | ACACCATTCAGAAGCTTGCAT |
| Sequence-based reagent | cyb-3.qR | This paper | qPCR primers | AGCGATCTCCGGAAAGGTAG |
| Sequence-based reagent | cyb-2.1.PAT | This paper | PCR primers | tacgttcctgtgttctgctt |
| Sequence-based reagent | htp-1.PAT | This paper | PCR primers | tggcatgttctatatcatcgtgt |
Additional files
-
Supplementary file 1
Nematode strains used in this study.
- https://cdn.elifesciences.org/articles/52788/elife-52788-supp1-v2.docx
-
Supplementary file 2
Antibodies used in the study.
- https://cdn.elifesciences.org/articles/52788/elife-52788-supp2-v2.docx
-
Supplementary file 3
Embryo lethality resulting from CCR4-NOT knockdown in the parent generation.
Percent embryos failing to hatch was determined 24 hr after eggs were deposited on a plate. The data were obtained in two independent experiments.
- https://cdn.elifesciences.org/articles/52788/elife-52788-supp3-v2.docx
-
Transparent reporting form
- https://cdn.elifesciences.org/articles/52788/elife-52788-transrepform-v2.pdf
Download links
A two-part list of links to download the article, or parts of the article, in various formats.
Downloads (link to download the article as PDF)
Open citations (links to open the citations from this article in various online reference manager services)
Cite this article (links to download the citations from this article in formats compatible with various reference manager tools)
Antagonistic control of Caenorhabditis elegans germline stem cell proliferation and differentiation by PUF proteins FBF-1 and FBF-2
eLife 9:e52788.
https://doi.org/10.7554/eLife.52788


