Intelligent classification of platelet aggregates by agonist type
- Department of Chemistry, University of Tokyo, Japan
- Department of Clinical Laboratory Medicine, Graduate School of Medicine, University of Tokyo, Japan
- Institute of Technological Sciences, Wuhan University, China
- Department of Photonics, National Chiao Tung University, Taiwan
- Department of Bioengineering, University of California, United States
Figures
Figure 1 with 5 supplements
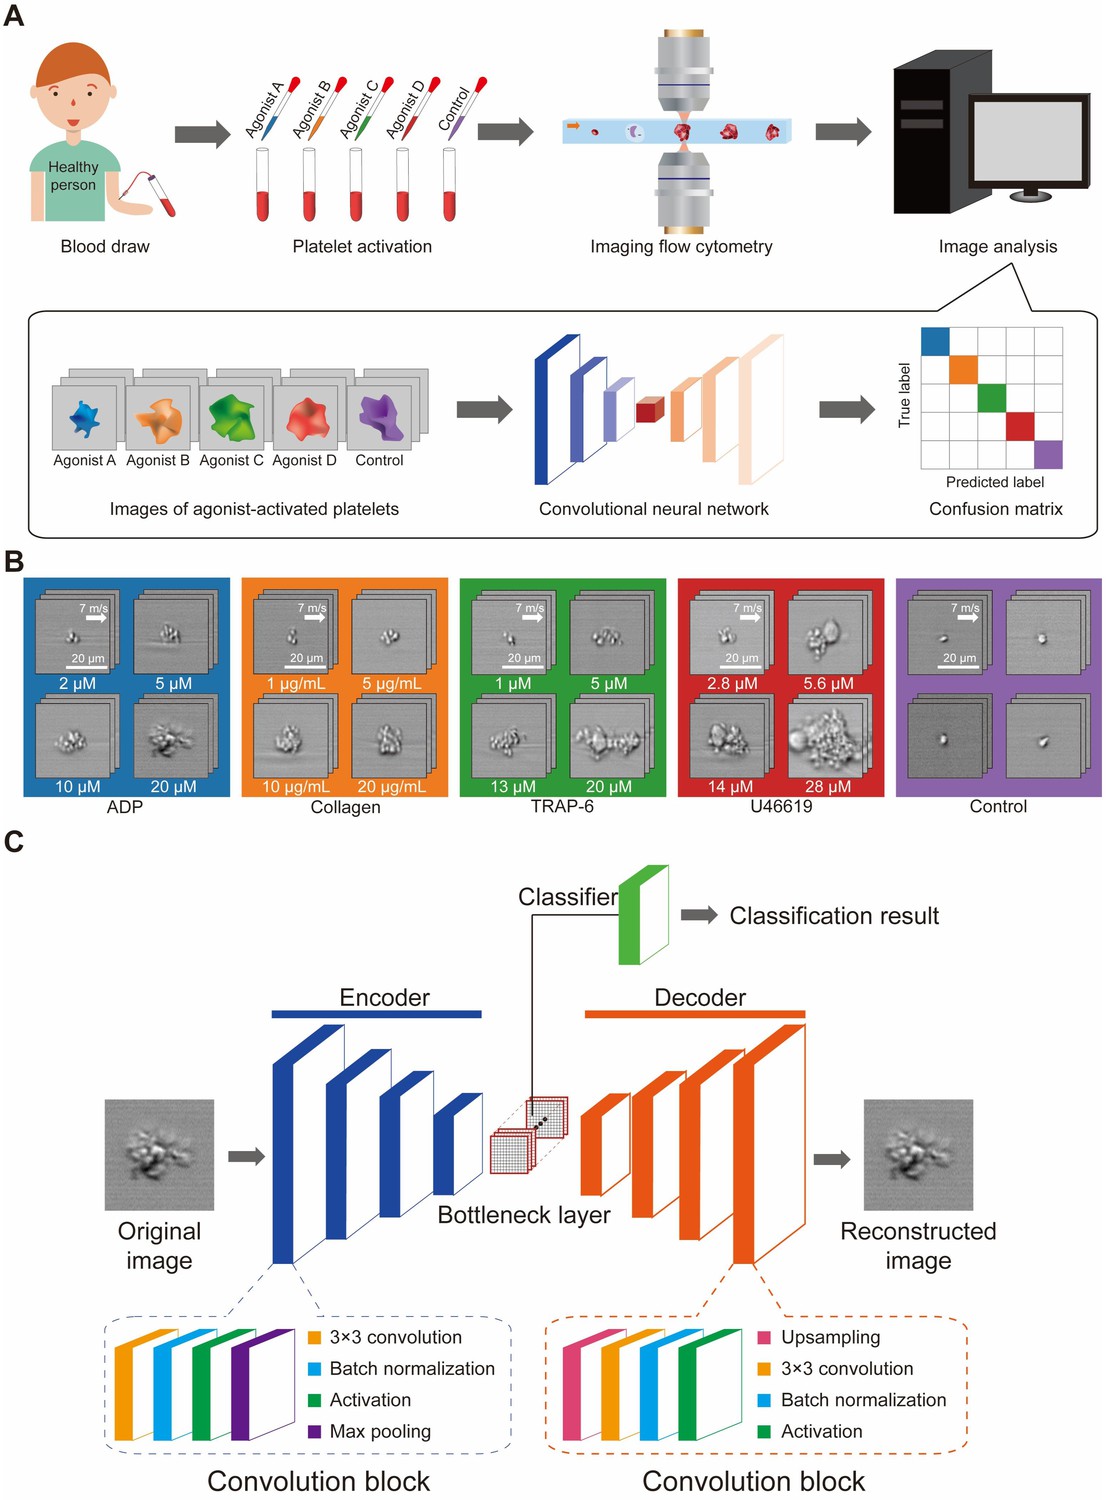
Development of the iPAC.
(A) Procedure for developing the iPAC. (B) Images of the agonist-activated platelet aggregates and single platelets (negative control). (C) Structure of the CNN with an encoder-decoder architecture used for the development of the iPAC.
Figure 1—figure supplement 1
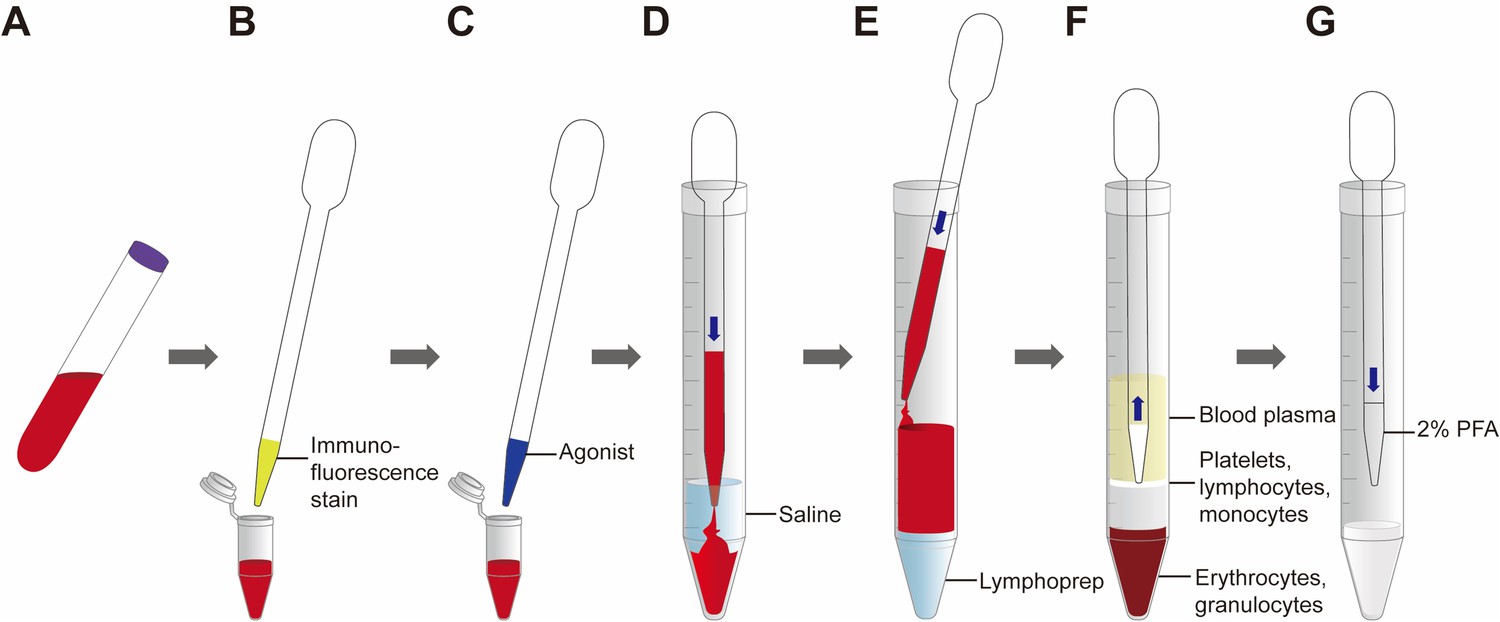
Detailed Procedure for Sample Preparation.
(A) Blood is drawn into a blood collection tube containing citric acid (B) Platelets are labeled by immunofluorescence. (C) An agonist is added to the tube. (D) The agonist-activated blood sample is diluted with saline. (E) The sample is loaded on top of the Lymphoprep followed by centrifugation. (F) Enriched platelet aggregates are collected from the mononuclear layer. (G) Enriched platelet aggregates are fixed by 2% paraformaldehyde.
Figure 1—figure supplement 2
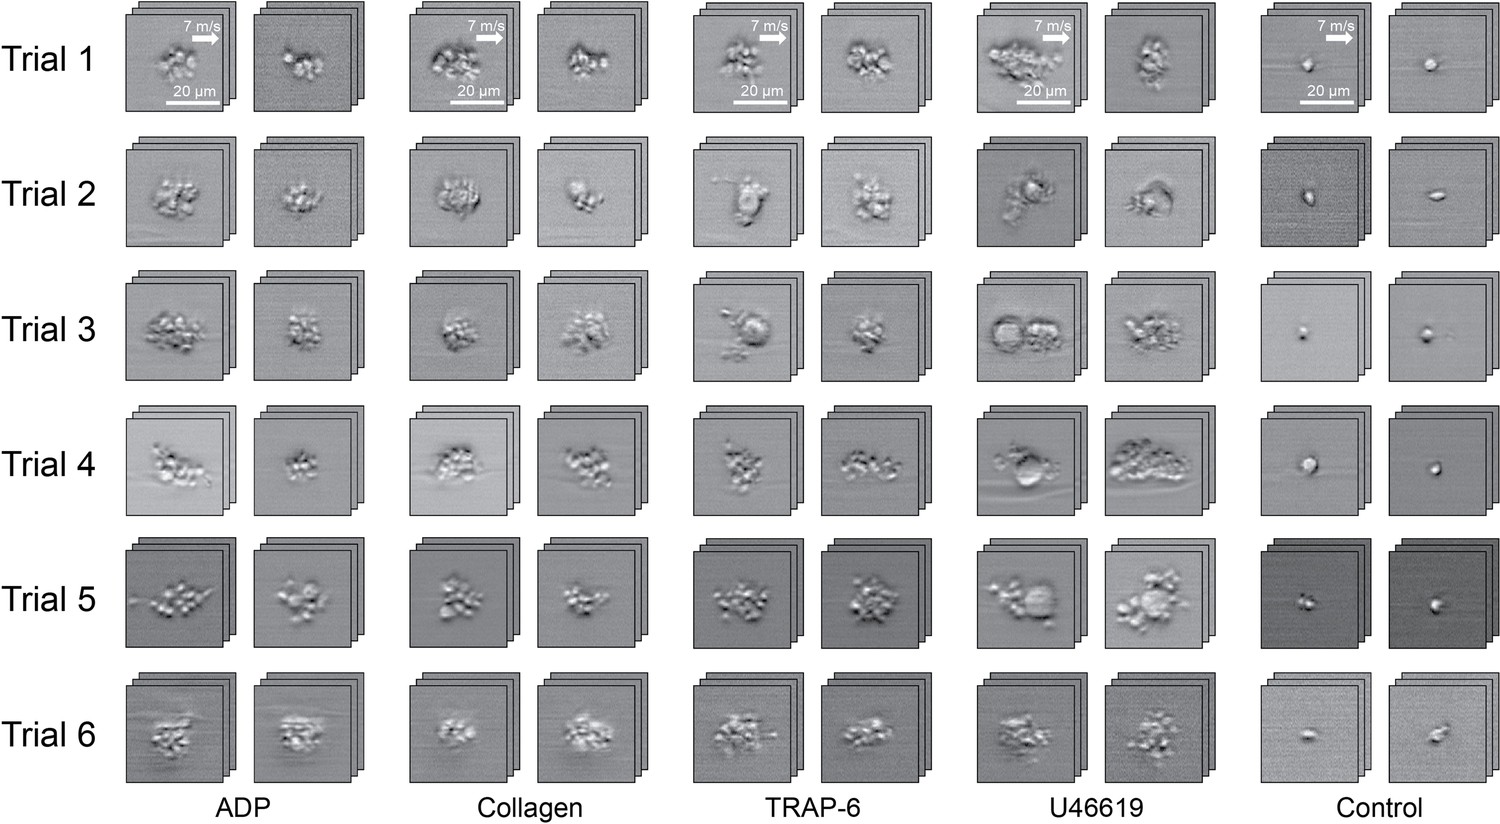
Extend Image Library from Six Experimental Trials.
Figure 1—figure supplement 3
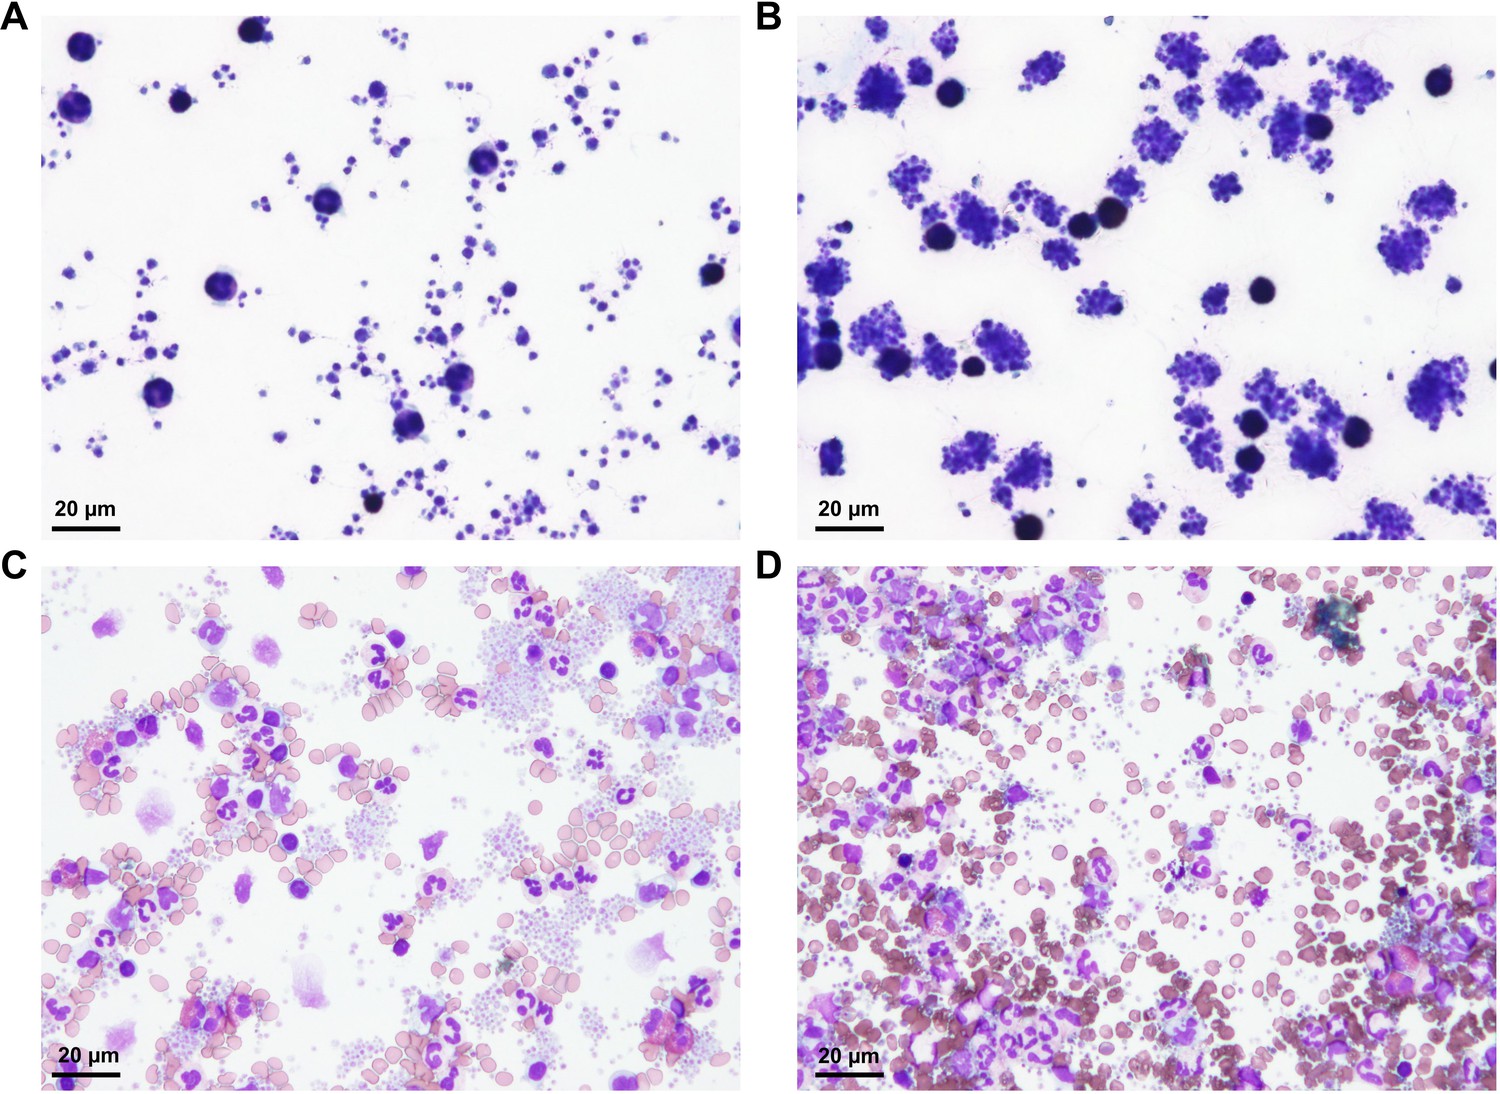
Comparison of Different Procedures for Sample Preparation.
(A) Microscopic image of platelets prepared by pipetting. Only a small number of platelet aggregates can be identified, while most of the cells in the image are leukocytes and single platelets. (B) Microscopic image of platelets prepared by vortexing. Platelet-platelet aggregates and platelet-leukocyte aggregates can be identified in the image, while only a small population of the platelets remained as single platelets. (C) Microscopic image of platelets without fixation at 0 hr. Platelet-platelet aggregates, platelet-leukocyte aggregates, and single platelets can be identified in the image. (D) Microscopic image of platelets without fixation at 3 hr. Most of the platelet aggregates dissociated into single platelets and leukocytes.
Figure 1—figure supplement 4
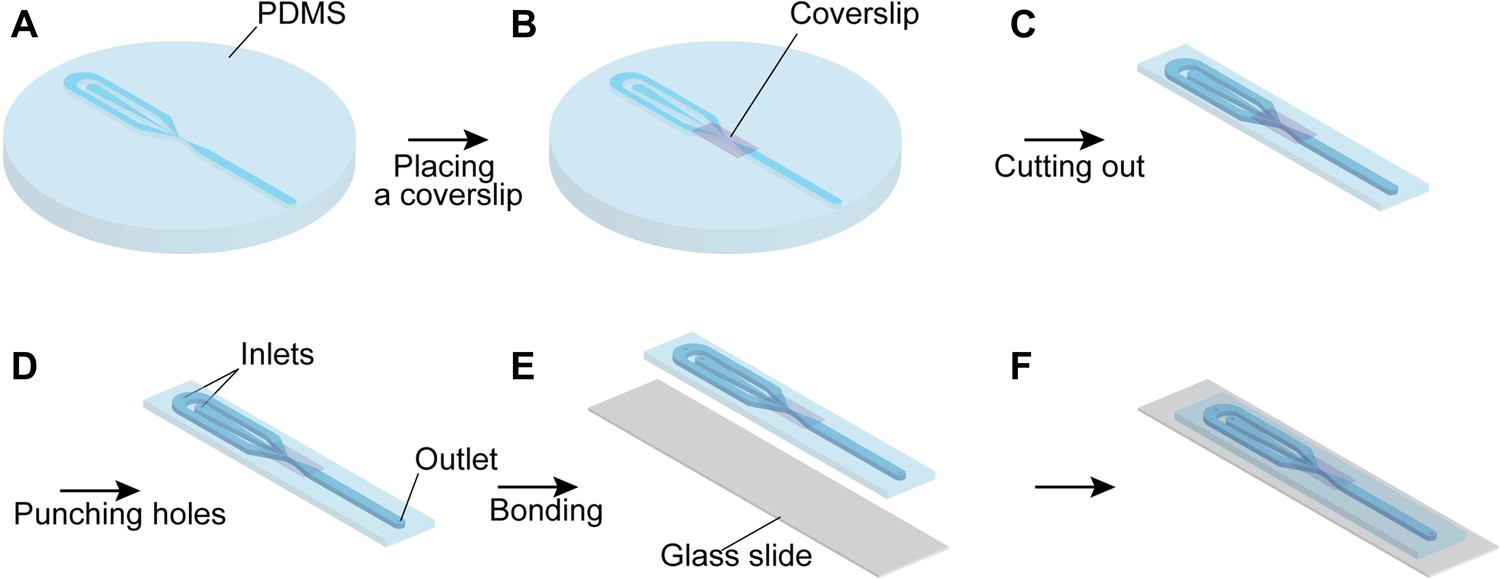
Fabrication of the Microfluidic Chip.
(A) PDMS is filled on the mold of the microfluidic channel. (B) The small piece of the coverslip is placed above the observation area on the PDMS. (C) The PDMS is cut out into a proper size. (D) The inlets and outlet holes are opened. (E) The PDMS and glass slide are bonded using a plasma cleaner. (F) The microfluidic chip is completed and ready for use.
Figure 1—figure supplement 5
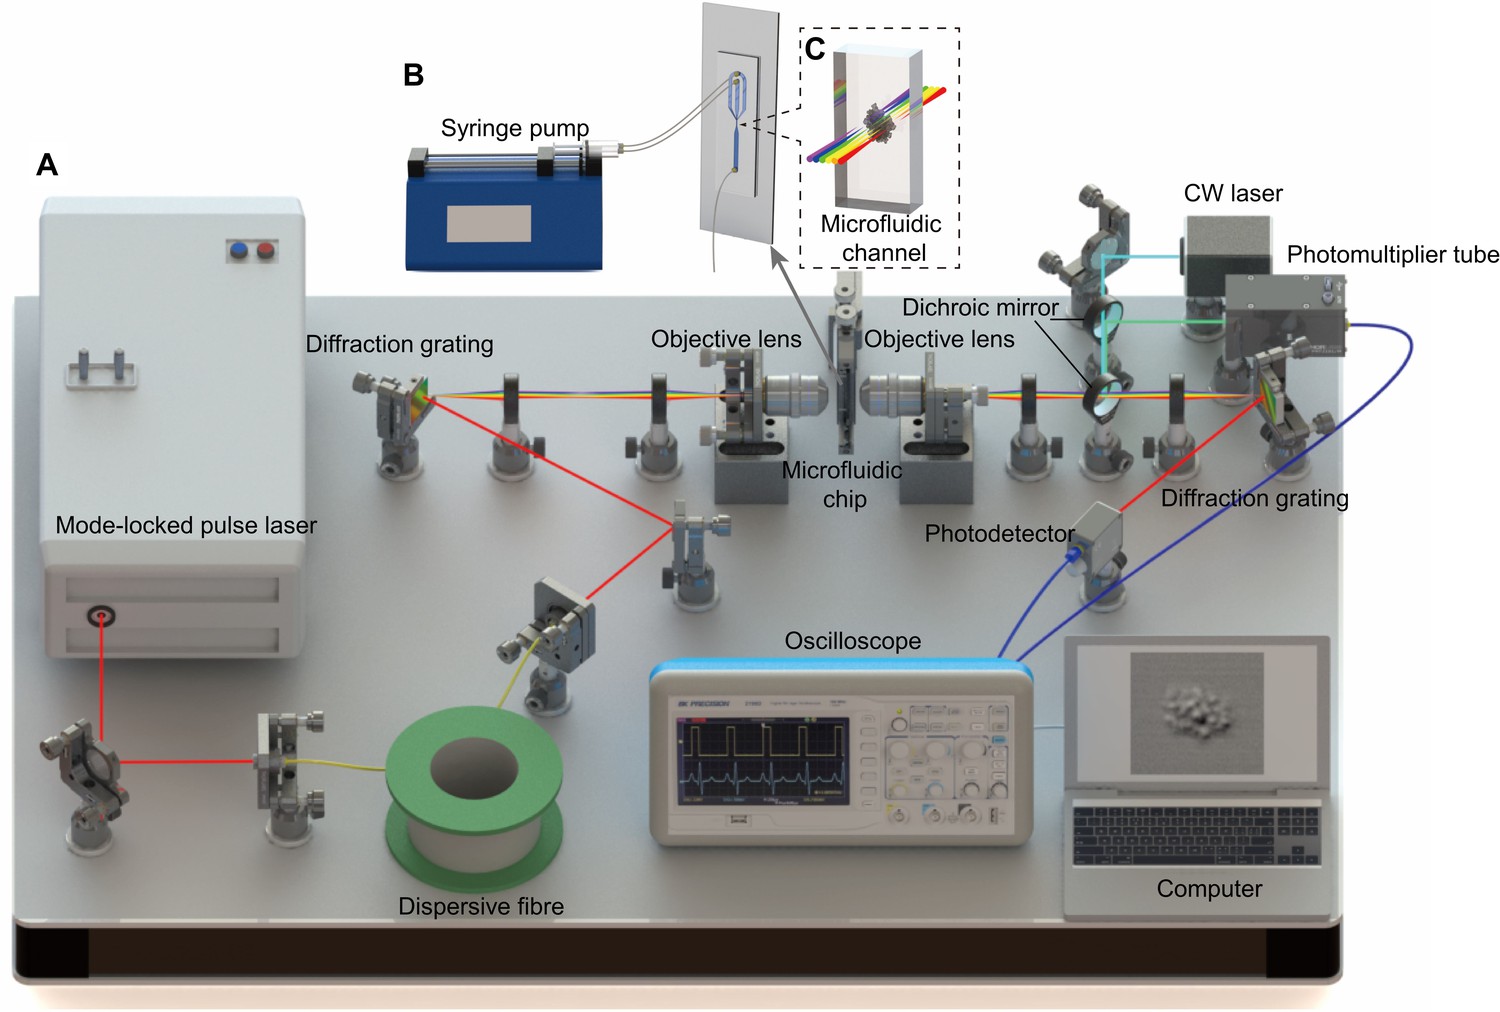
Schematic of the Optofluidic Time-stretch Microscope.
(A) Overall schematic. (B) Enlarged schematic of the microfluidic chip. (C) Further enlarged schematic of the microfluidic channel.
Figure 2
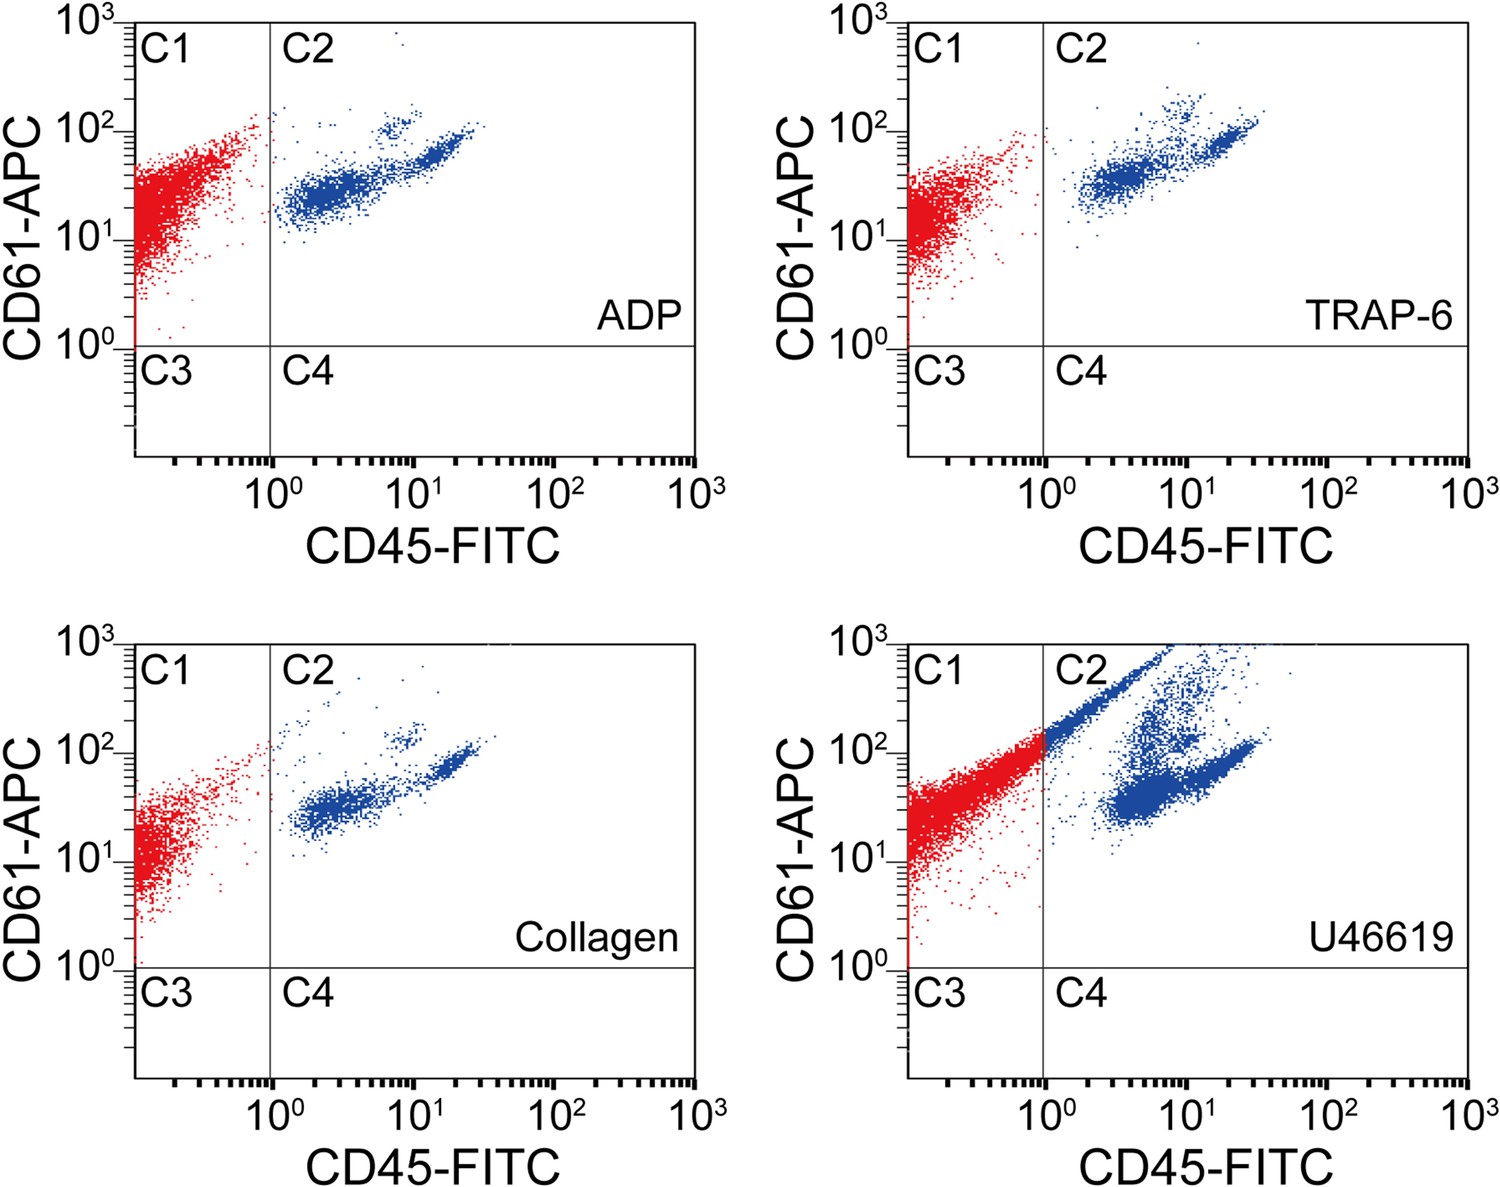
Scatter plots of agonist-activated platelets analyzed by a conventional flow cytometer.
The points in region C1 are colored in red, while the points in region C2 are colored in blue for distinguishing them visually. C1: single platelets and platelet-platelet aggregates. C2: leucocytes and platelet-leucocyte aggregates. C3: blood cells other than platelets and leucocytes. C4: leucocytes.
-
Figure 2—source data 1
Statistical analysis of agonist-activated platelets by conventional flow cytometry.
The population and ratio of dots in each area are shown in the source data table for all the four agonist types. The C1 areas indicate single platelets and platelet-platelet aggregates. The C2 areas indicate platelet-leucocyte aggregates. The C3 areas indicate blood cells other than platelets and leucocytes. The C4 areas indicate leucocytes.
- https://cdn.elifesciences.org/articles/52938/elife-52938-fig2-data1-v1.xlsx
Figure 3
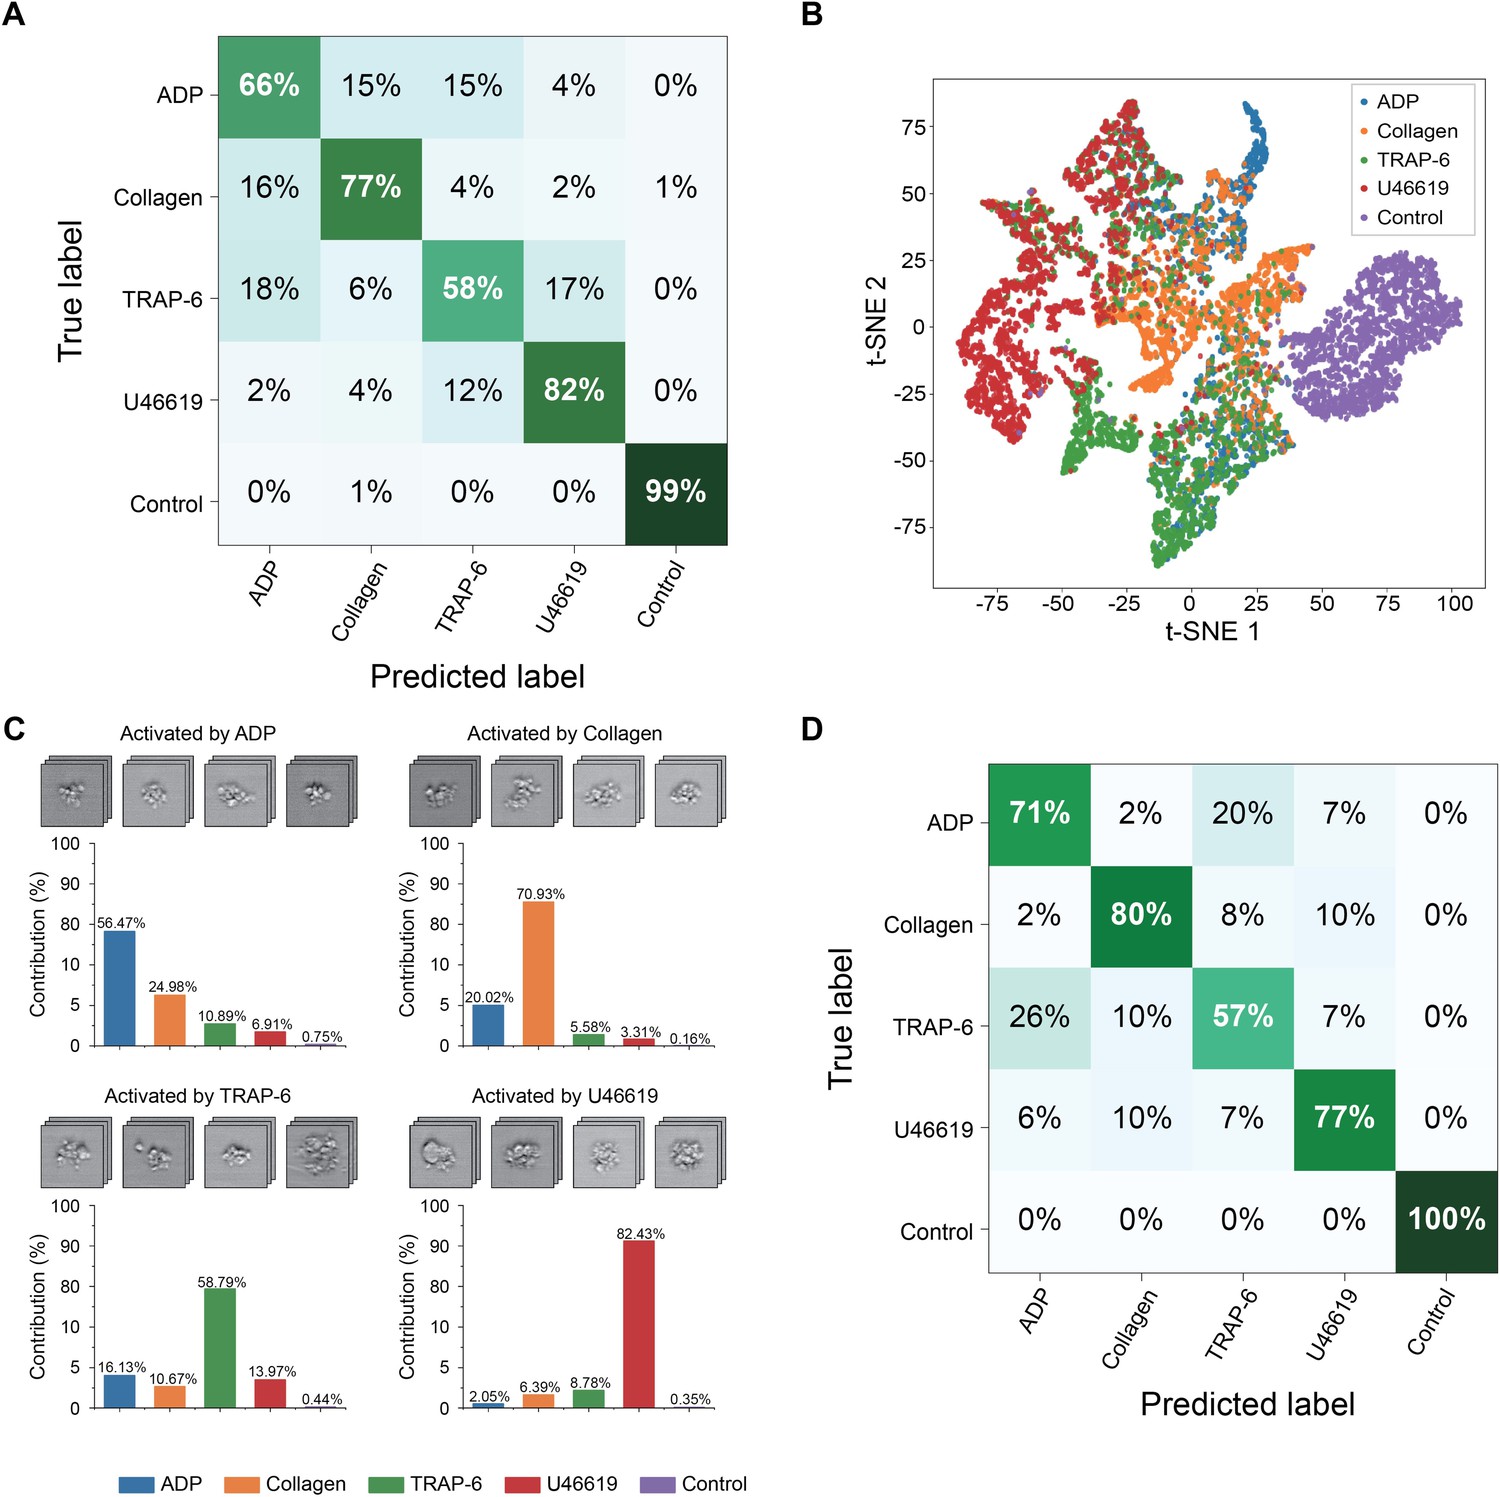
Demonstration of the iPAC.
(A) Confusion matrix as a manifestation of the iPAC. (B) t-SNE plot of the agonist-activated platelet aggregates and single platelets (negative control). (C) Validation of the reproducibility of the iPAC. (D) Confusion matrix of the CNN model trained with the images of platelet aggregates activated by different concentrations of agonists.
-
Figure 3—source data 1
Source data of Figure 3B.
The coordinates of each point in the t-SNE plot are shown in the file. Label 0: ADP. Label 1: Collagen. Label 2: TRAP-6. Label 3 U46619. Label 4: Control.
- https://cdn.elifesciences.org/articles/52938/elife-52938-fig3-data1-v1.xlsx
Figure 4

iPAC-based diagnosis of platelets from four healthy human subjects.
The experiment was repeated under the same conditions three times per subject.
Tables
Key resources table
| Reagent type (species) or resource | Designation | Source or reference | Identifiers | Additional information |
|---|---|---|---|---|
| Antibody | PE anti-human CD61 (mouse monoclonal) | BioLegend | Cat#336405; RRID:AB_1227583 | Platelet samples (5 μL per sample) |
| Antibody | Conjugated Antibody CD45-FITC | Beckman Coulter | Cat#A07782; RRID:AB_10645157 | FACS (5 μL per test) |
| Antibody | APC Mouse Anti-Human CD61 (mouse monoclonal) | BD Pharmingen | Cat#564174; RRID:AB_2738645 | FACS (5 μL per test) |
| Chemical compound, drug | Collagen | HYPHEN BioMed | Cat#AG005K-CS | Platelet activation |
| Chemical compound, drug | Revohem ADP | Sysmex | Cat#AP-200–422 | Platelet activation |
| Chemical compound, drug | TRAP-6 amide trifluoroacetate salt | BACHEM | Cat#H-2936.0005 | Platelet activation |
| Chemical compound, drug | U46619 | Cayman Chemical | Cat#16450 | Platelet activation |
| Chemical compound, drug | 4% Paraformaldehyde Phosphate Buffer Solution | WAKO | Cat#30525-89-4 | Fixation (2% Paraformaldehyde) |
| Chemical compound, drug | Lymphoprep | STEMCELLS | Cat#ST07851 | Density-gradient medium |
| Chemical compound, drug | KMPR 1035 | MicroChem | Cat#Y211066 | Negative photoresist |
| Chemical compound, drug | SU-8 Developer | MicroChem | Cat#Y020100 | Developer |
| Chemical compound, drug | SYLGARD 184 Silicone Elastomer | Dow Corning | Cat#1064291 | Microfluidic device |
| Software, algorithm | Matlab | MathWorks | https://mathworks.com/products/matlab.html | Image recovery |
| Software, algorithm | Keras | others | https://github.com/keras-team/keras | Python library; Image analysis |
| Software, algorithm | Tensorflow | arXiv:1603.04467 | https://arxiv.org/abs/1603.04467 | Python library; Image analysis |
| Software, algorithm | AutoCAD | Autodesk | https://www.autodesk.com/products/autocad/overview | Microfluidic channel design |
Additional files
Download links
A two-part list of links to download the article, or parts of the article, in various formats.
Downloads (link to download the article as PDF)
Open citations (links to open the citations from this article in various online reference manager services)
Cite this article (links to download the citations from this article in formats compatible with various reference manager tools)
Intelligent classification of platelet aggregates by agonist type
eLife 9:e52938.
https://doi.org/10.7554/eLife.52938


