Push-pull competition between bottom-up and top-down auditory attention to natural soundscapes
- Laboratory for Computational Audio Perception, Department of Electrical Engineering, Johns Hopkins University, United States
Figures
Figure 1
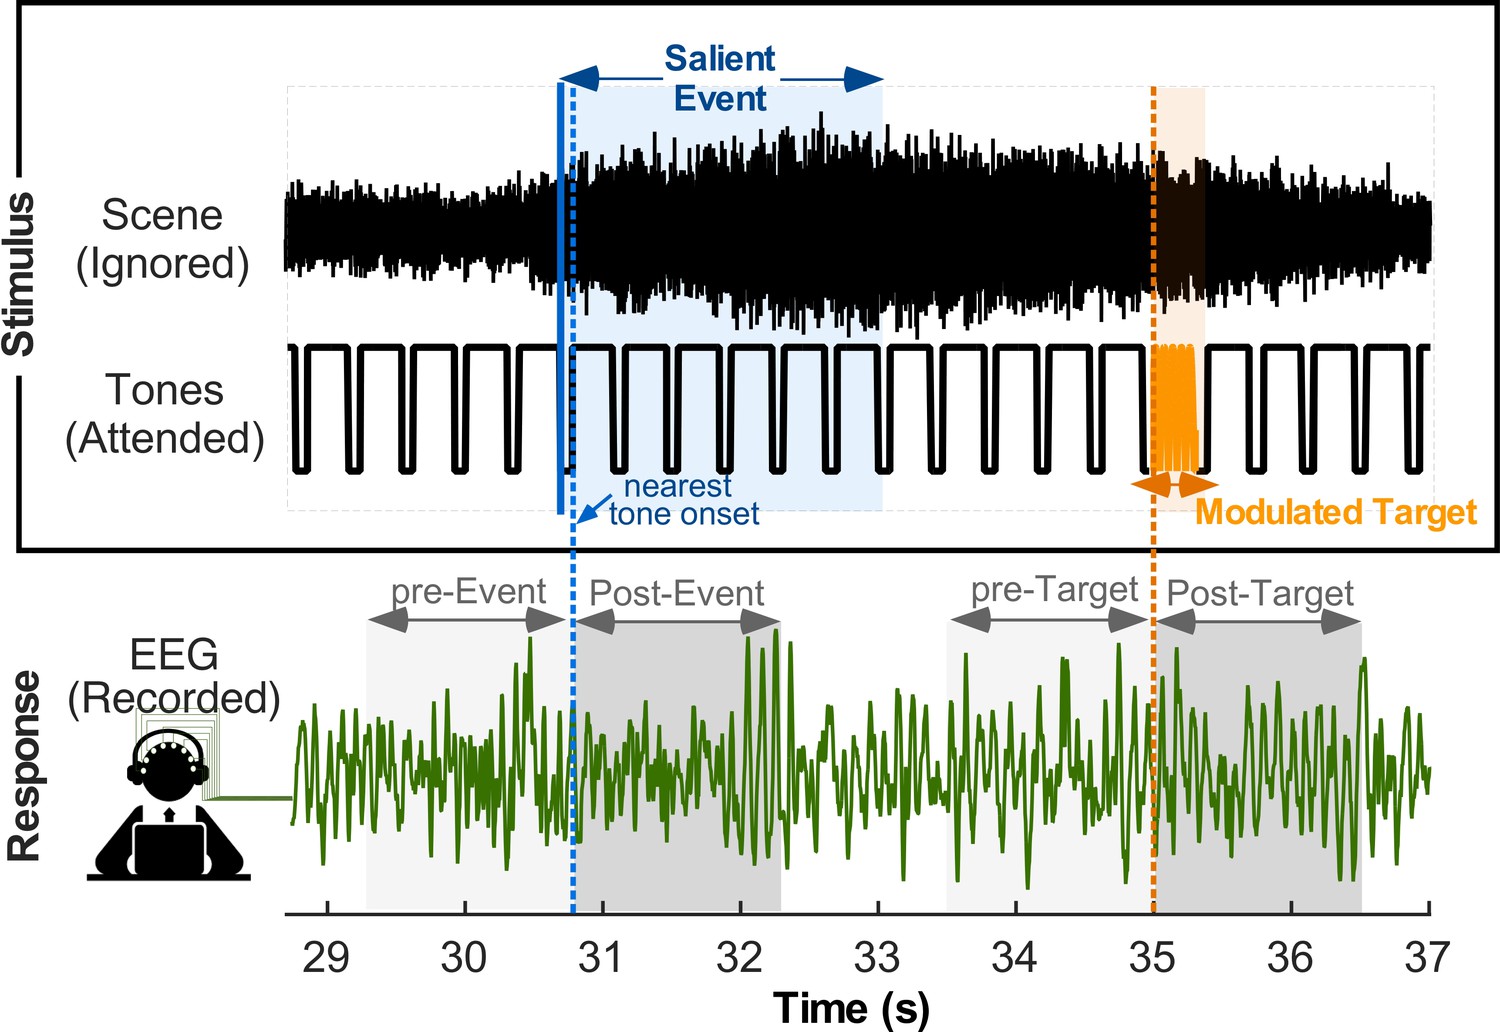
Stimulus paradigm during EEG recording.
Listeners are presented with two concurrent sounds in each each trial: (top stimulus) A recording of a natural audio clip, which subjects are asked to ignore; and (bottom stimulus) a rhythmic tone sequence, which subjects pay attention to and detect presence of occasional modulated tones (shown in orange). A segment of one trial neural recording is shown in the bottom. Analyses focus on changes in neural responses due to presence of salient events in the ambient scene or target tones in the attended scene.
Figure 2
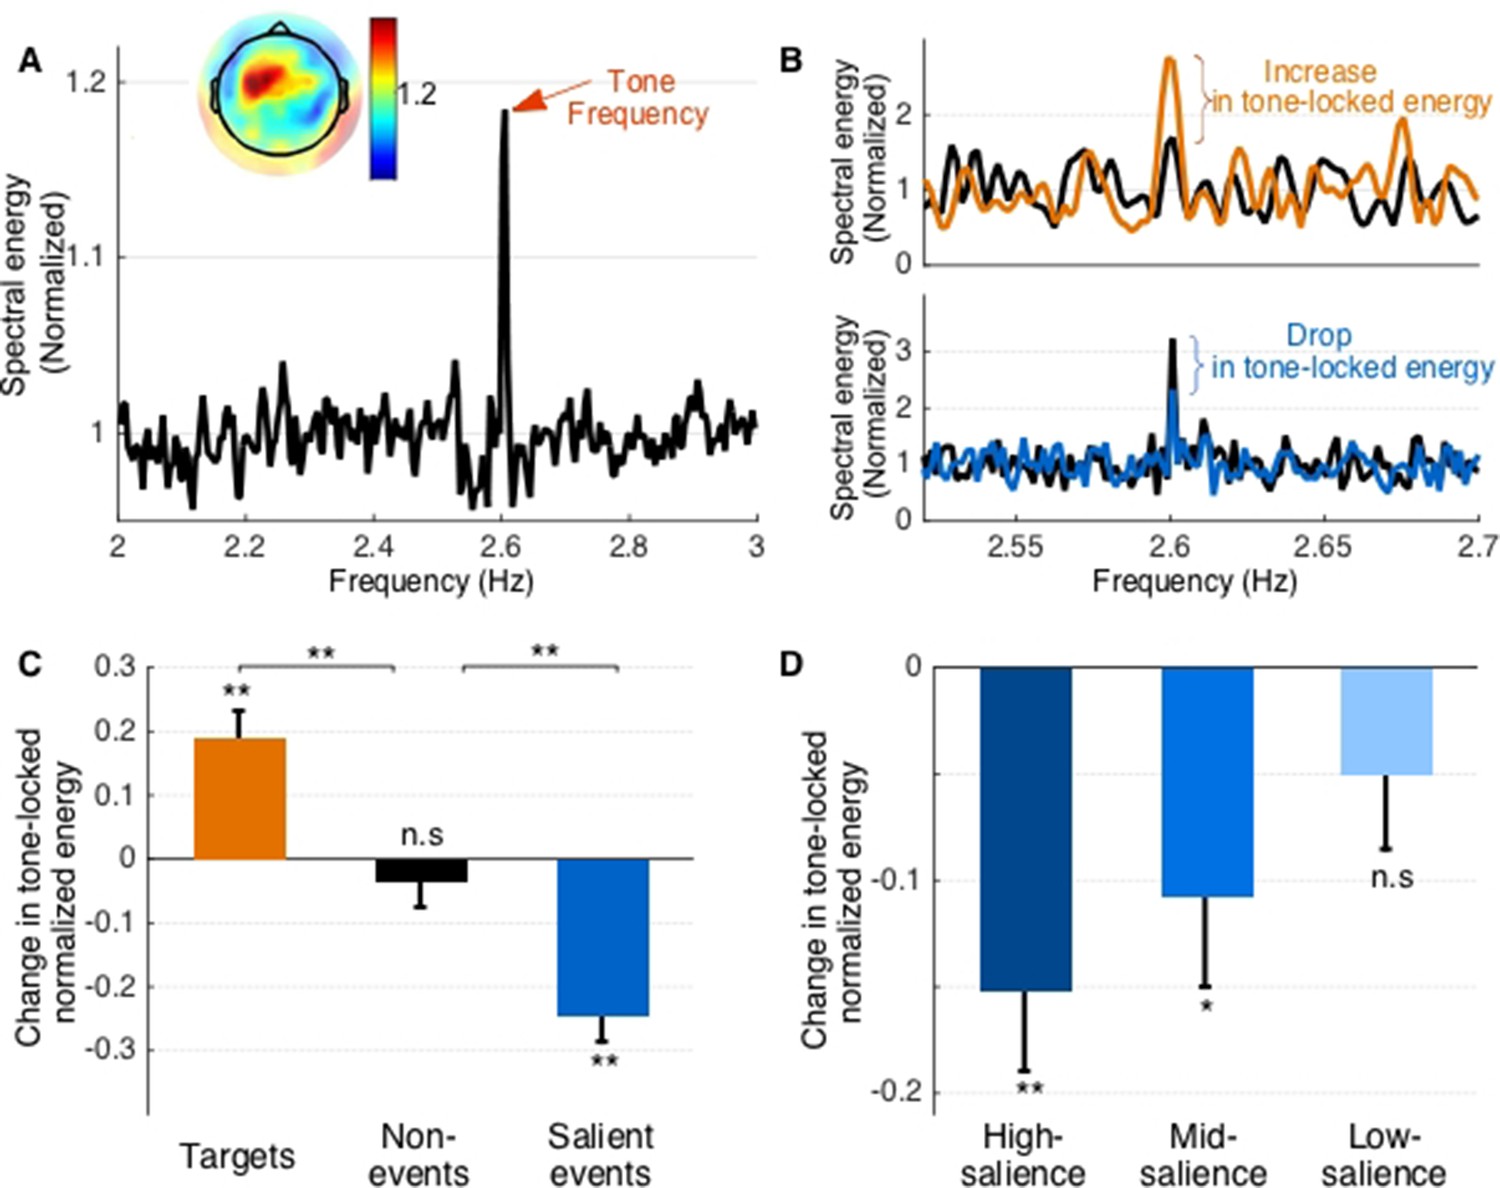
Phase-locking results.
(A) Spectral density across all stimuli. The peak in energy at the tone presentation frequency is marked by a red arrow. Inset shows average normalized tone-locking energy for individual electrodes. (B) Spectral density around target tones (top) and salient events (bottom). Black lines show energy preceding the target or event, while colored lines depict energy following. Note that target tones are fewer throughout the experiment leading to lower resolution of the spectral profile. (C) Change in phase-locking energy across target tones, non-events, and salient events. (D) Change in tone-locking energy across high, mid, and low salience events. Error bars depict ±1 SEM.
Figure 3
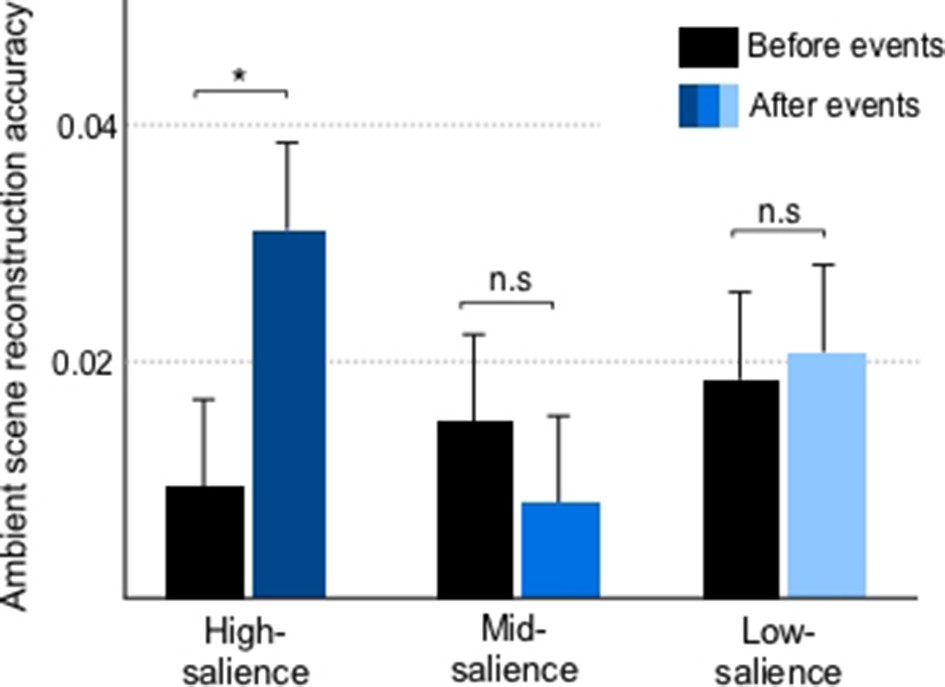
Reconstruction of ignored scene envelopes from neural responses before and after salient events for high, mid and low salience instances.
The accuracy quantifies the correlation between neural reconstructions and scene envelopes estimated using ridge regression (see Materials and methods). Error bars depict ±1 SEM.
Figure 4
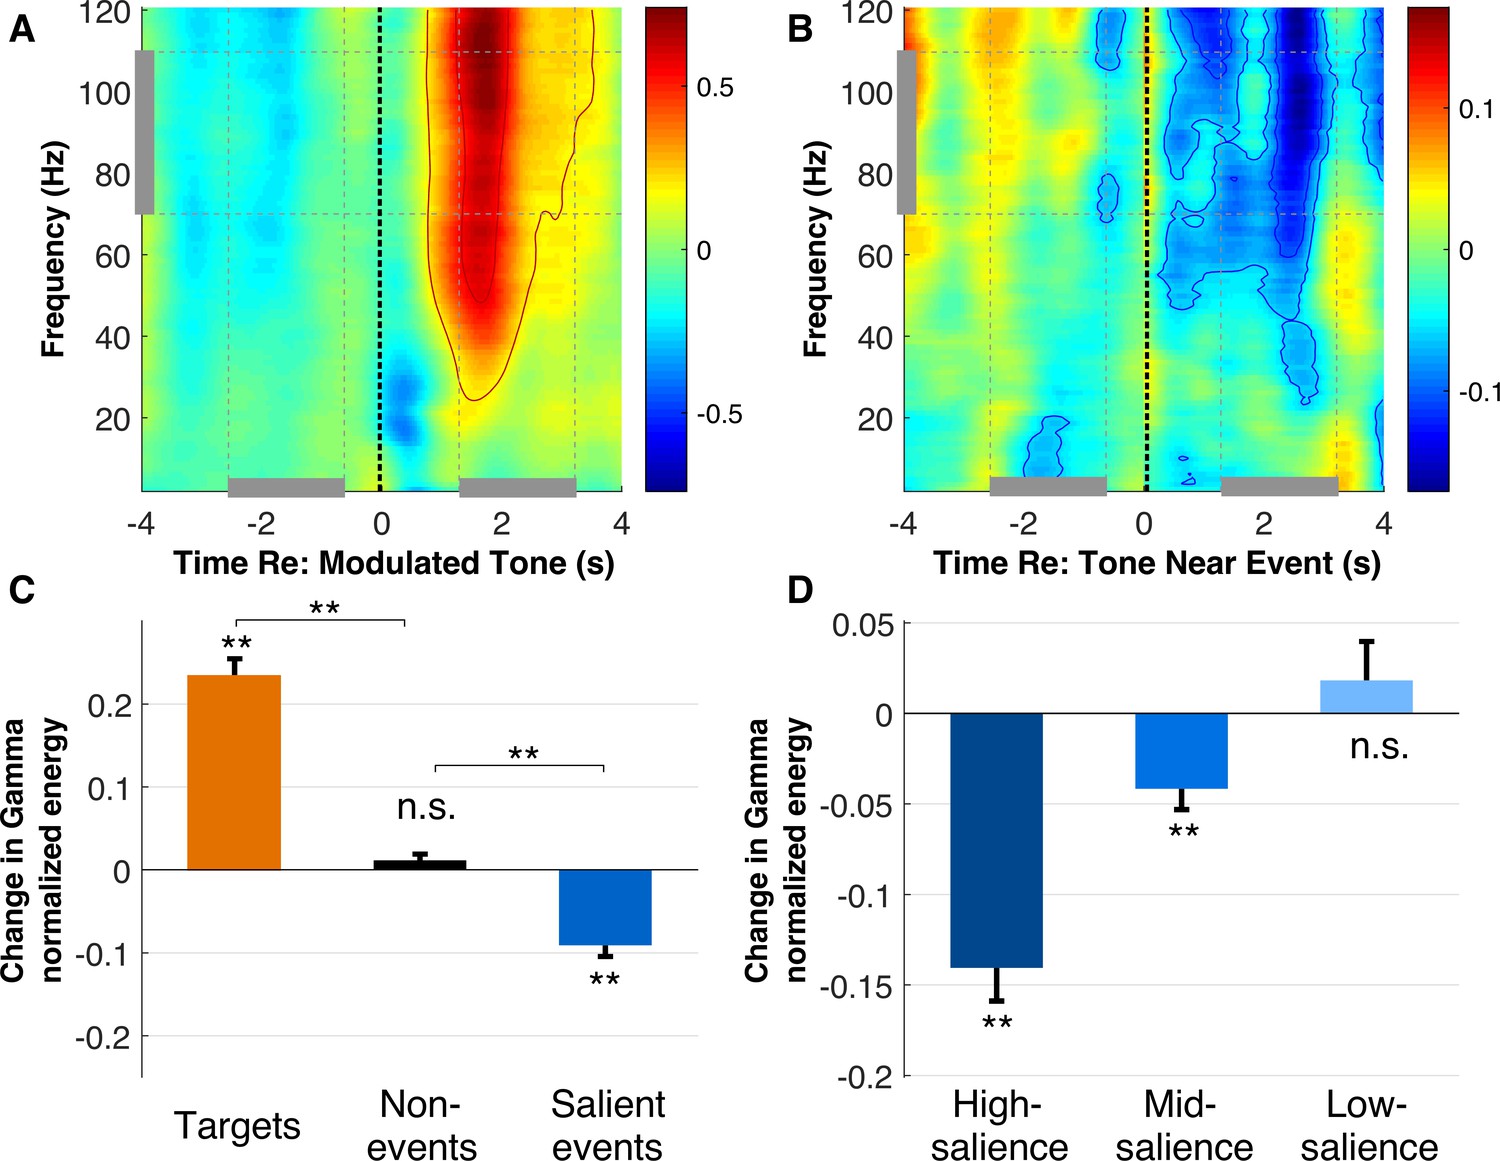
High gamma band energy results.
(A) Time frequency spectrogram of neural responses aligned to onsets nearest modulated targets, averaged across central and frontal electrodes. Contours depict the highest 80% and 95% of the gamma response. (B) Time frequency spectrogram of tones nearest salient events in the background scene. Contours depict the lowest 80% and 95% of the gamma response. (C) Change in energy in the high gamma frequency band (70–110 Hz) across target tones, non-events, and salient events relative to a preceding time window. (D) Change in high gamma band energy across high, mid, and low salience events. Error bars depict ±1 SEM.
Figure 5
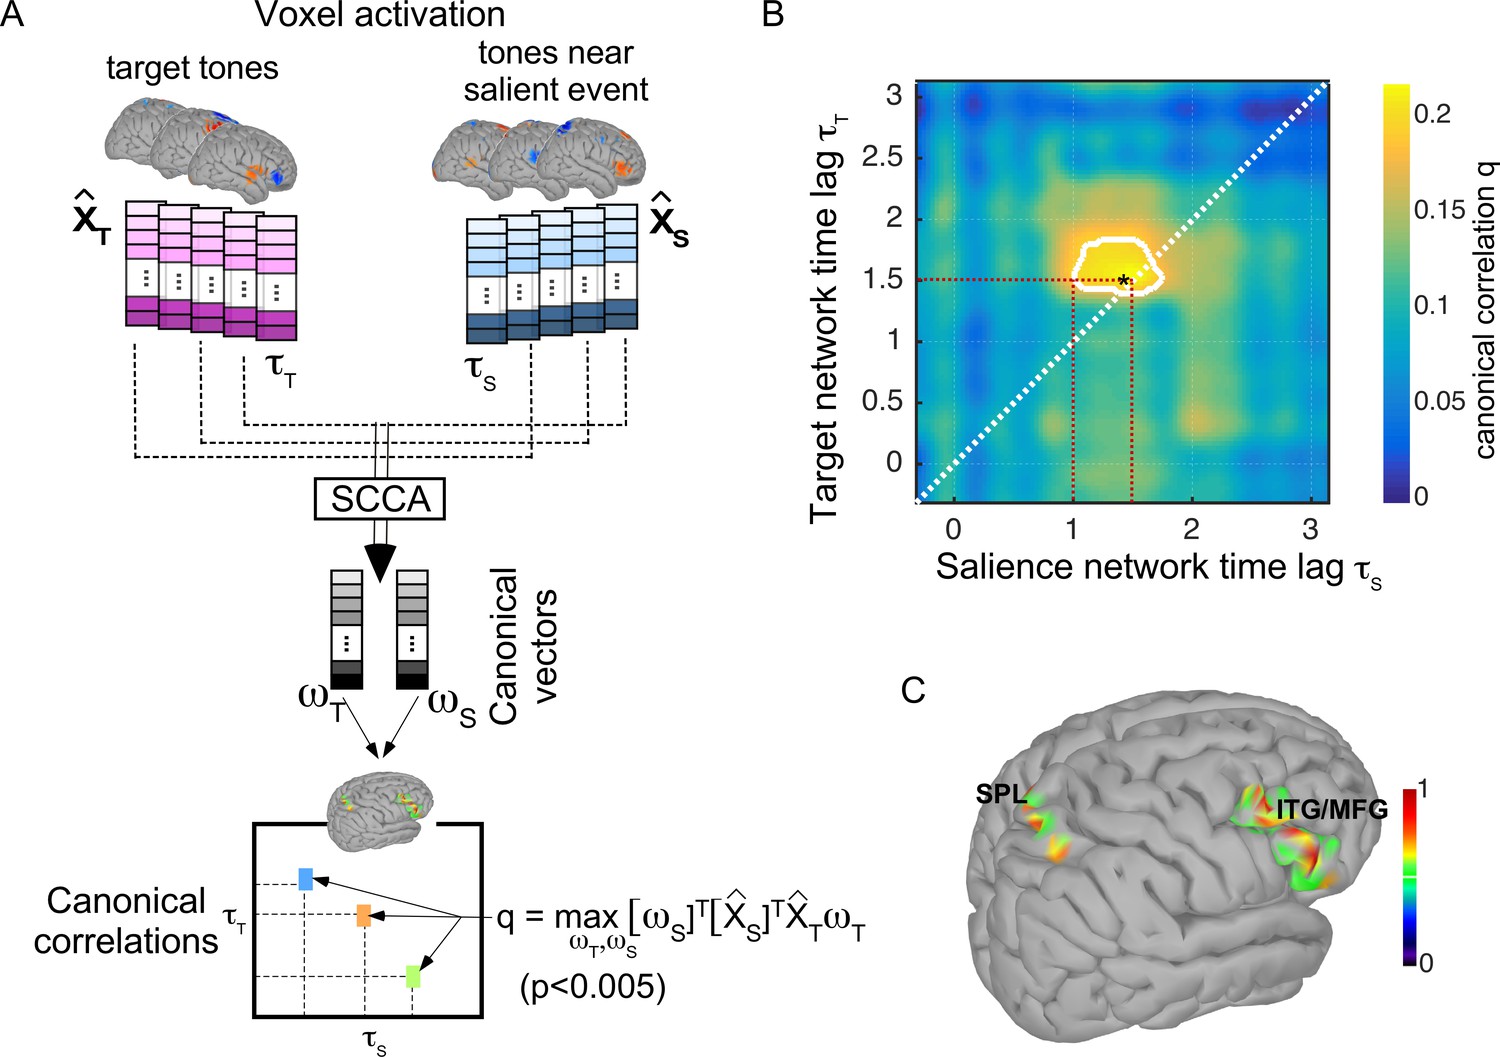
Analysis of overlapping brain networks.
(A) Sparse canonical correlation analysis (SCCA) is applied to compare top-down (near target) and bottom-up (near salient event) activation maps. Activations at different time lags and are compared using SCCA which yields a canonical correlation value that maximizes the correlation between linear transformations of the original maps; . A statistical significance (-value) of the correlation value is also estimated at each computation lag using a permutation-based approach (see Materials and methods). (B) Canonical correlation values comparing neural activation patterns after tones near salient events (x-axis) and target tones (y-axis). The contour depicts all canonical correlations with statistical significance less than . (C) Projection of canonical vector (mapping function) that yields maximal correlation between the response after salient events and the response after target tones (at the point shown with an asterisk in panel B). The red dashed lines are visual guides to highlight earliest point of observed significant correlation as well as time index of correlation point indicated by an asterisk. The overlap is right-lateralized and primarily located within the superior parietal lobule(SPL), the inferior frontal gyrus(IFG), and the medial frontal gyrus(MFG).
Figure 6

Event Prediction Accuracy.
A neural network classifier is used to detect whether a tone in the attended sequence coincides with a salient event or not. The figure quantifies the average prediction accuracy (area under the ROC curve) resulting from training (and testing) the classifier using only high gamma band energy, only tone-locking energy, and both features. Error bars depict ±1 SEM. The noise floor is computed by shuffling feature values and labels (coincidence with salient tone).
Additional files
Download links
A two-part list of links to download the article, or parts of the article, in various formats.
Downloads (link to download the article as PDF)
Open citations (links to open the citations from this article in various online reference manager services)
Cite this article (links to download the citations from this article in formats compatible with various reference manager tools)
Push-pull competition between bottom-up and top-down auditory attention to natural soundscapes
eLife 9:e52984.
https://doi.org/10.7554/eLife.52984


