Functional heterogeneity of lymphocytic patterns in primary melanoma dissected through single-cell multiplexing
- Laboratory of Translational Cell and Tissue Research, KU Leuven, Belgium
- Pathology, Department of Medicine & Surgery, Università degli studi di Milano-Bicocca, Italy
- ProtATonce Ltd, Greece
- National Technical University of Athens, Greece
- Laboratory of Experimental Oncology, KU Leuven, Belgium
- Department of Surgical Oncology, KU Leuven, Belgium
Figures
Figure 1
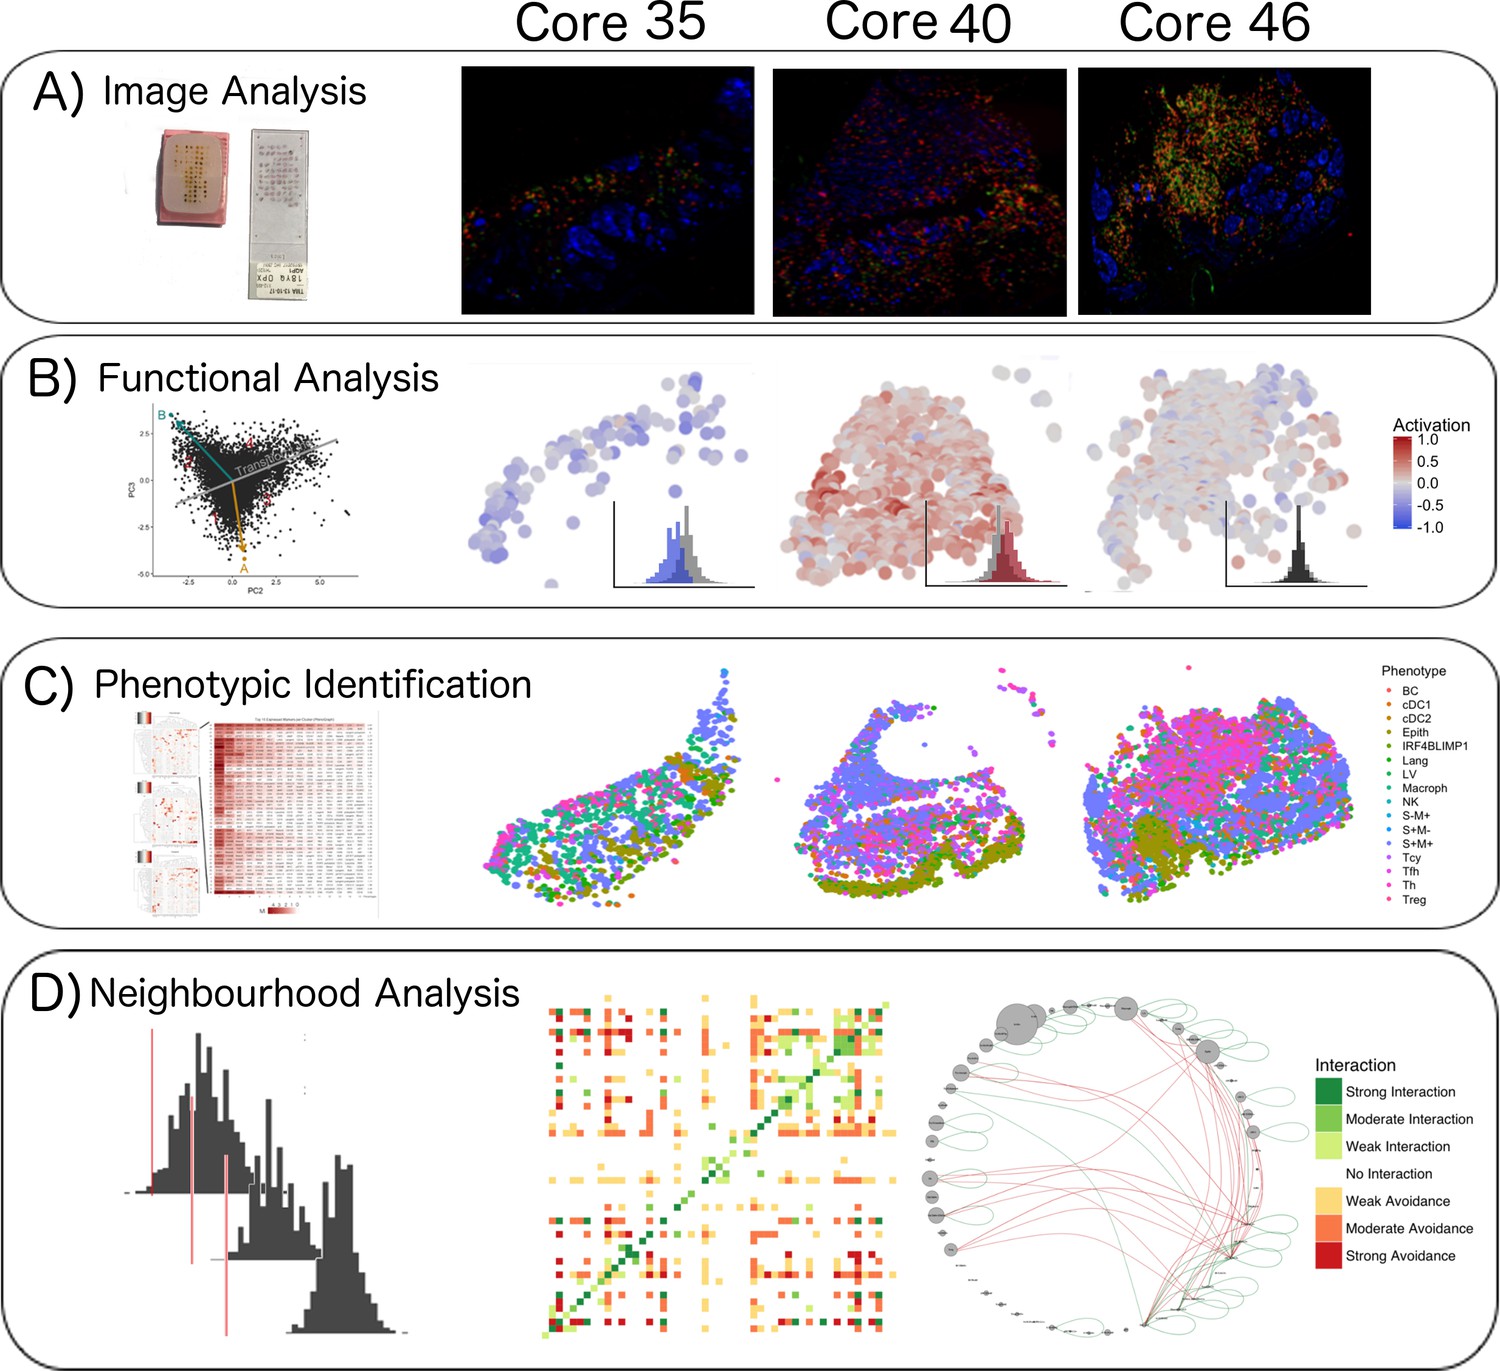
Single-cell analysis scheme.
(A) TMA construction, Multiplex-stripping immunofluorescence: 60 cores were obtained from 29 patients, assembled in a Tissue Micro Array, and analysed using the MILAN technique; the immunofluorescence images from one round of staining (three markers/round: S100-blue, CD3-red, CD4-green) of three representative cores from our data set are shown. (B) CD8+ cells were analyzed using image analysis for functionality using an activation parameter derived from multiple activation and exhaustion markers evaluated at single-cell resolution; the CD8+ cells are here digitally reconstructed for each of the above standing cores, preserving their spatial distribution in the tissue section and assigning each of them a color according to the activation status. (C) All the cell populations in the cores were phenotypically identified using consensus between three clustering methods and manual annotation from the pathologists; The heatmaps with the levels of expression of the phenotypic markers per cluster for one of the three clustering methods are shown on the left; on the right, all the inflammatory cells are assigned a color based on their phenotype and the tissue is digitally reconstructed for each of the above standing cores, preserving the spatial distribution of each cell. (D) The social network of the cells was analysed using a permutation test for neighborhood analysis in order to make inferences on cell-cell interactions. The results of the neighborhood analysis are generated as a heatmap were the type and the strength of the interaction is expressed with a color code; to simplify the visualization of the interactions, the different cell types are represented in a circle and connected with lines that clarify the type of relationship between them.
Figure 2 with 5 supplements
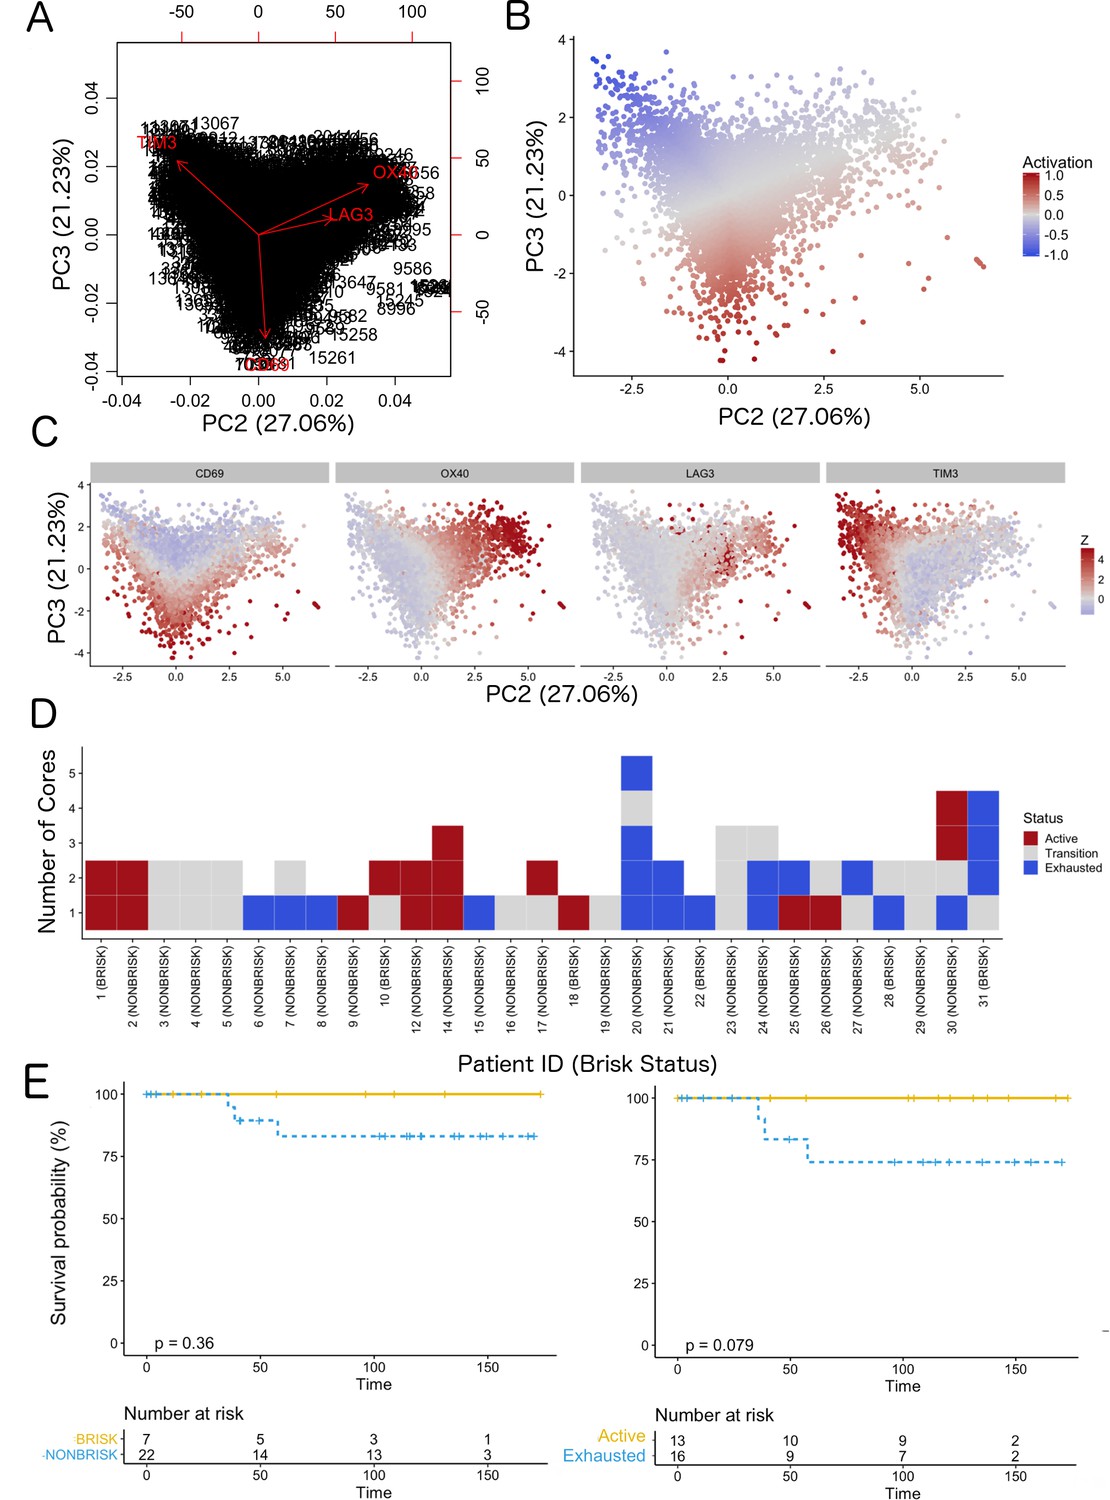
Definition of activation and implications in overall survival.
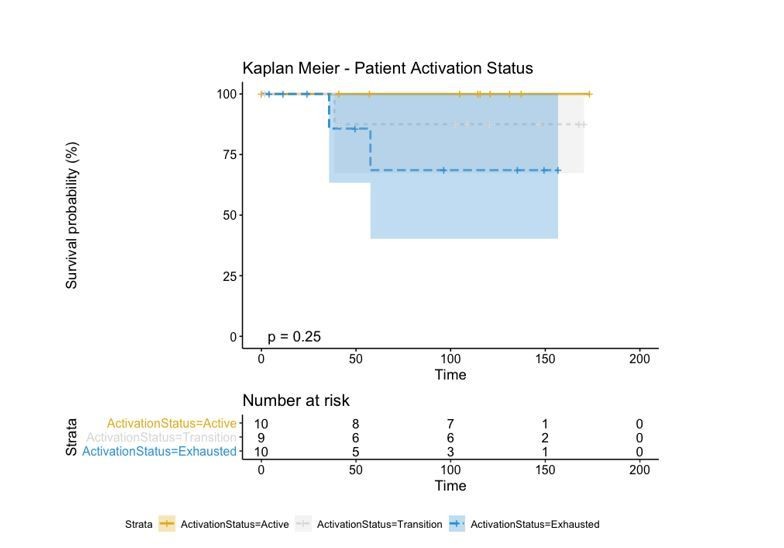
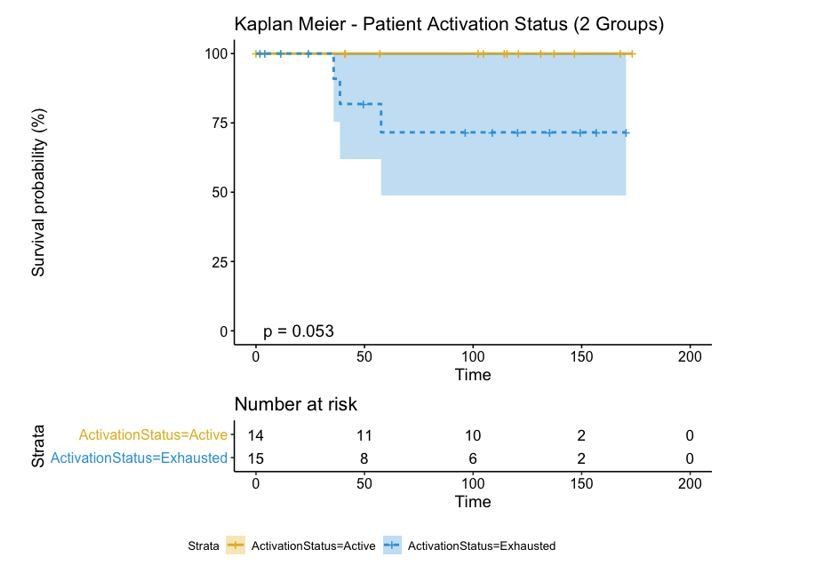
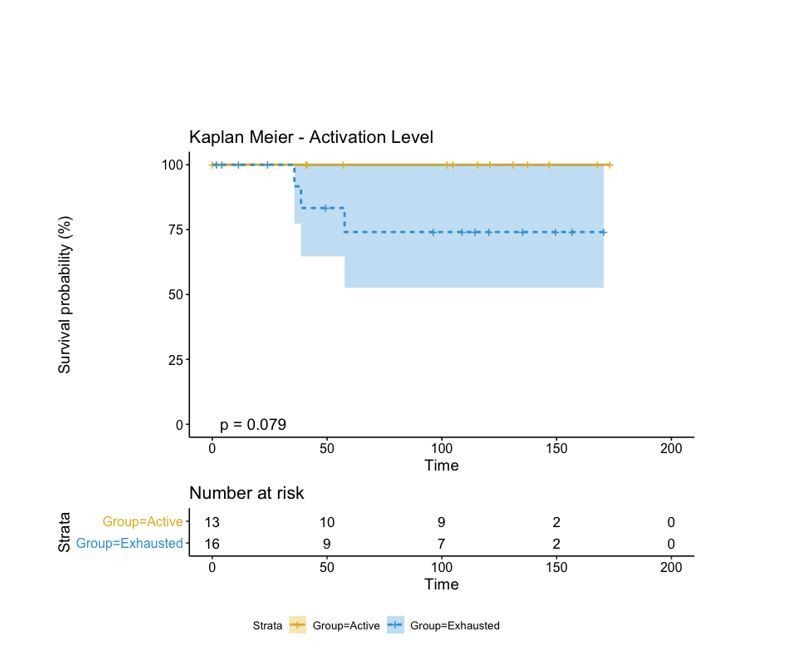
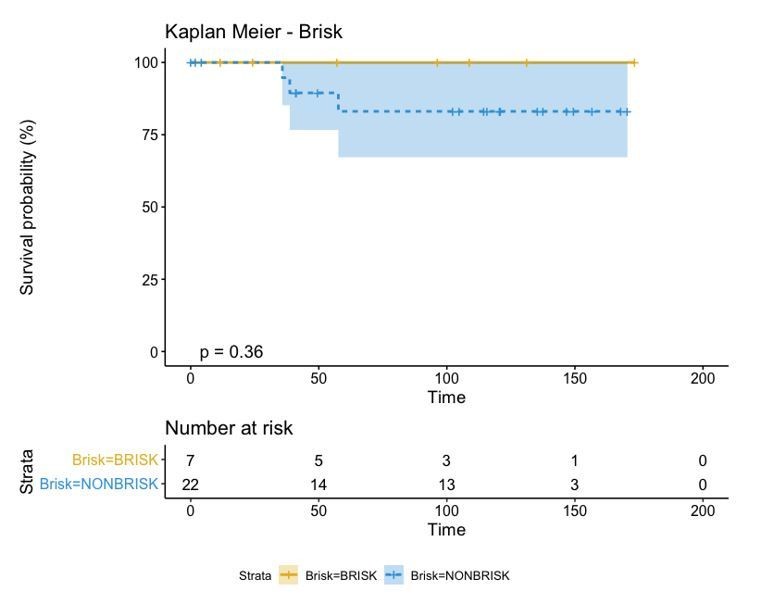
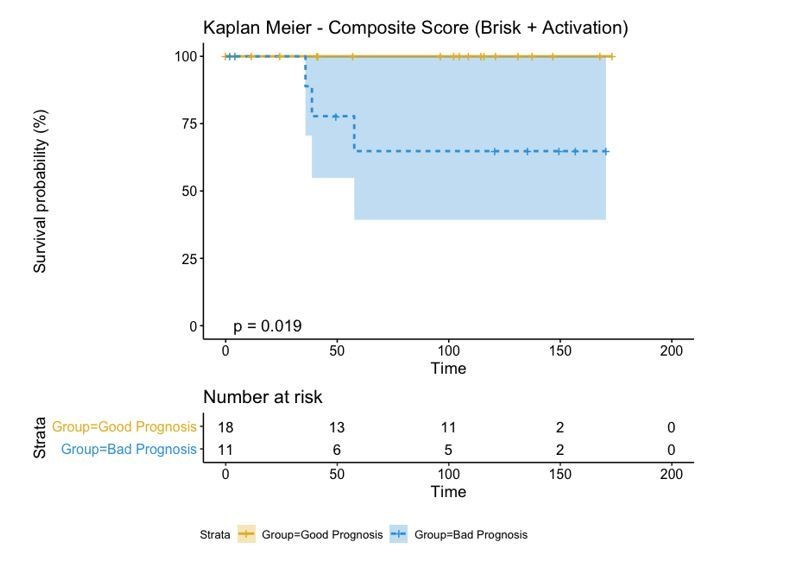
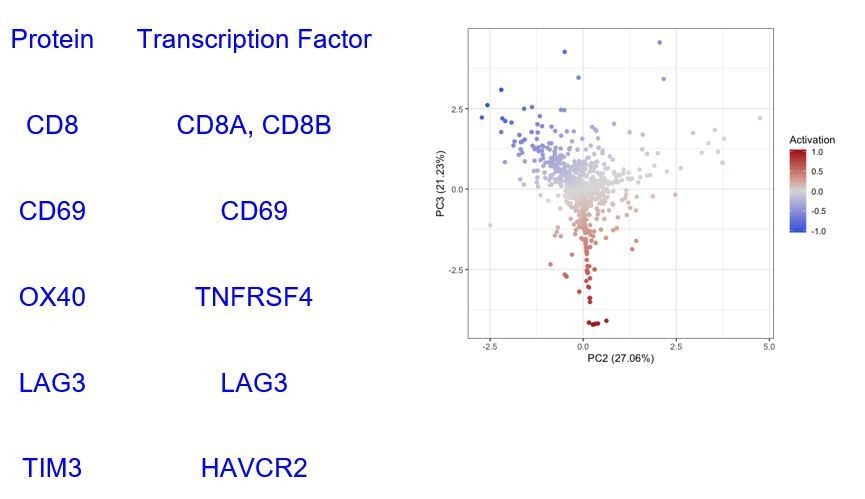
A biplot showing the projection of the cells as well as the rotation vectors of the markers over PC2 and PC3 has been created using only CD8-positive cells and the four markers relevant for their functional status: CD69, OX40, LAG3, and TIM3. (A). This was the first step to define a gradient of activation going from the maximum projected value of CD69 (maximum activation) to the maximum projected value of TIM3 (maximum exhaustion) (B). (C) Z-scores of the original markers over PC2 and PC3. (D) Visual representation of the inter- and intra-patient heterogeneity, that shows how most of the patients present a relative homogeneous activation status of the Tcy. Each core is assigned an activation status (‘Active’, ‘Transition’, or ‘Exhausted’). The cores are grouped for each patient, giving an at-a-glance representation of the heterogeneity of the activation status in different areas of the melanoma in the same patient. (E) The survival analysis in our data set shows a higher overall survival for brisk patients (left) and for patients with high levels of activation (right). Most importantly, the functional definition of activation/exhaustion shows improved prognostic value when compared to the brisk morphological parameter (p.value = 0.075 vs p.value = 0.31 log-rank test).
Figure 2—figure supplement 1
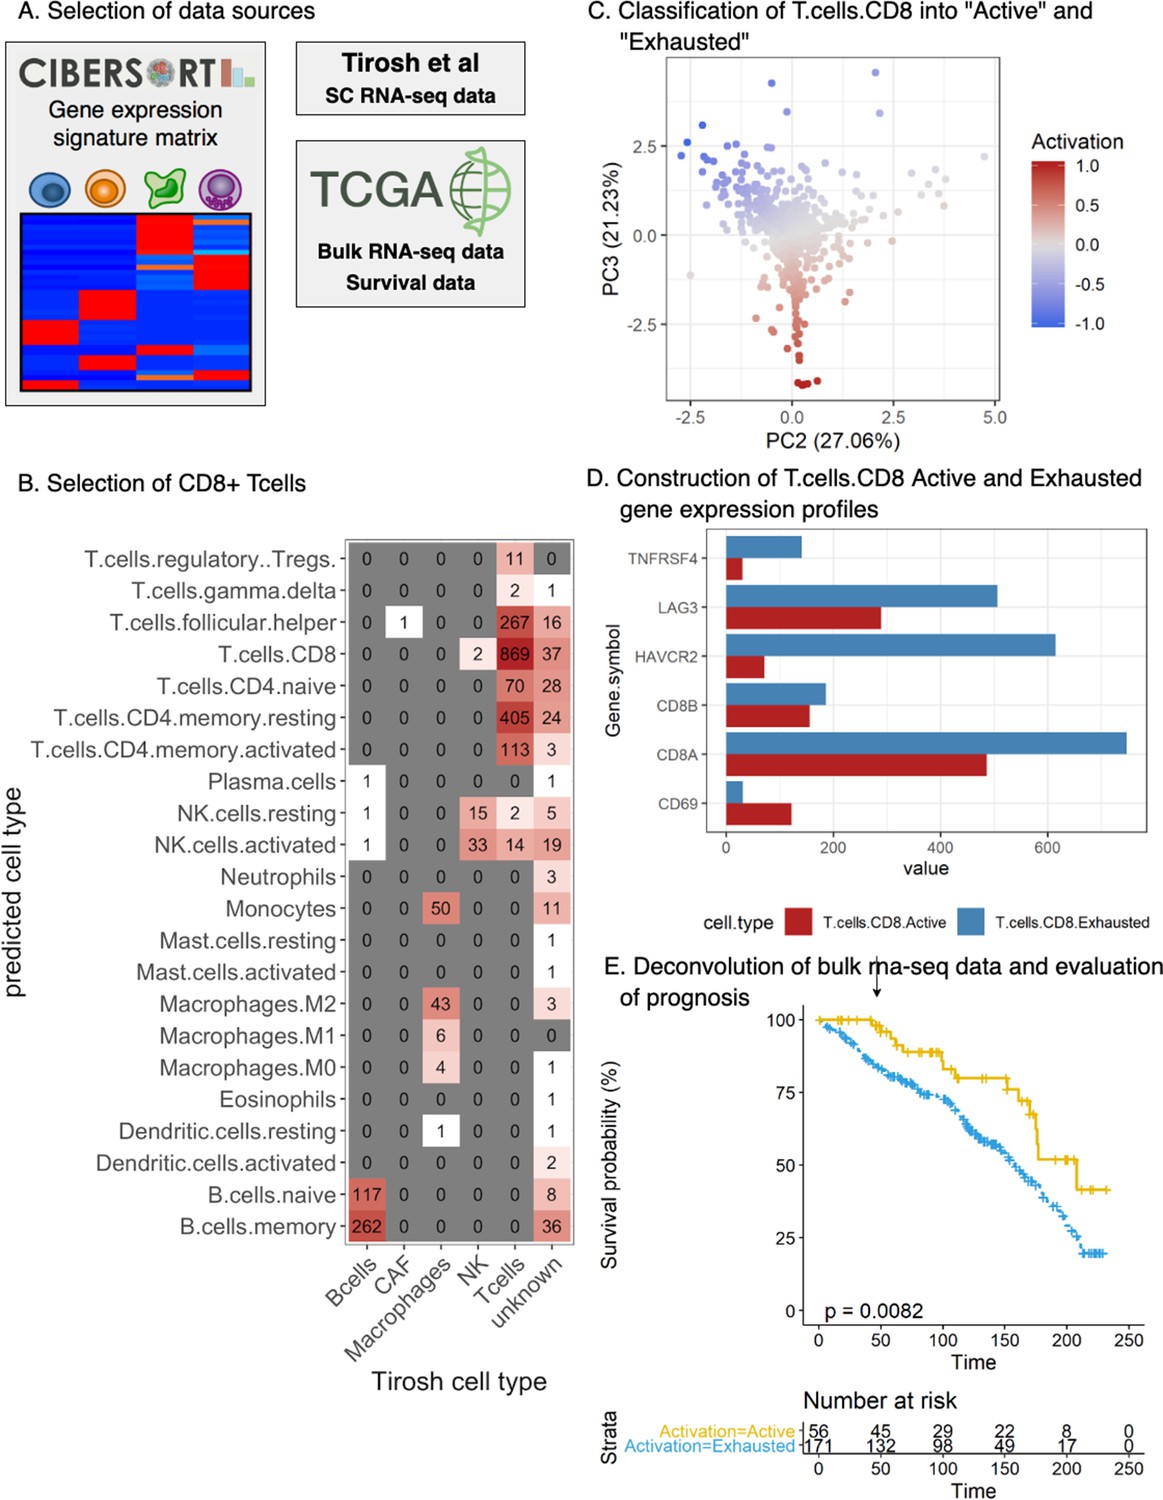
Validation of the prognostic implications of our activation score in an independent cohort.
(A) Selection of the data sources: The Cancer Genome Atlas Skin Cutaneous Melanoma (TCGA-SKCM) dataset was deconvoluted using Cibersort with custom cell-specific profiles derived from Tirosh et al [29]. (B) Selection of CD8+ Tcells: First, single cells from Tirosh [29] were mapped (spearman correlation) to the signature profiles included in the LM22 gene signatures from Cibersort. The heatmap represents the contingency matrix between the labels obtained from Tirosh and the ones obtained using the signature profiles of LM22. Cells mapped as T.cells.CD8 were filtered for further analysis. (C) Classification of T.cells.CD8 into ‘Active’ and ‘Exhausted’: our T cell activation/exhaustion scoring system was applied to the CD8+ Tcells classifying them into ‘Active’ and ‘Exhausted’ (see Materials and methods, Functional analysis of TILs). The scatter plot represents the obtained distribution of activation values for each of the cells labeled as T.cells.CD8 (similar to Figure 2.B). (D) Construction of T.cells.CD8 Active and Exhausted gene expression profiles: Custom cell-type-specific profiles were built for T.cells.CD8.Active and T.cells.CD8.Exhausted using the average expression of all the T.cells.CD8 labeled as ‘Active’/‘Exhausted’ (Supplementary file 3). The barplot represents the value for each gene in the profile. (E) Deconvolution of bulk rna-seq data and evaluation of prognosis: TCGA-SKCM dataset was filtered using only stage I and II patients for comparability with our dataset (see Materials and methods, Functional analysis of TILs). Cibersort was applied using the generated profiles obtaining the relative number of T.cells.CD8.Active and T.cells.CD8.Exhausted. Patients were labeled as ‘Active’ if the relative number of T.cells.CD8.Active was higher or equal than the relative number of T.cells.CD8.Exhausted and ‘Exhausted’ otherwise. Survival analysis revealed that the Active group of patients had better prognosis than the exhausted group of patients (log-rank p-value=0.0082) validating the results obtained with our dataset as shown by the Kaplan-Meier curves.
Figure 2—figure supplement 2

qPCR and shotgun proteomics.
Confirmation of the functional subgroups by qPCR (A) and shotgun proteomics plus pathway analysis (B). With qPCR we were able to identify, both in B and NB metastasis, active (green rectangles) and exhausted (red rectangles) cases. With proteomics we confirmed that the ‘IFNg-high’ case had more proteins that the ‘LAG3-high’ and the ‘none’ case involved in inflammatory pathways among which the IFNg-related pathway (in gray).
Figure 2—figure supplement 3
Definition of activation.
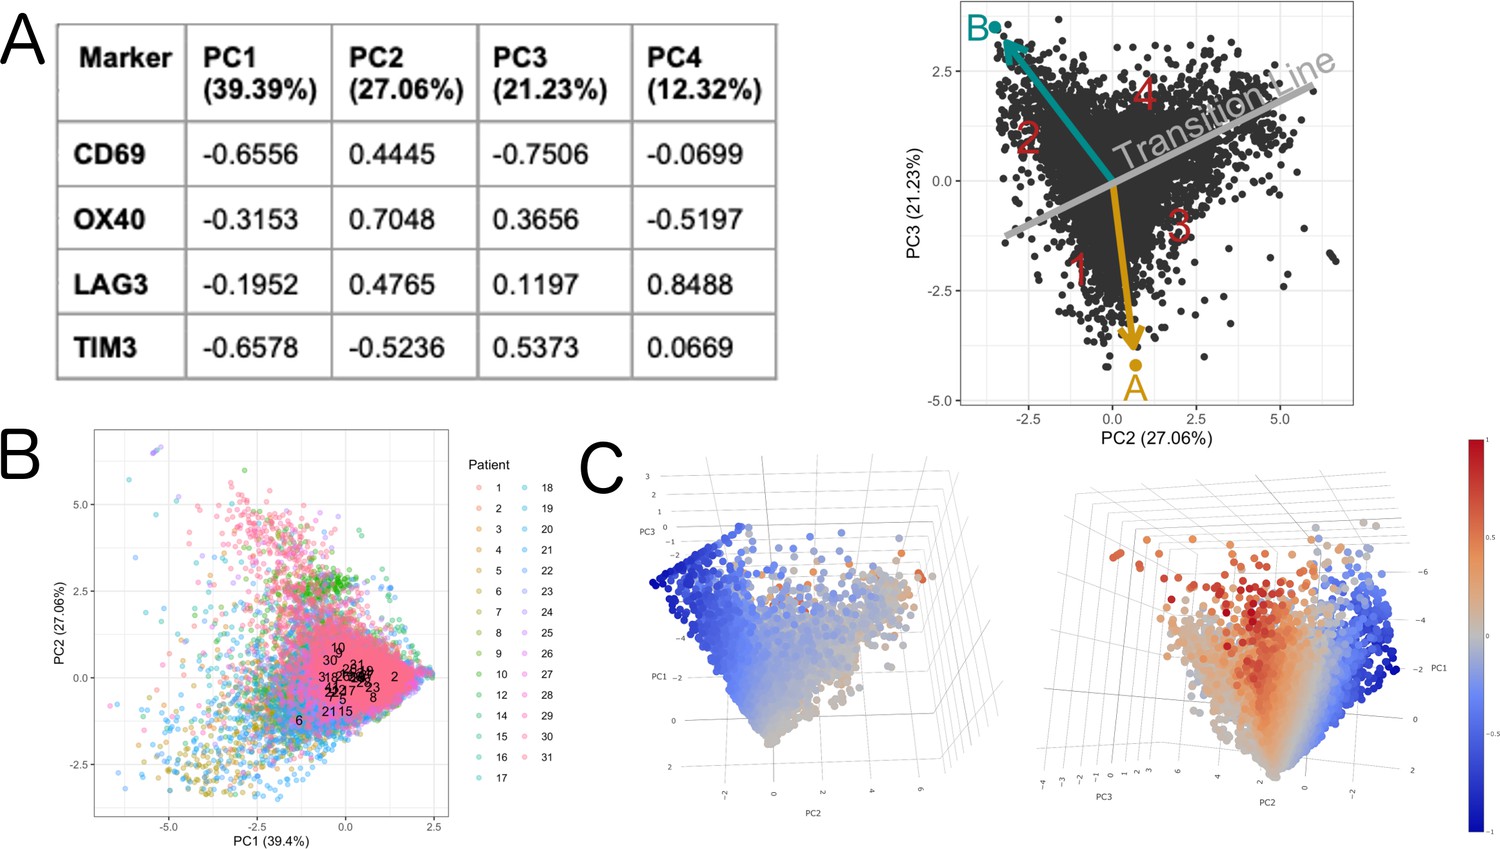
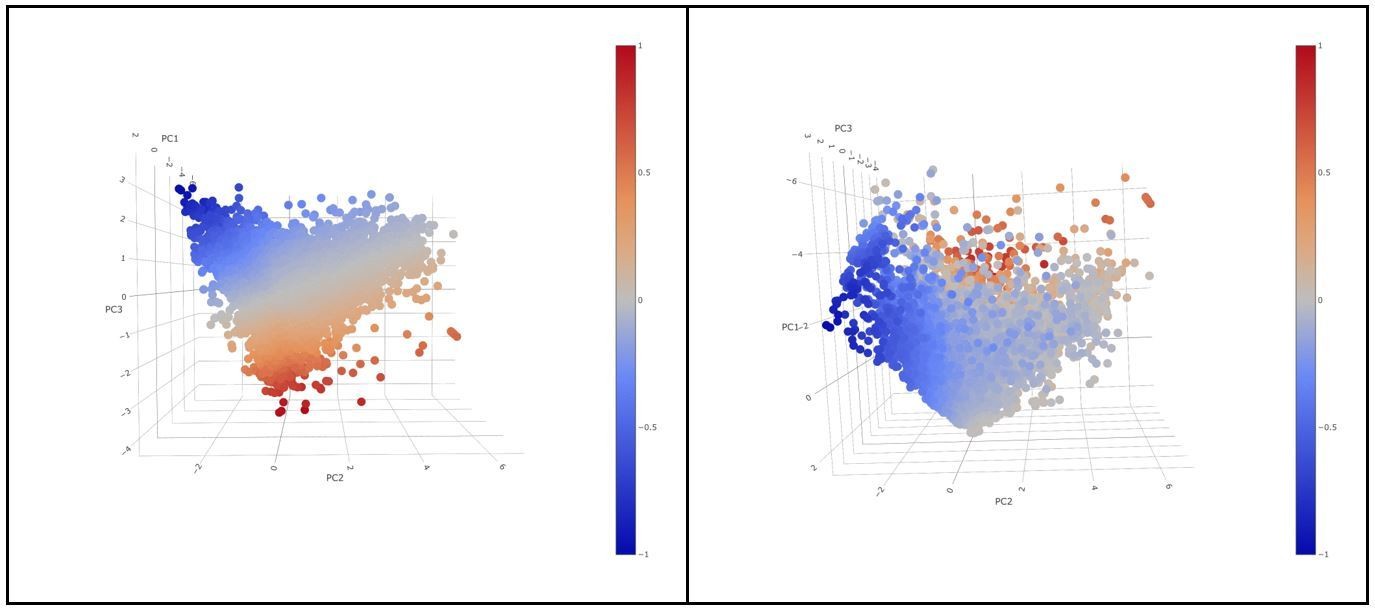
The rotation matrix from the PCA shows that PC1 is capturing general expression of the initial markers (all the markers with the same sign) (A). PC1 explained 39,39% of the total variance and was not associated to a patient effect as shown by (B). The 3D animation GIF visible in the on line version of this paper shows how PC1 can be attributed to the general expression of cells some cells express more than others (C): if we visualize a 3D scatter plot with PC1, PC2 and PC3 with every cell colored by activation we can see that the resulting 3D structure has a pyramidal shape with PC1 parallel to its main axis and its apex (main vertex) found at the maximum value of PC1 (Animation 1, Animation 2). As seen in 3D plot and supported by the projections on Figure 2C, points near the vertex (centroid of the projection in Figure 2C), do not show a strong expression for any marker. On the other hand, points close to the base of the pyramid (low values of PC1) show a strong differential expression of the activation and exhaustion markers. Therefore, PC1 was disregarded for the activation/exhaustion analysis and only PC2 and PC3 were used.
Figure 2—figure supplement 4

Definition of Activation in the Core Level (A) and Patient Level (B).
(A) After assessing the activation level of every CD8+ lymphocyte present in the TMA (Materials and methods: functional analysis of TILs and supplementary information 1), a label was assigned to each core (‘Active’, ‘Transition’, and ‘Exhausted’) using one-tailed t-tests comparing the distribution of the activation values in the cells from a particular core versus the background distribution (combination of all cores). p-Values were adjusted using the False Discovery Rate (FDR) method. A cut-off value of 0.001 over the adjusted p-values was used as classification threshold. Histograms show the distribution of cells for a particular core colored in red/dark gray/blue if they were labeled as active/transition/exhausted. (B) In order to obtain patient-specific read-outs, we pooled together all the cells from all the cores for each patient and repeated the same that we did for the cores (to compare the distribution of cells for a specific patient against the background distribution). This classified each patient into one of the three categories (‘Active’, ‘Transition’, and ‘Exhausted’).
Figure 2—figure supplement 5
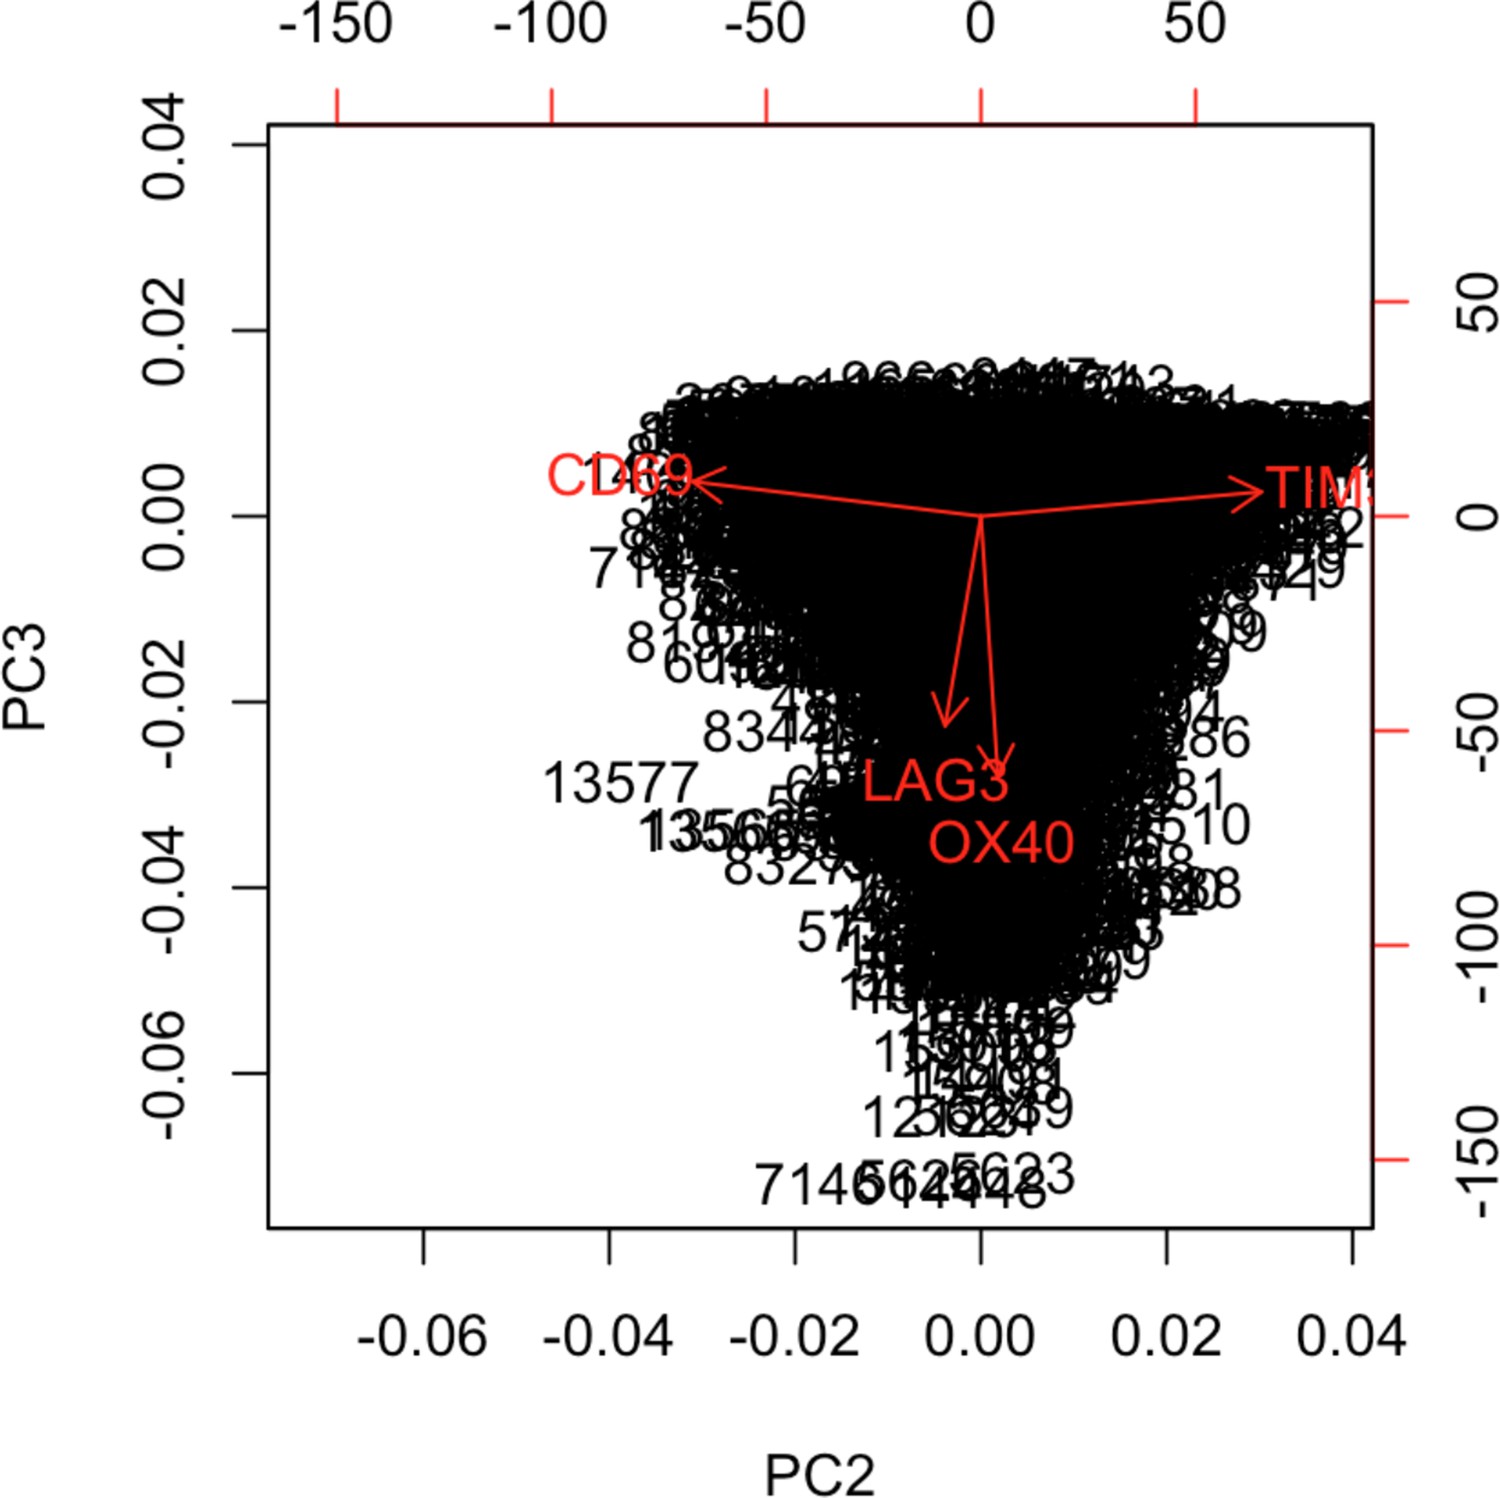
Biplot showing the projection of the Tcy cells over PCs 2 and 3.
In order to verify the solidity of the method, we compared the results obtained with the DAPI mask with the ones obtained with the CD8+ mask (Figure 2.A). We applied the same approach to define the activation status of the T cytotoxic cells on the Tcy phenotypic cluster, and we observed the same structural behavior of the activation and exhaustion markers (CD69 and TIM3 at opposite ends of the activation spectrum, concordance between LAG3 and OX40).
Figure 3
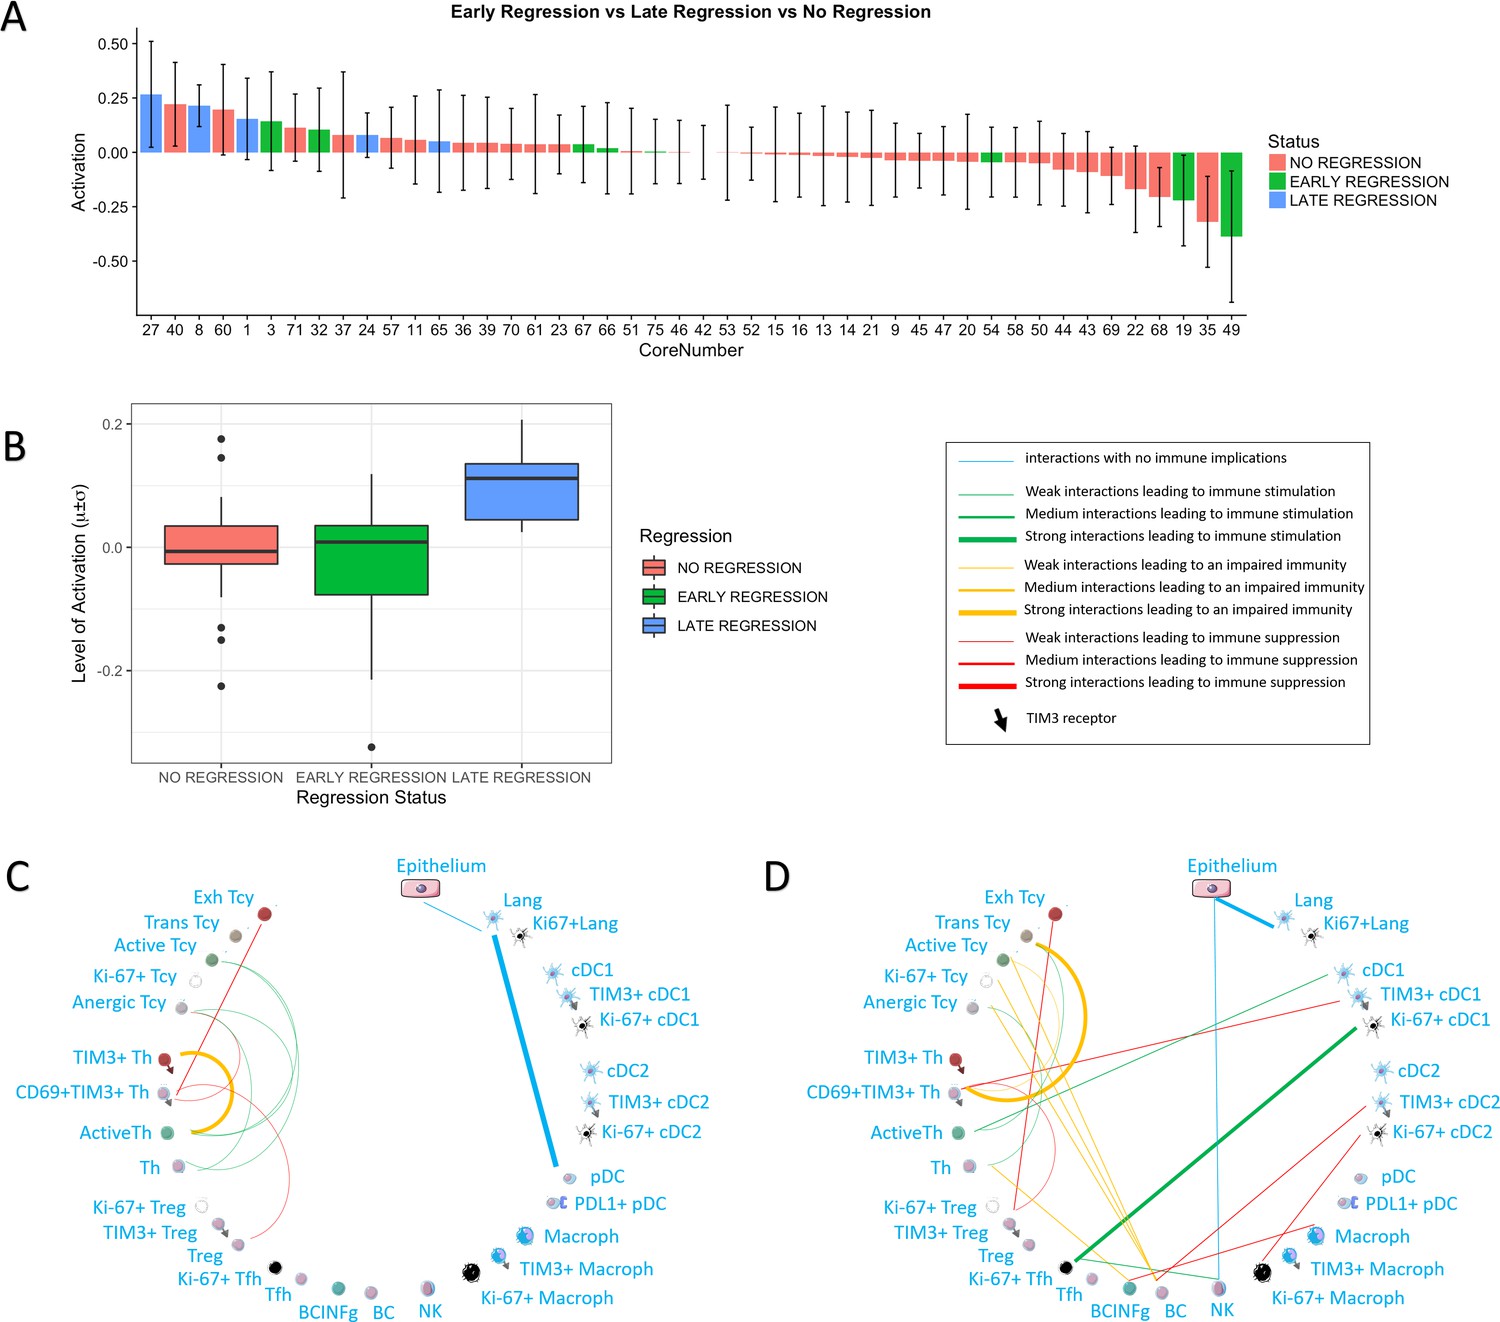
Activation status and neighborhood analysis in late, early and no regression.
(A) The histogram shows the distribution of the different cores according to the activation levels of the Tcy. The color code identifies the presence and the type of regression areas in the cores. The cases with late regression are all in the left part of the histogram, showing higher levels of activation compared to cores with early regression or without regression. (B) This can be visualized also as a box plot. The neighborhood analysis for late (C) and early (D) regression shows an enrichment in immune-stimulating interactions in the first and more interactions leading to immune impairment in the latter. The thickness of the edge in the network represents the level of interaction between the different cell types. The colour of the line indicates interactions leading to immune suppression (red), to immune stimulation (green), to a probably sub-optimal/impaired immune stimulation (orange), no immune implications (blue).
Figure 4 with 1 supplement
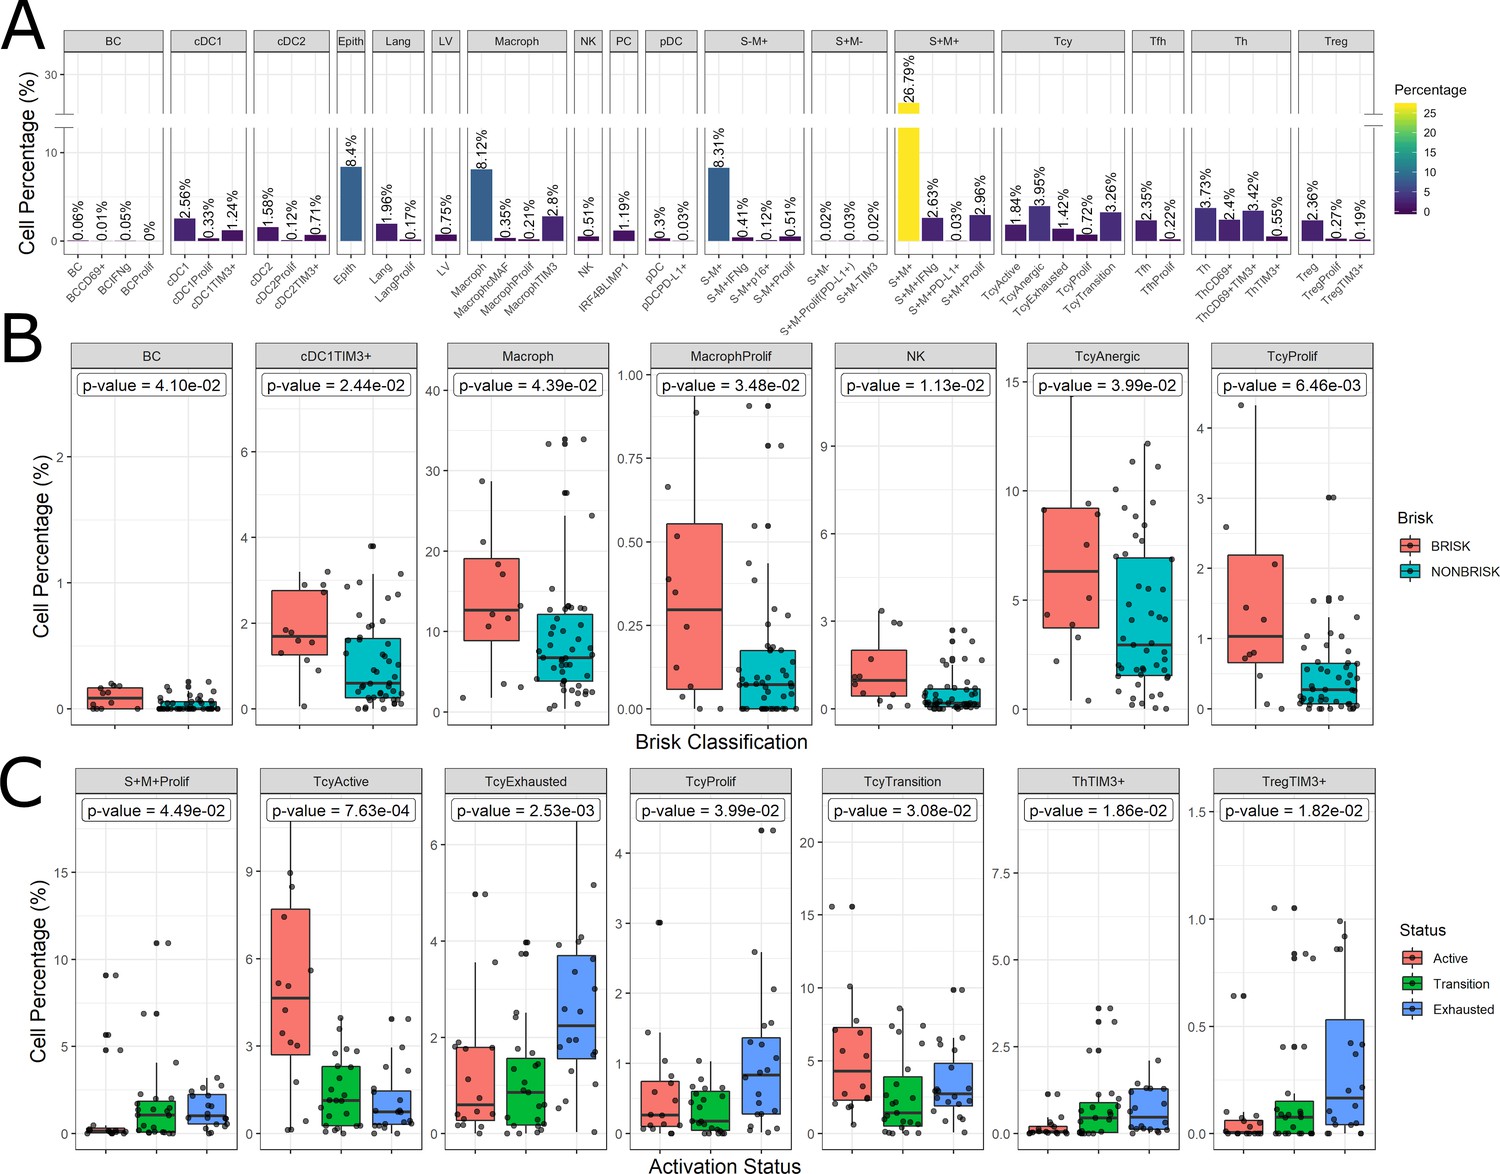
Distribution of the immune cells’ subgroups and significant differences in the morphological and functional TILs categories.
The percentage of cells for each inflammatory subpopulation across all the cores is showed in (A). The 17 phenotypic clusters are on the upper side of the graph, while at the bottom each of them is subdivided in the respective functional subclusters. BC = B cells; cDC1 = classical dendritic cells type 1; cDC2 = classical dendritic cells type 2; Epith = epithelial cells; PC = plasma cells; Lang = Langerhans cells; LV = lymph vessels; Macroph = macrophages; pDC = plasmocytoid dendritic cells; S-M+=S100+MelanA- melanoma cells; S+M-=S100-MelanA+=melanoma cells; S+M+=S100+MelanA+ melanoma cells; Tcy = cytotoxic T cells; Tfh = T follicular helpers; Th = T helpers; Treg = regulatory T cells; suffix: ‘prolif’=proliferating, IFNg = interferon gamma. (B) Significant differences (p.value <0.05) in cell percentages between brisk and non-brisk categories (Wilcoxon rank sum test). (C) Significant differences (p.value <0.05) in cell percentages across the functional groups: Active, Transition, Exhausted (Kruskal-Wallis rank sum test).
Figure 4—figure supplement 1
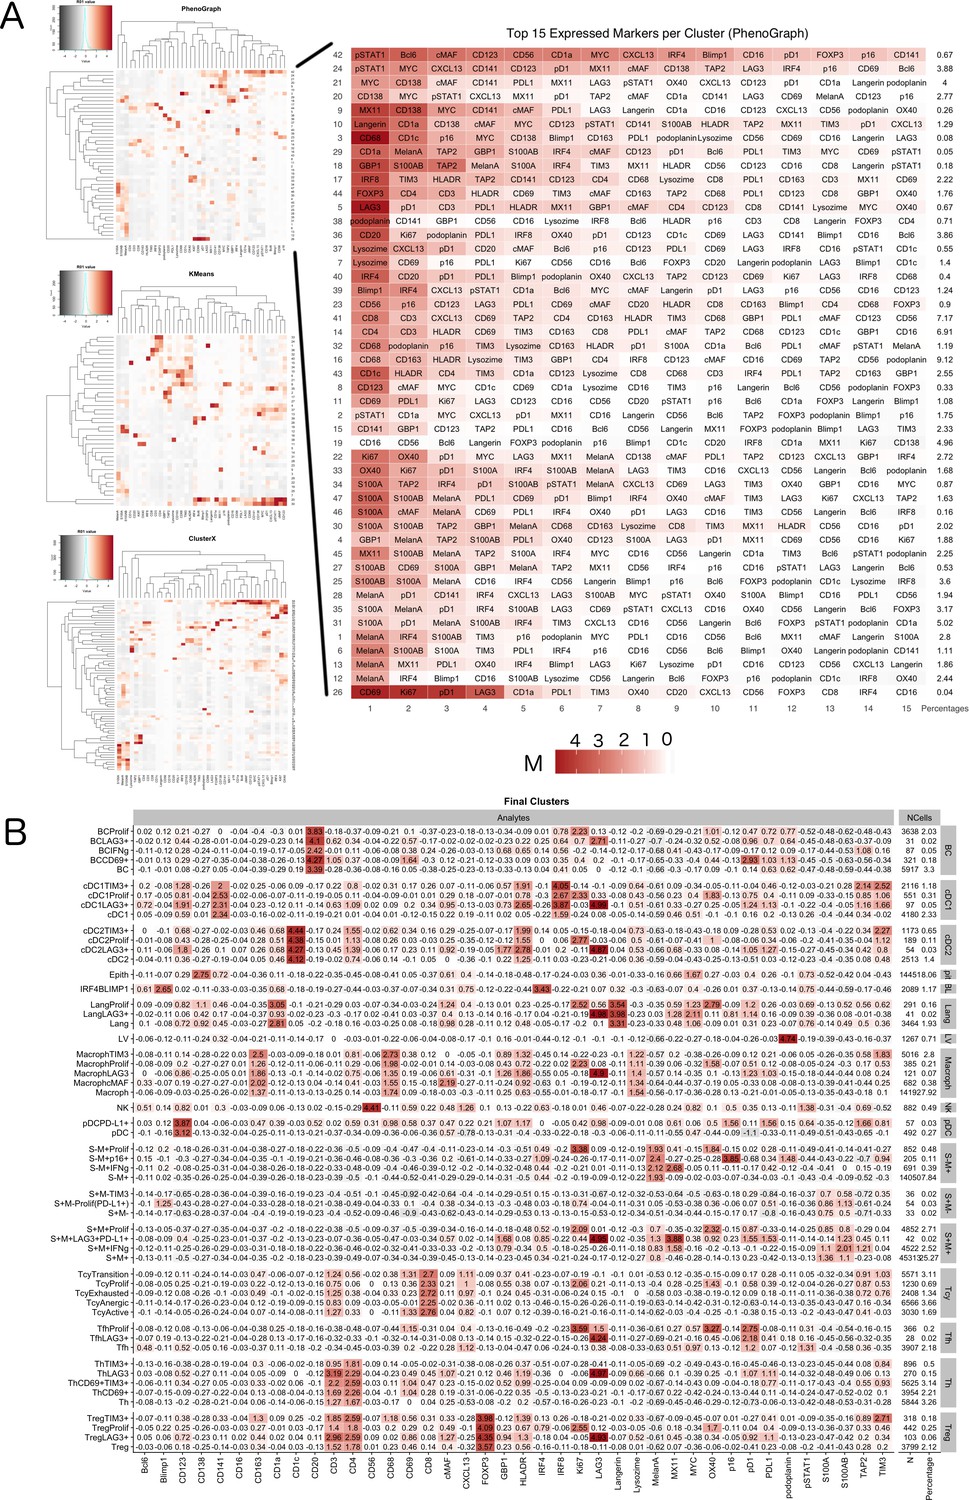
Phenotype Identification.
A two-tier approach was implemented for the identification of cell subpopulations. (A) Initially, heatmaps generated with KMeans, PhenoGraph, and ClusterX (left) were used to identify the main inflammatory subpopulations, resulting in clusters that were named by manual annotation by the pathologist based on the level of expression of the phenotypic markers; on the right one of the heatmaps is enlarged to serve as an example: for each cluster identified by phenograph the levels of expression of the 15 most expressed markers have been used by the pathologist to identify the inflammatory population most probably present in that cluster. The final phenotypes were defined using a consensus-based approach (a phenotype was assigned if two or more clustering methods agreed in their prediction). (B) Cell populations were further sub-clustered into functional subgroups using PhenoGraph over the set of functional markers and annotation by the pathologist. For each cluster identified with the Materials and method described, here the identified subclusters are shown as an heatmap with the corresponding levels of expression of the selected functional markers.
Figure 5
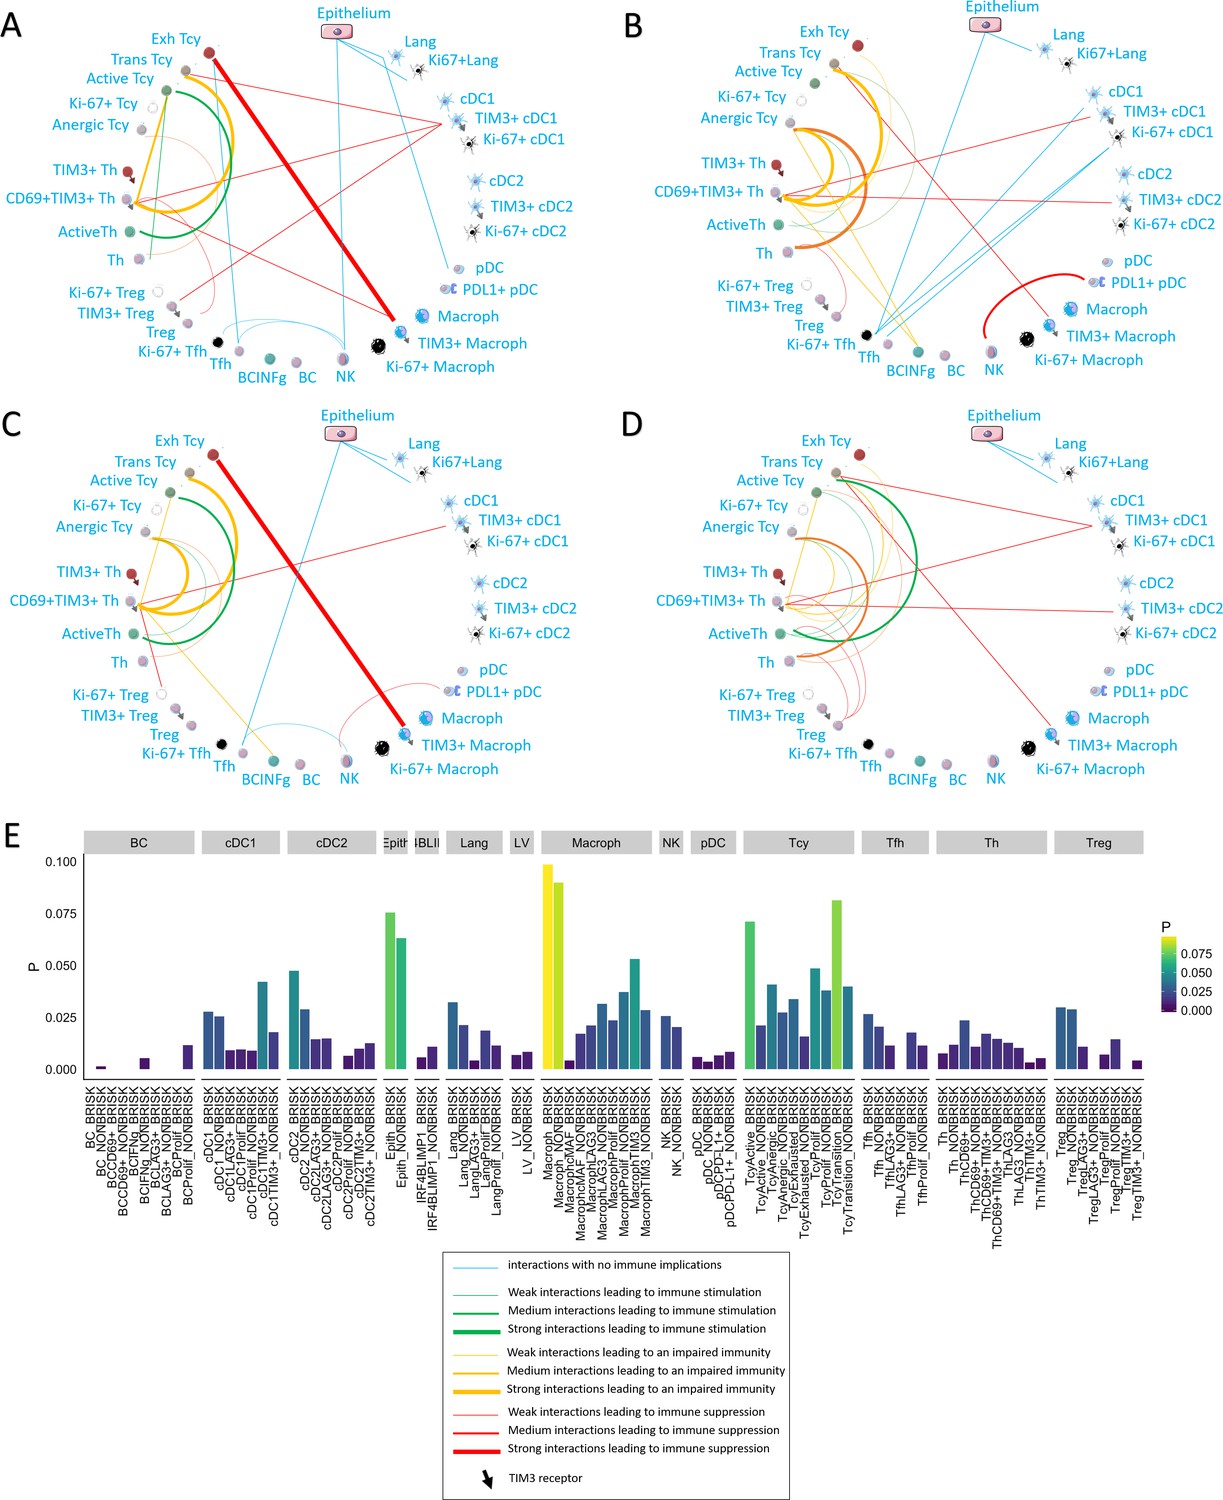
Neighborhood analysis in the morphological and functional TILs categories.
The result of the neighborhood analysis for active (A), exhausted (B), brisk (C), and non-brisk (D) cases represented as cellular social networks. The thickness of the edge in the network represents the level of interaction between the different cell types. The colour of the line indicates interactions leading to immune suppression (red), to immune stimulation (green), to a probably sub-optimal/impaired immune stimulation (orange), no immune implications (blue). The brisk and active plots display a lot of similairies; nevertheless, the brisk and non brisk categories are not exactly overlapping with the active and exhausted plots, suggesting them to be the result of cases with activation and cases with exhaustion pooled together under the morphological labels. (E) The histogram shows the alternative approach of neighbourhood analysis tailored to explore specifically the interactions regarding melanoma cells. We observed that the main inflammatory cells subtypes in contact with melanoma cells are macrophages and (as expected) epithelial cells, both in brisk and non-brisk cases, followed by Tcy with active and in transition Tcy in brisk cases and proliferating and anergic Tcy in non-brisk cases. Other small differences between brisk and non-brisk cases are more TIM3+ cDC1, cDC2 and TIM3+ macrophages in contact with melanoma cells in brisk cases.
Figure 6
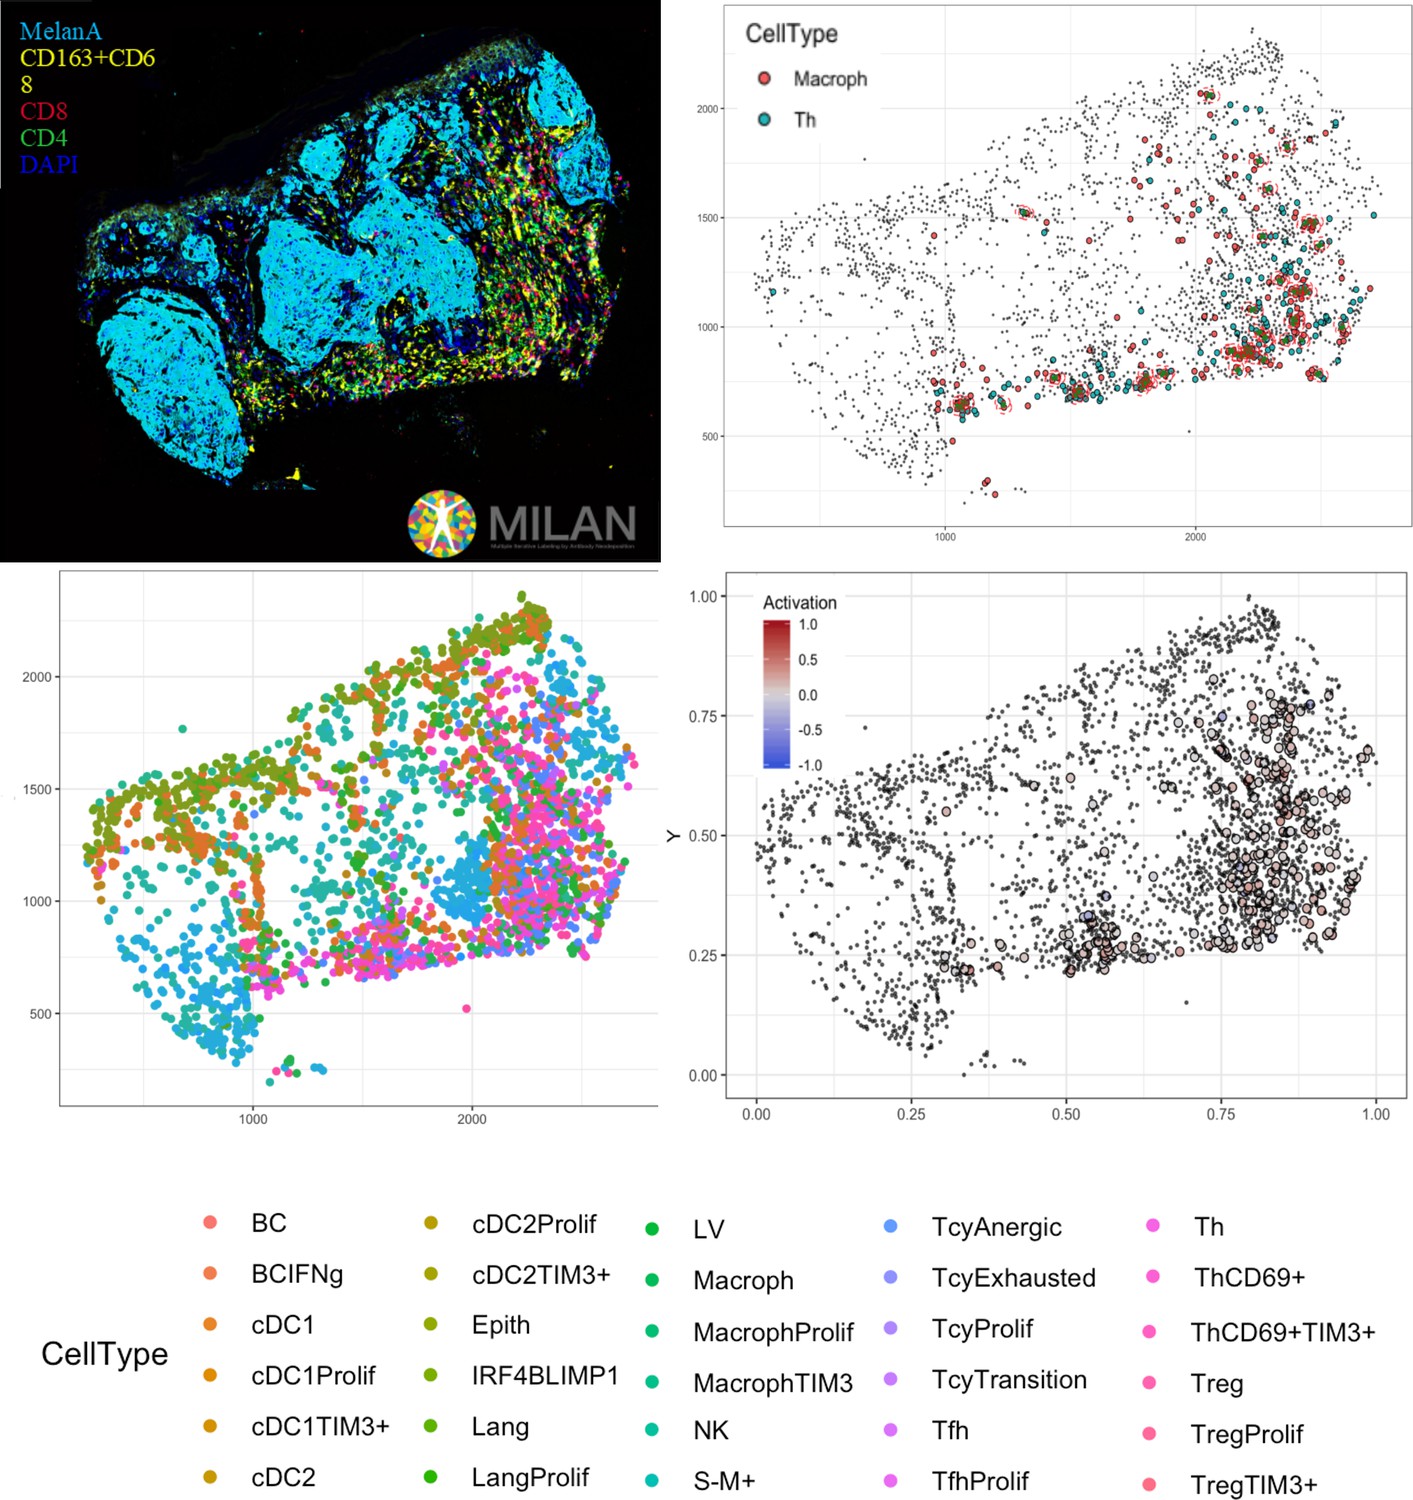
Complete digitalization of a core and practical example of a possible downstream analysis.
Anti-clockwise: (1) images for the markers stained with the MILAN multiplexing technique (for this work 39 markers, but we reached in our laboratory an output of around 100 markers per single section) are acquired and composite images with some selected markers can be prepared. (2) All the markers are used to phenotypically identify all the cell subtypes present in the tissue and the tissue is digitally reconstructed. (3) Studies of the functional status of these cells can be done, for example we could localize exhausted and active cells in the tissue. (4) With neighborhood analysis, it is possible to identify the cells that are in proximity with each other more than chance can suggest, inferring possible interactions between these cell types (in the image, two cells identified as ‘neighbors’ are encircled in red).
Author response image 1
Author response image 2
Author response image 3
Author response image 4

Author response image 5
Author response image 6
Author response image 7
Author response image 8
Author response image 9
Author response image 10
Author response image 11
Author response image 12
Author response image 13
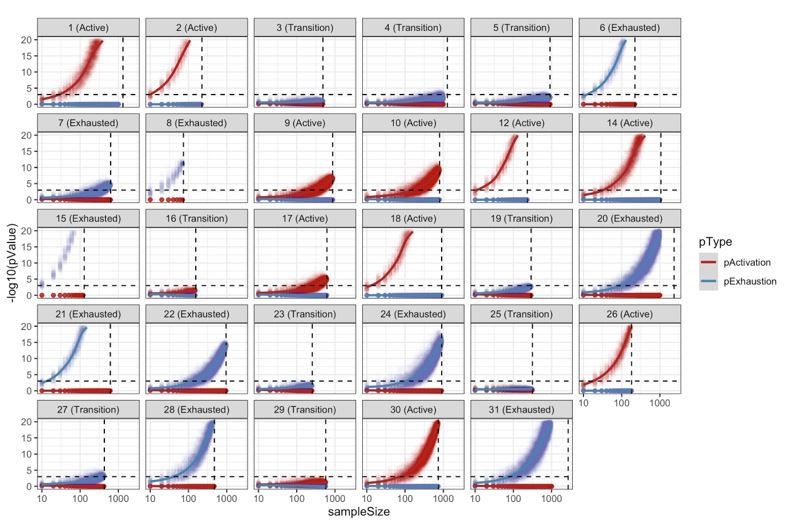
Resampling analysis.
CD8+ TCell populations were sampled 100 times for different sampling sizes (10 to 1000 with a step of 10). For every simulation, we reclassified the patient into “Active”/”Transition”/”Exhausted” using the approach described in the methods. This analysis shows the robustness of the patient classification methodology with most of the patients requiring a very small sample size in order to obtain at least 95% of consistent classifications.
Author response image 14
Videos
Animation 1
3D scatter plot with PC1, PC2 and PC3.
Animated in order to see the pyramidal shape of the 3D structure (rotating around the PC2 axis).
Animation 2
3D scatter plot with PC1, PC2 and PC3.
Animated in order to see the pyramidal shape of the 3D structure (rotating around the PC1 axis).
Tables
Table 1
Statistical analysis.
Histopathological parameters were correlated with core status (Active/Transition/Exhausted) using pairwise t-tests with pooled standard deviation. Several histopathological parameters were correlated to the average level of activation of each core.
| Parameter | Comparison | Statistical test | Multiple testing correction | p value |
|---|---|---|---|---|
| Brisk Infiltration | Brisk vs Non Brisk | t test | No | 0.8453 |
| Brisk Infiltration | Brisk vs Brisk In Non Brisk | pairwise t test | Yes | 1 |
| Brisk Infiltration | Brisk vs Non Brisk In Non Brisk | pairwise t test | Yes | 1 |
| Brisk Infiltration | Brisk In Non Brisk vs Non Brisk In Non Brisk | pairwise t test | Yes | 1 |
| Regression | Regression vs No Regression | t test | No | 0.6275 |
| Regression | Early Regression vs No Regression | pairwise t test | Yes | 0.329 |
| Regression | Late Regression vs No Regression | pairwise t test | Yes | 0.031* |
| Regression | Late Regression vs Early Regression | pairwise t test | Yes | 0.022* |
| Count Lymphocytes | Number of Lymphocytes vs Level of Activation | linear model | No | 0.3714 |
| Histotype | LMM vs NMM | pairwise t test | Yes | 0.027* |
| Histotype | LMM vs SSMM | pairwise t test | Yes | 0.021* |
| Histotype | NMM vs SSMM | pairwise t test | Yes | 0.761 |
| Breslow Thickness | Breslow vs Level of Activation | linear model | No | 0.9883 |
| Ulceration | Positive vs Negative | t test | No | 0.7252 |
| Number of Mitoses | More than 6 vs 1 to 6 | pairwise t test | Yes | 1 |
| Number of Mitoses | More than 6 vs 0 | pairwise t test | Yes | 1 |
| Number of Mitoses | one to 6 vs 0 | pairwise t test | Yes | 1 |
Key resources table
| Reagent type (species) or resource | Designation | Source or reference | Identifiers (RRID_AB) | Additional information (dilution) |
|---|---|---|---|---|
| Antibody | CD4 rabbit monoclonal EPR6855 | Abcam | 1 µg/ml | |
| Antibody | HLA-DR mouse monoclonal IgG2b SPM288 | Abcam | AB_1125217 | 1 µg/ml |
| Antibody | TAP2 mouse IgG1 monoclonal TAP2.17 | Abcam | 1 µg/ml | |
| Antibody | CD141 rabbit monoclonal EPR4051 | Abcam | AB_2201805 | 1 µg/ml |
| Antibody | MYC rabbit monoclonal EP121 | Sigma Aldrich | 1 µg/ml | |
| Antibody | FOXP3 mouse monoclonal IgG1 236A/E7 | Abcam | AB_445284 | 1 µg/ml |
| Antibody | MX1 Rabbit polyclonal | Abcam | AB_10678925 | 1 µg/ml |
| Antibody | LAG3 mouse monoclonal IgG1 11E3 | Abcam | AB_776102 | 1 µg/ml |
| Antibody | PD-L1 rabbit monoclonal 28–8 | Abcam/Epitomics | AB_2687878 | 1 µg/ml |
| Antibody | CD1a rabbit monoclonal EP3622 | Abcam/Epitomics | AB_626957 | 1 µg/ml |
| Antibody | CD123 mouse monoclonal IgG2b NCL-L-CD123 | Leica-Microystem/Novocastra | AB_10555271 | 1 µg/ml |
| Antibody | Phospho-Stat1 rabbit monoclonal 58D6 | Cell Signaling | AB_561284 | 1 µg/ml |
| Antibody | CD20 mouse monoclonal IgG2a L26 | Dako | AB_782024 | 1 µg/ml |
| Antibody | CD1a mouse monoclonal IgG1 O10 | Dako | 1 µg/ml | |
| Antibody | CD1c mouse monoclonal IgG1 2D4 | Dako | AB_2623049 | 1 µg/ml |
| Antibody | PRDM1 rat monoclonal 6D3 | Dako | AB_ | 1 µg/ml |
| Antibody | S100AB rabbit polyclonal | Dako | 1 µg/ml | |
| Antibody | CD56 mouse monoclonal IgG1 123C3.D5 | Neomarkers | AB_627127 | 1 µg/ml |
| Antibody | Ki-67 mouse monoclonal IgG2a UMAB107 | Origene | AB_2629145 | 2 µg/ml |
| Antibody | Lysozyme rabbit polyclonal | Origene | AB_1004766 | 1 µg/ml |
| Antibody | PD-1 mouse monoclonal IgG2a UMAB197 | Origene | AB_2629198 | 1 µg/ml |
| Antibody | TIM3 goat polyclonal | R and D | AB_355235 | 1 µg/ml |
| Antibody | CXCL13 mouse monoclonal IgG1 53610 | R and D | AB_2086049 | 1 µg/ml |
| Antibody | OX40 mouse monoclonal IgG1 Ber-ACT35 | Santa Cruz | AB_626897 | 1 µg/ml |
| Antibody | IRF4 goat monoclonal M-17 | Santa Cruz | AB_2127145 | 1 µg/ml |
| Antibody | cMAF rabbit monoclonal M-153 | Santa Cruz | AB_638562 | 1 µg/ml |
| Antibody | BCL6 rabbit monoclonal N3 | SCBT | AB_1158074 | 1 µg/ml |
| Antibody | CD16 mouse monoclonal IgG2a 2H7 | SCBT | AB_563508 | 1 µg/ml |
| Antibody | CD68 mouse monoclonal IgG3 PGM1 | Thermo Fisher | AB_10979558 | 1 µg/ml |
| Antibody | p16 mouse monoclonal IgG2a JC8 | SCBT | AB_785018 | 1 µg/ml |
| Antibody | MelanA rabbit monoclonal A19-P | NovusBio | AB_1987285 | 1 µg/ml |
| Antibody | Podoplanin rat monoclonal IgG2a NZ-1.2 | Sigma Aldrich | AB_10920577 | 1 µg/ml |
| Antibody | CD69 rabbit polyclonal | Sigma Aldrich | AB_2681157 | 1 µg/ml |
| Antibody | CD3 rabbit polyclonal | Sigma Aldrich | AB_2335677 | 1 µg/ml |
| Antibody | GBP1 rat monoclonal 4D10 | Sigma Aldrich | AB_828964 | 1 µg/ml |
| Antibody | Langerin rabbit polyclonal | Sigma Aldrich | AB_1078453 | 1 µg/ml |
| Antibody | IRF8 rabbit polyclonal | Sigma Aldrich | AB_1851904 | 1 µg/ml |
| Antibody | CD8 rabbit monoclonal SP16 | Thermo Fisher | AB_627211 | 1 µg/ml |
| Antibody | CD138 mouse monoclonal IgG1 MI-15 | Thermo Fisher | AB_10987019 | 1 µg/ml |
Table 2
Multiplex antibody panel description.
| Protein | Concentration | Species | Clone | Company | RRID_AB: |
|---|---|---|---|---|---|
| CD4 | 1 µg/ml | rabbit Mab | EPR6855 | Abcam | N/A |
| HLA-DR | 1 µg/ml | mouse IgG2b | SPM288 | Abcam | 1125217 |
| TAP2 | 1 µg/ml | mouse IgG1 | TAP2.17 | Abcam | N/A |
| CD141 | 1 µg/ml | rabbit Mab | EPR4051 | Abcam | 2201805 |
| MYC | 1 µg/ml | rabbit Mab | EP121 | Sigma Aldrich | N/A |
| FOXP3 | 1 µg/ml | mouse IgG1 | 236A/E7 | Abcam | 445284 |
| MX1 | 1 µg/ml | Rabbit | Abcam | 10678925 | |
| LAG3 | 1 µg/ml | mouse IgG1 | 11E3 | Abcam | 776102 |
| PD-L1 | 1 µg/ml | rabbit Mab | 28–8 | Abcam/Epitomics | 2687878 |
| CD1a | 1 µg/ml | Rb mAb | EP3622 | Abcam/Epitomics | 626957 |
| CD123 | 1 µg/ml | mouse IgG2b | NCL-L-CD123 | Leica-Microystem/Novocastra | 10555271 |
| Phospho-Stat1 | 1 µg/ml | rabbit Mab | 58D6 | Cell Signaling | 561284 |
| CD20 | 1 µg/ml | mouse IgG2a | L26 | Dako | 782024 |
| CD1a | 1 µg/ml | mouse IgG1 | O10 | Dako | N/A |
| CD1c | 1 µg/ml | mouse IgG1 | 2D4 | Dako | 2623049 |
| PRDM1 | 1 µg/ml | rat | 6D3 | Dako | 628168 |
| S100AB | 1 µg/ml | rabbit | Dako | N/A | |
| CD56 | 1 µg/ml | mouse IgG1 | 123C3.D5 | Neomarkers | 627127 |
| Ki-67 | 2 µg/ml | mouse IgG2a | UMAB107 | Origene | 2629145 |
| Lysozyme | 1 µg/ml | rabbit | Origene | 1004766 | |
| PD-1 | 1 µg/ml | mouse IgG2a | UMAB197 | Origene | 2629198 |
| TIM3 | 1 µg/ml | goat | R and D | 355235 | |
| CXCL13 | 1 µg/ml | mouse IgG1 | 53610 | R and D | 2086049 |
| OX40 | 1 µg/ml | mouse IgG1 | Ber-ACT35 | Santa Cruz | 626897 |
| IRF4 | 1 µg/ml | goat | M-17 | Santa Cruz | 2127145 |
| cMAF | 1 µg/ml | rabbit | M-153 | Santa Cruz | 638562 |
| BCL6 | 1 µg/ml | rabbit | N3 | SCBT | 1158074 |
| CD16 | 1 µg/ml | mouse IgG2a | 2H7 | SCBT | 563508 |
| CD68 | 1 µg/ml | mouse IgG3 | PGM1 | Thermo Fisher | 10979558 |
| p16 | 1 µg/ml | mouse IgG2a | JC8 | SCBT | 785018 |
| MelanA | 1 µg/ml | rabbit Mab | A19-P | NovusBio | 1987285 |
| podoplanin | 1 µg/ml | rat IgG2a | NZ-1.2 | Sigma Aldrich | 10920577 |
| CD69 | 1 µg/ml | rabbit | Sigma Aldrich | 2681157 | |
| CD3 | 1 µg/ml | rabbit | Sigma Aldrich | 2335677 | |
| GBP1 | 1 µg/ml | rat | 4D10 | Sigma Aldrich | 828964 |
| Langerin | 1 µg/ml | rabbit | Sigma Aldrich | 1078453 | |
| IRF8 | 1 µg/ml | rabbit | Sigma Aldrich | 1851904 | |
| CD8 | 1 µg/ml | rabbit Mab | SP16 | Thermo Fisher | 627211 |
| CD138 | 1 µg/ml | mouse IgG1 | MI-15 | Thermo Fisher | 10987019 |
Additional files
-
Source code 1
Code for all the analyses included in the paper.
- https://cdn.elifesciences.org/articles/53008/elife-53008-code1-v2.zip
-
Source data 1
Image metadata.
- https://cdn.elifesciences.org/articles/53008/elife-53008-data1-v2.zip
-
Source data 2
Annotated single cell data and patient survival.
- https://cdn.elifesciences.org/articles/53008/elife-53008-data2-v2.zip
-
Source data 3
Correlation histopathological data and lymphocyte features.
- https://cdn.elifesciences.org/articles/53008/elife-53008-data3-v2.zip
-
Supplementary file 1
Contingency table between the cell labels given by Tirosh et al. (2016) and the predicted cell type from the LM22 signatures from Cibersort.
The highest spearman correlation was obtained for the predictions.
- https://cdn.elifesciences.org/articles/53008/elife-53008-supp1-v2.xlsx
-
Supplementary file 2
Transcription factors selected to represent the proteins used to calculate the activation score.
- https://cdn.elifesciences.org/articles/53008/elife-53008-supp2-v2.xlsx
-
Supplementary file 3
Gene expression signatures for the T.cells.CD8.Active and T.cells.CD8.Exhausted cell types.
- https://cdn.elifesciences.org/articles/53008/elife-53008-supp3-v2.xlsx
-
Supplementary file 4
Relative percentages of T.cells.CD8.Active and T.cells.CD8.Exhausted cell types in the TCGA-SKCM dataset (stages I and II).
- https://cdn.elifesciences.org/articles/53008/elife-53008-supp4-v2.xlsx
-
Supplementary file 5
Justification of the statistical test chosen for each analysis.
- https://cdn.elifesciences.org/articles/53008/elife-53008-supp5-v2.xlsx
-
Supplementary file 6
Patient metadata.
- https://cdn.elifesciences.org/articles/53008/elife-53008-supp6-v2.xlsx
-
Transparent reporting form
- https://cdn.elifesciences.org/articles/53008/elife-53008-transrepform-v2.docx
Download links
A two-part list of links to download the article, or parts of the article, in various formats.
Downloads (link to download the article as PDF)
Open citations (links to open the citations from this article in various online reference manager services)
Cite this article (links to download the citations from this article in formats compatible with various reference manager tools)
Functional heterogeneity of lymphocytic patterns in primary melanoma dissected through single-cell multiplexing
eLife 9:e53008.
https://doi.org/10.7554/eLife.53008


